Mayonnaise Market Report By Type (Traditional Mayonnaise , Low-Fat/Light Mayonnaise , Organic Mayonnaise , Vegan Mayonnaise , Flavored Mayonnaise), By Raw Material (Egg , Egg-Less , Others), By Packaging (Jars , Sachets , Bottles , Others), By Distribution Channel (Supermarkets And Hypermarkets , Department Stores , Foodservice Providers , Online Stores), By Region and Companies - Industry Segment Outlook, Market Assessment, Competition Scenario, Trends and Forecast 2024-2033
-
6959
-
April 2024
-
280
-


-
This report was compiled by Shreyas Rokade Shreyas Rokade is a seasoned Research Analyst with CMFE, bringing extensive expertise in market research and consulting, with a strong background in Chemical Engineering. Correspondence Team Lead-CMFE Linkedin | Detailed Market research Methodology Our methodology involves a mix of primary research, including interviews with leading mental health experts, and secondary research from reputable medical journals and databases. View Detailed Methodology Page
-
Quick Navigation
Report Overview
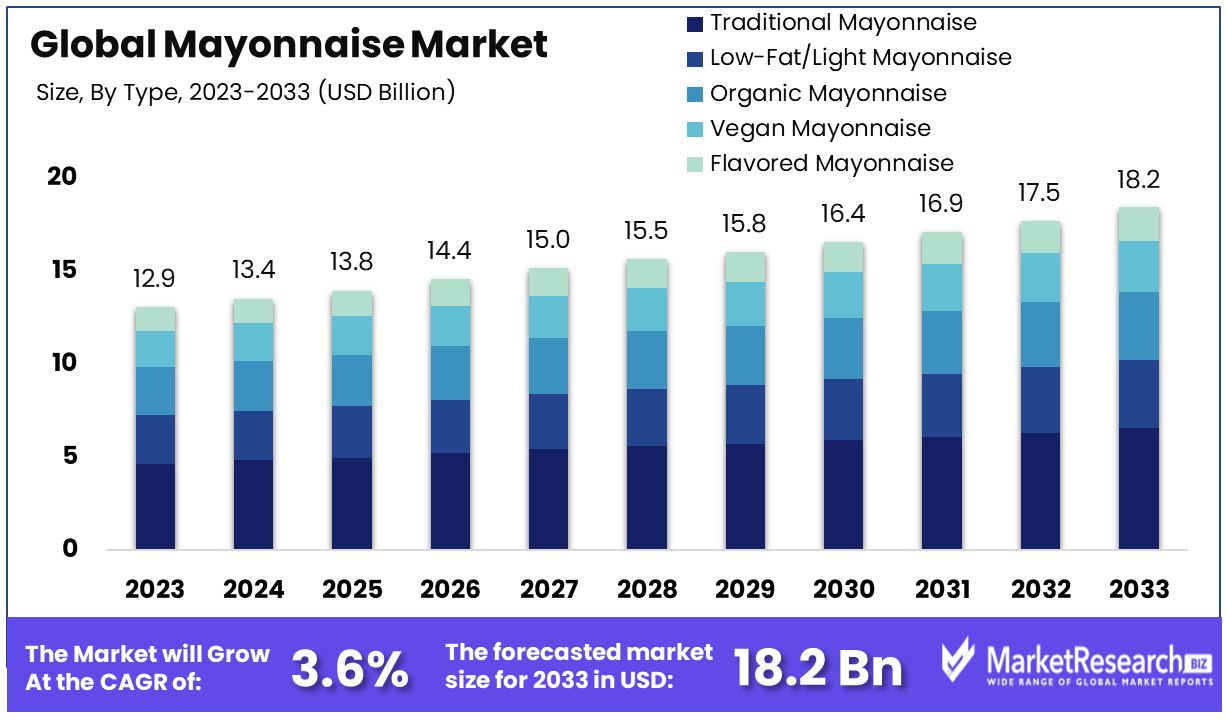
The Global Mayonnaise Market size is expected to be worth around USD 18.2 Billion by 2033, from USD 12.9 Billion in 2023, growing at a CAGR of 3.60% during the forecast period from 2024 to 2033.
Customers' changing preferences and the surge in demand for the production of mayonnaise in western countries are some of the main driving factors for the mayonnaise market. Earlier, in the traditional way, mayonnaise was made up of egg yolk and vinegar. Mustard and other spices were the add-ons to enhance the taste of the mayonnaise.
According to the Food and Drug Association, mayonnaise should not contain less than 65% vegetable oil. Mayonnaise has acetic acid in vinegar that makes the proteins covering the emulsion droplets intermingle, which results in a gel-type emulsion. Mayonnaise should be kept in the refrigerator or at room temperature. Home-made mayonnaise spoils faster than commercial or ready-made mayonnaise.
Consumers are more health-conscious and are inclined towards ready-to-eat mayonnaise, which can be conserved for a longer period of time. Commercial manufacturers use pasteurized egg yolks and preservatives. If the product is sealed, it can be stored at any room temperature, but once it is opened, it should be preserved in cool areas or refrigerators.
The commercial mayonnaise can be used for 3 months after the manufacturer's death. Manufacturers opt for the most convenient use-before date in order to avoid spoilage. These ready-to-use mayonnaises can be preserved for more than 90 days, and they have a longer shelf life.
Mayonnaise is a popular element that has become a part of several gastronomies. Undoubtedly, mayonnaise is a great taste enhancer, but it also has many health benefits. Hair loss is one of the major concerns among individuals.
According to Medihair, around 85% of men and 33% of women are suffering from hair loss, and male individuals who are suffering from androgenetic alopecia lose 95% of their hair. The majority of American men lose 65% of their hair by the age of 35; by reaching the age of 85%, many men show signs of thinning hair.
At the age of 21, men of different ages witness 25% hair loss. The hair loss disorder Alopecia Areata affects 2 individuals out of every 1000. More than 50% of women are witnessing hair loss at the age of 50 as well as the post-menopause period.
Mayonnaise has omega 3 and 2, which help add strength to the hair follicles. It can be used as a conditioner or a hair mask to treat weak and dull hair. Adding mayonnaise provides shine and keeps the hair healthy. Mayonnaise has several health advantages, which will increase customer demand and help in market expansion in the coming years.
Key Takeaways
- Market Value: The Global Mayonnaise Market is projected to reach approximately USD 18.2 Billion by 2033, showing significant growth from USD 12.9 Billion in 2023, with a CAGR of 3.60% during the forecast period from 2024 to 2033.
- Dominant Segments:
- Type Analysis: Traditional mayonnaise maintains its dominance, but low-fat, organic, vegan, and flavored varieties are gaining traction.
- Raw Material Analysis: Egg-based mayonnaise remains prevalent, but egg-less and alternative raw material varieties are growing in popularity, catering to the increasing demand for vegan and plant-based products.
- Packaging Analysis: Bottled mayonnaise emerges as the preferred packaging choice, offering convenience and durability.
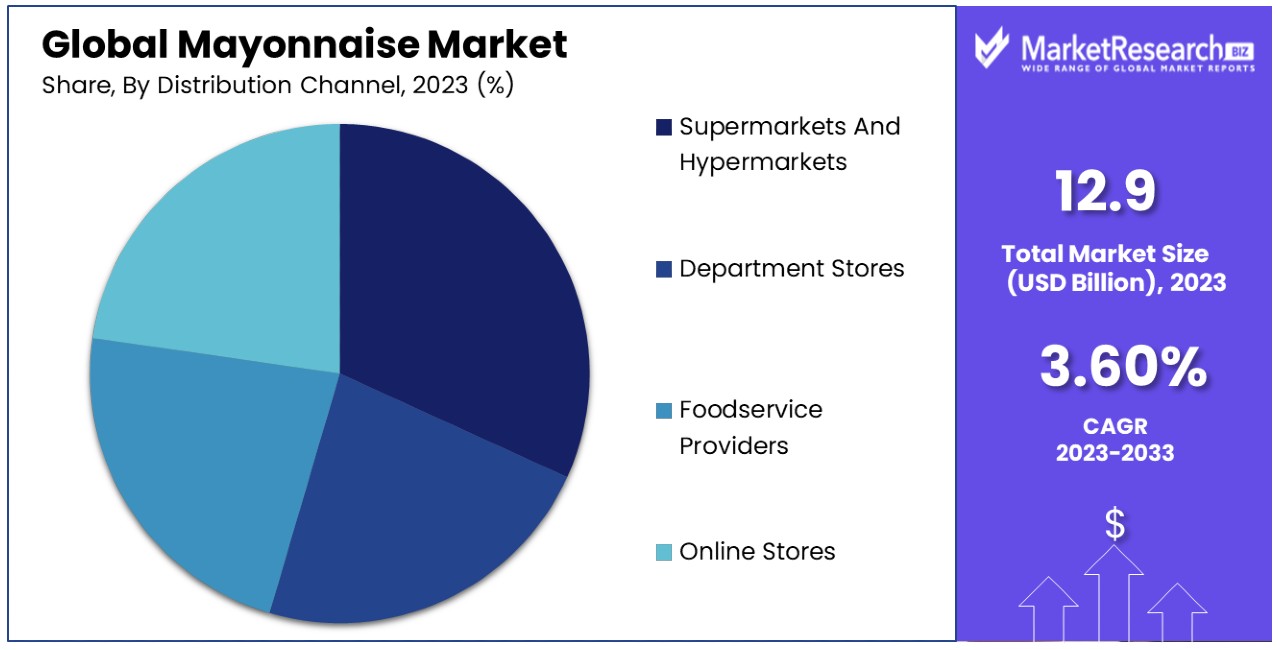
- Distribution Channel Analysis: Supermarkets and hypermarkets lead mayonnaise distribution, offering a wide variety of brands and types.
- Regional Insights:
- Europe: Dominates the market with a 35% share, driven by traditional consumption patterns and a growing interest in flavored and premium mayonnaise varieties.
- North America: Holds a significant market share of approximately 30%, fueled by traditional consumption patterns and the rising popularity of flavored and premium mayonnaise varieties.
- Analyst Viewpoint: Analysts anticipate continued growth in the mayonnaise market, driven by consumer demand for healthier, more diverse, and convenient options. Innovation in product types, raw materials, packaging, and distribution channels will play a crucial role in meeting evolving consumer preferences and sustaining market growth.
Driving Factors
Convenience Foods Elevate Mayonnaise Market Growth
The rise of convenience foods and ready-to-eat meals marks a pivotal factor in the expansion of the mayonnaise market. With the modern consumer's lifestyle becoming increasingly hectic, there's a notable shift towards food options that offer ease and quick preparation. Mayonnaise, known for its versatility, plays a significant role in this trend. It's a favored ingredient in sandwiches, salads, and a variety of dressings and dips, catering to the demand for swift meal solutions.
Supermarkets, cafes, and fast-food chains have tapped into this trend by offering a range of mayonnaise-infused products, significantly broadening its market reach. The presence of mayonnaise in convenience foods not only aligns with the consumers' preference for time-saving meal options but also underlines the condiment's adaptability across various cuisines and dietary habits. This synergy between mayonnaise and the fast-paced lifestyle of consumers has propelled the market forward, with statistics indicating a steady rise in the consumption of ready-to-eat foods incorporating mayonnaise.
Flavored Varieties Spark Mayonnaise Market Expansion
Consumer inclination towards diverse and enriched flavor profiles has led to a surge in the demand for flavored and specialty mayonnaise. This shift is characterized by a growing appetite for innovative taste experiences, driving brands to expand their product lines with unique mayonnaise variants such as garlic, chipotle, and sriracha. Hellmann's, among other brands, has capitalized on this trend by introducing a variety of flavored mayonnaise options, successfully catering to the evolving taste preferences of consumers.
This diversification not only broadens the consumer base but also enhances the culinary versatility of mayonnaise, enabling its application in a wider range of dishes and cuisines. The introduction of flavored mayonnaise has revitalized the market, inviting both culinary enthusiasts and the general populace to explore new taste dimensions. As brands continue to innovate, the flavored mayonnaise segment is expected to witness substantial growth, further propelled by the consumers' continuous pursuit of novel and diverse food experiences.
Foodservice Industry Fuels Mayonnaise Market Growth
The foodservice sector stands as a significant catalyst for the mayonnaise market's expansion. Restaurants, cafes, and catering services constitute a major segment of mayonnaise consumers. The ongoing growth of the foodservice industry, fueled by urbanization and evolving consumer lifestyles, has consequently escalated the demand for mayonnaise.
Utilized extensively as a base for sauces, dressings, and other condiments, mayonnaise's utility in professional kitchens underscores its indispensability. This trend not only amplifies the consumption of mayonnaise in the foodservice industry but also influences product innovation and supply chain dynamics. As the foodservice sector continues to thrive, the interconnectedness between industry growth and mayonnaise demand becomes increasingly pronounced, signaling a positive outlook for the mayonnaise market in the foreseeable future.
Plant-Based Trends Propel Mayonnaise Market Forward
The ascending popularity of plant-based and vegan diets heralds a new growth avenue for the mayonnaise market through the demand for egg-free and dairy-free alternatives. In response to the growing consumer base seeking plant-based options, brands have introduced vegan mayonnaise varieties crafted from ingredients like soy, pea protein, and aquafaba.
Noteworthy brands such as Sir Kensington's and Follow Your Heart have been at the forefront, offering vegan mayonnaise that caters to both ethical and dietary preferences. This segment's growth is reflective of a broader consumer shift towards sustainable and animal-friendly products, positioning vegan mayonnaise as a pivotal player in the market's expansion. The emergence of plant-based mayonnaise not only caters to a niche but growing market segment but also aligns with global trends of health consciousness and environmental stewardship, predicting a sustained increase in demand and market diversity.
Restraining Factors
Health Concerns Restrain Mayonnaise Market Growth
The perception of mayonnaise as an unhealthy condiment significantly impacts its market growth. This perception stems from its high fat and calorie content, which aligns poorly with the rising health consciousness among consumers globally. As a response, a segment of the consumer base is shifting towards low-fat, fat-free, or alternative condiments that are perceived as healthier.
This shift is not just a matter of personal health choices but reflects a broader trend towards wellness and nutrition awareness in dietary habits. While mayonnaise remains a popular choice for many, the increasing prioritization of health over convenience among consumers could limit the market's potential for growth. The trend suggests a growing niche for health-oriented alternatives, potentially diminishing mayonnaise's dominance in the condiment space.
Competition from Alternatives Restrains Mayonnaise Market Growth
The mayonnaise market is navigating a competitive landscape, with a variety of alternative condiments and dressings vying for consumer preference. Mustard, ketchup, salad dressings, and plant-based options like hummus and guacamole present viable substitutes for mayonnaise, catering to diverse taste preferences and dietary trends.
This competition is intensified by the evolving consumer palette and the growing demand for dietary diversity, which sees individuals exploring beyond traditional choices. The inclination towards these alternatives is partly driven by health considerations and the desire for novelty, significantly restraining mayonnaise market growth. As consumers become more experimental with their food choices, the pressure on mayonnaise as a staple condiment increases, challenging its market position and growth trajectory.
Type Analysis
Traditional Mayonnaise Maintains Market Dominance, but Low-Fat, Organic, Vegan, and Flavored Varieties Gain Traction
In the diverse landscape of the mayonnaise market, the segmentation by type plays a crucial role in understanding consumer preferences and market dynamics. Among these segments, traditional mayonnaise has historically dominated due to its widespread use in various cuisines and dishes worldwide. However, evolving dietary trends and increased health consciousness among consumers have led to significant growth in other sub-segments, notably low-fat/light mayonnaise, organic mayonnaise, vegan mayonnaise, and flavored mayonnaise.
Traditional mayonnaise, known for its rich taste and creamy texture, remains a staple in households and food services. Its dominance is attributed to its established presence and versatility. Yet, the surge in health awareness has spurred demand for low-fat/light mayonnaise. This sub-segment caters to consumers seeking to reduce calorie intake without sacrificing taste, reflecting a compromise between health and flavor preferences.
Organic mayonnaise is gaining traction, driven by the global trend towards organic and natural food products. Consumers are increasingly mindful of food sourcing and ingredients, positioning organic mayonnaise as a preferred choice for those looking to avoid synthetic additives and GMOs. This segment's growth is supported by the broader organic food movement, emphasizing sustainability and health.
The rise of veganism and plant-based diets has significantly impacted the mayonnaise market, leading to the emergence and rapid growth of vegan mayonnaise. This sub-segment offers an animal-free alternative to traditional mayonnaise, appealing to vegans, vegetarians, and health-conscious individuals. Innovations in plant-based ingredients have enabled the production of vegan mayonnaise that closely mimics the taste and texture of its traditional counterpart, facilitating its acceptance among a wider audience.
Raw Material Analysis
Egg-Based Mayonnaise Holds Strong Market Presence, but Egg-Less and Alternative Raw Material Varieties See Growth
The mayonnaise market's segmentation by raw material offers insight into consumer preferences and industry trends, with egg-based mayonnaise traditionally dominating this segment. However, the market has seen growth in egg-less and other alternative raw material-based mayonnaises, reflecting shifts in dietary habits and ethical considerations.
Egg-based mayonnaise has been the cornerstone of the market, prized for its creamy texture and distinct taste. Its widespread acceptance is due to its culinary versatility, serving as a key ingredient in numerous dishes across various cuisines. The segment's dominance is underpinned by traditional consumption patterns and the product's established presence in the market. However, health concerns over cholesterol and dietary restrictions have led some consumers to explore alternatives.
Egg-less mayonnaise is emerging as a strong contender, driven by the growing demand for vegan and plant-based diets. This sub-segment caters to consumers seeking to avoid animal products for health, ethical, or environmental reasons. Innovations in food technology have improved the taste and texture of egg-less mayonnaise, making it a viable alternative for those accustomed to traditional mayonnaise. The growth of this segment is indicative of the broader trend towards plant-based eating and the inclusivity of dietary preferences in product offerings.
The "others" category encompasses mayonnaises made from alternative raw materials, including those designed for specific dietary needs or preferences, such as low-fat, soy-based, or pea protein-based mayonnaises. This segment's growth is fueled by continuous innovation in food processing and an increasing emphasis on health and wellness in consumer choices. These alternatives not only offer diversity in terms of dietary accommodation but also contribute to the market's adaptability and resilience, catering to a wider range of consumer needs.
Packaging Analysis
Bottled Mayonnaise Emerges as Preferred Packaging Choice, Leading Market, While Innovative Solutions Gain Ground
The packaging of mayonnaise plays a crucial role in consumer preference and market dynamics. Among the various packaging options—jars, sachets, bottles, and others—bottles have emerged as the dominant sub-segment in the mayonnaise market. This preference can be attributed to the convenience of use and storage, durability, and the aesthetic appeal of bottles, which enhance the product's visibility on shelves. Bottled mayonnaise is particularly favored in households and by foodservice providers for its ease of dispensing and portion control.
Jars, traditionally the most common packaging for mayonnaise, continue to hold significant market share, especially among consumers who prioritize the perception of quality and value offered by glass packaging. Sachets have gained popularity in the fast-food sector and among on-the-go consumers due to their convenience and portion size, catering to the demand for single-use, travel-friendly options.
The "others" category includes innovative packaging solutions like squeeze tubes and dispenser pouches, which are gaining traction for their convenience and waste reduction benefits. These alternative packaging formats are appealing to environmentally conscious consumers and those seeking novel, user-friendly options.
As sustainability concerns grow, packaging innovation focuses on reducing environmental impact, leading to the development of recyclable and biodegradable packaging solutions within the mayonnaise market. This shift not only reflects consumer demand for more eco-friendly products but also aligns with global sustainability trends, potentially reshaping packaging preferences in the future.
Distribution Channel Analysis
Supermarkets and Hypermarkets Lead Mayonnaise Distribution, with Online Stores Witnessing Rapid Growth
The distribution channel is a critical factor in the accessibility and availability of mayonnaise to consumers. Among the various channels—supermarkets and hypermarkets, department stores, foodservice providers, and online stores—supermarkets and hypermarkets have emerged as the leading distribution channel for mayonnaise.
Their dominance is attributed to the wide variety of mayonnaise brands and types available, competitive pricing, and the convenience of one-stop shopping for consumers. These outlets cater to a broad consumer base, offering both national and international brands, which has significantly contributed to their market leadership in the distribution of mayonnaise.
Department stores, while offering mayonnaise, typically have a more limited selection compared to supermarkets and hypermarkets. Their focus tends to be on higher-end or specialty products, catering to a niche market segment.
Foodservice providers, including restaurants, cafes, and catering services, represent a substantial market for bulk mayonnaise purchases. This segment's demand is driven by the use of mayonnaise as a key ingredient in various dishes and menu items, underscoring the importance of foodservice providers as a major consumer group within the market.
Online stores have witnessed remarkable growth as a distribution channel for mayonnaise, propelled by the increasing consumer preference for online shopping. This channel offers convenience, a wide selection of products, and the ability to compare prices and products easily. The growth of online sales is further supported by improvements in e-commerce logistics, including faster delivery times and enhanced online shopping experiences, making it a rapidly expanding segment in the distribution of mayonnaise.
Key Market Segments
By Type
- Traditional Mayonnaise
- Low-Fat/Light Mayonnaise
- Organic Mayonnaise
- Vegan Mayonnaise
- Flavored Mayonnaise
By Raw Material
- Egg
- Egg-Less
- Others
By Packaging
- Jars
- Sachets
- Bottles
- Others
By Distribution Channel
- Supermarkets And Hypermarkets
- Department Stores
- Foodservice Providers
- Online Stores
Growth Opportunities
Product Innovation and Premiumization Offers Growth Opportunity
The mayonnaise market is ripe for innovation and premiumization, presenting a significant avenue for growth. Consumers' evolving tastes and increasing demand for high-quality, unique food products have opened the door for brands to explore new frontiers in product development. Introducing premium mayonnaise varieties that utilize superior ingredients, such as avocado oil or truffle oil, and incorporate distinctive flavors and herbs, caters to a segment of the market seeking gourmet and artisanal options.
These premium products not only satisfy the palate of discerning consumers but also enable brands to establish a unique market position and command higher price points. The trend towards premiumization is supported by consumer willingness to pay more for products that promise an enhanced or unique experience, indicating a lucrative opportunity for growth in the mayonnaise market. Brands that capitalize on this trend through innovation can differentiate themselves and capture a more affluent consumer base, driving revenue growth and market expansion.
Leveraging E-Commerce and Direct-to-Consumer Channels Offers Growth Opportunity
The surge in e-commerce and direct-to-consumer (D2C) sales channels offers a significant growth opportunity for mayonnaise brands. In an era where digital presence is crucial, establishing a robust online platform enables brands to reach a wider audience, offer personalized shopping experiences, and gather valuable consumer insights. E-commerce platforms provide a seamless shopping experience, allowing consumers to explore and purchase a wide range of mayonnaise products from the comfort of their homes.
Direct-to-consumer channels further enhance brand-consumer engagement by offering exclusive products, promotions, and direct feedback mechanisms. By leveraging these digital channels, mayonnaise brands can bypass traditional retail intermediaries, potentially increasing profit margins and gaining direct access to their customer base. The growth of e-commerce and D2C channels is underpinned by changing consumer behaviors, with an increasing number of shoppers preferring online purchases for convenience and variety. Mayonnaise brands that effectively utilize these digital avenues can expand their market reach, improve customer loyalty, and drive significant growth in the competitive mayonnaise market.
Trending Factors
Clean Labels and Natural Ingredients Are Trending Factors
The mayonnaise market is witnessing a significant shift towards clean labels and natural ingredients, a trend driven by consumers' increasing focus on health and sustainability. This movement is not merely a niche interest but a mainstream demand, as more shoppers scrutinize product labels for simple, recognizable ingredients.
Brands like Sir Kensington's and Primal Kitchen are leading this trend by offering mayonnaise made from cage-free eggs and avocado oil, setting a high standard for product transparency and quality. This shift towards clean labels reflects a broader consumer preference for products free from artificial preservatives, colors, or flavors, appealing to a growing segment of health-conscious individuals. The popularity of these products underscores a market-wide transition, where clean and natural ingredients become a critical competitive advantage, signaling a long-term trend that could redefine consumer expectations and product formulations in the mayonnaise market.
Demand for Functional and Fortified Mayonnaise Are Trending Factors
The burgeoning interest in functional and fortified foods has found its way into the mayonnaise market, driven by consumers' heightened awareness of the links between diet and health. This trend presents an opportunity for brands to innovate by introducing mayonnaise varieties enriched with health-boosting ingredients, such as probiotics, vitamins, and omega-3 fatty acids.
Examples include mayonnaise fortified with turmeric, recognized for its anti-inflammatory benefits, and varieties enhanced with olive oil, known for its heart-health advantages. This evolution towards functional and fortified mayonnaise is more than a fad; it represents a significant shift in consumer preferences towards products that offer additional health benefits beyond basic nutrition. As brands continue to explore and develop these enriched offerings, the demand for functional and fortified mayonnaise is expected to grow, illustrating the market's potential for expansion through innovation that aligns with consumer health trends.
Regional Analysis
Europe Dominates with 35% Market Share
Europe stands as a leader in the mayonnaise market, holding a substantial 35% share. This dominance is largely attributed to the deep-rooted culinary traditions that favor mayonnaise as a staple condiment across various European cuisines. The preference for mayonnaise in diets, combined with a high demand for diverse and premium varieties, drives the region's high market share.
The market dynamics in Europe are influenced by a strong preference for clean labels and natural ingredients, aligning with the broader consumer trend towards health and sustainability. European consumers' discerning tastes have spurred mayonnaise brands to innovate, offering a range of products from organic to vegan options. Additionally, Europe's stringent food quality and safety regulations ensure high standards, further bolstering consumer trust and demand.
Europe's influence in the global mayonnaise market is poised to remain significant. The region's commitment to quality, coupled with ongoing product innovation and adaptation to consumer health trends, predicts a stable or even growing market share. As European consumers continue to demand healthier, more sustainable food options, the market is expected to evolve, potentially setting trends for the global industry.
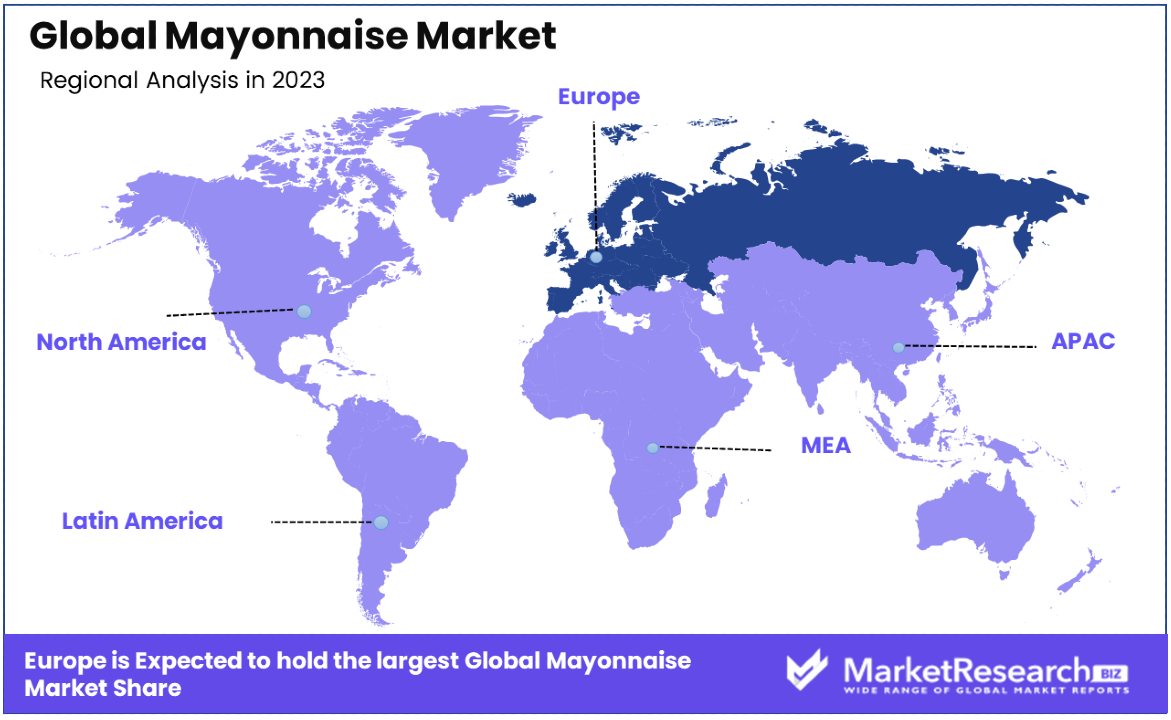
North America: With a market share of approximately 30%, North America stands as a significant player in the global mayonnaise market. The region's demand is driven by traditional consumption patterns and a growing interest in flavored and premium mayonnaise varieties.
Asia Pacific: The Asia Pacific region, holding around 20% of the market share, is experiencing rapid growth due to changing dietary habits and increased exposure to Western cuisines, making it a key area for market expansion.
Middle East & Africa: Representing a smaller share of the market at 10%, the Middle East & Africa region is witnessing gradual growth. The increasing urbanization and a young population are factors contributing to this rise, with a notable interest in new food products including mayonnaise.
Latin America: Latin America accounts for 5% of the global mayonnaise market. Despite being the smallest market, the region shows potential for growth driven by a strong culinary culture that includes mayonnaise as a key ingredient in local dishes.
Key Regions and Countries
- North America
- The US
- Canada
- Mexico
- Western Europe
- Germany
- France
- The UK
- Spain
- Italy
- Portugal
- Ireland
- Austria
- Switzerland
- Benelux
- Nordic
- Rest of Western Europe
- Eastern Europe
- Russia
- Poland
- The Czech Republic
- Greece
- Rest of Eastern Europe
- APAC
- China
- Japan
- South Korea
- India
- Australia & New Zealand
- Indonesia
- Malaysia
- Philippines
- Singapore
- Thailand
- Vietnam
- Rest of APAC
- Latin America
- Brazil
- Colombia
- Chile
- Argentina
- Costa Rica
- Rest of Latin America
- Middle East & Africa
- Algeria
- Egypt
- Israel
- Kuwait
- Nigeria
- Saudi Arabia
- South Africa
- Turkey
- United Arab Emirates
- Rest of MEA
Key Players Analysis
In the Mayonnaise Market, several companies stand out for their significant impact and strategic positioning.
McCormick & Company, Inc., Kraft Heinz Company, and Unilever Plc: These industry giants dominate the market with their wide distribution networks and well-established brands. They wield considerable influence due to their extensive product lines and strong consumer trust.
Marina Foods Inc., Paradise Food Ltd, and Kenko Mayonnaise: These players are emerging as key contenders by targeting specific market niches and offering innovative products. While they may not have the same market share as the industry giants, their focused approach and unique offerings give them a competitive edge.
Mondelez International and Conagra Brands Inc.: Although mayonnaise is just one component of their diverse portfolios, these companies still hold a significant position in the market. Their established brands and broad product ranges contribute to their moderate influence in the mayonnaise segment.
Miracle Whip and American Garden Products Inc.: While recognized in the market, these brands have a more niche positioning or limited distribution compared to the industry leaders. As a result, their impact on the overall market is relatively lower.
Market Key Players
- McCormick & Company, Inc.
- Kraft Heinz Company
- Marina Foods Inc.
- Unilever Plc
- Paradise Food Ltd
- Kenko Mayonnaise
- Mondelez International
- Miracle Whip
- Conagra Brands Inc.
- American Garden Products Inc.
Recent Developments
- On April 2024, Unilever announced an investment of 80 million reais ($16.2 million) in expanding its production of Hellmann's mayonnaise at a facility in Brazil. The expansion includes the addition of a new line to Unilever's Pouso Alegre plant, the company's largest food operation in Latin America.
- On April 2024, Hellmann's Mayonnaise made its fourth consecutive appearance during the Big Game with a 30-second TV commercial. The brand's commitment to being a significant part of game day moments and addressing food waste was highlighted in this year's commercial.
- On February 1, 2024, Eat Just, a California-based company, reintroduced its popular eggless mayo, Just Mayo, after a four-year hiatus. This comeback also includes Just Ranch, offering two flavors (Original and Chipotle) in the refrigerated section at Whole Foods Markets.
Report Scope
Report Features Description Market Value (2023) USD 12.9 Billion Forecast Revenue (2033) USD 18.2 Billion CAGR (2024-2033) 3.60% Base Year for Estimation 2023 Historic Period 2018-2023 Forecast Period 2024-2033 Report Coverage Revenue Forecast, Market Dynamics, Competitive Landscape, Recent Developments Segments Covered By Type (Traditional Mayonnaise , Low-Fat/Light Mayonnaise , Organic Mayonnaise , Vegan Mayonnaise , Flavored Mayonnaise), By Raw Material (Egg , Egg-Less , Others), By Packaging (Jars , Sachets , Bottles , Others), By Distribution Channel (Supermarkets And Hypermarkets , Department Stores , Foodservice Providers , Online Stores) Regional Analysis North America - The US, Canada, & Mexico; Western Europe - Germany, France, The UK, Spain, Italy, Portugal, Ireland, Austria, Switzerland, Benelux, Nordic, & Rest of Western Europe; Eastern Europe - Russia, Poland, The Czech Republic, Greece, & Rest of Eastern Europe; APAC - China, Japan, South Korea, India, Australia & New Zealand, Indonesia, Malaysia, Philippines, Singapore, Thailand, Vietnam, & Rest of APAC; Latin America - Brazil, Colombia, Chile, Argentina, Costa Rica, & Rest of Latin America; Middle East & Africa - Algeria, Egypt, Israel, Kuwait, Nigeria, Saudi Arabia, South Africa, Turkey, United Arab Emirates, & Rest of MEA Competitive Landscape McCormick & Company, Inc., Kraft Heinz Company, Marina Foods Inc., Unilever Plc, Paradise Food Ltd, Kenko Mayonnaise, Mondelez International, Miracle Whip, Conagra Brands Inc., American Garden Products Inc. Customization Scope Customization for segments, region/country-level will be provided. Moreover, additional customization can be done based on the requirements. Purchase Options We have three licenses to opt for: Single User License, Multi-User License (Up to 5 Users), Corporate Use License (Unlimited User and Printable PDF) -
- 1. Executive Summary
- 1.1. Definition
- 1.2. Taxonomy
- 1.3. Research Scope
- 1.4. Key Analysis
- 1.5. Key Findings by Major Segments
- 1.6. Top strategies by Major Players
- 2. Global Mayonnaise Market Overview
- 2.1. Mayonnaise Market Dynamics
- 2.1.1. Drivers
- 2.1.2. Opportunities
- 2.1.3. Restraints
- 2.1.4. Challenges
- 2.2. Macro-economic Factors
- 2.3. Regulatory Framework
- 2.4. Market Investment Feasibility Index
- 2.5. PEST Analysis
- 2.6. PORTER’S Five Force Analysis
- 2.7. Drivers & Restraints Impact Analysis
- 2.8. Industry Chain Analysis
- 2.9. Cost Structure Analysis
- 2.10. Marketing Strategy
- 2.11. Russia-Ukraine War Impact Analysis
- 2.12. Opportunity Map Analysis
- 2.13. Market Competition Scenario Analysis
- 2.14. Product Life Cycle Analysis
- 2.15. Opportunity Orbits
- 2.16. Manufacturer Intensity Map
- 2.17. Major Companies sales by Value & Volume
- 2.1. Mayonnaise Market Dynamics
- 3. Global Mayonnaise Market Analysis, Opportunity and Forecast, 2016-2032
- 3.1. Global Mayonnaise Market Analysis, 2016-2021
- 3.2. Global Mayonnaise Market Opportunity and Forecast, 2023-2032
- 3.3. Global Mayonnaise Market Analysis, Opportunity and Forecast, By Type, 2016-2032
- 3.3.1. Global Mayonnaise Market Analysis by Type: Introduction
- 3.3.2. Market Size Absolute $ Opportunity Analysis and Forecast, By Type, 2016-2032
- 3.3.3. Traditional Mayonnaise
- 3.3.4. Low-Fat/Light Mayonnaise
- 3.3.5. Organic Mayonnaise
- 3.3.6. Vegan Mayonnaise
- 3.3.7. Flavored Mayonnaise
- 3.4. Global Mayonnaise Market Analysis, Opportunity and Forecast, By Raw Material, 2016-2032
- 3.4.1. Global Mayonnaise Market Analysis by Raw Material: Introduction
- 3.4.2. Market Size Absolute $ Opportunity Analysis and Forecast, By Raw Material, 2016-2032
- 3.4.3. Egg
- 3.4.4. Egg-Less
- 3.4.5. Others
- 3.5. Global Mayonnaise Market Analysis, Opportunity and Forecast, By Packaging, 2016-2032
- 3.5.1. Global Mayonnaise Market Analysis by Packaging: Introduction
- 3.5.2. Market Size Absolute $ Opportunity Analysis and Forecast, By Packaging, 2016-2032
- 3.5.3. Jars
- 3.5.4. Sachets
- 3.5.5. Bottles
- 3.5.6. Others
- 3.6. Global Mayonnaise Market Analysis, Opportunity and Forecast, By Distribution Channel, 2016-2032
- 3.6.1. Global Mayonnaise Market Analysis by Distribution Channel: Introduction
- 3.6.2. Market Size Absolute $ Opportunity Analysis and Forecast, By Distribution Channel, 2016-2032
- 3.6.3. Supermarkets And Hypermarkets
- 3.6.4. Department Stores
- 3.6.5. Foodservice Providers
- 3.6.6. Online Stores
- 4. North America Mayonnaise Market Analysis, Opportunity and Forecast, 2016-2032
- 4.1. North America Mayonnaise Market Analysis, 2016-2021
- 4.2. North America Mayonnaise Market Opportunity and Forecast, 2023-2032
- 4.3. North America Mayonnaise Market Analysis, Opportunity and Forecast, By Type, 2016-2032
- 4.3.1. North America Mayonnaise Market Analysis by Type: Introduction
- 4.3.2. Market Size Absolute $ Opportunity Analysis and Forecast, By Type, 2016-2032
- 4.3.3. Traditional Mayonnaise
- 4.3.4. Low-Fat/Light Mayonnaise
- 4.3.5. Organic Mayonnaise
- 4.3.6. Vegan Mayonnaise
- 4.3.7. Flavored Mayonnaise
- 4.4. North America Mayonnaise Market Analysis, Opportunity and Forecast, By Raw Material, 2016-2032
- 4.4.1. North America Mayonnaise Market Analysis by Raw Material: Introduction
- 4.4.2. Market Size Absolute $ Opportunity Analysis and Forecast, By Raw Material, 2016-2032
- 4.4.3. Egg
- 4.4.4. Egg-Less
- 4.4.5. Others
- 4.5. North America Mayonnaise Market Analysis, Opportunity and Forecast, By Packaging, 2016-2032
- 4.5.1. North America Mayonnaise Market Analysis by Packaging: Introduction
- 4.5.2. Market Size Absolute $ Opportunity Analysis and Forecast, By Packaging, 2016-2032
- 4.5.3. Jars
- 4.5.4. Sachets
- 4.5.5. Bottles
- 4.5.6. Others
- 4.6. North America Mayonnaise Market Analysis, Opportunity and Forecast, By Distribution Channel, 2016-2032
- 4.6.1. North America Mayonnaise Market Analysis by Distribution Channel: Introduction
- 4.6.2. Market Size Absolute $ Opportunity Analysis and Forecast, By Distribution Channel, 2016-2032
- 4.6.3. Supermarkets And Hypermarkets
- 4.6.4. Department Stores
- 4.6.5. Foodservice Providers
- 4.6.6. Online Stores
- 4.7. North America Mayonnaise Market Analysis, Opportunity and Forecast, By Country , 2016-2032
- 4.7.1. North America Mayonnaise Market Analysis by Country : Introduction
- 4.7.2. Market Size Absolute $ Opportunity Analysis and Forecast, Country , 2016-2032
- 4.7.2.1. The US
- 4.7.2.2. Canada
- 4.7.2.3. Mexico
- 5. Western Europe Mayonnaise Market Analysis, Opportunity and Forecast, 2016-2032
- 5.1. Western Europe Mayonnaise Market Analysis, 2016-2021
- 5.2. Western Europe Mayonnaise Market Opportunity and Forecast, 2023-2032
- 5.3. Western Europe Mayonnaise Market Analysis, Opportunity and Forecast, By Type, 2016-2032
- 5.3.1. Western Europe Mayonnaise Market Analysis by Type: Introduction
- 5.3.2. Market Size Absolute $ Opportunity Analysis and Forecast, By Type, 2016-2032
- 5.3.3. Traditional Mayonnaise
- 5.3.4. Low-Fat/Light Mayonnaise
- 5.3.5. Organic Mayonnaise
- 5.3.6. Vegan Mayonnaise
- 5.3.7. Flavored Mayonnaise
- 5.4. Western Europe Mayonnaise Market Analysis, Opportunity and Forecast, By Raw Material, 2016-2032
- 5.4.1. Western Europe Mayonnaise Market Analysis by Raw Material: Introduction
- 5.4.2. Market Size Absolute $ Opportunity Analysis and Forecast, By Raw Material, 2016-2032
- 5.4.3. Egg
- 5.4.4. Egg-Less
- 5.4.5. Others
- 5.5. Western Europe Mayonnaise Market Analysis, Opportunity and Forecast, By Packaging, 2016-2032
- 5.5.1. Western Europe Mayonnaise Market Analysis by Packaging: Introduction
- 5.5.2. Market Size Absolute $ Opportunity Analysis and Forecast, By Packaging, 2016-2032
- 5.5.3. Jars
- 5.5.4. Sachets
- 5.5.5. Bottles
- 5.5.6. Others
- 5.6. Western Europe Mayonnaise Market Analysis, Opportunity and Forecast, By Distribution Channel, 2016-2032
- 5.6.1. Western Europe Mayonnaise Market Analysis by Distribution Channel: Introduction
- 5.6.2. Market Size Absolute $ Opportunity Analysis and Forecast, By Distribution Channel, 2016-2032
- 5.6.3. Supermarkets And Hypermarkets
- 5.6.4. Department Stores
- 5.6.5. Foodservice Providers
- 5.6.6. Online Stores
- 5.7. Western Europe Mayonnaise Market Analysis, Opportunity and Forecast, By Country , 2016-2032
- 5.7.1. Western Europe Mayonnaise Market Analysis by Country : Introduction
- 5.7.2. Market Size Absolute $ Opportunity Analysis and Forecast, Country , 2016-2032
- 5.7.2.1. Germany
- 5.7.2.2. France
- 5.7.2.3. The UK
- 5.7.2.4. Spain
- 5.7.2.5. Italy
- 5.7.2.6. Portugal
- 5.7.2.7. Ireland
- 5.7.2.8. Austria
- 5.7.2.9. Switzerland
- 5.7.2.10. Benelux
- 5.7.2.11. Nordic
- 5.7.2.12. Rest of Western Europe
- 6. Eastern Europe Mayonnaise Market Analysis, Opportunity and Forecast, 2016-2032
- 6.1. Eastern Europe Mayonnaise Market Analysis, 2016-2021
- 6.2. Eastern Europe Mayonnaise Market Opportunity and Forecast, 2023-2032
- 6.3. Eastern Europe Mayonnaise Market Analysis, Opportunity and Forecast, By Type, 2016-2032
- 6.3.1. Eastern Europe Mayonnaise Market Analysis by Type: Introduction
- 6.3.2. Market Size Absolute $ Opportunity Analysis and Forecast, By Type, 2016-2032
- 6.3.3. Traditional Mayonnaise
- 6.3.4. Low-Fat/Light Mayonnaise
- 6.3.5. Organic Mayonnaise
- 6.3.6. Vegan Mayonnaise
- 6.3.7. Flavored Mayonnaise
- 6.4. Eastern Europe Mayonnaise Market Analysis, Opportunity and Forecast, By Raw Material, 2016-2032
- 6.4.1. Eastern Europe Mayonnaise Market Analysis by Raw Material: Introduction
- 6.4.2. Market Size Absolute $ Opportunity Analysis and Forecast, By Raw Material, 2016-2032
- 6.4.3. Egg
- 6.4.4. Egg-Less
- 6.4.5. Others
- 6.5. Eastern Europe Mayonnaise Market Analysis, Opportunity and Forecast, By Packaging, 2016-2032
- 6.5.1. Eastern Europe Mayonnaise Market Analysis by Packaging: Introduction
- 6.5.2. Market Size Absolute $ Opportunity Analysis and Forecast, By Packaging, 2016-2032
- 6.5.3. Jars
- 6.5.4. Sachets
- 6.5.5. Bottles
- 6.5.6. Others
- 6.6. Eastern Europe Mayonnaise Market Analysis, Opportunity and Forecast, By Distribution Channel, 2016-2032
- 6.6.1. Eastern Europe Mayonnaise Market Analysis by Distribution Channel: Introduction
- 6.6.2. Market Size Absolute $ Opportunity Analysis and Forecast, By Distribution Channel, 2016-2032
- 6.6.3. Supermarkets And Hypermarkets
- 6.6.4. Department Stores
- 6.6.5. Foodservice Providers
- 6.6.6. Online Stores
- 6.7. Eastern Europe Mayonnaise Market Analysis, Opportunity and Forecast, By Country , 2016-2032
- 6.7.1. Eastern Europe Mayonnaise Market Analysis by Country : Introduction
- 6.7.2. Market Size Absolute $ Opportunity Analysis and Forecast, Country , 2016-2032
- 6.7.2.1. Russia
- 6.7.2.2. Poland
- 6.7.2.3. The Czech Republic
- 6.7.2.4. Greece
- 6.7.2.5. Rest of Eastern Europe
- 7. APAC Mayonnaise Market Analysis, Opportunity and Forecast, 2016-2032
- 7.1. APAC Mayonnaise Market Analysis, 2016-2021
- 7.2. APAC Mayonnaise Market Opportunity and Forecast, 2023-2032
- 7.3. APAC Mayonnaise Market Analysis, Opportunity and Forecast, By Type, 2016-2032
- 7.3.1. APAC Mayonnaise Market Analysis by Type: Introduction
- 7.3.2. Market Size Absolute $ Opportunity Analysis and Forecast, By Type, 2016-2032
- 7.3.3. Traditional Mayonnaise
- 7.3.4. Low-Fat/Light Mayonnaise
- 7.3.5. Organic Mayonnaise
- 7.3.6. Vegan Mayonnaise
- 7.3.7. Flavored Mayonnaise
- 7.4. APAC Mayonnaise Market Analysis, Opportunity and Forecast, By Raw Material, 2016-2032
- 7.4.1. APAC Mayonnaise Market Analysis by Raw Material: Introduction
- 7.4.2. Market Size Absolute $ Opportunity Analysis and Forecast, By Raw Material, 2016-2032
- 7.4.3. Egg
- 7.4.4. Egg-Less
- 7.4.5. Others
- 7.5. APAC Mayonnaise Market Analysis, Opportunity and Forecast, By Packaging, 2016-2032
- 7.5.1. APAC Mayonnaise Market Analysis by Packaging: Introduction
- 7.5.2. Market Size Absolute $ Opportunity Analysis and Forecast, By Packaging, 2016-2032
- 7.5.3. Jars
- 7.5.4. Sachets
- 7.5.5. Bottles
- 7.5.6. Others
- 7.6. APAC Mayonnaise Market Analysis, Opportunity and Forecast, By Distribution Channel, 2016-2032
- 7.6.1. APAC Mayonnaise Market Analysis by Distribution Channel: Introduction
- 7.6.2. Market Size Absolute $ Opportunity Analysis and Forecast, By Distribution Channel, 2016-2032
- 7.6.3. Supermarkets And Hypermarkets
- 7.6.4. Department Stores
- 7.6.5. Foodservice Providers
- 7.6.6. Online Stores
- 7.7. APAC Mayonnaise Market Analysis, Opportunity and Forecast, By Country , 2016-2032
- 7.7.1. APAC Mayonnaise Market Analysis by Country : Introduction
- 7.7.2. Market Size Absolute $ Opportunity Analysis and Forecast, Country , 2016-2032
- 7.7.2.1. China
- 7.7.2.2. Japan
- 7.7.2.3. South Korea
- 7.7.2.4. India
- 7.7.2.5. Australia & New Zeland
- 7.7.2.6. Indonesia
- 7.7.2.7. Malaysia
- 7.7.2.8. Philippines
- 7.7.2.9. Singapore
- 7.7.2.10. Thailand
- 7.7.2.11. Vietnam
- 7.7.2.12. Rest of APAC
- 8. Latin America Mayonnaise Market Analysis, Opportunity and Forecast, 2016-2032
- 8.1. Latin America Mayonnaise Market Analysis, 2016-2021
- 8.2. Latin America Mayonnaise Market Opportunity and Forecast, 2023-2032
- 8.3. Latin America Mayonnaise Market Analysis, Opportunity and Forecast, By Type, 2016-2032
- 8.3.1. Latin America Mayonnaise Market Analysis by Type: Introduction
- 8.3.2. Market Size Absolute $ Opportunity Analysis and Forecast, By Type, 2016-2032
- 8.3.3. Traditional Mayonnaise
- 8.3.4. Low-Fat/Light Mayonnaise
- 8.3.5. Organic Mayonnaise
- 8.3.6. Vegan Mayonnaise
- 8.3.7. Flavored Mayonnaise
- 8.4. Latin America Mayonnaise Market Analysis, Opportunity and Forecast, By Raw Material, 2016-2032
- 8.4.1. Latin America Mayonnaise Market Analysis by Raw Material: Introduction
- 8.4.2. Market Size Absolute $ Opportunity Analysis and Forecast, By Raw Material, 2016-2032
- 8.4.3. Egg
- 8.4.4. Egg-Less
- 8.4.5. Others
- 8.5. Latin America Mayonnaise Market Analysis, Opportunity and Forecast, By Packaging, 2016-2032
- 8.5.1. Latin America Mayonnaise Market Analysis by Packaging: Introduction
- 8.5.2. Market Size Absolute $ Opportunity Analysis and Forecast, By Packaging, 2016-2032
- 8.5.3. Jars
- 8.5.4. Sachets
- 8.5.5. Bottles
- 8.5.6. Others
- 8.6. Latin America Mayonnaise Market Analysis, Opportunity and Forecast, By Distribution Channel, 2016-2032
- 8.6.1. Latin America Mayonnaise Market Analysis by Distribution Channel: Introduction
- 8.6.2. Market Size Absolute $ Opportunity Analysis and Forecast, By Distribution Channel, 2016-2032
- 8.6.3. Supermarkets And Hypermarkets
- 8.6.4. Department Stores
- 8.6.5. Foodservice Providers
- 8.6.6. Online Stores
- 8.7. Latin America Mayonnaise Market Analysis, Opportunity and Forecast, By Country , 2016-2032
- 8.7.1. Latin America Mayonnaise Market Analysis by Country : Introduction
- 8.7.2. Market Size Absolute $ Opportunity Analysis and Forecast, Country , 2016-2032
- 8.7.2.1. Brazil
- 8.7.2.2. Colombia
- 8.7.2.3. Chile
- 8.7.2.4. Argentina
- 8.7.2.5. Costa Rica
- 8.7.2.6. Rest of Latin America
- 9. Middle East & Africa Mayonnaise Market Analysis, Opportunity and Forecast, 2016-2032
- 9.1. Middle East & Africa Mayonnaise Market Analysis, 2016-2021
- 9.2. Middle East & Africa Mayonnaise Market Opportunity and Forecast, 2023-2032
- 9.3. Middle East & Africa Mayonnaise Market Analysis, Opportunity and Forecast, By Type, 2016-2032
- 9.3.1. Middle East & Africa Mayonnaise Market Analysis by Type: Introduction
- 9.3.2. Market Size Absolute $ Opportunity Analysis and Forecast, By Type, 2016-2032
- 9.3.3. Traditional Mayonnaise
- 9.3.4. Low-Fat/Light Mayonnaise
- 9.3.5. Organic Mayonnaise
- 9.3.6. Vegan Mayonnaise
- 9.3.7. Flavored Mayonnaise
- 9.4. Middle East & Africa Mayonnaise Market Analysis, Opportunity and Forecast, By Raw Material, 2016-2032
- 9.4.1. Middle East & Africa Mayonnaise Market Analysis by Raw Material: Introduction
- 9.4.2. Market Size Absolute $ Opportunity Analysis and Forecast, By Raw Material, 2016-2032
- 9.4.3. Egg
- 9.4.4. Egg-Less
- 9.4.5. Others
- 9.5. Middle East & Africa Mayonnaise Market Analysis, Opportunity and Forecast, By Packaging, 2016-2032
- 9.5.1. Middle East & Africa Mayonnaise Market Analysis by Packaging: Introduction
- 9.5.2. Market Size Absolute $ Opportunity Analysis and Forecast, By Packaging, 2016-2032
- 9.5.3. Jars
- 9.5.4. Sachets
- 9.5.5. Bottles
- 9.5.6. Others
- 9.6. Middle East & Africa Mayonnaise Market Analysis, Opportunity and Forecast, By Distribution Channel, 2016-2032
- 9.6.1. Middle East & Africa Mayonnaise Market Analysis by Distribution Channel: Introduction
- 9.6.2. Market Size Absolute $ Opportunity Analysis and Forecast, By Distribution Channel, 2016-2032
- 9.6.3. Supermarkets And Hypermarkets
- 9.6.4. Department Stores
- 9.6.5. Foodservice Providers
- 9.6.6. Online Stores
- 9.7. Middle East & Africa Mayonnaise Market Analysis, Opportunity and Forecast, By Country , 2016-2032
- 9.7.1. Middle East & Africa Mayonnaise Market Analysis by Country : Introduction
- 9.7.2. Market Size Absolute $ Opportunity Analysis and Forecast, Country , 2016-2032
- 9.7.2.1. Algeria
- 9.7.2.2. Egypt
- 9.7.2.3. Israel
- 9.7.2.4. Kuwait
- 9.7.2.5. Nigeria
- 9.7.2.6. Saudi Arabia
- 9.7.2.7. South Africa
- 9.7.2.8. Turkey
- 9.7.2.9. The UAE
- 9.7.2.10. Rest of MEA
- 10. Global Mayonnaise Market Analysis, Opportunity and Forecast, By Region , 2016-2032
- 10.1. Global Mayonnaise Market Analysis by Region : Introduction
- 10.2. Market Size Absolute $ Opportunity Analysis and Forecast, By Region , 2016-2032
- 10.2.1. North America
- 10.2.2. Western Europe
- 10.2.3. Eastern Europe
- 10.2.4. APAC
- 10.2.5. Latin America
- 10.2.6. Middle East & Africa
- 11. Global Mayonnaise Market Competitive Landscape, Market Share Analysis, and Company Profiles
- 11.1. Market Share Analysis
- 11.2. Company Profiles
- 11.3. McCormick & Company, Inc.
- 11.3.1. Company Overview
- 11.3.2. Financial Highlights
- 11.3.3. Product Portfolio
- 11.3.4. SWOT Analysis
- 11.3.5. Key Strategies and Developments
- 11.4. Kraft Heinz Company
- 11.4.1. Company Overview
- 11.4.2. Financial Highlights
- 11.4.3. Product Portfolio
- 11.4.4. SWOT Analysis
- 11.4.5. Key Strategies and Developments
- 11.5. Marina Foods Inc.
- 11.5.1. Company Overview
- 11.5.2. Financial Highlights
- 11.5.3. Product Portfolio
- 11.5.4. SWOT Analysis
- 11.5.5. Key Strategies and Developments
- 11.6. Unilever Plc
- 11.6.1. Company Overview
- 11.6.2. Financial Highlights
- 11.6.3. Product Portfolio
- 11.6.4. SWOT Analysis
- 11.6.5. Key Strategies and Developments
- 11.7. Paradise Food Ltd
- 11.7.1. Company Overview
- 11.7.2. Financial Highlights
- 11.7.3. Product Portfolio
- 11.7.4. SWOT Analysis
- 11.7.5. Key Strategies and Developments
- 11.8. Kenko Mayonnaise
- 11.8.1. Company Overview
- 11.8.2. Financial Highlights
- 11.8.3. Product Portfolio
- 11.8.4. SWOT Analysis
- 11.8.5. Key Strategies and Developments
- 11.9. Mondelez International
- 11.9.1. Company Overview
- 11.9.2. Financial Highlights
- 11.9.3. Product Portfolio
- 11.9.4. SWOT Analysis
- 11.9.5. Key Strategies and Developments
- 11.10. Miracle Whip
- 11.10.1. Company Overview
- 11.10.2. Financial Highlights
- 11.10.3. Product Portfolio
- 11.10.4. SWOT Analysis
- 11.10.5. Key Strategies and Developments
- 11.11. Conagra Brands Inc.
- 11.11.1. Company Overview
- 11.11.2. Financial Highlights
- 11.11.3. Product Portfolio
- 11.11.4. SWOT Analysis
- 11.11.5. Key Strategies and Developments
- 11.12. American Garden Products Inc.
- 11.12.1. Company Overview
- 11.12.2. Financial Highlights
- 11.12.3. Product Portfolio
- 11.12.4. SWOT Analysis
- 11.12.5. Key Strategies and Developments
- 11.13.1. Company Overview
- 11.13.2. Financial Highlights
- 11.13.3. Product Portfolio
- 11.13.4. SWOT Analysis
- 11.13.5. Key Strategies and Developments
- 12. Assumptions and Acronyms
- 13. Research Methodology
- 14. Contact
- List of Figures
- Figure 1: Global Mayonnaise Market Revenue (US$ Mn) Market Share by Type in 2022
- Figure 2: Global Mayonnaise Market Attractiveness Analysis by Type, 2016-2032
- Figure 3: Global Mayonnaise Market Revenue (US$ Mn) Market Share by Raw Materialin 2022
- Figure 4: Global Mayonnaise Market Attractiveness Analysis by Raw Material, 2016-2032
- Figure 5: Global Mayonnaise Market Revenue (US$ Mn) Market Share by Packagingin 2022
- Figure 6: Global Mayonnaise Market Attractiveness Analysis by Packaging, 2016-2032
- Figure 7: Global Mayonnaise Market Revenue (US$ Mn) Market Share by Distribution Channelin 2022
- Figure 8: Global Mayonnaise Market Attractiveness Analysis by Distribution Channel, 2016-2032
- Figure 9: Global Mayonnaise Market Revenue (US$ Mn) Market Share by Region in 2022
- Figure 10: Global Mayonnaise Market Attractiveness Analysis by Region, 2016-2032
- Figure 11: Global Mayonnaise Market Revenue (US$ Mn) (2016-2032)
- Figure 12: Global Mayonnaise Market Revenue (US$ Mn) Comparison by Region (2016-2032)
- Figure 13: Global Mayonnaise Market Revenue (US$ Mn) Comparison by Type (2016-2032)
- Figure 14: Global Mayonnaise Market Revenue (US$ Mn) Comparison by Raw Material (2016-2032)
- Figure 15: Global Mayonnaise Market Revenue (US$ Mn) Comparison by Packaging (2016-2032)
- Figure 16: Global Mayonnaise Market Revenue (US$ Mn) Comparison by Distribution Channel (2016-2032)
- Figure 17: Global Mayonnaise Market Y-o-Y Growth Rate Comparison by Region (2016-2032)
- Figure 18: Global Mayonnaise Market Y-o-Y Growth Rate Comparison by Type (2016-2032)
- Figure 19: Global Mayonnaise Market Y-o-Y Growth Rate Comparison by Raw Material (2016-2032)
- Figure 20: Global Mayonnaise Market Y-o-Y Growth Rate Comparison by Packaging (2016-2032)
- Figure 21: Global Mayonnaise Market Y-o-Y Growth Rate Comparison by Distribution Channel (2016-2032)
- Figure 22: Global Mayonnaise Market Share Comparison by Region (2016-2032)
- Figure 23: Global Mayonnaise Market Share Comparison by Type (2016-2032)
- Figure 24: Global Mayonnaise Market Share Comparison by Raw Material (2016-2032)
- Figure 25: Global Mayonnaise Market Share Comparison by Packaging (2016-2032)
- Figure 26: Global Mayonnaise Market Share Comparison by Distribution Channel (2016-2032)
- Figure 27: North America Mayonnaise Market Revenue (US$ Mn) Market Share by Typein 2022
- Figure 28: North America Mayonnaise Market Attractiveness Analysis by Type, 2016-2032
- Figure 29: North America Mayonnaise Market Revenue (US$ Mn) Market Share by Raw Materialin 2022
- Figure 30: North America Mayonnaise Market Attractiveness Analysis by Raw Material, 2016-2032
- Figure 31: North America Mayonnaise Market Revenue (US$ Mn) Market Share by Packagingin 2022
- Figure 32: North America Mayonnaise Market Attractiveness Analysis by Packaging, 2016-2032
- Figure 33: North America Mayonnaise Market Revenue (US$ Mn) Market Share by Distribution Channelin 2022
- Figure 34: North America Mayonnaise Market Attractiveness Analysis by Distribution Channel, 2016-2032
- Figure 35: North America Mayonnaise Market Revenue (US$ Mn) Market Share by Country in 2022
- Figure 36: North America Mayonnaise Market Attractiveness Analysis by Country, 2016-2032
- Figure 37: North America Mayonnaise Market Revenue (US$ Mn) (2016-2032)
- Figure 38: North America Mayonnaise Market Revenue (US$ Mn) Comparison by Country (2016-2032)
- Figure 39: North America Mayonnaise Market Revenue (US$ Mn) Comparison by Type (2016-2032)
- Figure 40: North America Mayonnaise Market Revenue (US$ Mn) Comparison by Raw Material (2016-2032)
- Figure 41: North America Mayonnaise Market Revenue (US$ Mn) Comparison by Packaging (2016-2032)
- Figure 42: North America Mayonnaise Market Revenue (US$ Mn) Comparison by Distribution Channel (2016-2032)
- Figure 43: North America Mayonnaise Market Y-o-Y Growth Rate Comparison by Country (2016-2032)
- Figure 44: North America Mayonnaise Market Y-o-Y Growth Rate Comparison by Type (2016-2032)
- Figure 45: North America Mayonnaise Market Y-o-Y Growth Rate Comparison by Raw Material (2016-2032)
- Figure 46: North America Mayonnaise Market Y-o-Y Growth Rate Comparison by Packaging (2016-2032)
- Figure 47: North America Mayonnaise Market Y-o-Y Growth Rate Comparison by Distribution Channel (2016-2032)
- Figure 48: North America Mayonnaise Market Share Comparison by Country (2016-2032)
- Figure 49: North America Mayonnaise Market Share Comparison by Type (2016-2032)
- Figure 50: North America Mayonnaise Market Share Comparison by Raw Material (2016-2032)
- Figure 51: North America Mayonnaise Market Share Comparison by Packaging (2016-2032)
- Figure 52: North America Mayonnaise Market Share Comparison by Distribution Channel (2016-2032)
- Figure 53: Western Europe Mayonnaise Market Revenue (US$ Mn) Market Share by Typein 2022
- Figure 54: Western Europe Mayonnaise Market Attractiveness Analysis by Type, 2016-2032
- Figure 55: Western Europe Mayonnaise Market Revenue (US$ Mn) Market Share by Raw Materialin 2022
- Figure 56: Western Europe Mayonnaise Market Attractiveness Analysis by Raw Material, 2016-2032
- Figure 57: Western Europe Mayonnaise Market Revenue (US$ Mn) Market Share by Packagingin 2022
- Figure 58: Western Europe Mayonnaise Market Attractiveness Analysis by Packaging, 2016-2032
- Figure 59: Western Europe Mayonnaise Market Revenue (US$ Mn) Market Share by Distribution Channelin 2022
- Figure 60: Western Europe Mayonnaise Market Attractiveness Analysis by Distribution Channel, 2016-2032
- Figure 61: Western Europe Mayonnaise Market Revenue (US$ Mn) Market Share by Country in 2022
- Figure 62: Western Europe Mayonnaise Market Attractiveness Analysis by Country, 2016-2032
- Figure 63: Western Europe Mayonnaise Market Revenue (US$ Mn) (2016-2032)
- Figure 64: Western Europe Mayonnaise Market Revenue (US$ Mn) Comparison by Country (2016-2032)
- Figure 65: Western Europe Mayonnaise Market Revenue (US$ Mn) Comparison by Type (2016-2032)
- Figure 66: Western Europe Mayonnaise Market Revenue (US$ Mn) Comparison by Raw Material (2016-2032)
- Figure 67: Western Europe Mayonnaise Market Revenue (US$ Mn) Comparison by Packaging (2016-2032)
- Figure 68: Western Europe Mayonnaise Market Revenue (US$ Mn) Comparison by Distribution Channel (2016-2032)
- Figure 69: Western Europe Mayonnaise Market Y-o-Y Growth Rate Comparison by Country (2016-2032)
- Figure 70: Western Europe Mayonnaise Market Y-o-Y Growth Rate Comparison by Type (2016-2032)
- Figure 71: Western Europe Mayonnaise Market Y-o-Y Growth Rate Comparison by Raw Material (2016-2032)
- Figure 72: Western Europe Mayonnaise Market Y-o-Y Growth Rate Comparison by Packaging (2016-2032)
- Figure 73: Western Europe Mayonnaise Market Y-o-Y Growth Rate Comparison by Distribution Channel (2016-2032)
- Figure 74: Western Europe Mayonnaise Market Share Comparison by Country (2016-2032)
- Figure 75: Western Europe Mayonnaise Market Share Comparison by Type (2016-2032)
- Figure 76: Western Europe Mayonnaise Market Share Comparison by Raw Material (2016-2032)
- Figure 77: Western Europe Mayonnaise Market Share Comparison by Packaging (2016-2032)
- Figure 78: Western Europe Mayonnaise Market Share Comparison by Distribution Channel (2016-2032)
- Figure 79: Eastern Europe Mayonnaise Market Revenue (US$ Mn) Market Share by Typein 2022
- Figure 80: Eastern Europe Mayonnaise Market Attractiveness Analysis by Type, 2016-2032
- Figure 81: Eastern Europe Mayonnaise Market Revenue (US$ Mn) Market Share by Raw Materialin 2022
- Figure 82: Eastern Europe Mayonnaise Market Attractiveness Analysis by Raw Material, 2016-2032
- Figure 83: Eastern Europe Mayonnaise Market Revenue (US$ Mn) Market Share by Packagingin 2022
- Figure 84: Eastern Europe Mayonnaise Market Attractiveness Analysis by Packaging, 2016-2032
- Figure 85: Eastern Europe Mayonnaise Market Revenue (US$ Mn) Market Share by Distribution Channelin 2022
- Figure 86: Eastern Europe Mayonnaise Market Attractiveness Analysis by Distribution Channel, 2016-2032
- Figure 87: Eastern Europe Mayonnaise Market Revenue (US$ Mn) Market Share by Country in 2022
- Figure 88: Eastern Europe Mayonnaise Market Attractiveness Analysis by Country, 2016-2032
- Figure 89: Eastern Europe Mayonnaise Market Revenue (US$ Mn) (2016-2032)
- Figure 90: Eastern Europe Mayonnaise Market Revenue (US$ Mn) Comparison by Country (2016-2032)
- Figure 91: Eastern Europe Mayonnaise Market Revenue (US$ Mn) Comparison by Type (2016-2032)
- Figure 92: Eastern Europe Mayonnaise Market Revenue (US$ Mn) Comparison by Raw Material (2016-2032)
- Figure 93: Eastern Europe Mayonnaise Market Revenue (US$ Mn) Comparison by Packaging (2016-2032)
- Figure 94: Eastern Europe Mayonnaise Market Revenue (US$ Mn) Comparison by Distribution Channel (2016-2032)
- Figure 95: Eastern Europe Mayonnaise Market Y-o-Y Growth Rate Comparison by Country (2016-2032)
- Figure 96: Eastern Europe Mayonnaise Market Y-o-Y Growth Rate Comparison by Type (2016-2032)
- Figure 97: Eastern Europe Mayonnaise Market Y-o-Y Growth Rate Comparison by Raw Material (2016-2032)
- Figure 98: Eastern Europe Mayonnaise Market Y-o-Y Growth Rate Comparison by Packaging (2016-2032)
- Figure 99: Eastern Europe Mayonnaise Market Y-o-Y Growth Rate Comparison by Distribution Channel (2016-2032)
- Figure 100: Eastern Europe Mayonnaise Market Share Comparison by Country (2016-2032)
- Figure 101: Eastern Europe Mayonnaise Market Share Comparison by Type (2016-2032)
- Figure 102: Eastern Europe Mayonnaise Market Share Comparison by Raw Material (2016-2032)
- Figure 103: Eastern Europe Mayonnaise Market Share Comparison by Packaging (2016-2032)
- Figure 104: Eastern Europe Mayonnaise Market Share Comparison by Distribution Channel (2016-2032)
- Figure 105: APAC Mayonnaise Market Revenue (US$ Mn) Market Share by Typein 2022
- Figure 106: APAC Mayonnaise Market Attractiveness Analysis by Type, 2016-2032
- Figure 107: APAC Mayonnaise Market Revenue (US$ Mn) Market Share by Raw Materialin 2022
- Figure 108: APAC Mayonnaise Market Attractiveness Analysis by Raw Material, 2016-2032
- Figure 109: APAC Mayonnaise Market Revenue (US$ Mn) Market Share by Packagingin 2022
- Figure 110: APAC Mayonnaise Market Attractiveness Analysis by Packaging, 2016-2032
- Figure 111: APAC Mayonnaise Market Revenue (US$ Mn) Market Share by Distribution Channelin 2022
- Figure 112: APAC Mayonnaise Market Attractiveness Analysis by Distribution Channel, 2016-2032
- Figure 113: APAC Mayonnaise Market Revenue (US$ Mn) Market Share by Country in 2022
- Figure 114: APAC Mayonnaise Market Attractiveness Analysis by Country, 2016-2032
- Figure 115: APAC Mayonnaise Market Revenue (US$ Mn) (2016-2032)
- Figure 116: APAC Mayonnaise Market Revenue (US$ Mn) Comparison by Country (2016-2032)
- Figure 117: APAC Mayonnaise Market Revenue (US$ Mn) Comparison by Type (2016-2032)
- Figure 118: APAC Mayonnaise Market Revenue (US$ Mn) Comparison by Raw Material (2016-2032)
- Figure 119: APAC Mayonnaise Market Revenue (US$ Mn) Comparison by Packaging (2016-2032)
- Figure 120: APAC Mayonnaise Market Revenue (US$ Mn) Comparison by Distribution Channel (2016-2032)
- Figure 121: APAC Mayonnaise Market Y-o-Y Growth Rate Comparison by Country (2016-2032)
- Figure 122: APAC Mayonnaise Market Y-o-Y Growth Rate Comparison by Type (2016-2032)
- Figure 123: APAC Mayonnaise Market Y-o-Y Growth Rate Comparison by Raw Material (2016-2032)
- Figure 124: APAC Mayonnaise Market Y-o-Y Growth Rate Comparison by Packaging (2016-2032)
- Figure 125: APAC Mayonnaise Market Y-o-Y Growth Rate Comparison by Distribution Channel (2016-2032)
- Figure 126: APAC Mayonnaise Market Share Comparison by Country (2016-2032)
- Figure 127: APAC Mayonnaise Market Share Comparison by Type (2016-2032)
- Figure 128: APAC Mayonnaise Market Share Comparison by Raw Material (2016-2032)
- Figure 129: APAC Mayonnaise Market Share Comparison by Packaging (2016-2032)
- Figure 130: APAC Mayonnaise Market Share Comparison by Distribution Channel (2016-2032)
- Figure 131: Latin America Mayonnaise Market Revenue (US$ Mn) Market Share by Typein 2022
- Figure 132: Latin America Mayonnaise Market Attractiveness Analysis by Type, 2016-2032
- Figure 133: Latin America Mayonnaise Market Revenue (US$ Mn) Market Share by Raw Materialin 2022
- Figure 134: Latin America Mayonnaise Market Attractiveness Analysis by Raw Material, 2016-2032
- Figure 135: Latin America Mayonnaise Market Revenue (US$ Mn) Market Share by Packagingin 2022
- Figure 136: Latin America Mayonnaise Market Attractiveness Analysis by Packaging, 2016-2032
- Figure 137: Latin America Mayonnaise Market Revenue (US$ Mn) Market Share by Distribution Channelin 2022
- Figure 138: Latin America Mayonnaise Market Attractiveness Analysis by Distribution Channel, 2016-2032
- Figure 139: Latin America Mayonnaise Market Revenue (US$ Mn) Market Share by Country in 2022
- Figure 140: Latin America Mayonnaise Market Attractiveness Analysis by Country, 2016-2032
- Figure 141: Latin America Mayonnaise Market Revenue (US$ Mn) (2016-2032)
- Figure 142: Latin America Mayonnaise Market Revenue (US$ Mn) Comparison by Country (2016-2032)
- Figure 143: Latin America Mayonnaise Market Revenue (US$ Mn) Comparison by Type (2016-2032)
- Figure 144: Latin America Mayonnaise Market Revenue (US$ Mn) Comparison by Raw Material (2016-2032)
- Figure 145: Latin America Mayonnaise Market Revenue (US$ Mn) Comparison by Packaging (2016-2032)
- Figure 146: Latin America Mayonnaise Market Revenue (US$ Mn) Comparison by Distribution Channel (2016-2032)
- Figure 147: Latin America Mayonnaise Market Y-o-Y Growth Rate Comparison by Country (2016-2032)
- Figure 148: Latin America Mayonnaise Market Y-o-Y Growth Rate Comparison by Type (2016-2032)
- Figure 149: Latin America Mayonnaise Market Y-o-Y Growth Rate Comparison by Raw Material (2016-2032)
- Figure 150: Latin America Mayonnaise Market Y-o-Y Growth Rate Comparison by Packaging (2016-2032)
- Figure 151: Latin America Mayonnaise Market Y-o-Y Growth Rate Comparison by Distribution Channel (2016-2032)
- Figure 152: Latin America Mayonnaise Market Share Comparison by Country (2016-2032)
- Figure 153: Latin America Mayonnaise Market Share Comparison by Type (2016-2032)
- Figure 154: Latin America Mayonnaise Market Share Comparison by Raw Material (2016-2032)
- Figure 155: Latin America Mayonnaise Market Share Comparison by Packaging (2016-2032)
- Figure 156: Latin America Mayonnaise Market Share Comparison by Distribution Channel (2016-2032)
- Figure 157: Middle East & Africa Mayonnaise Market Revenue (US$ Mn) Market Share by Typein 2022
- Figure 158: Middle East & Africa Mayonnaise Market Attractiveness Analysis by Type, 2016-2032
- Figure 159: Middle East & Africa Mayonnaise Market Revenue (US$ Mn) Market Share by Raw Materialin 2022
- Figure 160: Middle East & Africa Mayonnaise Market Attractiveness Analysis by Raw Material, 2016-2032
- Figure 161: Middle East & Africa Mayonnaise Market Revenue (US$ Mn) Market Share by Packagingin 2022
- Figure 162: Middle East & Africa Mayonnaise Market Attractiveness Analysis by Packaging, 2016-2032
- Figure 163: Middle East & Africa Mayonnaise Market Revenue (US$ Mn) Market Share by Distribution Channelin 2022
- Figure 164: Middle East & Africa Mayonnaise Market Attractiveness Analysis by Distribution Channel, 2016-2032
- Figure 165: Middle East & Africa Mayonnaise Market Revenue (US$ Mn) Market Share by Country in 2022
- Figure 166: Middle East & Africa Mayonnaise Market Attractiveness Analysis by Country, 2016-2032
- Figure 167: Middle East & Africa Mayonnaise Market Revenue (US$ Mn) (2016-2032)
- Figure 168: Middle East & Africa Mayonnaise Market Revenue (US$ Mn) Comparison by Country (2016-2032)
- Figure 169: Middle East & Africa Mayonnaise Market Revenue (US$ Mn) Comparison by Type (2016-2032)
- Figure 170: Middle East & Africa Mayonnaise Market Revenue (US$ Mn) Comparison by Raw Material (2016-2032)
- Figure 171: Middle East & Africa Mayonnaise Market Revenue (US$ Mn) Comparison by Packaging (2016-2032)
- Figure 172: Middle East & Africa Mayonnaise Market Revenue (US$ Mn) Comparison by Distribution Channel (2016-2032)
- Figure 173: Middle East & Africa Mayonnaise Market Y-o-Y Growth Rate Comparison by Country (2016-2032)
- Figure 174: Middle East & Africa Mayonnaise Market Y-o-Y Growth Rate Comparison by Type (2016-2032)
- Figure 175: Middle East & Africa Mayonnaise Market Y-o-Y Growth Rate Comparison by Raw Material (2016-2032)
- Figure 176: Middle East & Africa Mayonnaise Market Y-o-Y Growth Rate Comparison by Packaging (2016-2032)
- Figure 177: Middle East & Africa Mayonnaise Market Y-o-Y Growth Rate Comparison by Distribution Channel (2016-2032)
- Figure 178: Middle East & Africa Mayonnaise Market Share Comparison by Country (2016-2032)
- Figure 179: Middle East & Africa Mayonnaise Market Share Comparison by Type (2016-2032)
- Figure 180: Middle East & Africa Mayonnaise Market Share Comparison by Raw Material (2016-2032)
- Figure 181: Middle East & Africa Mayonnaise Market Share Comparison by Packaging (2016-2032)
- Figure 182: Middle East & Africa Mayonnaise Market Share Comparison by Distribution Channel (2016-2032)
- List of Tables
- Table 1: Global Mayonnaise Market Comparison by Type (2016-2032)
- Table 2: Global Mayonnaise Market Comparison by Raw Material (2016-2032)
- Table 3: Global Mayonnaise Market Comparison by Packaging (2016-2032)
- Table 4: Global Mayonnaise Market Comparison by Distribution Channel (2016-2032)
- Table 5: Global Mayonnaise Market Revenue (US$ Mn) Comparison by Region (2016-2032)
- Table 6: Global Mayonnaise Market Revenue (US$ Mn) (2016-2032)
- Table 7: Global Mayonnaise Market Revenue (US$ Mn) Comparison by Region (2016-2032)
- Table 8: Global Mayonnaise Market Revenue (US$ Mn) Comparison by Type (2016-2032)
- Table 9: Global Mayonnaise Market Revenue (US$ Mn) Comparison by Raw Material (2016-2032)
- Table 10: Global Mayonnaise Market Revenue (US$ Mn) Comparison by Packaging (2016-2032)
- Table 11: Global Mayonnaise Market Revenue (US$ Mn) Comparison by Distribution Channel (2016-2032)
- Table 12: Global Mayonnaise Market Y-o-Y Growth Rate Comparison by Region (2016-2032)
- Table 13: Global Mayonnaise Market Y-o-Y Growth Rate Comparison by Type (2016-2032)
- Table 14: Global Mayonnaise Market Y-o-Y Growth Rate Comparison by Raw Material (2016-2032)
- Table 15: Global Mayonnaise Market Y-o-Y Growth Rate Comparison by Packaging (2016-2032)
- Table 16: Global Mayonnaise Market Y-o-Y Growth Rate Comparison by Distribution Channel (2016-2032)
- Table 17: Global Mayonnaise Market Share Comparison by Region (2016-2032)
- Table 18: Global Mayonnaise Market Share Comparison by Type (2016-2032)
- Table 19: Global Mayonnaise Market Share Comparison by Raw Material (2016-2032)
- Table 20: Global Mayonnaise Market Share Comparison by Packaging (2016-2032)
- Table 21: Global Mayonnaise Market Share Comparison by Distribution Channel (2016-2032)
- Table 22: North America Mayonnaise Market Comparison by Raw Material (2016-2032)
- Table 23: North America Mayonnaise Market Comparison by Packaging (2016-2032)
- Table 24: North America Mayonnaise Market Comparison by Distribution Channel (2016-2032)
- Table 25: North America Mayonnaise Market Revenue (US$ Mn) Comparison by Country (2016-2032)
- Table 26: North America Mayonnaise Market Revenue (US$ Mn) (2016-2032)
- Table 27: North America Mayonnaise Market Revenue (US$ Mn) Comparison by Country (2016-2032)
- Table 28: North America Mayonnaise Market Revenue (US$ Mn) Comparison by Type (2016-2032)
- Table 29: North America Mayonnaise Market Revenue (US$ Mn) Comparison by Raw Material (2016-2032)
- Table 30: North America Mayonnaise Market Revenue (US$ Mn) Comparison by Packaging (2016-2032)
- Table 31: North America Mayonnaise Market Revenue (US$ Mn) Comparison by Distribution Channel (2016-2032)
- Table 32: North America Mayonnaise Market Y-o-Y Growth Rate Comparison by Country (2016-2032)
- Table 33: North America Mayonnaise Market Y-o-Y Growth Rate Comparison by Type (2016-2032)
- Table 34: North America Mayonnaise Market Y-o-Y Growth Rate Comparison by Raw Material (2016-2032)
- Table 35: North America Mayonnaise Market Y-o-Y Growth Rate Comparison by Packaging (2016-2032)
- Table 36: North America Mayonnaise Market Y-o-Y Growth Rate Comparison by Distribution Channel (2016-2032)
- Table 37: North America Mayonnaise Market Share Comparison by Country (2016-2032)
- Table 38: North America Mayonnaise Market Share Comparison by Type (2016-2032)
- Table 39: North America Mayonnaise Market Share Comparison by Raw Material (2016-2032)
- Table 40: North America Mayonnaise Market Share Comparison by Packaging (2016-2032)
- Table 41: North America Mayonnaise Market Share Comparison by Distribution Channel (2016-2032)
- Table 42: Western Europe Mayonnaise Market Comparison by Type (2016-2032)
- Table 43: Western Europe Mayonnaise Market Comparison by Raw Material (2016-2032)
- Table 44: Western Europe Mayonnaise Market Comparison by Packaging (2016-2032)
- Table 45: Western Europe Mayonnaise Market Comparison by Distribution Channel (2016-2032)
- Table 46: Western Europe Mayonnaise Market Revenue (US$ Mn) Comparison by Country (2016-2032)
- Table 47: Western Europe Mayonnaise Market Revenue (US$ Mn) (2016-2032)
- Table 48: Western Europe Mayonnaise Market Revenue (US$ Mn) Comparison by Country (2016-2032)
- Table 49: Western Europe Mayonnaise Market Revenue (US$ Mn) Comparison by Type (2016-2032)
- Table 50: Western Europe Mayonnaise Market Revenue (US$ Mn) Comparison by Raw Material (2016-2032)
- Table 51: Western Europe Mayonnaise Market Revenue (US$ Mn) Comparison by Packaging (2016-2032)
- Table 52: Western Europe Mayonnaise Market Revenue (US$ Mn) Comparison by Distribution Channel (2016-2032)
- Table 53: Western Europe Mayonnaise Market Y-o-Y Growth Rate Comparison by Country (2016-2032)
- Table 54: Western Europe Mayonnaise Market Y-o-Y Growth Rate Comparison by Type (2016-2032)
- Table 55: Western Europe Mayonnaise Market Y-o-Y Growth Rate Comparison by Raw Material (2016-2032)
- Table 56: Western Europe Mayonnaise Market Y-o-Y Growth Rate Comparison by Packaging (2016-2032)
- Table 57: Western Europe Mayonnaise Market Y-o-Y Growth Rate Comparison by Distribution Channel (2016-2032)
- Table 58: Western Europe Mayonnaise Market Share Comparison by Country (2016-2032)
- Table 59: Western Europe Mayonnaise Market Share Comparison by Type (2016-2032)
- Table 60: Western Europe Mayonnaise Market Share Comparison by Raw Material (2016-2032)
- Table 61: Western Europe Mayonnaise Market Share Comparison by Packaging (2016-2032)
- Table 62: Western Europe Mayonnaise Market Share Comparison by Distribution Channel (2016-2032)
- Table 63: Eastern Europe Mayonnaise Market Comparison by Type (2016-2032)
- Table 64: Eastern Europe Mayonnaise Market Comparison by Raw Material (2016-2032)
- Table 65: Eastern Europe Mayonnaise Market Comparison by Packaging (2016-2032)
- Table 66: Eastern Europe Mayonnaise Market Comparison by Distribution Channel (2016-2032)
- Table 67: Eastern Europe Mayonnaise Market Revenue (US$ Mn) Comparison by Country (2016-2032)
- Table 68: Eastern Europe Mayonnaise Market Revenue (US$ Mn) (2016-2032)
- Table 69: Eastern Europe Mayonnaise Market Revenue (US$ Mn) Comparison by Country (2016-2032)
- Table 70: Eastern Europe Mayonnaise Market Revenue (US$ Mn) Comparison by Type (2016-2032)
- Table 71: Eastern Europe Mayonnaise Market Revenue (US$ Mn) Comparison by Raw Material (2016-2032)
- Table 72: Eastern Europe Mayonnaise Market Revenue (US$ Mn) Comparison by Packaging (2016-2032)
- Table 73: Eastern Europe Mayonnaise Market Revenue (US$ Mn) Comparison by Distribution Channel (2016-2032)
- Table 74: Eastern Europe Mayonnaise Market Y-o-Y Growth Rate Comparison by Country (2016-2032)
- Table 75: Eastern Europe Mayonnaise Market Y-o-Y Growth Rate Comparison by Type (2016-2032)
- Table 76: Eastern Europe Mayonnaise Market Y-o-Y Growth Rate Comparison by Raw Material (2016-2032)
- Table 77: Eastern Europe Mayonnaise Market Y-o-Y Growth Rate Comparison by Packaging (2016-2032)
- Table 78: Eastern Europe Mayonnaise Market Y-o-Y Growth Rate Comparison by Distribution Channel (2016-2032)
- Table 79: Eastern Europe Mayonnaise Market Share Comparison by Country (2016-2032)
- Table 80: Eastern Europe Mayonnaise Market Share Comparison by Type (2016-2032)
- Table 81: Eastern Europe Mayonnaise Market Share Comparison by Raw Material (2016-2032)
- Table 82: Eastern Europe Mayonnaise Market Share Comparison by Packaging (2016-2032)
- Table 83: Eastern Europe Mayonnaise Market Share Comparison by Distribution Channel (2016-2032)
- Table 84: APAC Mayonnaise Market Comparison by Type (2016-2032)
- Table 85: APAC Mayonnaise Market Comparison by Raw Material (2016-2032)
- Table 86: APAC Mayonnaise Market Comparison by Packaging (2016-2032)
- Table 87: APAC Mayonnaise Market Comparison by Distribution Channel (2016-2032)
- Table 88: APAC Mayonnaise Market Revenue (US$ Mn) Comparison by Country (2016-2032)
- Table 89: APAC Mayonnaise Market Revenue (US$ Mn) (2016-2032)
- Table 90: APAC Mayonnaise Market Revenue (US$ Mn) Comparison by Country (2016-2032)
- Table 91: APAC Mayonnaise Market Revenue (US$ Mn) Comparison by Type (2016-2032)
- Table 92: APAC Mayonnaise Market Revenue (US$ Mn) Comparison by Raw Material (2016-2032)
- Table 93: APAC Mayonnaise Market Revenue (US$ Mn) Comparison by Packaging (2016-2032)
- Table 94: APAC Mayonnaise Market Revenue (US$ Mn) Comparison by Distribution Channel (2016-2032)
- Table 95: APAC Mayonnaise Market Y-o-Y Growth Rate Comparison by Country (2016-2032)
- Table 96: APAC Mayonnaise Market Y-o-Y Growth Rate Comparison by Type (2016-2032)
- Table 97: APAC Mayonnaise Market Y-o-Y Growth Rate Comparison by Raw Material (2016-2032)
- Table 98: APAC Mayonnaise Market Y-o-Y Growth Rate Comparison by Packaging (2016-2032)
- Table 99: APAC Mayonnaise Market Y-o-Y Growth Rate Comparison by Distribution Channel (2016-2032)
- Table 100: APAC Mayonnaise Market Share Comparison by Country (2016-2032)
- Table 101: APAC Mayonnaise Market Share Comparison by Type (2016-2032)
- Table 102: APAC Mayonnaise Market Share Comparison by Raw Material (2016-2032)
- Table 103: APAC Mayonnaise Market Share Comparison by Packaging (2016-2032)
- Table 104: APAC Mayonnaise Market Share Comparison by Distribution Channel (2016-2032)
- Table 105: Latin America Mayonnaise Market Comparison by Type (2016-2032)
- Table 106: Latin America Mayonnaise Market Comparison by Raw Material (2016-2032)
- Table 107: Latin America Mayonnaise Market Comparison by Packaging (2016-2032)
- Table 108: Latin America Mayonnaise Market Comparison by Distribution Channel (2016-2032)
- Table 109: Latin America Mayonnaise Market Revenue (US$ Mn) Comparison by Country (2016-2032)
- Table 110: Latin America Mayonnaise Market Revenue (US$ Mn) (2016-2032)
- Table 111: Latin America Mayonnaise Market Revenue (US$ Mn) Comparison by Country (2016-2032)
- Table 112: Latin America Mayonnaise Market Revenue (US$ Mn) Comparison by Type (2016-2032)
- Table 113: Latin America Mayonnaise Market Revenue (US$ Mn) Comparison by Raw Material (2016-2032)
- Table 114: Latin America Mayonnaise Market Revenue (US$ Mn) Comparison by Packaging (2016-2032)
- Table 115: Latin America Mayonnaise Market Revenue (US$ Mn) Comparison by Distribution Channel (2016-2032)
- Table 116: Latin America Mayonnaise Market Y-o-Y Growth Rate Comparison by Country (2016-2032)
- Table 117: Latin America Mayonnaise Market Y-o-Y Growth Rate Comparison by Type (2016-2032)
- Table 118: Latin America Mayonnaise Market Y-o-Y Growth Rate Comparison by Raw Material (2016-2032)
- Table 119: Latin America Mayonnaise Market Y-o-Y Growth Rate Comparison by Packaging (2016-2032)
- Table 120: Latin America Mayonnaise Market Y-o-Y Growth Rate Comparison by Distribution Channel (2016-2032)
- Table 121: Latin America Mayonnaise Market Share Comparison by Country (2016-2032)
- Table 122: Latin America Mayonnaise Market Share Comparison by Type (2016-2032)
- Table 123: Latin America Mayonnaise Market Share Comparison by Raw Material (2016-2032)
- Table 124: Latin America Mayonnaise Market Share Comparison by Packaging (2016-2032)
- Table 125: Latin America Mayonnaise Market Share Comparison by Distribution Channel (2016-2032)
- Table 126: Middle East & Africa Mayonnaise Market Comparison by Type (2016-2032)
- Table 127: Middle East & Africa Mayonnaise Market Comparison by Raw Material (2016-2032)
- Table 128: Middle East & Africa Mayonnaise Market Comparison by Packaging (2016-2032)
- Table 129: Middle East & Africa Mayonnaise Market Comparison by Distribution Channel (2016-2032)
- Table 130: Middle East & Africa Mayonnaise Market Revenue (US$ Mn) Comparison by Country (2016-2032)
- Table 131: Middle East & Africa Mayonnaise Market Revenue (US$ Mn) (2016-2032)
- Table 132: Middle East & Africa Mayonnaise Market Revenue (US$ Mn) Comparison by Country (2016-2032)
- Table 133: Middle East & Africa Mayonnaise Market Revenue (US$ Mn) Comparison by Type (2016-2032)
- Table 134: Middle East & Africa Mayonnaise Market Revenue (US$ Mn) Comparison by Raw Material (2016-2032)
- Table 135: Middle East & Africa Mayonnaise Market Revenue (US$ Mn) Comparison by Packaging (2016-2032)
- Table 136: Middle East & Africa Mayonnaise Market Revenue (US$ Mn) Comparison by Distribution Channel (2016-2032)
- Table 137: Middle East & Africa Mayonnaise Market Y-o-Y Growth Rate Comparison by Country (2016-2032)
- Table 138: Middle East & Africa Mayonnaise Market Y-o-Y Growth Rate Comparison by Type (2016-2032)
- Table 139: Middle East & Africa Mayonnaise Market Y-o-Y Growth Rate Comparison by Raw Material (2016-2032)
- Table 140: Middle East & Africa Mayonnaise Market Y-o-Y Growth Rate Comparison by Packaging (2016-2032)
- Table 141: Middle East & Africa Mayonnaise Market Y-o-Y Growth Rate Comparison by Distribution Channel (2016-2032)
- Table 142: Middle East & Africa Mayonnaise Market Share Comparison by Country (2016-2032)
- Table 143: Middle East & Africa Mayonnaise Market Share Comparison by Type (2016-2032)
- Table 144: Middle East & Africa Mayonnaise Market Share Comparison by Raw Material (2016-2032)
- Table 145: Middle East & Africa Mayonnaise Market Share Comparison by Packaging (2016-2032)
- Table 146: Middle East & Africa Mayonnaise Market Share Comparison by Distribution Channel (2016-2032)
- 1. Executive Summary
-
- McCormick & Company, Inc.
- Kraft Heinz Company
- Marina Foods Inc.
- Unilever Plc
- Paradise Food Ltd
- Kenko Mayonnaise
- Mondelez International
- Miracle Whip
- Conagra Brands Inc.
- American Garden Products Inc.
Our Clients


View Our Licence Options
