
Marine VFD Market By Type(AC Drive, DC Drive), By Voltage(Low Voltage, Medium Voltage, High Voltage), By Application(Pump, Fan, Compressor, Propeller, With Shaft Generator), By Region And Companies - Industry Segment Outlook, Market Assessment, Competition Scenario, Trends, And Forecast 2024-2033
-
43048
-
Jan 2024
-
179
-


-
This report was compiled by Vishwa Gaul Vishwa is an experienced market research and consulting professional with over 8 years of expertise in the ICT industry, contributing to over 700 reports across telecommunications, software, hardware, and digital solutions. Correspondence Team Lead- ICT Linkedin | Detailed Market research Methodology Our methodology involves a mix of primary research, including interviews with leading mental health experts, and secondary research from reputable medical journals and databases. View Detailed Methodology Page
-
Quick Navigation
- Report Overview
- Marine VFD Market Dynamics
- Marine VFD Market Segmentation Analysis
- Marine VFD Industry Segments
- Marine VFD Market Growth Opportunity
- Marine VFD Market Regional Analysis
- Marine VFD Industry By Region
- Marine VFD Market Share Analysis
- Marine VFD Industry Key Players
- Marine VFD Market Recent Development
- Report Scope
Report Overview
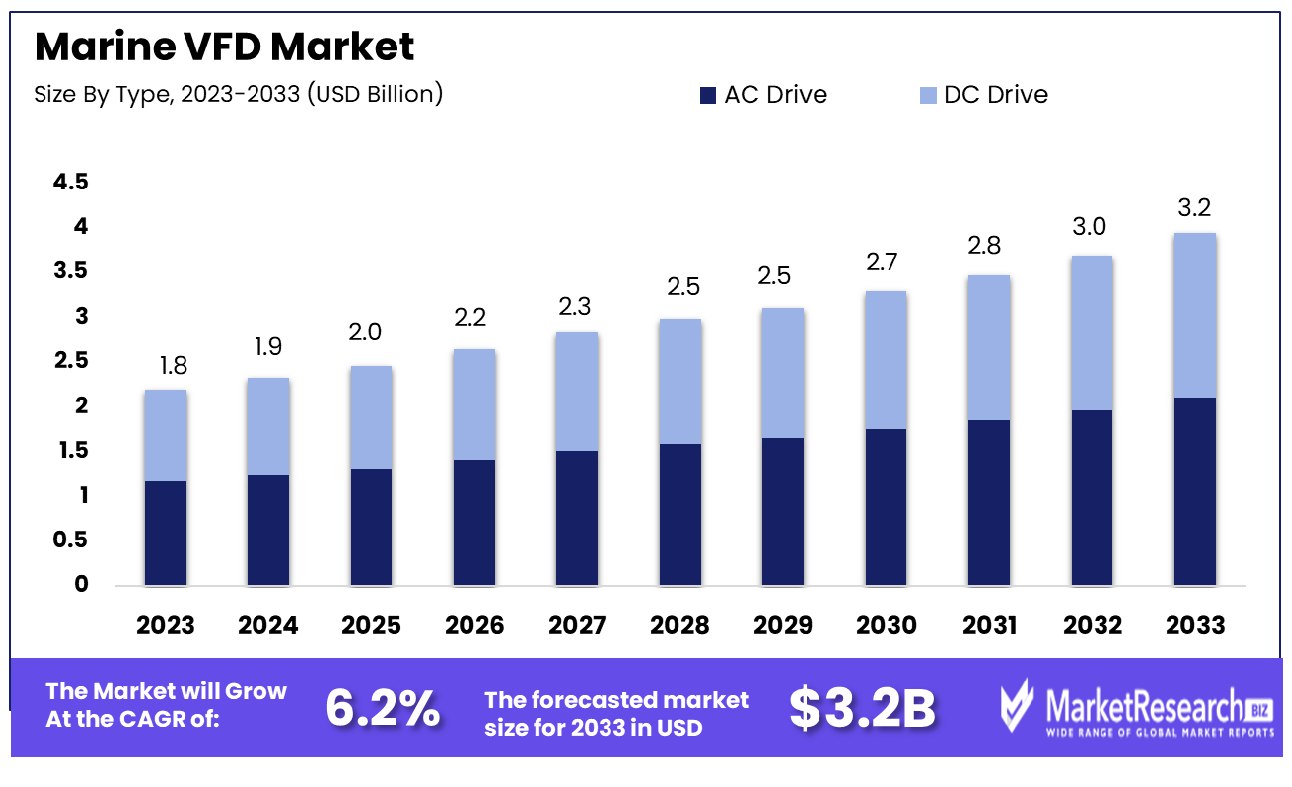
The marine VFD market was valued at USD 1.8 billion in 2023. It is expected to reach USD 3.2 billion by 2033, with a CAGR of 6.2% during the forecast period from 2024 to 2033.
The surge in demand for the shipbuilding industry and rapid industrialization are some of the main driving factors for the marine VFD market expansion. The marine variable frequency drives (VFD) play a vital role in the marine sector as they control the speed and torque of the motors so that they can function properly as per demand. A VFD is a type of motor regulator that drives an electric motor by changing the frequency and voltage of its power distribution. The VFD also can regulate the up and down of motor functionality during start and stop, respectively.
Marine VFD offers precise regulation of the pressure, speed, and flow of the water. It also consumes 50% of the energy. There are several ways to consume energy by using various frequency drives that depend on the type of application. Variable torque applications like fans and pumps use variable-torque applications to lower energy consumption by simply decreasing speed, leading to significant savings on energy use. Variable-torque applications include fans and pumps.
The speed and torque work simultaneously; if one of the applications increases, the other also increases. Less speed in the motor will require less torque, which signifies the consumption of less energy and current at the same time. VFD (variable frequency drive) equipment is used to change the speed of 3-phase induction motors by altering their power frequency; its effects are directly tied to how quickly their speed changes.
The marine industry is rapidly increasing and adopting new and innovative technologies to improve efficacy, decrease environmental effects, and boost safety. Marine CFD is the most important equipment for such types of transformations. These VFDs, also called inverter drives, offer a variety of advantages for the ships, which makes them an integral part of modern marine operations.
VFDs are mainly used to control the speed of the electric motors offering power to the various ship systems and equipment, which comprises auxiliary machinery, ventilation, and cargo handling equipment. Due to rising demands in the maritime industry, VFD demand will grow in the coming years and help expand market reach.
Marine VFD Market Dynamics
Energy Efficiency Spurs Marine VFD Market
The marine VFD (Variable Frequency Drive) key market is experiencing robust growth, primarily driven by the increasing demand for energy-efficient systems in maritime vessels. The marine industry, traditionally energy-intensive, is undergoing a paradigm shift towards sustainability, with VFDs playing a pivotal role. VFDs enable precise motor speed control, significantly reducing energy consumption and operational costs. This efficiency is crucial in maritime operations where fuel cost and energy usage are significant expenses.
As shipping companies and naval forces prioritize energy conservation and cost reduction, the adoption of VFDs has become more prevalent. This trend is not just a response to economic factors but also a part of the broader industry move towards sustainable practices. The marine VFD market's growth trajectory is expected to continue as the global maritime sector intensifies its focus on energy efficiency.
Electric and Hybrid Propulsion Systems Catalyze Marine VFD Growth
Marine VFD manufacturers see immense market potential from the rise of electric and hybrid propulsion systems on ships, opening up ample market opportunities. These propulsion systems, integral to the modernization of marine transportation, rely heavily on VFDs for efficient operation. VFDs facilitate the optimal use of electric power in hybrid systems, enhancing performance while minimizing energy waste.
This trend reflects a shift in the marine industry towards more environmentally friendly and efficient technologies, with VFDs being a cornerstone technology. The move towards electric and hybrid vessels is accelerated by factors such as emission regulations and fuel cost concerns. As more maritime operators transition to these advanced propulsion systems, the demand for VFDs is expected to surge, positioning them as a key component in the evolution of marine propulsion technology.
Offshore Wind Energy Boosts Demand for Marine VFDs
Marine energy innovations, specifically offshore wind power, have driven an upswing in VFD usage within the marine industry. As offshore wind projects proliferate, there's an increasing need for specialized marine vessels equipped with VFDs. These vessels require precise power control for operations like turbine installation and maintenance, where VFDs ensure optimal performance.
The growth of offshore wind energy reflects the global shift towards renewable energy sources, with marine VFDs playing a crucial role in enabling these projects. The integration of VFDs in marine energy applications not only enhances operational efficiency but also contributes to environmental sustainability. This trend signifies a growing intersection between the marine industry and the marine renewable energy sector, with VFDs being pivotal in the operational success of offshore wind energy projects.
Evolving Regulatory Scenarios Challenge Marine VFD Market Growth
Evolving regulatory scenarios can pose challenges and uncertainties for market players in the marine VFD market. As governments and international bodies introduce new regulations to improve maritime efficiency and reduce emissions, VFD manufacturers and ship operators must continually adapt. These changes can lead to uncertainties and delays in investment as companies assess the impact of regulations and ensure compliance. The cost and effort to stay abreast of and meet these evolving standards can be significant, potentially slowing down decision-making and implementation of VFD technologies.
Retrofitting Challenges Impact Growth of Marine VFD Market
The potential for retrofitting existing marine vessels with Variable Frequency Drives (VFDs) may pose technical and logistical challenges, impacting market analysis. Many older ships were not designed with VFDs in mind, and integrating these systems can require significant modifications. These can include spatial adjustments, electrical system overhauls, and even structural changes, all of which can be costly and complex. The technical difficulties and potential downtime for retrofitting may deter some vessel owners, particularly if the perceived benefits do not outweigh the immediate costs and operational disruptions.
Marine VFD Market Segmentation Analysis
By Type Analysis
In the marine VFD market, AC Drives emerge as the dominant segment. Their widespread adoption is primarily due to the extensive use of AC motors in marine applications, coupled with the increasing demand for energy efficiency and precise motor control on ships. AC drives segment provides significant advantages in terms of reducing energy consumption, improving system reliability, and extending the life of the motor and other equipment by controlling the speed and torque of the motor.
While AC Drives lead due to their versatility and energy efficiency, DC Drives also hold a significant position in the market. DC drives are used in specific applications where they offer benefits in terms of simpler speed control and a lower initial cost.
By Voltage Analysis
Low Voltage drives are the dominant segment in the marine VFD market. Most onboard applications, including pumps, fans, and compressors, operate at low voltage, making these drives a ubiquitous choice for marine operations. Low Voltage VFDs are preferred for their cost-effectiveness, ease of installation, and sufficient capacity to meet the power needs of a wide range of marine equipment.
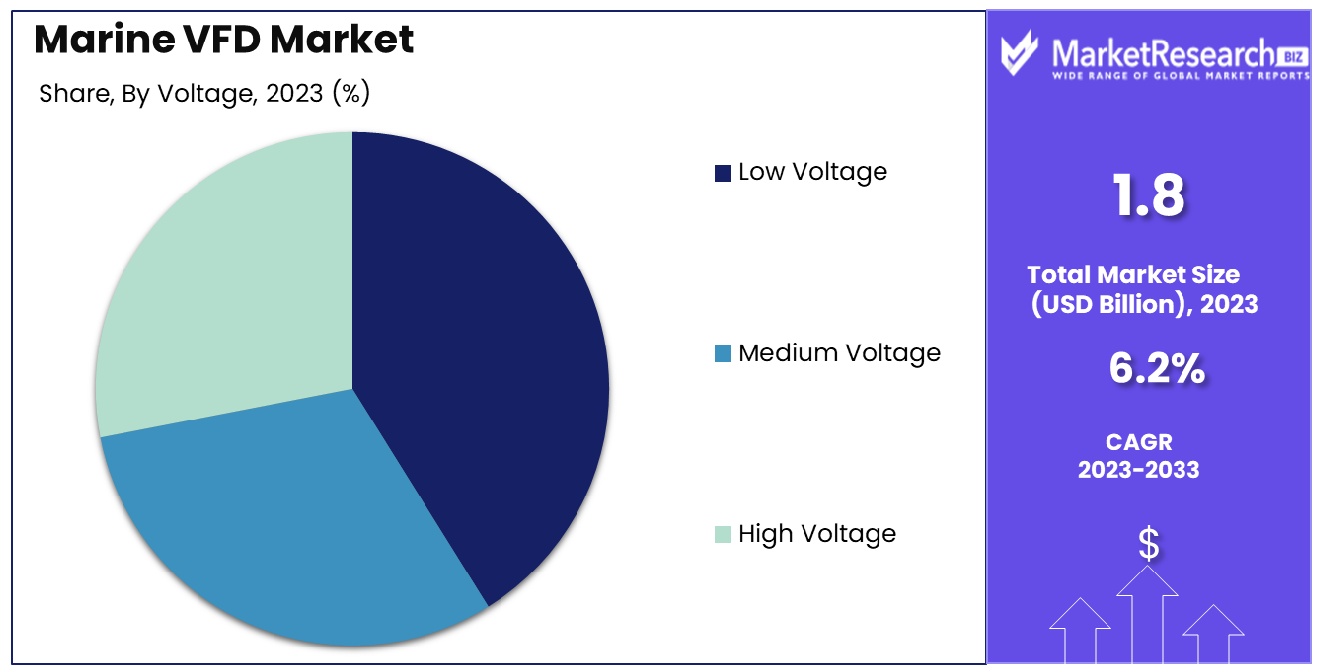
While Low Voltage drives lead, Medium and High Voltage VFDs are also essential, particularly for larger ships and more demanding applications requiring higher power ratings. These drives are typically used in propulsion systems and other high-power applications.
By Application Analysis
The pump segment is the primary application for VFDs in marine settings. VFDs are extensively used to control the speed and operation of pumps on ships, which are crucial for various tasks, including ballasting, cooling, and bilge operations. By adjusting the pump's speed as needed, VFDs help optimize energy consumption, reduce wear and tear, and improve the overall efficiency of the pumping system.
While pumps lead in VFD applications, Fans, Compressors, Propellers, and Shaft Generators are also significant. Fans and compressors are essential for ventilation and refrigeration, and their efficiency and operational flexibility are greatly enhanced by VFDs. VFDs in propeller and shaft generator applications contribute to better fuel efficiency and reduced emissions by optimizing speed and power.
Marine VFD Industry Segments
By Type
- AC Drive
- DC Drive
By Voltage
- Low Voltage
- Medium Voltage
- High Voltage
By Application
- Pump
- Fan
- Compressor
- Propeller
- With Shaft Generator
Marine VFD Market Growth Opportunity
Shipbuilding Industry Expansion Accelerates Marine VFD Market Growth
The rapid expansion of the shipbuilding industry, particularly in the Asia-Pacific region, is expected to expedite marine Variable Frequency Drive (VFD) market growth. The presence of numerous shipping companies and shipyards in this region, coupled with increasing commercial and defense maritime activities, creates a high demand for modern vessels equipped with advanced technologies like VFDs.
These devices are essential for enhancing operational efficiency, controlling the speed of electric motors, and reducing energy consumption. As the shipbuilding industry continues to grow, especially in Asia-Pacific, the demand for marine VFDs is expected to rise, presenting significant market opportunities.
Technological Advancements Propel Marine VFD Market
Consistent innovations in marine VFD technologies should increase market growth. New VFD innovations, including enhancements in energy efficiency, durability, and system integration are anticipated to drive adoption by marine applications.
Manufacturers investing in research and development to produce more sophisticated, reliable, and energy-efficient VFDs may further fuel market expansion in this sector. The ongoing technological evolution in VFDs indicates a growing market driven by the need for advanced solutions that can meet the increasingly complex demands of the marine industry.
Marine VFD Market Regional Analysis
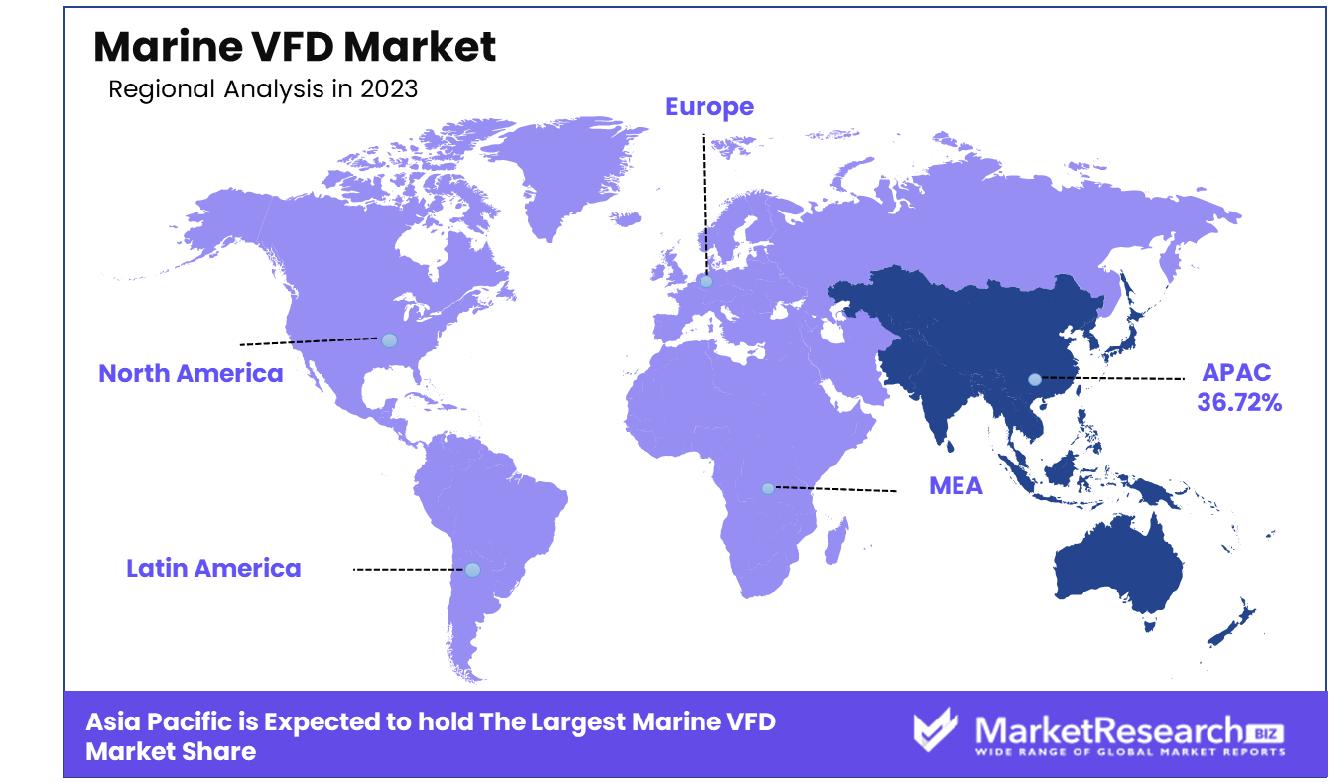
Asia-Pacific Dominates with 36.72% Market Share in Marine VFD Market
Asia-Pacific's significant 36.72% share in the marine variable frequency drive (VFD) market is primarily driven by the region's robust shipbuilding industry, particularly in countries like China, South Korea, and Japan. These nations are known for their large-scale and technologically advanced shipbuilding facilities, necessitating the use of VFDs to enhance operational efficiency and energy management. The increasing focus on energy-efficient and environmentally friendly marine operations also contributes to the high market share. Additionally, the region's expanding maritime trade and the growing offshore energy exploration activities fuel the demand for VFDs in various marine applications.
The rising need for fuel-efficient and low-emission vessels drives the demand for VFDs, which play a crucial role in optimizing power consumption and reducing operational costs. Moreover, the region's stringent environmental regulations and the international maritime community's focus on reducing greenhouse gas emissions encourage the adoption of advanced technologies like VFDs.
North America: Advanced Technology Adoption and Regulatory Compliance
North America's marine VFD market is driven by advanced technology adoption and stringent regulatory compliance, particularly in the United States and Canada. The region's focus on enhancing maritime safety and operational efficiency supports the demand for VFDs. The presence of a large commercial and naval fleet, along with the growing offshore energy sector, contributes to market growth.
Europe: Focus on Innovation and Environmental Sustainability
Europe’s marine VFD market is characterized by a strong focus on innovation and environmental sustainability. The region's well-established maritime industry and the emphasis on reducing carbon emissions drive the demand for energy-efficient VFD solutions. Renewable offshore energy investments and the modernization of aging vessels offer the marine VFD market a tremendous opportunity. Europe is known to uphold high standards and innovate within marine technology; both factors will likely drive market expansion across this region.
Marine VFD Industry By Region
North America
- The US
- Canada
- Rest of North America
Europe
- Germany
- France
- The UK
- Spain
- Italy
- Russia
- Netherlands
- Rest of Europe
Asia-Pacific
- China
- Japan
- South Korea
- India
- New Zealand
- Singapore
- Thailand
- Vietnam
- Rest of Asia Pacific
Latin America
- Brazil
- Mexico
- Rest of Latin America
Middle East & Africa
- South Africa
- Saudi Arabia
- UAE
- Rest of Middle East & Africa
Marine Variable Frequency Drive (VFD) Market companies listed here play an essential role in driving innovation and sustainability within marine operations. Siemens and ABB are industry leaders, known for their advanced VFD technologies and global service networks. Their strategic positioning emphasizes energy efficiency, durability, and system integration, significantly influencing marine propulsion and power management trends.
General Electric and Danfoss are key players with a strong focus on innovative and eco-friendly marine solutions, reflecting the industry's shift towards more sustainable and fuel-efficient operations. Rockwell Automation and Schneider Electric contribute with their robust automation and control systems, enhancing the performance and reliability of marine applications.
NIDEC and WEG, recognized for their wide range of electric components, play crucial roles in the market by offering VFDs that cater to various marine needs, from small vessels to large ships. Ingeteam and Johnson Controls, with their specialized solutions, demonstrate the market's potential for tailored and advanced energy management systems.
Marine VFD Industry Key Players
- Siemens (Germany)
- General Electric (US)
- Danfoss (Denmark)
- ABB (Switzerland)
- Rockwell Automation (US)
- Schneider Electric (France)
- NIDEC (Japan), WEG (Brazil)
- Ingeteam (Spain)
- Triol (Colombia)
- CG Power and Industrial Solutions (India)
- LS Electronics Co., Ltd. (South Korea)
- Johnson Controls (US)
- Honeywell (US)
- Parker Hannifin (US)
- Invertek Drives (UK)
- SELMA (Greece)
- HI-SEA (China)
- Bosch Rexroth (Germany)
- Yaskawa Electric Corporation
Marine VFD Market Recent Development
- In May 2023, GE Power Conversion signed an agreement to renew its partnership with Nedstack Fuel Cell Technology for the development of marine fuel cell solutions. The agreement follows on from a previous cooperation agreement for collaborative work. A pilot project for a large-scale marine fuel cell application provided valuable feasibility support to a cruise provider for their technical and commercial evaluation of decarbonization solutions.
- In June 2022, ABB led a consortium to implement shore-to-ship power connections for ferries and cruise ships at the port of Toulon. ABB’s technology reduces emissions and noise during port stops. Additionally, ABB is installing an energy storage system to handle grid demand fluctuations and incorporate renewable energy sources, ensuring a sustainable and efficient solution.
Report Scope
Report Features Description Market Value (2023) USD 1.8 Billion Forecast Revenue (2033) USD 3.2 Billion CAGR (2024-2032) 6.2% Base Year for Estimation 2023 Historic Period 2016-2023 Forecast Period 2024-2033 Report Coverage Revenue Forecast, Market Dynamics, COVID-19 Impact, Competitive Landscape, Recent Developments Segments Covered By Type(AC Drive, DC Drive), By Voltage(Low Voltage, Medium Voltage, High Voltage), By Application(Pump, Fan, Compressor, Propeller, With Shaft Generator) Regional Analysis North America - The US, Canada, Rest of North America, Europe - Germany, France, The UK, Spain, Italy, Russia, Netherlands, Rest of Europe, Asia-Pacific - China, Japan, South Korea, India, New Zealand, Singapore, Thailand, Vietnam, Rest of Asia Pacific, Latin America - Brazil, Mexico, Rest of Latin America, Middle East & Africa - South Africa, Saudi Arabia, UAE, Rest of Middle East & Africa Competitive Landscape Siemens (Germany), General Electric (US), Danfoss (Denmark), ABB (Switzerland), Rockwell Automation (US), Schneider Electric (France), NIDEC (Japan), WEG (Brazil), Ingeteam (Spain), Triol (Colombia), CG Power and Industrial Solutions (India), LS Electronics Co., Ltd. (South Korea), Johnson Controls (US), Honeywell (US), Parker Hannifin (US), Invertek Drives (UK), SELMA (Greece), HI-SEA (China), Bosch Rexroth (Germany), Yaskawa Electric Corporation Customization Scope Customization for segments, region/country-level will be provided. Moreover, additional customization can be done based on the requirements. Purchase Options We have three licenses to opt for Single User License, Multi-User License (Up to 5 Users), Corporate Use License (Unlimited User and Printable PDF) -
- 1. Executive Summary
- 1.1. Definition
- 1.2. Taxonomy
- 1.3. Research Scope
- 1.4. Key Analysis
- 1.5. Key Findings by Major Segments
- 1.6. Top strategies by Major Players
- 2. Global Marine VFD Market Overview
- 2.1. Marine VFD Market Dynamics
- 2.1.1. Drivers
- 2.1.2. Opportunities
- 2.1.3. Restraints
- 2.1.4. Challenges
- 2.2. Macro-economic Factors
- 2.3. Regulatory Framework
- 2.4. Market Investment Feasibility Index
- 2.5. PEST Analysis
- 2.6. PORTER’S Five Force Analysis
- 2.7. Drivers & Restraints Impact Analysis
- 2.8. Industry Chain Analysis
- 2.9. Cost Structure Analysis
- 2.10. Marketing Strategy
- 2.11. Russia-Ukraine War Impact Analysis
- 2.12. Opportunity Map Analysis
- 2.13. Market Competition Scenario Analysis
- 2.14. Product Life Cycle Analysis
- 2.15. Opportunity Orbits
- 2.16. Manufacturer Intensity Map
- 2.17. Major Companies sales by Value & Volume
- 2.1. Marine VFD Market Dynamics
- 3. Global Marine VFD Market Analysis, Opportunity and Forecast, 2016-2032
- 3.1. Global Marine VFD Market Analysis, 2016-2021
- 3.2. Global Marine VFD Market Opportunity and Forecast, 2023-2032
- 3.3. Global Marine VFD Market Analysis, Opportunity and Forecast, By By Type, 2016-2032
- 3.3.1. Global Marine VFD Market Analysis by By Type: Introduction
- 3.3.2. Market Size Absolute $ Opportunity Analysis and Forecast, By By Type, 2016-2032
- 3.3.3. AC Drive
- 3.3.4. DC Drive
- 3.4. Global Marine VFD Market Analysis, Opportunity and Forecast, By By Voltage, 2016-2032
- 3.4.1. Global Marine VFD Market Analysis by By Voltage: Introduction
- 3.4.2. Market Size Absolute $ Opportunity Analysis and Forecast, By By Voltage, 2016-2032
- 3.4.3. Low Voltage
- 3.4.4. Medium Voltage
- 3.4.5. High Voltage
- 3.5. Global Marine VFD Market Analysis, Opportunity and Forecast, By By Application, 2016-2032
- 3.5.1. Global Marine VFD Market Analysis by By Application: Introduction
- 3.5.2. Market Size Absolute $ Opportunity Analysis and Forecast, By By Application, 2016-2032
- 3.5.3. Pump
- 3.5.4. Fan
- 3.5.5. Compressor
- 3.5.6. Propeller
- 3.5.7. With Shaft Generator
- 4. North America Marine VFD Market Analysis, Opportunity and Forecast, 2016-2032
- 4.1. North America Marine VFD Market Analysis, 2016-2021
- 4.2. North America Marine VFD Market Opportunity and Forecast, 2023-2032
- 4.3. North America Marine VFD Market Analysis, Opportunity and Forecast, By By Type, 2016-2032
- 4.3.1. North America Marine VFD Market Analysis by By Type: Introduction
- 4.3.2. Market Size Absolute $ Opportunity Analysis and Forecast, By By Type, 2016-2032
- 4.3.3. AC Drive
- 4.3.4. DC Drive
- 4.4. North America Marine VFD Market Analysis, Opportunity and Forecast, By By Voltage, 2016-2032
- 4.4.1. North America Marine VFD Market Analysis by By Voltage: Introduction
- 4.4.2. Market Size Absolute $ Opportunity Analysis and Forecast, By By Voltage, 2016-2032
- 4.4.3. Low Voltage
- 4.4.4. Medium Voltage
- 4.4.5. High Voltage
- 4.5. North America Marine VFD Market Analysis, Opportunity and Forecast, By By Application, 2016-2032
- 4.5.1. North America Marine VFD Market Analysis by By Application: Introduction
- 4.5.2. Market Size Absolute $ Opportunity Analysis and Forecast, By By Application, 2016-2032
- 4.5.3. Pump
- 4.5.4. Fan
- 4.5.5. Compressor
- 4.5.6. Propeller
- 4.5.7. With Shaft Generator
- 4.6. North America Marine VFD Market Analysis, Opportunity and Forecast, By Country , 2016-2032
- 4.6.1. North America Marine VFD Market Analysis by Country : Introduction
- 4.6.2. Market Size Absolute $ Opportunity Analysis and Forecast, Country , 2016-2032
- 4.6.2.1. The US
- 4.6.2.2. Canada
- 4.6.2.3. Mexico
- 5. Western Europe Marine VFD Market Analysis, Opportunity and Forecast, 2016-2032
- 5.1. Western Europe Marine VFD Market Analysis, 2016-2021
- 5.2. Western Europe Marine VFD Market Opportunity and Forecast, 2023-2032
- 5.3. Western Europe Marine VFD Market Analysis, Opportunity and Forecast, By By Type, 2016-2032
- 5.3.1. Western Europe Marine VFD Market Analysis by By Type: Introduction
- 5.3.2. Market Size Absolute $ Opportunity Analysis and Forecast, By By Type, 2016-2032
- 5.3.3. AC Drive
- 5.3.4. DC Drive
- 5.4. Western Europe Marine VFD Market Analysis, Opportunity and Forecast, By By Voltage, 2016-2032
- 5.4.1. Western Europe Marine VFD Market Analysis by By Voltage: Introduction
- 5.4.2. Market Size Absolute $ Opportunity Analysis and Forecast, By By Voltage, 2016-2032
- 5.4.3. Low Voltage
- 5.4.4. Medium Voltage
- 5.4.5. High Voltage
- 5.5. Western Europe Marine VFD Market Analysis, Opportunity and Forecast, By By Application, 2016-2032
- 5.5.1. Western Europe Marine VFD Market Analysis by By Application: Introduction
- 5.5.2. Market Size Absolute $ Opportunity Analysis and Forecast, By By Application, 2016-2032
- 5.5.3. Pump
- 5.5.4. Fan
- 5.5.5. Compressor
- 5.5.6. Propeller
- 5.5.7. With Shaft Generator
- 5.6. Western Europe Marine VFD Market Analysis, Opportunity and Forecast, By Country , 2016-2032
- 5.6.1. Western Europe Marine VFD Market Analysis by Country : Introduction
- 5.6.2. Market Size Absolute $ Opportunity Analysis and Forecast, Country , 2016-2032
- 5.6.2.1. Germany
- 5.6.2.2. France
- 5.6.2.3. The UK
- 5.6.2.4. Spain
- 5.6.2.5. Italy
- 5.6.2.6. Portugal
- 5.6.2.7. Ireland
- 5.6.2.8. Austria
- 5.6.2.9. Switzerland
- 5.6.2.10. Benelux
- 5.6.2.11. Nordic
- 5.6.2.12. Rest of Western Europe
- 6. Eastern Europe Marine VFD Market Analysis, Opportunity and Forecast, 2016-2032
- 6.1. Eastern Europe Marine VFD Market Analysis, 2016-2021
- 6.2. Eastern Europe Marine VFD Market Opportunity and Forecast, 2023-2032
- 6.3. Eastern Europe Marine VFD Market Analysis, Opportunity and Forecast, By By Type, 2016-2032
- 6.3.1. Eastern Europe Marine VFD Market Analysis by By Type: Introduction
- 6.3.2. Market Size Absolute $ Opportunity Analysis and Forecast, By By Type, 2016-2032
- 6.3.3. AC Drive
- 6.3.4. DC Drive
- 6.4. Eastern Europe Marine VFD Market Analysis, Opportunity and Forecast, By By Voltage, 2016-2032
- 6.4.1. Eastern Europe Marine VFD Market Analysis by By Voltage: Introduction
- 6.4.2. Market Size Absolute $ Opportunity Analysis and Forecast, By By Voltage, 2016-2032
- 6.4.3. Low Voltage
- 6.4.4. Medium Voltage
- 6.4.5. High Voltage
- 6.5. Eastern Europe Marine VFD Market Analysis, Opportunity and Forecast, By By Application, 2016-2032
- 6.5.1. Eastern Europe Marine VFD Market Analysis by By Application: Introduction
- 6.5.2. Market Size Absolute $ Opportunity Analysis and Forecast, By By Application, 2016-2032
- 6.5.3. Pump
- 6.5.4. Fan
- 6.5.5. Compressor
- 6.5.6. Propeller
- 6.5.7. With Shaft Generator
- 6.6. Eastern Europe Marine VFD Market Analysis, Opportunity and Forecast, By Country , 2016-2032
- 6.6.1. Eastern Europe Marine VFD Market Analysis by Country : Introduction
- 6.6.2. Market Size Absolute $ Opportunity Analysis and Forecast, Country , 2016-2032
- 6.6.2.1. Russia
- 6.6.2.2. Poland
- 6.6.2.3. The Czech Republic
- 6.6.2.4. Greece
- 6.6.2.5. Rest of Eastern Europe
- 7. APAC Marine VFD Market Analysis, Opportunity and Forecast, 2016-2032
- 7.1. APAC Marine VFD Market Analysis, 2016-2021
- 7.2. APAC Marine VFD Market Opportunity and Forecast, 2023-2032
- 7.3. APAC Marine VFD Market Analysis, Opportunity and Forecast, By By Type, 2016-2032
- 7.3.1. APAC Marine VFD Market Analysis by By Type: Introduction
- 7.3.2. Market Size Absolute $ Opportunity Analysis and Forecast, By By Type, 2016-2032
- 7.3.3. AC Drive
- 7.3.4. DC Drive
- 7.4. APAC Marine VFD Market Analysis, Opportunity and Forecast, By By Voltage, 2016-2032
- 7.4.1. APAC Marine VFD Market Analysis by By Voltage: Introduction
- 7.4.2. Market Size Absolute $ Opportunity Analysis and Forecast, By By Voltage, 2016-2032
- 7.4.3. Low Voltage
- 7.4.4. Medium Voltage
- 7.4.5. High Voltage
- 7.5. APAC Marine VFD Market Analysis, Opportunity and Forecast, By By Application, 2016-2032
- 7.5.1. APAC Marine VFD Market Analysis by By Application: Introduction
- 7.5.2. Market Size Absolute $ Opportunity Analysis and Forecast, By By Application, 2016-2032
- 7.5.3. Pump
- 7.5.4. Fan
- 7.5.5. Compressor
- 7.5.6. Propeller
- 7.5.7. With Shaft Generator
- 7.6. APAC Marine VFD Market Analysis, Opportunity and Forecast, By Country , 2016-2032
- 7.6.1. APAC Marine VFD Market Analysis by Country : Introduction
- 7.6.2. Market Size Absolute $ Opportunity Analysis and Forecast, Country , 2016-2032
- 7.6.2.1. China
- 7.6.2.2. Japan
- 7.6.2.3. South Korea
- 7.6.2.4. India
- 7.6.2.5. Australia & New Zeland
- 7.6.2.6. Indonesia
- 7.6.2.7. Malaysia
- 7.6.2.8. Philippines
- 7.6.2.9. Singapore
- 7.6.2.10. Thailand
- 7.6.2.11. Vietnam
- 7.6.2.12. Rest of APAC
- 8. Latin America Marine VFD Market Analysis, Opportunity and Forecast, 2016-2032
- 8.1. Latin America Marine VFD Market Analysis, 2016-2021
- 8.2. Latin America Marine VFD Market Opportunity and Forecast, 2023-2032
- 8.3. Latin America Marine VFD Market Analysis, Opportunity and Forecast, By By Type, 2016-2032
- 8.3.1. Latin America Marine VFD Market Analysis by By Type: Introduction
- 8.3.2. Market Size Absolute $ Opportunity Analysis and Forecast, By By Type, 2016-2032
- 8.3.3. AC Drive
- 8.3.4. DC Drive
- 8.4. Latin America Marine VFD Market Analysis, Opportunity and Forecast, By By Voltage, 2016-2032
- 8.4.1. Latin America Marine VFD Market Analysis by By Voltage: Introduction
- 8.4.2. Market Size Absolute $ Opportunity Analysis and Forecast, By By Voltage, 2016-2032
- 8.4.3. Low Voltage
- 8.4.4. Medium Voltage
- 8.4.5. High Voltage
- 8.5. Latin America Marine VFD Market Analysis, Opportunity and Forecast, By By Application, 2016-2032
- 8.5.1. Latin America Marine VFD Market Analysis by By Application: Introduction
- 8.5.2. Market Size Absolute $ Opportunity Analysis and Forecast, By By Application, 2016-2032
- 8.5.3. Pump
- 8.5.4. Fan
- 8.5.5. Compressor
- 8.5.6. Propeller
- 8.5.7. With Shaft Generator
- 8.6. Latin America Marine VFD Market Analysis, Opportunity and Forecast, By Country , 2016-2032
- 8.6.1. Latin America Marine VFD Market Analysis by Country : Introduction
- 8.6.2. Market Size Absolute $ Opportunity Analysis and Forecast, Country , 2016-2032
- 8.6.2.1. Brazil
- 8.6.2.2. Colombia
- 8.6.2.3. Chile
- 8.6.2.4. Argentina
- 8.6.2.5. Costa Rica
- 8.6.2.6. Rest of Latin America
- 9. Middle East & Africa Marine VFD Market Analysis, Opportunity and Forecast, 2016-2032
- 9.1. Middle East & Africa Marine VFD Market Analysis, 2016-2021
- 9.2. Middle East & Africa Marine VFD Market Opportunity and Forecast, 2023-2032
- 9.3. Middle East & Africa Marine VFD Market Analysis, Opportunity and Forecast, By By Type, 2016-2032
- 9.3.1. Middle East & Africa Marine VFD Market Analysis by By Type: Introduction
- 9.3.2. Market Size Absolute $ Opportunity Analysis and Forecast, By By Type, 2016-2032
- 9.3.3. AC Drive
- 9.3.4. DC Drive
- 9.4. Middle East & Africa Marine VFD Market Analysis, Opportunity and Forecast, By By Voltage, 2016-2032
- 9.4.1. Middle East & Africa Marine VFD Market Analysis by By Voltage: Introduction
- 9.4.2. Market Size Absolute $ Opportunity Analysis and Forecast, By By Voltage, 2016-2032
- 9.4.3. Low Voltage
- 9.4.4. Medium Voltage
- 9.4.5. High Voltage
- 9.5. Middle East & Africa Marine VFD Market Analysis, Opportunity and Forecast, By By Application, 2016-2032
- 9.5.1. Middle East & Africa Marine VFD Market Analysis by By Application: Introduction
- 9.5.2. Market Size Absolute $ Opportunity Analysis and Forecast, By By Application, 2016-2032
- 9.5.3. Pump
- 9.5.4. Fan
- 9.5.5. Compressor
- 9.5.6. Propeller
- 9.5.7. With Shaft Generator
- 9.6. Middle East & Africa Marine VFD Market Analysis, Opportunity and Forecast, By Country , 2016-2032
- 9.6.1. Middle East & Africa Marine VFD Market Analysis by Country : Introduction
- 9.6.2. Market Size Absolute $ Opportunity Analysis and Forecast, Country , 2016-2032
- 9.6.2.1. Algeria
- 9.6.2.2. Egypt
- 9.6.2.3. Israel
- 9.6.2.4. Kuwait
- 9.6.2.5. Nigeria
- 9.6.2.6. Saudi Arabia
- 9.6.2.7. South Africa
- 9.6.2.8. Turkey
- 9.6.2.9. The UAE
- 9.6.2.10. Rest of MEA
- 10. Global Marine VFD Market Analysis, Opportunity and Forecast, By Region , 2016-2032
- 10.1. Global Marine VFD Market Analysis by Region : Introduction
- 10.2. Market Size Absolute $ Opportunity Analysis and Forecast, By Region , 2016-2032
- 10.2.1. North America
- 10.2.2. Western Europe
- 10.2.3. Eastern Europe
- 10.2.4. APAC
- 10.2.5. Latin America
- 10.2.6. Middle East & Africa
- 11. Global Marine VFD Market Competitive Landscape, Market Share Analysis, and Company Profiles
- 11.1. Market Share Analysis
- 11.2. Company Profiles
- 11.3. Siemens (Germany)
- 11.3.1. Company Overview
- 11.3.2. Financial Highlights
- 11.3.3. Product Portfolio
- 11.3.4. SWOT Analysis
- 11.3.5. Key Strategies and Developments
- 11.4. General Electric (US)
- 11.4.1. Company Overview
- 11.4.2. Financial Highlights
- 11.4.3. Product Portfolio
- 11.4.4. SWOT Analysis
- 11.4.5. Key Strategies and Developments
- 11.5. Danfoss (Denmark)
- 11.5.1. Company Overview
- 11.5.2. Financial Highlights
- 11.5.3. Product Portfolio
- 11.5.4. SWOT Analysis
- 11.5.5. Key Strategies and Developments
- 11.6. ABB (Switzerland)
- 11.6.1. Company Overview
- 11.6.2. Financial Highlights
- 11.6.3. Product Portfolio
- 11.6.4. SWOT Analysis
- 11.6.5. Key Strategies and Developments
- 11.7. Rockwell Automation (US)
- 11.7.1. Company Overview
- 11.7.2. Financial Highlights
- 11.7.3. Product Portfolio
- 11.7.4. SWOT Analysis
- 11.7.5. Key Strategies and Developments
- 11.8. Schneider Electric (France)
- 11.8.1. Company Overview
- 11.8.2. Financial Highlights
- 11.8.3. Product Portfolio
- 11.8.4. SWOT Analysis
- 11.8.5. Key Strategies and Developments
- 11.9. NIDEC (Japan), WEG (Brazil)
- 11.9.1. Company Overview
- 11.9.2. Financial Highlights
- 11.9.3. Product Portfolio
- 11.9.4. SWOT Analysis
- 11.9.5. Key Strategies and Developments
- 11.10. Ingeteam (Spain)
- 11.10.1. Company Overview
- 11.10.2. Financial Highlights
- 11.10.3. Product Portfolio
- 11.10.4. SWOT Analysis
- 11.10.5. Key Strategies and Developments
- 11.11. Triol (Colombia)
- 11.11.1. Company Overview
- 11.11.2. Financial Highlights
- 11.11.3. Product Portfolio
- 11.11.4. SWOT Analysis
- 11.11.5. Key Strategies and Developments
- 11.12. CG Power and Industrial Solutions (India)
- 11.12.1. Company Overview
- 11.12.2. Financial Highlights
- 11.12.3. Product Portfolio
- 11.12.4. SWOT Analysis
- 11.12.5. Key Strategies and Developments
- 11.13.1. Company Overview
- 11.13.2. Financial Highlights
- 11.13.3. Product Portfolio
- 11.13.4. SWOT Analysis
- 11.13.5. Key Strategies and Developments
- 11.14. LS Electronics Co., Ltd. (South Korea)
- 11.14.1. Company Overview
- 11.14.2. Financial Highlights
- 11.14.3. Product Portfolio
- 11.14.4. SWOT Analysis
- 11.14.5. Key Strategies and Developments
- 11.15. Honeywell (US)
- 11.15.1. Company Overview
- 11.15.2. Financial Highlights
- 11.15.3. Product Portfolio
- 11.15.4. SWOT Analysis
- 11.15.5. Key Strategies and Developments
- 11.16. Parker Hannifin (US)
- 11.16.1. Company Overview
- 11.16.2. Financial Highlights
- 11.16.3. Product Portfolio
- 11.16.4. SWOT Analysis
- 11.16.5. Key Strategies and Developments
- 11.17. Invertek Drives (UK)
- 11.17.1. Company Overview
- 11.17.2. Financial Highlights
- 11.17.3. Product Portfolio
- 11.17.4. SWOT Analysis
- 11.17.5. Key Strategies and Developments
- 11.18. SELMA (Greece)
- 11.18.1. Company Overview
- 11.18.2. Financial Highlights
- 11.18.3. Product Portfolio
- 11.18.4. SWOT Analysis
- 11.18.5. Key Strategies and Developments
- 11.19. HI-SEA (China)
- 11.19.1. Company Overview
- 11.19.2. Financial Highlights
- 11.19.3. Product Portfolio
- 11.19.4. SWOT Analysis
- 11.19.5. Key Strategies and Developments
- 11.20. Bosch Rexroth (Germany)
- 11.20.1. Company Overview
- 11.20.2. Financial Highlights
- 11.20.3. Product Portfolio
- 11.20.4. SWOT Analysis
- 11.20.5. Key Strategies and Developments
- 11.21. Yaskawa Electric Corporation
- 11.21.1. Company Overview
- 11.21.2. Financial Highlights
- 11.21.3. Product Portfolio
- 11.21.4. SWOT Analysis
- 11.21.5. Key Strategies and Developments
- 12. Assumptions and Acronyms
- 13. Research Methodology
- 14. Contact
"
- List of Figures
- "
- Figure 1: Global Marine VFD Market Revenue (US$ Mn) Market Share by By Type in 2022
- Figure 2: Global Marine VFD Market Market Attractiveness Analysis by By Type, 2016-2032
- Figure 3: Global Marine VFD Market Revenue (US$ Mn) Market Share by By Voltagein 2022
- Figure 4: Global Marine VFD Market Market Attractiveness Analysis by By Voltage, 2016-2032
- Figure 5: Global Marine VFD Market Revenue (US$ Mn) Market Share by By Applicationin 2022
- Figure 6: Global Marine VFD Market Market Attractiveness Analysis by By Application, 2016-2032
- Figure 7: Global Marine VFD Market Revenue (US$ Mn) Market Share by Region in 2022
- Figure 8: Global Marine VFD Market Market Attractiveness Analysis by Region, 2016-2032
- Figure 9: Global Marine VFD Market Market Revenue (US$ Mn) (2016-2032)
- Figure 10: Global Marine VFD Market Market Revenue (US$ Mn) Comparison by Region (2016-2032)
- Figure 11: Global Marine VFD Market Market Revenue (US$ Mn) Comparison by By Type (2016-2032)
- Figure 12: Global Marine VFD Market Market Revenue (US$ Mn) Comparison by By Voltage (2016-2032)
- Figure 13: Global Marine VFD Market Market Revenue (US$ Mn) Comparison by By Application (2016-2032)
- Figure 14: Global Marine VFD Market Market Y-o-Y Growth Rate Comparison by Region (2016-2032)
- Figure 15: Global Marine VFD Market Market Y-o-Y Growth Rate Comparison by By Type (2016-2032)
- Figure 16: Global Marine VFD Market Market Y-o-Y Growth Rate Comparison by By Voltage (2016-2032)
- Figure 17: Global Marine VFD Market Market Y-o-Y Growth Rate Comparison by By Application (2016-2032)
- Figure 18: Global Marine VFD Market Market Share Comparison by Region (2016-2032)
- Figure 19: Global Marine VFD Market Market Share Comparison by By Type (2016-2032)
- Figure 20: Global Marine VFD Market Market Share Comparison by By Voltage (2016-2032)
- Figure 21: Global Marine VFD Market Market Share Comparison by By Application (2016-2032)
- Figure 22: North America Marine VFD Market Revenue (US$ Mn) Market Share by By Typein 2022
- Figure 23: North America Marine VFD Market Market Attractiveness Analysis by By Type, 2016-2032
- Figure 24: North America Marine VFD Market Revenue (US$ Mn) Market Share by By Voltagein 2022
- Figure 25: North America Marine VFD Market Market Attractiveness Analysis by By Voltage, 2016-2032
- Figure 26: North America Marine VFD Market Revenue (US$ Mn) Market Share by By Applicationin 2022
- Figure 27: North America Marine VFD Market Market Attractiveness Analysis by By Application, 2016-2032
- Figure 28: North America Marine VFD Market Revenue (US$ Mn) Market Share by Country in 2022
- Figure 29: North America Marine VFD Market Market Attractiveness Analysis by Country, 2016-2032
- Figure 30: North America Marine VFD Market Market Revenue (US$ Mn) (2016-2032)
- Figure 31: North America Marine VFD Market Market Revenue (US$ Mn) Comparison by Country (2016-2032)
- Figure 32: North America Marine VFD Market Market Revenue (US$ Mn) Comparison by By Type (2016-2032)
- Figure 33: North America Marine VFD Market Market Revenue (US$ Mn) Comparison by By Voltage (2016-2032)
- Figure 34: North America Marine VFD Market Market Revenue (US$ Mn) Comparison by By Application (2016-2032)
- Figure 35: North America Marine VFD Market Market Y-o-Y Growth Rate Comparison by Country (2016-2032)
- Figure 36: North America Marine VFD Market Market Y-o-Y Growth Rate Comparison by By Type (2016-2032)
- Figure 37: North America Marine VFD Market Market Y-o-Y Growth Rate Comparison by By Voltage (2016-2032)
- Figure 38: North America Marine VFD Market Market Y-o-Y Growth Rate Comparison by By Application (2016-2032)
- Figure 39: North America Marine VFD Market Market Share Comparison by Country (2016-2032)
- Figure 40: North America Marine VFD Market Market Share Comparison by By Type (2016-2032)
- Figure 41: North America Marine VFD Market Market Share Comparison by By Voltage (2016-2032)
- Figure 42: North America Marine VFD Market Market Share Comparison by By Application (2016-2032)
- Figure 43: Western Europe Marine VFD Market Revenue (US$ Mn) Market Share by By Typein 2022
- Figure 44: Western Europe Marine VFD Market Market Attractiveness Analysis by By Type, 2016-2032
- Figure 45: Western Europe Marine VFD Market Revenue (US$ Mn) Market Share by By Voltagein 2022
- Figure 46: Western Europe Marine VFD Market Market Attractiveness Analysis by By Voltage, 2016-2032
- Figure 47: Western Europe Marine VFD Market Revenue (US$ Mn) Market Share by By Applicationin 2022
- Figure 48: Western Europe Marine VFD Market Market Attractiveness Analysis by By Application, 2016-2032
- Figure 49: Western Europe Marine VFD Market Revenue (US$ Mn) Market Share by Country in 2022
- Figure 50: Western Europe Marine VFD Market Market Attractiveness Analysis by Country, 2016-2032
- Figure 51: Western Europe Marine VFD Market Market Revenue (US$ Mn) (2016-2032)
- Figure 52: Western Europe Marine VFD Market Market Revenue (US$ Mn) Comparison by Country (2016-2032)
- Figure 53: Western Europe Marine VFD Market Market Revenue (US$ Mn) Comparison by By Type (2016-2032)
- Figure 54: Western Europe Marine VFD Market Market Revenue (US$ Mn) Comparison by By Voltage (2016-2032)
- Figure 55: Western Europe Marine VFD Market Market Revenue (US$ Mn) Comparison by By Application (2016-2032)
- Figure 56: Western Europe Marine VFD Market Market Y-o-Y Growth Rate Comparison by Country (2016-2032)
- Figure 57: Western Europe Marine VFD Market Market Y-o-Y Growth Rate Comparison by By Type (2016-2032)
- Figure 58: Western Europe Marine VFD Market Market Y-o-Y Growth Rate Comparison by By Voltage (2016-2032)
- Figure 59: Western Europe Marine VFD Market Market Y-o-Y Growth Rate Comparison by By Application (2016-2032)
- Figure 60: Western Europe Marine VFD Market Market Share Comparison by Country (2016-2032)
- Figure 61: Western Europe Marine VFD Market Market Share Comparison by By Type (2016-2032)
- Figure 62: Western Europe Marine VFD Market Market Share Comparison by By Voltage (2016-2032)
- Figure 63: Western Europe Marine VFD Market Market Share Comparison by By Application (2016-2032)
- Figure 64: Eastern Europe Marine VFD Market Revenue (US$ Mn) Market Share by By Typein 2022
- Figure 65: Eastern Europe Marine VFD Market Market Attractiveness Analysis by By Type, 2016-2032
- Figure 66: Eastern Europe Marine VFD Market Revenue (US$ Mn) Market Share by By Voltagein 2022
- Figure 67: Eastern Europe Marine VFD Market Market Attractiveness Analysis by By Voltage, 2016-2032
- Figure 68: Eastern Europe Marine VFD Market Revenue (US$ Mn) Market Share by By Applicationin 2022
- Figure 69: Eastern Europe Marine VFD Market Market Attractiveness Analysis by By Application, 2016-2032
- Figure 70: Eastern Europe Marine VFD Market Revenue (US$ Mn) Market Share by Country in 2022
- Figure 71: Eastern Europe Marine VFD Market Market Attractiveness Analysis by Country, 2016-2032
- Figure 72: Eastern Europe Marine VFD Market Market Revenue (US$ Mn) (2016-2032)
- Figure 73: Eastern Europe Marine VFD Market Market Revenue (US$ Mn) Comparison by Country (2016-2032)
- Figure 74: Eastern Europe Marine VFD Market Market Revenue (US$ Mn) Comparison by By Type (2016-2032)
- Figure 75: Eastern Europe Marine VFD Market Market Revenue (US$ Mn) Comparison by By Voltage (2016-2032)
- Figure 76: Eastern Europe Marine VFD Market Market Revenue (US$ Mn) Comparison by By Application (2016-2032)
- Figure 77: Eastern Europe Marine VFD Market Market Y-o-Y Growth Rate Comparison by Country (2016-2032)
- Figure 78: Eastern Europe Marine VFD Market Market Y-o-Y Growth Rate Comparison by By Type (2016-2032)
- Figure 79: Eastern Europe Marine VFD Market Market Y-o-Y Growth Rate Comparison by By Voltage (2016-2032)
- Figure 80: Eastern Europe Marine VFD Market Market Y-o-Y Growth Rate Comparison by By Application (2016-2032)
- Figure 81: Eastern Europe Marine VFD Market Market Share Comparison by Country (2016-2032)
- Figure 82: Eastern Europe Marine VFD Market Market Share Comparison by By Type (2016-2032)
- Figure 83: Eastern Europe Marine VFD Market Market Share Comparison by By Voltage (2016-2032)
- Figure 84: Eastern Europe Marine VFD Market Market Share Comparison by By Application (2016-2032)
- Figure 85: APAC Marine VFD Market Revenue (US$ Mn) Market Share by By Typein 2022
- Figure 86: APAC Marine VFD Market Market Attractiveness Analysis by By Type, 2016-2032
- Figure 87: APAC Marine VFD Market Revenue (US$ Mn) Market Share by By Voltagein 2022
- Figure 88: APAC Marine VFD Market Market Attractiveness Analysis by By Voltage, 2016-2032
- Figure 89: APAC Marine VFD Market Revenue (US$ Mn) Market Share by By Applicationin 2022
- Figure 90: APAC Marine VFD Market Market Attractiveness Analysis by By Application, 2016-2032
- Figure 91: APAC Marine VFD Market Revenue (US$ Mn) Market Share by Country in 2022
- Figure 92: APAC Marine VFD Market Market Attractiveness Analysis by Country, 2016-2032
- Figure 93: APAC Marine VFD Market Market Revenue (US$ Mn) (2016-2032)
- Figure 94: APAC Marine VFD Market Market Revenue (US$ Mn) Comparison by Country (2016-2032)
- Figure 95: APAC Marine VFD Market Market Revenue (US$ Mn) Comparison by By Type (2016-2032)
- Figure 96: APAC Marine VFD Market Market Revenue (US$ Mn) Comparison by By Voltage (2016-2032)
- Figure 97: APAC Marine VFD Market Market Revenue (US$ Mn) Comparison by By Application (2016-2032)
- Figure 98: APAC Marine VFD Market Market Y-o-Y Growth Rate Comparison by Country (2016-2032)
- Figure 99: APAC Marine VFD Market Market Y-o-Y Growth Rate Comparison by By Type (2016-2032)
- Figure 100: APAC Marine VFD Market Market Y-o-Y Growth Rate Comparison by By Voltage (2016-2032)
- Figure 101: APAC Marine VFD Market Market Y-o-Y Growth Rate Comparison by By Application (2016-2032)
- Figure 102: APAC Marine VFD Market Market Share Comparison by Country (2016-2032)
- Figure 103: APAC Marine VFD Market Market Share Comparison by By Type (2016-2032)
- Figure 104: APAC Marine VFD Market Market Share Comparison by By Voltage (2016-2032)
- Figure 105: APAC Marine VFD Market Market Share Comparison by By Application (2016-2032)
- Figure 106: Latin America Marine VFD Market Revenue (US$ Mn) Market Share by By Typein 2022
- Figure 107: Latin America Marine VFD Market Market Attractiveness Analysis by By Type, 2016-2032
- Figure 108: Latin America Marine VFD Market Revenue (US$ Mn) Market Share by By Voltagein 2022
- Figure 109: Latin America Marine VFD Market Market Attractiveness Analysis by By Voltage, 2016-2032
- Figure 110: Latin America Marine VFD Market Revenue (US$ Mn) Market Share by By Applicationin 2022
- Figure 111: Latin America Marine VFD Market Market Attractiveness Analysis by By Application, 2016-2032
- Figure 112: Latin America Marine VFD Market Revenue (US$ Mn) Market Share by Country in 2022
- Figure 113: Latin America Marine VFD Market Market Attractiveness Analysis by Country, 2016-2032
- Figure 114: Latin America Marine VFD Market Market Revenue (US$ Mn) (2016-2032)
- Figure 115: Latin America Marine VFD Market Market Revenue (US$ Mn) Comparison by Country (2016-2032)
- Figure 116: Latin America Marine VFD Market Market Revenue (US$ Mn) Comparison by By Type (2016-2032)
- Figure 117: Latin America Marine VFD Market Market Revenue (US$ Mn) Comparison by By Voltage (2016-2032)
- Figure 118: Latin America Marine VFD Market Market Revenue (US$ Mn) Comparison by By Application (2016-2032)
- Figure 119: Latin America Marine VFD Market Market Y-o-Y Growth Rate Comparison by Country (2016-2032)
- Figure 120: Latin America Marine VFD Market Market Y-o-Y Growth Rate Comparison by By Type (2016-2032)
- Figure 121: Latin America Marine VFD Market Market Y-o-Y Growth Rate Comparison by By Voltage (2016-2032)
- Figure 122: Latin America Marine VFD Market Market Y-o-Y Growth Rate Comparison by By Application (2016-2032)
- Figure 123: Latin America Marine VFD Market Market Share Comparison by Country (2016-2032)
- Figure 124: Latin America Marine VFD Market Market Share Comparison by By Type (2016-2032)
- Figure 125: Latin America Marine VFD Market Market Share Comparison by By Voltage (2016-2032)
- Figure 126: Latin America Marine VFD Market Market Share Comparison by By Application (2016-2032)
- Figure 127: Middle East & Africa Marine VFD Market Revenue (US$ Mn) Market Share by By Typein 2022
- Figure 128: Middle East & Africa Marine VFD Market Market Attractiveness Analysis by By Type, 2016-2032
- Figure 129: Middle East & Africa Marine VFD Market Revenue (US$ Mn) Market Share by By Voltagein 2022
- Figure 130: Middle East & Africa Marine VFD Market Market Attractiveness Analysis by By Voltage, 2016-2032
- Figure 131: Middle East & Africa Marine VFD Market Revenue (US$ Mn) Market Share by By Applicationin 2022
- Figure 132: Middle East & Africa Marine VFD Market Market Attractiveness Analysis by By Application, 2016-2032
- Figure 133: Middle East & Africa Marine VFD Market Revenue (US$ Mn) Market Share by Country in 2022
- Figure 134: Middle East & Africa Marine VFD Market Market Attractiveness Analysis by Country, 2016-2032
- Figure 135: Middle East & Africa Marine VFD Market Market Revenue (US$ Mn) (2016-2032)
- Figure 136: Middle East & Africa Marine VFD Market Market Revenue (US$ Mn) Comparison by Country (2016-2032)
- Figure 137: Middle East & Africa Marine VFD Market Market Revenue (US$ Mn) Comparison by By Type (2016-2032)
- Figure 138: Middle East & Africa Marine VFD Market Market Revenue (US$ Mn) Comparison by By Voltage (2016-2032)
- Figure 139: Middle East & Africa Marine VFD Market Market Revenue (US$ Mn) Comparison by By Application (2016-2032)
- Figure 140: Middle East & Africa Marine VFD Market Market Y-o-Y Growth Rate Comparison by Country (2016-2032)
- Figure 141: Middle East & Africa Marine VFD Market Market Y-o-Y Growth Rate Comparison by By Type (2016-2032)
- Figure 142: Middle East & Africa Marine VFD Market Market Y-o-Y Growth Rate Comparison by By Voltage (2016-2032)
- Figure 143: Middle East & Africa Marine VFD Market Market Y-o-Y Growth Rate Comparison by By Application (2016-2032)
- Figure 144: Middle East & Africa Marine VFD Market Market Share Comparison by Country (2016-2032)
- Figure 145: Middle East & Africa Marine VFD Market Market Share Comparison by By Type (2016-2032)
- Figure 146: Middle East & Africa Marine VFD Market Market Share Comparison by By Voltage (2016-2032)
- Figure 147: Middle East & Africa Marine VFD Market Market Share Comparison by By Application (2016-2032)
"
- List of Tables
- "
- Table 1: Global Marine VFD Market Market Comparison by By Type (2016-2032)
- Table 2: Global Marine VFD Market Market Comparison by By Voltage (2016-2032)
- Table 3: Global Marine VFD Market Market Comparison by By Application (2016-2032)
- Table 4: Global Marine VFD Market Revenue (US$ Mn) Comparison by Region (2016-2032)
- Table 5: Global Marine VFD Market Market Revenue (US$ Mn) (2016-2032)
- Table 6: Global Marine VFD Market Market Revenue (US$ Mn) Comparison by Region (2016-2032)
- Table 7: Global Marine VFD Market Market Revenue (US$ Mn) Comparison by By Type (2016-2032)
- Table 8: Global Marine VFD Market Market Revenue (US$ Mn) Comparison by By Voltage (2016-2032)
- Table 9: Global Marine VFD Market Market Revenue (US$ Mn) Comparison by By Application (2016-2032)
- Table 10: Global Marine VFD Market Market Y-o-Y Growth Rate Comparison by Region (2016-2032)
- Table 11: Global Marine VFD Market Market Y-o-Y Growth Rate Comparison by By Type (2016-2032)
- Table 12: Global Marine VFD Market Market Y-o-Y Growth Rate Comparison by By Voltage (2016-2032)
- Table 13: Global Marine VFD Market Market Y-o-Y Growth Rate Comparison by By Application (2016-2032)
- Table 14: Global Marine VFD Market Market Share Comparison by Region (2016-2032)
- Table 15: Global Marine VFD Market Market Share Comparison by By Type (2016-2032)
- Table 16: Global Marine VFD Market Market Share Comparison by By Voltage (2016-2032)
- Table 17: Global Marine VFD Market Market Share Comparison by By Application (2016-2032)
- Table 18: North America Marine VFD Market Market Comparison by By Voltage (2016-2032)
- Table 19: North America Marine VFD Market Market Comparison by By Application (2016-2032)
- Table 20: North America Marine VFD Market Revenue (US$ Mn) Comparison by Country (2016-2032)
- Table 21: North America Marine VFD Market Market Revenue (US$ Mn) (2016-2032)
- Table 22: North America Marine VFD Market Market Revenue (US$ Mn) Comparison by Country (2016-2032)
- Table 23: North America Marine VFD Market Market Revenue (US$ Mn) Comparison by By Type (2016-2032)
- Table 24: North America Marine VFD Market Market Revenue (US$ Mn) Comparison by By Voltage (2016-2032)
- Table 25: North America Marine VFD Market Market Revenue (US$ Mn) Comparison by By Application (2016-2032)
- Table 26: North America Marine VFD Market Market Y-o-Y Growth Rate Comparison by Country (2016-2032)
- Table 27: North America Marine VFD Market Market Y-o-Y Growth Rate Comparison by By Type (2016-2032)
- Table 28: North America Marine VFD Market Market Y-o-Y Growth Rate Comparison by By Voltage (2016-2032)
- Table 29: North America Marine VFD Market Market Y-o-Y Growth Rate Comparison by By Application (2016-2032)
- Table 30: North America Marine VFD Market Market Share Comparison by Country (2016-2032)
- Table 31: North America Marine VFD Market Market Share Comparison by By Type (2016-2032)
- Table 32: North America Marine VFD Market Market Share Comparison by By Voltage (2016-2032)
- Table 33: North America Marine VFD Market Market Share Comparison by By Application (2016-2032)
- Table 34: Western Europe Marine VFD Market Market Comparison by By Type (2016-2032)
- Table 35: Western Europe Marine VFD Market Market Comparison by By Voltage (2016-2032)
- Table 36: Western Europe Marine VFD Market Market Comparison by By Application (2016-2032)
- Table 37: Western Europe Marine VFD Market Revenue (US$ Mn) Comparison by Country (2016-2032)
- Table 38: Western Europe Marine VFD Market Market Revenue (US$ Mn) (2016-2032)
- Table 39: Western Europe Marine VFD Market Market Revenue (US$ Mn) Comparison by Country (2016-2032)
- Table 40: Western Europe Marine VFD Market Market Revenue (US$ Mn) Comparison by By Type (2016-2032)
- Table 41: Western Europe Marine VFD Market Market Revenue (US$ Mn) Comparison by By Voltage (2016-2032)
- Table 42: Western Europe Marine VFD Market Market Revenue (US$ Mn) Comparison by By Application (2016-2032)
- Table 43: Western Europe Marine VFD Market Market Y-o-Y Growth Rate Comparison by Country (2016-2032)
- Table 44: Western Europe Marine VFD Market Market Y-o-Y Growth Rate Comparison by By Type (2016-2032)
- Table 45: Western Europe Marine VFD Market Market Y-o-Y Growth Rate Comparison by By Voltage (2016-2032)
- Table 46: Western Europe Marine VFD Market Market Y-o-Y Growth Rate Comparison by By Application (2016-2032)
- Table 47: Western Europe Marine VFD Market Market Share Comparison by Country (2016-2032)
- Table 48: Western Europe Marine VFD Market Market Share Comparison by By Type (2016-2032)
- Table 49: Western Europe Marine VFD Market Market Share Comparison by By Voltage (2016-2032)
- Table 50: Western Europe Marine VFD Market Market Share Comparison by By Application (2016-2032)
- Table 51: Eastern Europe Marine VFD Market Market Comparison by By Type (2016-2032)
- Table 52: Eastern Europe Marine VFD Market Market Comparison by By Voltage (2016-2032)
- Table 53: Eastern Europe Marine VFD Market Market Comparison by By Application (2016-2032)
- Table 54: Eastern Europe Marine VFD Market Revenue (US$ Mn) Comparison by Country (2016-2032)
- Table 55: Eastern Europe Marine VFD Market Market Revenue (US$ Mn) (2016-2032)
- Table 56: Eastern Europe Marine VFD Market Market Revenue (US$ Mn) Comparison by Country (2016-2032)
- Table 57: Eastern Europe Marine VFD Market Market Revenue (US$ Mn) Comparison by By Type (2016-2032)
- Table 58: Eastern Europe Marine VFD Market Market Revenue (US$ Mn) Comparison by By Voltage (2016-2032)
- Table 59: Eastern Europe Marine VFD Market Market Revenue (US$ Mn) Comparison by By Application (2016-2032)
- Table 60: Eastern Europe Marine VFD Market Market Y-o-Y Growth Rate Comparison by Country (2016-2032)
- Table 61: Eastern Europe Marine VFD Market Market Y-o-Y Growth Rate Comparison by By Type (2016-2032)
- Table 62: Eastern Europe Marine VFD Market Market Y-o-Y Growth Rate Comparison by By Voltage (2016-2032)
- Table 63: Eastern Europe Marine VFD Market Market Y-o-Y Growth Rate Comparison by By Application (2016-2032)
- Table 64: Eastern Europe Marine VFD Market Market Share Comparison by Country (2016-2032)
- Table 65: Eastern Europe Marine VFD Market Market Share Comparison by By Type (2016-2032)
- Table 66: Eastern Europe Marine VFD Market Market Share Comparison by By Voltage (2016-2032)
- Table 67: Eastern Europe Marine VFD Market Market Share Comparison by By Application (2016-2032)
- Table 68: APAC Marine VFD Market Market Comparison by By Type (2016-2032)
- Table 69: APAC Marine VFD Market Market Comparison by By Voltage (2016-2032)
- Table 70: APAC Marine VFD Market Market Comparison by By Application (2016-2032)
- Table 71: APAC Marine VFD Market Revenue (US$ Mn) Comparison by Country (2016-2032)
- Table 72: APAC Marine VFD Market Market Revenue (US$ Mn) (2016-2032)
- Table 73: APAC Marine VFD Market Market Revenue (US$ Mn) Comparison by Country (2016-2032)
- Table 74: APAC Marine VFD Market Market Revenue (US$ Mn) Comparison by By Type (2016-2032)
- Table 75: APAC Marine VFD Market Market Revenue (US$ Mn) Comparison by By Voltage (2016-2032)
- Table 76: APAC Marine VFD Market Market Revenue (US$ Mn) Comparison by By Application (2016-2032)
- Table 77: APAC Marine VFD Market Market Y-o-Y Growth Rate Comparison by Country (2016-2032)
- Table 78: APAC Marine VFD Market Market Y-o-Y Growth Rate Comparison by By Type (2016-2032)
- Table 79: APAC Marine VFD Market Market Y-o-Y Growth Rate Comparison by By Voltage (2016-2032)
- Table 80: APAC Marine VFD Market Market Y-o-Y Growth Rate Comparison by By Application (2016-2032)
- Table 81: APAC Marine VFD Market Market Share Comparison by Country (2016-2032)
- Table 82: APAC Marine VFD Market Market Share Comparison by By Type (2016-2032)
- Table 83: APAC Marine VFD Market Market Share Comparison by By Voltage (2016-2032)
- Table 84: APAC Marine VFD Market Market Share Comparison by By Application (2016-2032)
- Table 85: Latin America Marine VFD Market Market Comparison by By Type (2016-2032)
- Table 86: Latin America Marine VFD Market Market Comparison by By Voltage (2016-2032)
- Table 87: Latin America Marine VFD Market Market Comparison by By Application (2016-2032)
- Table 88: Latin America Marine VFD Market Revenue (US$ Mn) Comparison by Country (2016-2032)
- Table 89: Latin America Marine VFD Market Market Revenue (US$ Mn) (2016-2032)
- Table 90: Latin America Marine VFD Market Market Revenue (US$ Mn) Comparison by Country (2016-2032)
- Table 91: Latin America Marine VFD Market Market Revenue (US$ Mn) Comparison by By Type (2016-2032)
- Table 92: Latin America Marine VFD Market Market Revenue (US$ Mn) Comparison by By Voltage (2016-2032)
- Table 93: Latin America Marine VFD Market Market Revenue (US$ Mn) Comparison by By Application (2016-2032)
- Table 94: Latin America Marine VFD Market Market Y-o-Y Growth Rate Comparison by Country (2016-2032)
- Table 95: Latin America Marine VFD Market Market Y-o-Y Growth Rate Comparison by By Type (2016-2032)
- Table 96: Latin America Marine VFD Market Market Y-o-Y Growth Rate Comparison by By Voltage (2016-2032)
- Table 97: Latin America Marine VFD Market Market Y-o-Y Growth Rate Comparison by By Application (2016-2032)
- Table 98: Latin America Marine VFD Market Market Share Comparison by Country (2016-2032)
- Table 99: Latin America Marine VFD Market Market Share Comparison by By Type (2016-2032)
- Table 100: Latin America Marine VFD Market Market Share Comparison by By Voltage (2016-2032)
- Table 101: Latin America Marine VFD Market Market Share Comparison by By Application (2016-2032)
- Table 102: Middle East & Africa Marine VFD Market Market Comparison by By Type (2016-2032)
- Table 103: Middle East & Africa Marine VFD Market Market Comparison by By Voltage (2016-2032)
- Table 104: Middle East & Africa Marine VFD Market Market Comparison by By Application (2016-2032)
- Table 105: Middle East & Africa Marine VFD Market Revenue (US$ Mn) Comparison by Country (2016-2032)
- Table 106: Middle East & Africa Marine VFD Market Market Revenue (US$ Mn) (2016-2032)
- Table 107: Middle East & Africa Marine VFD Market Market Revenue (US$ Mn) Comparison by Country (2016-2032)
- Table 108: Middle East & Africa Marine VFD Market Market Revenue (US$ Mn) Comparison by By Type (2016-2032)
- Table 109: Middle East & Africa Marine VFD Market Market Revenue (US$ Mn) Comparison by By Voltage (2016-2032)
- Table 110: Middle East & Africa Marine VFD Market Market Revenue (US$ Mn) Comparison by By Application (2016-2032)
- Table 111: Middle East & Africa Marine VFD Market Market Y-o-Y Growth Rate Comparison by Country (2016-2032)
- Table 112: Middle East & Africa Marine VFD Market Market Y-o-Y Growth Rate Comparison by By Type (2016-2032)
- Table 113: Middle East & Africa Marine VFD Market Market Y-o-Y Growth Rate Comparison by By Voltage (2016-2032)
- Table 114: Middle East & Africa Marine VFD Market Market Y-o-Y Growth Rate Comparison by By Application (2016-2032)
- Table 115: Middle East & Africa Marine VFD Market Market Share Comparison by Country (2016-2032)
- Table 116: Middle East & Africa Marine VFD Market Market Share Comparison by By Type (2016-2032)
- Table 117: Middle East & Africa Marine VFD Market Market Share Comparison by By Voltage (2016-2032)
- Table 118: Middle East & Africa Marine VFD Market Market Share Comparison by By Application (2016-2032)
- 1. Executive Summary
-
- Siemens (Germany)
- General Electric (US)
- Danfoss (Denmark)
- ABB (Switzerland)
- Rockwell Automation (US)
- Schneider Electric (France)
- NIDEC (Japan), WEG (Brazil)
- Ingeteam (Spain)
- Triol (Colombia)
- CG Power and Industrial Solutions (India)
- LS Electronics Co., Ltd. (South Korea)
- Johnson Controls (US)
- Honeywell (US)
- Parker Hannifin (US)
- Invertek Drives (UK)
- SELMA (Greece)
- HI-SEA (China)
- Bosch Rexroth (Germany)
- Yaskawa Electric Corporation
Our Clients


View Our Licence Options
