
Marine Radar Market Report By Type (X-band Radar, S-band Radar, Ku-band Radar, Others), By Technology (Pulse Radar, Frequency Modulated Continuous Wave [FMCW] Radar, Doppler Radar), By Application (Commercial Ships, Defense Vessels, Recreational Boats, Others), By End User (OEMs, Aftermarket), By Region and Companies - Industry Segment Outlook, Market Assessment, Competition Scenario, Trends and Forecast 2024-2033
-
25807
-
July 2024
-
321
-


-
This report was compiled by Vishwa Gaul Vishwa is an experienced market research and consulting professional with over 8 years of expertise in the ICT industry, contributing to over 700 reports across telecommunications, software, hardware, and digital solutions. Correspondence Team Lead- ICT Linkedin | Detailed Market research Methodology Our methodology involves a mix of primary research, including interviews with leading mental health experts, and secondary research from reputable medical journals and databases. View Detailed Methodology Page
-
Quick Navigation
Report Overview
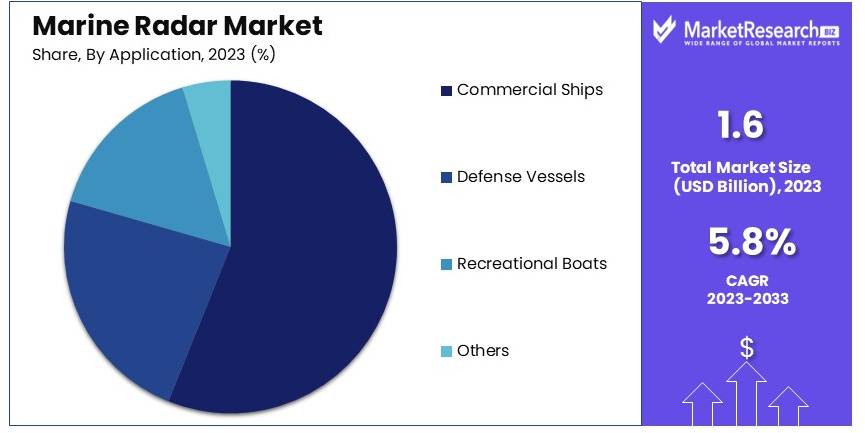
The Global Marine Radar Market size is expected to be worth around USD 2.8 Billion by 2033, from USD 1.6 Billion in 2023, growing at a CAGR of 5.8% during the forecast period from 2024 to 2033.
The marine radar market focuses on equipment used to detect objects around vessels. This technology helps in navigation and avoiding collisions. It is crucial for safe marine operations. The market includes different radar types, such as X-band and S-band radars. These radars are used on commercial ships, fishing vessels, and recreational boats. Key players in this market are companies that manufacture radar systems and components.
Growing demand for marine safety and increasing maritime trade drive this market. Advances in technology, such as improved detection capabilities and integration with other navigation systems, are also boosting growth. Regulatory requirements for maritime safety are influencing market trends. Companies in this sector are investing in research and development to offer innovative solutions.

The marine radar market is experiencing significant growth, driven by the robust expansion of global maritime trade. According to the International Chamber of Shipping (ICS), the international shipping industry facilitates around 90% of world trade, utilizing over 50,000 merchant ships and employing nearly 2 million seafarers. This extensive network underscores the critical need for advanced radar systems to ensure safe and efficient navigation.
Marine radars are essential for collision avoidance, navigation, and port operations. The demand for these systems is bolstered by the increasing focus on maritime safety and the stringent regulations imposed by international maritime organizations. The adoption of advanced technologies, such as Automatic Identification Systems (AIS) integrated with radar, enhances situational awareness and operational efficiency, further driving market growth.
The global supply of seafarers, estimated at 1,892,720, predominantly comes from countries like the Philippines, Russia, Indonesia, China, and India. These nations play a pivotal role in the global maritime workforce, ensuring the continuous operation of merchant fleets worldwide. The availability of skilled seafarers is crucial for the effective utilization and maintenance of marine radar systems.
Additionally, the modernization of existing fleets and the development of new ports and shipping routes contribute to the increasing demand for marine radars. As emerging economies invest in maritime infrastructure, the market is expected to witness sustained growth. The integration of radar systems with other maritime technologies, such as satellite communication and Global Positioning Systems (GPS), is anticipated to further enhance their functionality and appeal.
The marine radar market is poised for steady growth, driven by the vital role of maritime trade in the global economy, the continuous supply of skilled seafarers, and technological advancements in radar systems. This market dynamic presents significant opportunities for manufacturers and stakeholders in the marine radar industry.
Key Takeaways
- Market Value: The Marine Radar Market was valued at USD 1.6 billion in 2023, and is expected to reach USD 2.8 billion by 2033, with a CAGR of 5.8%.
- Type Analysis: X-band Radar dominated with 55%; crucial for detailed imaging.
- Technology Analysis: Pulse Radar led with 45%; important for range and resolution.
- Application Analysis: Commercial Ships held 60%; significant for navigation safety.
- End User Analysis: OEMs dominated with 70%; indicating strong market reliance on original equipment manufacturers.
- Dominant Region: Asia Pacific led with 44%; driven by robust shipbuilding industry.
- High Growth Region: North America, driven by modernization of naval fleets.
- Analyst Viewpoint: The market is poised for steady growth with increased demand for advanced radar systems in both commercial and defense sectors.
Driving Factors
Increasing Maritime Trade and Shipping Activities Drive Market Growth
The rise in global maritime trade and shipping activities has driven the demand for advanced marine radar systems. These systems play a crucial role in enhancing situational awareness, navigation safety, and collision avoidance for vessels operating in congested waters. The expansion of the Panama Canal, for instance, has significantly increased maritime traffic, necessitating the adoption of modern radar systems to ensure safe navigation. In 2023, global maritime trade volumes were estimated to grow by 3.8%, further highlighting the need for reliable radar systems.
The increased movement of goods across the seas requires vessels to navigate safely through busy shipping lanes. Marine radar systems provide real-time data on vessel positions, weather conditions, and potential obstacles, thereby reducing the risk of collisions and accidents. As international trade continues to expand, the reliance on maritime transport grows, leading to a higher demand for efficient navigation and safety systems. This growth in maritime activities is further supported by the development of new ports and shipping routes, which require state-of-the-art radar systems to manage increased traffic.
Stringent Maritime Regulations and Safety Standards Drive Market Growth
Governments and international organizations have implemented stringent regulations and safety standards for maritime operations, boosting the adoption of marine radar systems. These regulations aim to reduce the risk of accidents, collisions, and environmental incidents. The International Maritime Organization (IMO) mandates the use of specific radar systems on ships based on their size and operational areas. For instance, SOLAS (Safety of Life at Sea) regulations require ships over 300 gross tonnage to be equipped with marine radar systems.
Such regulations ensure that ships are equipped with the necessary technology to navigate safely and avoid accidents. Compliance with these regulations is not optional, making the installation of advanced radar systems a priority for shipowners and operators. Additionally, regional regulatory bodies, like the European Maritime Safety Agency (EMSA), enforce strict safety standards, further driving the market for radar systems. As these regulations become more comprehensive, the demand for high-performance radar systems continues to rise, ensuring safer maritime operations.
Technological Advancements in Radar Technology Drive Market Growth
Continuous advancements in radar technology, such as solid-state transceivers, digital signal processing, and advanced target tracking algorithms, have significantly improved the performance and reliability of marine radar systems. These technological innovations enable enhanced target detection, resolution, and tracking capabilities, even in challenging weather conditions or cluttered environments. The introduction of Doppler radar technology, for instance, has greatly enhanced the ability to detect and track small targets, such as buoys or debris.
These advancements have made radar systems more accurate and reliable, ensuring better situational awareness and safety for maritime operations. Improved digital signal processing allows for clearer images and more precise data, which is crucial for navigation and collision avoidance. Moreover, advancements in radar technology have led to the development of compact and energy-efficient systems, making them more accessible and cost-effective for various types of vessels. As a result, the adoption of advanced marine radar systems is expected to grow, driven by the need for enhanced performance and safety in maritime operations.
Restraining Factors
High Capital Investment and Maintenance Costs Restrain Market Growth
Marine radar systems, especially those for large vessels or specialized applications, require substantial capital investment. The initial cost of these systems is high, making them less accessible to smaller maritime operators or companies with limited budgets. Maintenance and repair costs further add to the financial burden.
For instance, the cost of maintaining advanced radar systems can be significant due to the need for specialized technicians and expensive spare parts. This high expenditure can deter small and mid-sized shipping companies from investing in the latest radar technologies, thus limiting market growth. Additionally, the economic constraints faced by these operators often result in prolonged usage of outdated systems, which can compromise safety and efficiency.
Technical Challenges in Harsh Maritime Environments Restrain Market Growth
Marine radar systems must operate in harsh maritime environments, which present several technical challenges. These systems face extreme weather conditions, saltwater exposure, and electromagnetic interference. Designing robust and reliable systems that can withstand these challenges while maintaining high performance is technically complex and costly.
The harsh environment can lead to frequent malfunctions and the need for regular maintenance, increasing operational costs. For instance, saltwater corrosion can damage radar components, reducing their lifespan and reliability. The complexity and cost of developing systems that can endure these conditions can slow down technological advancement and adoption, thereby restraining market growth.
Type Analysis
X-band radar dominates with 55% market share due to its superior resolution and accuracy.
X-band radar is the most dominant segment in the marine radar market, driven by its superior resolution and accuracy, which are crucial for navigation and collision avoidance. X-band radars operate at a higher frequency range (8-12 GHz) and provide finer detail, making them ideal for detecting small objects and navigating through congested waters.
This high resolution is particularly valuable for vessels operating in busy shipping lanes and ports, where precise detection of other ships, buoys, and obstacles is essential for safe navigation. The demand for X-band radar is further fueled by stringent maritime safety regulations that mandate the use of advanced radar systems on vessels. These radars are widely adopted by commercial ships, defense vessels, and recreational boats, contributing to their dominant position in the market.
S-band radar, although not as dominant as X-band, plays a significant role, especially in long-range detection and harsh weather conditions. Operating at a lower frequency range (2-4 GHz), S-band radars are less affected by rain, fog, and other atmospheric conditions, making them suitable for large vessels and open sea navigation. These radars are essential for long-haul voyages and defense applications, where reliability and range are critical. The market for S-band radar is supported by the growing fleet of commercial and defense vessels, which require robust radar systems for safe and efficient operation.
Ku-band radar and other types of radar systems occupy smaller market shares but serve niche applications. Ku-band radar, operating at even higher frequencies (12-18 GHz), offers high resolution and is used in specific applications where detailed imaging is necessary. The "others" category includes various specialized radar systems used for specific maritime purposes, such as weather monitoring and scientific research.
Technology Analysis
Pulse radar dominates with 45% market share due to its reliability and widespread use.
Pulse radar is the most widely used technology in marine radar systems, primarily due to its reliability and effectiveness in various maritime conditions. Pulse radars transmit high-power pulses and measure the time it takes for the echoes to return, providing accurate information about the distance and size of objects. This technology is highly effective for long-range detection and is used extensively in both commercial and defense applications. The dominance of pulse radar is attributed to its proven track record and the continuous improvements in radar technology, which have enhanced its performance and reliability. Additionally, pulse radar systems are compatible with various radar types, including X-band and S-band, further solidifying their market position.
Frequency modulated continuous wave (FMCW) radar is gaining traction in the market due to its high resolution and ability to detect close-range targets with great accuracy. FMCW radars emit continuous waves that vary in frequency, allowing for precise measurement of target distance and speed. This technology is particularly useful for navigation in congested waters and for applications where high-resolution imaging is crucial. The growing adoption of FMCW radar is driven by advancements in radar technology and the increasing demand for sophisticated navigation systems.
Doppler radar, which measures the velocity of objects by detecting changes in the frequency of the returned signal, is also an important segment. Doppler radars are highly effective in detecting moving objects and assessing their speed and direction. This technology is particularly valuable in defense applications and for vessels operating in areas with high traffic density. The adoption of Doppler radar is supported by the need for advanced situational awareness and collision avoidance systems.
Application Analysis
Commercial ships dominate with 60% market share due to high demand for navigation safety and efficiency.
Commercial ships represent the largest application segment in the marine radar market, driven by the high demand for navigation safety and operational efficiency. The commercial shipping industry relies heavily on advanced radar systems to ensure safe navigation through busy shipping lanes and ports. These radars provide real-time data on vessel positions, weather conditions, and potential obstacles, enabling ship operators to make informed decisions and avoid collisions.
The dominance of commercial ships in the marine radar market is supported by the continuous growth in global maritime trade, which necessitates the adoption of reliable radar systems to manage increasing traffic volumes. Additionally, stringent maritime safety regulations mandate the use of advanced radar systems on commercial vessels, further driving the demand for these systems.
Defense vessels also represent a significant application segment, driven by the need for advanced radar systems for surveillance, target detection, and navigation in defense operations. Defense vessels, including naval ships and patrol boats, require robust radar systems capable of operating in challenging conditions and providing accurate information for tactical decision-making. The adoption of advanced radar technology in defense applications is supported by increasing defense budgets and the need for modernizing naval fleets.
Recreational boats, while a smaller segment, still contribute to the market growth. The demand for radar systems in this segment is driven by the need for safety and navigation assistance for private and leisure boating. As the popularity of recreational boating increases, so does the demand for affordable and reliable radar systems that enhance the safety and enjoyment of boating activities.
The "others" category includes specialized applications such as scientific research vessels and fishing boats. These applications require specific radar systems tailored to their unique needs, such as weather monitoring and fish detection.
End User Analysis
OEMs dominate with 70% market share due to the integration of advanced radar systems in new vessels.
OEMs represent the largest end user segment in the marine radar market, driven by the integration of advanced radar systems in new vessels during the manufacturing process. Shipbuilders and vessel manufacturers are increasingly incorporating state-of-the-art radar systems to meet regulatory requirements and enhance the safety and efficiency of their vessels. The dominance of OEMs in the market is supported by the continuous growth in the shipbuilding industry, which necessitates the adoption of advanced navigation and safety systems. Additionally, OEMs benefit from long-term contracts and partnerships with radar system manufacturers, ensuring a steady demand for their products.
The aftermarket segment, although smaller, plays a crucial role in the market. This segment includes the maintenance, repair, and upgrade of radar systems on existing vessels. The demand for aftermarket services is driven by the need to keep radar systems operational and up-to-date with the latest technological advancements. As vessels age, the need for regular maintenance and upgrades becomes critical to ensure continued safety and compliance with maritime regulations. The aftermarket segment also benefits from the growing trend of retrofitting older vessels with modern radar systems to enhance their performance and extend their operational life.
In summary, the marine radar market is segmented by type, technology, application, and end user, with each segment contributing to the overall market dynamics. X-band radar, pulse radar, commercial ships, and OEMs dominate their respective segments, driven by factors such as superior performance, reliability, high demand for navigation safety, and integration in new vessels. The market is supported by continuous technological advancements, stringent safety regulations, and the growing need for safe and efficient maritime operations.
Key Market Segments
By Type
- X-band Radar
- S-band Radar
- Ku-band Radar
- Others
By Technology
- Pulse Radar
- Frequency Modulated Continuous Wave (FMCW) Radar
- Doppler Radar
By Application
- Commercial Ships
- Defense Vessels
- Recreational Boats
- Others
By End User
- OEMs
- Aftermarket
Growth Opportunities
Autonomous and Unmanned Maritime Operations Offer Growth Opportunity
The rising trend of autonomous and unmanned maritime operations, including the use of unmanned surface vessels (USVs) and unmanned underwater vehicles (UUVs), presents a significant growth opportunity for marine radar systems. These systems are essential for situational awareness, collision avoidance, and remote monitoring in autonomous maritime operations. Autonomous vessels rely heavily on radar systems to navigate and avoid obstacles without human intervention.
This dependence on advanced radar technology drives the demand for innovative and reliable radar systems. Recent advancements in autonomous maritime technology, along with increasing investments in autonomous vessels, are expected to fuel the growth of the marine radar market.
Integration with Artificial Intelligence and Machine Learning Offers Growth Opportunity
The integration of artificial intelligence (AI) and machine learning algorithms with marine radar systems offers growth opportunities for enhanced target detection, tracking, and decision support. AI-enabled radar systems can analyze complex data patterns, identify potential threats or anomalies, and provide actionable insights to operators, improving overall maritime security and efficiency.
This integration allows for real-time data processing and advanced analytics, leading to more accurate and timely decision-making. The market for AI in marine radar systems is expected to expand significantly, driven by the need for smarter and more efficient maritime operations. For instance, AI in the maritime industry is projected to grow at a CAGR of 10% from 2023 to 2028, underscoring the increasing importance of AI-driven radar systems in enhancing maritime safety and operational efficiency.
Trending Factors
Coastal Surveillance and Maritime Security Applications Are Trending Factors
The increasing need for coastal surveillance and maritime security has driven the demand for advanced marine radar systems. These systems play a crucial role in monitoring maritime borders, detecting illegal activities (such as smuggling or piracy), and supporting search and rescue operations.
Many coastal nations are investing in radar systems to enhance their maritime domain awareness capabilities. This trend is supported by rising security concerns and the need for effective monitoring of vast coastal areas.
Integration with Other Maritime Systems Are Trending Factors
The integration of marine radar systems with other maritime systems, such as Automatic Identification System (AIS), Global Positioning System (GPS), and Electronic Chart Display and Information System (ECDIS), has created a synergistic effect, enhancing overall maritime situational awareness and decision-making. This integration has become increasingly important for efficient vessel management and compliance with maritime regulations.
The combined use of these technologies allows for more comprehensive data collection and analysis, improving navigation safety and operational efficiency. The trend towards integrated maritime systems is driven by the need for seamless communication and data sharing between different navigation and safety tools. The market for integrated marine systems is expected to grow at a steady pace, driven by advancements in technology and increasing regulatory requirements for maritime safety and efficiency.
Regional Analysis
Asia Pacific Dominates with 44% Market Share
Asia Pacific holds 44% of the marine radar market. Several factors drive this dominance. The region has a strong shipbuilding industry, particularly in China, Japan, and South Korea. High investments in maritime safety and port infrastructure further boost the market. Moreover, increased trade activities and maritime disputes have led to higher demand for marine radars.
The marine radar market in Asia Pacific benefits from the region's extensive coastline and busy shipping lanes. Governments in this area prioritize naval defense, enhancing radar systems. The region's economic growth also fuels investments in advanced maritime technologies. These characteristics create a robust market for marine radars.
Asia Pacific's market share in marine radar is expected to grow. Economic expansion, rising maritime activities, and technological advancements will drive this trend. The region's focus on improving maritime safety will also support market growth. Asia Pacific's influence on the global marine radar market is likely to remain strong.
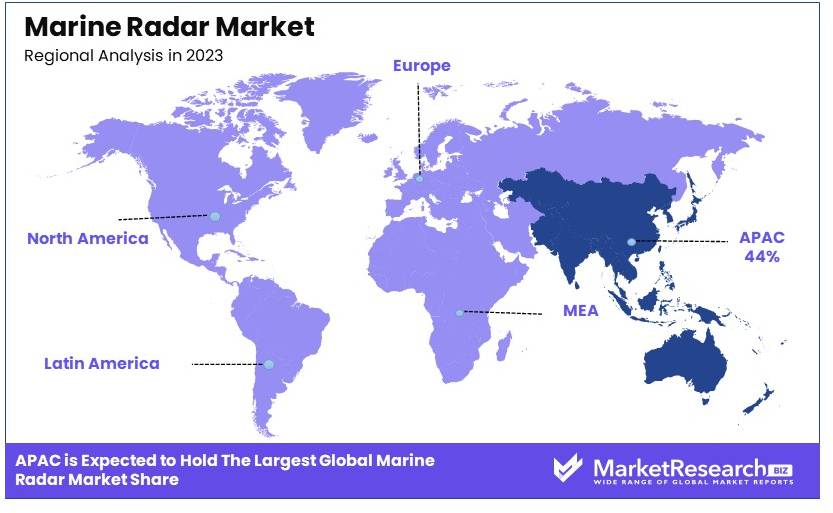
North America Holds 25% Market ShareNorth America accounts for 25% of the marine radar market. The region's high demand for advanced radar systems and strong defense sector drive this share. Innovations in radar technology and a significant number of recreational boats also contribute. This region's market is projected to grow steadily, supported by continuous technological advancements.
Europe Captures 20% Market ShareEurope holds a 20% share of the marine radar market. The region benefits from a strong maritime tradition and significant investments in naval defense. The presence of leading marine radar manufacturers and stringent safety regulations also play a role. Europe's market is expected to grow, driven by innovations and modernization of marine systems.
Middle East & Africa Accounts for 6% Market ShareThe Middle East & Africa region holds a 6% market share. Key factors include investments in port infrastructure and maritime security. The region's strategic location along key shipping routes enhances its market potential. However, economic and political instability may impact growth rates.
Latin America Holds 5% Market ShareLatin America has a 5% share in the marine radar market. The region's focus on upgrading port facilities and enhancing maritime safety drives this share. Economic development and increasing trade activities contribute to market growth. However, market expansion may be slower due to economic challenges.
Key Regions and Countries
- North America
- The US
- Canada
- Mexico
- Western Europe
- Germany
- France
- The UK
- Spain
- Italy
- Portugal
- Ireland
- Austria
- Switzerland
- Benelux
- Nordic
- Rest of Western Europe
- Eastern Europe
- Russia
- Poland
- The Czech Republic
- Greece
- Rest of Eastern Europe
- APAC
- China
- Japan
- South Korea
- India
- Australia & New Zealand
- Indonesia
- Malaysia
- Philippines
- Singapore
- Thailand
- Vietnam
- Rest of APAC
- Latin America
- Brazil
- Colombia
- Chile
- Argentina
- Costa Rica
- Rest of Latin America
- Middle East & Africa
- Algeria
- Egypt
- Israel
- Kuwait
- Nigeria
- Saudi Arabia
- South Africa
- Turkey
- United Arab Emirates
- Rest of MEA
Key Players Analysis
The Marine Radar Market features prominent companies like Raytheon Technologies Corporation, Furuno Electric Co., Ltd., and others. These players significantly impact market dynamics and development.
Raytheon Technologies Corporation and Furuno Electric Co., Ltd. lead the market with advanced radar technologies. Their innovative solutions and strong market presence give them a strategic advantage.
Northrop Grumman Corporation and Lockheed Martin Corporation focus on cutting-edge marine radar systems. Their expertise in defense and marine technologies enhances their market influence.
Saab AB and Kongsberg Gruppen provide high-quality radar systems. Their strategic positioning and continuous innovation strengthen their market presence.
Japan Radio Co., Ltd. and Terma A/S offer advanced radar solutions with a focus on accuracy and reliability. Their extensive product ranges impact market trends.
Garmin Ltd. and Hensoldt AG leverage their technological expertise to offer innovative radar systems. Their market strategies and strong distribution networks boost their influence.
Kelvin Hughes Limited and Northrop Grumman Sperry Marine B.V. focus on marine navigation and radar solutions. Their advanced products and strategic market positioning enhance their impact.
Icom Inc. and Simrad bring a wide range of marine radar products to the market. Their competitive pricing and innovative features improve their market presence.
BendixKing offers reliable and advanced radar solutions. Its focus on customer satisfaction and product innovation strengthens its market standing.
In summary, these companies drive the Marine Radar Market through innovation, strategic positioning, and market influence. Their advanced technologies and robust product offerings shape the market’s future.
Market Key Players
- Raytheon Technologies Corporation
- Furuno Electric Co., Ltd.
- Northrop Grumman Corporation
- Lockheed Martin Corporation
- Saab AB
- Kongsberg Gruppen
- Japan Radio Co., Ltd.
- Terma A/S
- Garmin Ltd.
- Hensoldt AG
- Kelvin Hughes Limited
- Northrop Grumman Sperry Marine B.V.
- Icom Inc.
- Simrad
- BendixKing
Recent Developments
March 2023 / Global Ocean Security Technologies (GOST): GOST introduced the GNT-Evolution IDP hard-wired security package. This comprehensive system includes marine-grade satellite-tracking and security features such as door and hatch sensors, infrared beam sensors, and high-water sensors. It aims to enhance security for yachts and commercial vessels by providing real-time global tracking and alerts.
November 2023 / Raymarine: Raymarine unveiled the Pathfinder, a new solid-state radar system for commercial marine navigation. This system is designed for vessels up to 10,000 tons, including superyachts and ocean-going cargo vessels. The Pathfinder radar offers exceptional clarity and an intuitive user interface, making it easier to install and retrofit on various types of vessels.
Report Scope
Report Features Description Market Value (2023) USD 1.6 Billion Forecast Revenue (2033) USD 2.8 Billion CAGR (2024-2033) 5.8% Base Year for Estimation 2023 Historic Period 2018-2023 Forecast Period 2024-2033 Report Coverage Revenue Forecast, Market Dynamics, Competitive Landscape, Recent Developments Segments Covered By Type (X-band Radar, S-band Radar, Ku-band Radar, Others), By Technology (Pulse Radar, Frequency Modulated Continuous Wave [FMCW] Radar, Doppler Radar), By Application (Commercial Ships, Defense Vessels, Recreational Boats, Others), By End User (OEMs, Aftermarket) Regional Analysis North America - The US, Canada, & Mexico; Western Europe - Germany, France, The UK, Spain, Italy, Portugal, Ireland, Austria, Switzerland, Benelux, Nordic, & Rest of Western Europe; Eastern Europe - Russia, Poland, The Czech Republic, Greece, & Rest of Eastern Europe; APAC - China, Japan, South Korea, India, Australia & New Zealand, Indonesia, Malaysia, Philippines, Singapore, Thailand, Vietnam, & Rest of APAC; Latin America - Brazil, Colombia, Chile, Argentina, Costa Rica, & Rest of Latin America; Middle East & Africa - Algeria, Egypt, Israel, Kuwait, Nigeria, Saudi Arabia, South Africa, Turkey, United Arab Emirates, & Rest of MEA Competitive Landscape Raytheon Technologies Corporation, Furuno Electric Co., Ltd., Northrop Grumman Corporation, Lockheed Martin Corporation, Saab AB, Kongsberg Gruppen, Japan Radio Co., Ltd., Terma A/S, Garmin Ltd., Hensoldt AG, Kelvin Hughes Limited, Northrop Grumman Sperry Marine B.V., Icom Inc., Simrad, BendixKing Customization Scope Customization for segments, region/country-level will be provided. Moreover, additional customization can be done based on the requirements. Purchase Options We have three licenses to opt for: Single User License, Multi-User License (Up to 5 Users), Corporate Use License (Unlimited User and Printable PDF) -
- 1. Executive Summary
- 1.1. Definition
- 1.2. Taxonomy
- 1.3. Research Scope
- 1.4. Key Analysis
- 1.5. Key Findings by Major Segments
- 1.6. Top strategies by Major Players
- 2. Global Marine Radar Market Overview
- 2.1. Marine Radar Market Dynamics
- 2.1.1. Drivers
- 2.1.2. Opportunities
- 2.1.3. Restraints
- 2.1.4. Challenges
- 2.2. Macro-economic Factors
- 2.3. Regulatory Framework
- 2.4. Market Investment Feasibility Index
- 2.5. PEST Analysis
- 2.6. PORTER’S Five Force Analysis
- 2.7. Drivers & Restraints Impact Analysis
- 2.8. Industry Chain Analysis
- 2.9. Cost Structure Analysis
- 2.10. Marketing Strategy
- 2.11. Russia-Ukraine War Impact Analysis
- 2.12. Opportunity Map Analysis
- 2.13. Market Competition Scenario Analysis
- 2.14. Product Life Cycle Analysis
- 2.15. Opportunity Orbits
- 2.16. Manufacturer Intensity Map
- 2.17. Major Companies sales by Value & Volume
- 2.1. Marine Radar Market Dynamics
- 3. Global Marine Radar Market Analysis, Opportunity and Forecast, 2016-2033
- 3.1. Global Marine Radar Market Analysis, 2016-2021
- 3.2. Global Marine Radar Market Opportunity and Forecast, 2023-2033
- 3.3. Global Marine Radar Market Analysis, Opportunity and Forecast, By Type, 2016-2033
- 3.3.1. Global Marine Radar Market Analysis by Type: Introduction
- 3.3.2. Market Size Absolute $ Opportunity Analysis and Forecast, By Type, 2016-2033
- 3.3.3. X-band Radar
- 3.3.4. S-band Radar
- 3.3.5. Ku-band Radar
- 3.3.6. Others
- 3.4. Global Marine Radar Market Analysis, Opportunity and Forecast, By Technology, 2016-2033
- 3.4.1. Global Marine Radar Market Analysis by Technology: Introduction
- 3.4.2. Market Size Absolute $ Opportunity Analysis and Forecast, By Technology, 2016-2033
- 3.4.3. Pulse Radar
- 3.4.4. Frequency Modulated Continuous Wave (FMCW) Radar
- 3.4.5. Doppler Radar
- 3.5. Global Marine Radar Market Analysis, Opportunity and Forecast, By Application, 2016-2033
- 3.5.1. Global Marine Radar Market Analysis by Application: Introduction
- 3.5.2. Market Size Absolute $ Opportunity Analysis and Forecast, By Application, 2016-2033
- 3.5.3. Commercial Ships
- 3.5.4. Defense Vessels
- 3.5.5. Recreational Boats
- 3.5.6. Others
- 3.6. Global Marine Radar Market Analysis, Opportunity and Forecast, By End User, 2016-2033
- 3.6.1. Global Marine Radar Market Analysis by End User: Introduction
- 3.6.2. Market Size Absolute $ Opportunity Analysis and Forecast, By End User, 2016-2033
- 3.6.3. OEMs
- 3.6.4. Aftermarket
- 4. North America Marine Radar Market Analysis, Opportunity and Forecast, 2016-2033
- 4.1. North America Marine Radar Market Analysis, 2016-2021
- 4.2. North America Marine Radar Market Opportunity and Forecast, 2023-2033
- 4.3. North America Marine Radar Market Analysis, Opportunity and Forecast, By Type, 2016-2033
- 4.3.1. North America Marine Radar Market Analysis by Type: Introduction
- 4.3.2. Market Size Absolute $ Opportunity Analysis and Forecast, By Type, 2016-2033
- 4.3.3. X-band Radar
- 4.3.4. S-band Radar
- 4.3.5. Ku-band Radar
- 4.3.6. Others
- 4.4. North America Marine Radar Market Analysis, Opportunity and Forecast, By Technology, 2016-2033
- 4.4.1. North America Marine Radar Market Analysis by Technology: Introduction
- 4.4.2. Market Size Absolute $ Opportunity Analysis and Forecast, By Technology, 2016-2033
- 4.4.3. Pulse Radar
- 4.4.4. Frequency Modulated Continuous Wave (FMCW) Radar
- 4.4.5. Doppler Radar
- 4.5. North America Marine Radar Market Analysis, Opportunity and Forecast, By Application, 2016-2033
- 4.5.1. North America Marine Radar Market Analysis by Application: Introduction
- 4.5.2. Market Size Absolute $ Opportunity Analysis and Forecast, By Application, 2016-2033
- 4.5.3. Commercial Ships
- 4.5.4. Defense Vessels
- 4.5.5. Recreational Boats
- 4.5.6. Others
- 4.6. North America Marine Radar Market Analysis, Opportunity and Forecast, By End User, 2016-2033
- 4.6.1. North America Marine Radar Market Analysis by End User: Introduction
- 4.6.2. Market Size Absolute $ Opportunity Analysis and Forecast, By End User, 2016-2033
- 4.6.3. OEMs
- 4.6.4. Aftermarket
- 4.7. North America Marine Radar Market Analysis, Opportunity and Forecast, By Country , 2016-2033
- 4.7.1. North America Marine Radar Market Analysis by Country : Introduction
- 4.7.2. Market Size Absolute $ Opportunity Analysis and Forecast, Country , 2016-2033
- 4.7.2.1. The US
- 4.7.2.2. Canada
- 4.7.2.3. Mexico
- 5. Western Europe Marine Radar Market Analysis, Opportunity and Forecast, 2016-2033
- 5.1. Western Europe Marine Radar Market Analysis, 2016-2021
- 5.2. Western Europe Marine Radar Market Opportunity and Forecast, 2023-2033
- 5.3. Western Europe Marine Radar Market Analysis, Opportunity and Forecast, By Type, 2016-2033
- 5.3.1. Western Europe Marine Radar Market Analysis by Type: Introduction
- 5.3.2. Market Size Absolute $ Opportunity Analysis and Forecast, By Type, 2016-2033
- 5.3.3. X-band Radar
- 5.3.4. S-band Radar
- 5.3.5. Ku-band Radar
- 5.3.6. Others
- 5.4. Western Europe Marine Radar Market Analysis, Opportunity and Forecast, By Technology, 2016-2033
- 5.4.1. Western Europe Marine Radar Market Analysis by Technology: Introduction
- 5.4.2. Market Size Absolute $ Opportunity Analysis and Forecast, By Technology, 2016-2033
- 5.4.3. Pulse Radar
- 5.4.4. Frequency Modulated Continuous Wave (FMCW) Radar
- 5.4.5. Doppler Radar
- 5.5. Western Europe Marine Radar Market Analysis, Opportunity and Forecast, By Application, 2016-2033
- 5.5.1. Western Europe Marine Radar Market Analysis by Application: Introduction
- 5.5.2. Market Size Absolute $ Opportunity Analysis and Forecast, By Application, 2016-2033
- 5.5.3. Commercial Ships
- 5.5.4. Defense Vessels
- 5.5.5. Recreational Boats
- 5.5.6. Others
- 5.6. Western Europe Marine Radar Market Analysis, Opportunity and Forecast, By End User, 2016-2033
- 5.6.1. Western Europe Marine Radar Market Analysis by End User: Introduction
- 5.6.2. Market Size Absolute $ Opportunity Analysis and Forecast, By End User, 2016-2033
- 5.6.3. OEMs
- 5.6.4. Aftermarket
- 5.7. Western Europe Marine Radar Market Analysis, Opportunity and Forecast, By Country , 2016-2033
- 5.7.1. Western Europe Marine Radar Market Analysis by Country : Introduction
- 5.7.2. Market Size Absolute $ Opportunity Analysis and Forecast, Country , 2016-2033
- 5.7.2.1. Germany
- 5.7.2.2. France
- 5.7.2.3. The UK
- 5.7.2.4. Spain
- 5.7.2.5. Italy
- 5.7.2.6. Portugal
- 5.7.2.7. Ireland
- 5.7.2.8. Austria
- 5.7.2.9. Switzerland
- 5.7.2.10. Benelux
- 5.7.2.11. Nordic
- 5.7.2.12. Rest of Western Europe
- 6. Eastern Europe Marine Radar Market Analysis, Opportunity and Forecast, 2016-2033
- 6.1. Eastern Europe Marine Radar Market Analysis, 2016-2021
- 6.2. Eastern Europe Marine Radar Market Opportunity and Forecast, 2023-2033
- 6.3. Eastern Europe Marine Radar Market Analysis, Opportunity and Forecast, By Type, 2016-2033
- 6.3.1. Eastern Europe Marine Radar Market Analysis by Type: Introduction
- 6.3.2. Market Size Absolute $ Opportunity Analysis and Forecast, By Type, 2016-2033
- 6.3.3. X-band Radar
- 6.3.4. S-band Radar
- 6.3.5. Ku-band Radar
- 6.3.6. Others
- 6.4. Eastern Europe Marine Radar Market Analysis, Opportunity and Forecast, By Technology, 2016-2033
- 6.4.1. Eastern Europe Marine Radar Market Analysis by Technology: Introduction
- 6.4.2. Market Size Absolute $ Opportunity Analysis and Forecast, By Technology, 2016-2033
- 6.4.3. Pulse Radar
- 6.4.4. Frequency Modulated Continuous Wave (FMCW) Radar
- 6.4.5. Doppler Radar
- 6.5. Eastern Europe Marine Radar Market Analysis, Opportunity and Forecast, By Application, 2016-2033
- 6.5.1. Eastern Europe Marine Radar Market Analysis by Application: Introduction
- 6.5.2. Market Size Absolute $ Opportunity Analysis and Forecast, By Application, 2016-2033
- 6.5.3. Commercial Ships
- 6.5.4. Defense Vessels
- 6.5.5. Recreational Boats
- 6.5.6. Others
- 6.6. Eastern Europe Marine Radar Market Analysis, Opportunity and Forecast, By End User, 2016-2033
- 6.6.1. Eastern Europe Marine Radar Market Analysis by End User: Introduction
- 6.6.2. Market Size Absolute $ Opportunity Analysis and Forecast, By End User, 2016-2033
- 6.6.3. OEMs
- 6.6.4. Aftermarket
- 6.7. Eastern Europe Marine Radar Market Analysis, Opportunity and Forecast, By Country , 2016-2033
- 6.7.1. Eastern Europe Marine Radar Market Analysis by Country : Introduction
- 6.7.2. Market Size Absolute $ Opportunity Analysis and Forecast, Country , 2016-2033
- 6.7.2.1. Russia
- 6.7.2.2. Poland
- 6.7.2.3. The Czech Republic
- 6.7.2.4. Greece
- 6.7.2.5. Rest of Eastern Europe
- 7. APAC Marine Radar Market Analysis, Opportunity and Forecast, 2016-2033
- 7.1. APAC Marine Radar Market Analysis, 2016-2021
- 7.2. APAC Marine Radar Market Opportunity and Forecast, 2023-2033
- 7.3. APAC Marine Radar Market Analysis, Opportunity and Forecast, By Type, 2016-2033
- 7.3.1. APAC Marine Radar Market Analysis by Type: Introduction
- 7.3.2. Market Size Absolute $ Opportunity Analysis and Forecast, By Type, 2016-2033
- 7.3.3. X-band Radar
- 7.3.4. S-band Radar
- 7.3.5. Ku-band Radar
- 7.3.6. Others
- 7.4. APAC Marine Radar Market Analysis, Opportunity and Forecast, By Technology, 2016-2033
- 7.4.1. APAC Marine Radar Market Analysis by Technology: Introduction
- 7.4.2. Market Size Absolute $ Opportunity Analysis and Forecast, By Technology, 2016-2033
- 7.4.3. Pulse Radar
- 7.4.4. Frequency Modulated Continuous Wave (FMCW) Radar
- 7.4.5. Doppler Radar
- 7.5. APAC Marine Radar Market Analysis, Opportunity and Forecast, By Application, 2016-2033
- 7.5.1. APAC Marine Radar Market Analysis by Application: Introduction
- 7.5.2. Market Size Absolute $ Opportunity Analysis and Forecast, By Application, 2016-2033
- 7.5.3. Commercial Ships
- 7.5.4. Defense Vessels
- 7.5.5. Recreational Boats
- 7.5.6. Others
- 7.6. APAC Marine Radar Market Analysis, Opportunity and Forecast, By End User, 2016-2033
- 7.6.1. APAC Marine Radar Market Analysis by End User: Introduction
- 7.6.2. Market Size Absolute $ Opportunity Analysis and Forecast, By End User, 2016-2033
- 7.6.3. OEMs
- 7.6.4. Aftermarket
- 7.7. APAC Marine Radar Market Analysis, Opportunity and Forecast, By Country , 2016-2033
- 7.7.1. APAC Marine Radar Market Analysis by Country : Introduction
- 7.7.2. Market Size Absolute $ Opportunity Analysis and Forecast, Country , 2016-2033
- 7.7.2.1. China
- 7.7.2.2. Japan
- 7.7.2.3. South Korea
- 7.7.2.4. India
- 7.7.2.5. Australia & New Zeland
- 7.7.2.6. Indonesia
- 7.7.2.7. Malaysia
- 7.7.2.8. Philippines
- 7.7.2.9. Singapore
- 7.7.2.10. Thailand
- 7.7.2.11. Vietnam
- 7.7.2.12. Rest of APAC
- 8. Latin America Marine Radar Market Analysis, Opportunity and Forecast, 2016-2033
- 8.1. Latin America Marine Radar Market Analysis, 2016-2021
- 8.2. Latin America Marine Radar Market Opportunity and Forecast, 2023-2033
- 8.3. Latin America Marine Radar Market Analysis, Opportunity and Forecast, By Type, 2016-2033
- 8.3.1. Latin America Marine Radar Market Analysis by Type: Introduction
- 8.3.2. Market Size Absolute $ Opportunity Analysis and Forecast, By Type, 2016-2033
- 8.3.3. X-band Radar
- 8.3.4. S-band Radar
- 8.3.5. Ku-band Radar
- 8.3.6. Others
- 8.4. Latin America Marine Radar Market Analysis, Opportunity and Forecast, By Technology, 2016-2033
- 8.4.1. Latin America Marine Radar Market Analysis by Technology: Introduction
- 8.4.2. Market Size Absolute $ Opportunity Analysis and Forecast, By Technology, 2016-2033
- 8.4.3. Pulse Radar
- 8.4.4. Frequency Modulated Continuous Wave (FMCW) Radar
- 8.4.5. Doppler Radar
- 8.5. Latin America Marine Radar Market Analysis, Opportunity and Forecast, By Application, 2016-2033
- 8.5.1. Latin America Marine Radar Market Analysis by Application: Introduction
- 8.5.2. Market Size Absolute $ Opportunity Analysis and Forecast, By Application, 2016-2033
- 8.5.3. Commercial Ships
- 8.5.4. Defense Vessels
- 8.5.5. Recreational Boats
- 8.5.6. Others
- 8.6. Latin America Marine Radar Market Analysis, Opportunity and Forecast, By End User, 2016-2033
- 8.6.1. Latin America Marine Radar Market Analysis by End User: Introduction
- 8.6.2. Market Size Absolute $ Opportunity Analysis and Forecast, By End User, 2016-2033
- 8.6.3. OEMs
- 8.6.4. Aftermarket
- 8.7. Latin America Marine Radar Market Analysis, Opportunity and Forecast, By Country , 2016-2033
- 8.7.1. Latin America Marine Radar Market Analysis by Country : Introduction
- 8.7.2. Market Size Absolute $ Opportunity Analysis and Forecast, Country , 2016-2033
- 8.7.2.1. Brazil
- 8.7.2.2. Colombia
- 8.7.2.3. Chile
- 8.7.2.4. Argentina
- 8.7.2.5. Costa Rica
- 8.7.2.6. Rest of Latin America
- 9. Middle East & Africa Marine Radar Market Analysis, Opportunity and Forecast, 2016-2033
- 9.1. Middle East & Africa Marine Radar Market Analysis, 2016-2021
- 9.2. Middle East & Africa Marine Radar Market Opportunity and Forecast, 2023-2033
- 9.3. Middle East & Africa Marine Radar Market Analysis, Opportunity and Forecast, By Type, 2016-2033
- 9.3.1. Middle East & Africa Marine Radar Market Analysis by Type: Introduction
- 9.3.2. Market Size Absolute $ Opportunity Analysis and Forecast, By Type, 2016-2033
- 9.3.3. X-band Radar
- 9.3.4. S-band Radar
- 9.3.5. Ku-band Radar
- 9.3.6. Others
- 9.4. Middle East & Africa Marine Radar Market Analysis, Opportunity and Forecast, By Technology, 2016-2033
- 9.4.1. Middle East & Africa Marine Radar Market Analysis by Technology: Introduction
- 9.4.2. Market Size Absolute $ Opportunity Analysis and Forecast, By Technology, 2016-2033
- 9.4.3. Pulse Radar
- 9.4.4. Frequency Modulated Continuous Wave (FMCW) Radar
- 9.4.5. Doppler Radar
- 9.5. Middle East & Africa Marine Radar Market Analysis, Opportunity and Forecast, By Application, 2016-2033
- 9.5.1. Middle East & Africa Marine Radar Market Analysis by Application: Introduction
- 9.5.2. Market Size Absolute $ Opportunity Analysis and Forecast, By Application, 2016-2033
- 9.5.3. Commercial Ships
- 9.5.4. Defense Vessels
- 9.5.5. Recreational Boats
- 9.5.6. Others
- 9.6. Middle East & Africa Marine Radar Market Analysis, Opportunity and Forecast, By End User, 2016-2033
- 9.6.1. Middle East & Africa Marine Radar Market Analysis by End User: Introduction
- 9.6.2. Market Size Absolute $ Opportunity Analysis and Forecast, By End User, 2016-2033
- 9.6.3. OEMs
- 9.6.4. Aftermarket
- 9.7. Middle East & Africa Marine Radar Market Analysis, Opportunity and Forecast, By Country , 2016-2033
- 9.7.1. Middle East & Africa Marine Radar Market Analysis by Country : Introduction
- 9.7.2. Market Size Absolute $ Opportunity Analysis and Forecast, Country , 2016-2033
- 9.7.2.1. Algeria
- 9.7.2.2. Egypt
- 9.7.2.3. Israel
- 9.7.2.4. Kuwait
- 9.7.2.5. Nigeria
- 9.7.2.6. Saudi Arabia
- 9.7.2.7. South Africa
- 9.7.2.8. Turkey
- 9.7.2.9. The UAE
- 9.7.2.10. Rest of MEA
- 10. Global Marine Radar Market Analysis, Opportunity and Forecast, By Region , 2016-2033
- 10.1. Global Marine Radar Market Analysis by Region : Introduction
- 10.2. Market Size Absolute $ Opportunity Analysis and Forecast, By Region , 2016-2033
- 10.2.1. North America
- 10.2.2. Western Europe
- 10.2.3. Eastern Europe
- 10.2.4. APAC
- 10.2.5. Latin America
- 10.2.6. Middle East & Africa
- 11. Global Marine Radar Market Competitive Landscape, Market Share Analysis, and Company Profiles
- 11.1. Market Share Analysis
- 11.2. Company Profiles
- 11.3. Raytheon Technologies Corporation
- 11.3.1. Company Overview
- 11.3.2. Financial Highlights
- 11.3.3. Product Portfolio
- 11.3.4. SWOT Analysis
- 11.3.5. Key Strategies and Developments
- 11.4. Furuno Electric Co., Ltd.
- 11.4.1. Company Overview
- 11.4.2. Financial Highlights
- 11.4.3. Product Portfolio
- 11.4.4. SWOT Analysis
- 11.4.5. Key Strategies and Developments
- 11.5. Northrop Grumman Corporation
- 11.5.1. Company Overview
- 11.5.2. Financial Highlights
- 11.5.3. Product Portfolio
- 11.5.4. SWOT Analysis
- 11.5.5. Key Strategies and Developments
- 11.6. Lockheed Martin Corporation
- 11.6.1. Company Overview
- 11.6.2. Financial Highlights
- 11.6.3. Product Portfolio
- 11.6.4. SWOT Analysis
- 11.6.5. Key Strategies and Developments
- 11.7. Saab AB
- 11.7.1. Company Overview
- 11.7.2. Financial Highlights
- 11.7.3. Product Portfolio
- 11.7.4. SWOT Analysis
- 11.7.5. Key Strategies and Developments
- 11.8. Kongsberg Gruppen
- 11.8.1. Company Overview
- 11.8.2. Financial Highlights
- 11.8.3. Product Portfolio
- 11.8.4. SWOT Analysis
- 11.8.5. Key Strategies and Developments
- 11.9. Japan Radio Co., Ltd.
- 11.9.1. Company Overview
- 11.9.2. Financial Highlights
- 11.9.3. Product Portfolio
- 11.9.4. SWOT Analysis
- 11.9.5. Key Strategies and Developments
- 11.10. Terma A/S
- 11.10.1. Company Overview
- 11.10.2. Financial Highlights
- 11.10.3. Product Portfolio
- 11.10.4. SWOT Analysis
- 11.10.5. Key Strategies and Developments
- 11.11. Garmin Ltd.
- 11.11.1. Company Overview
- 11.11.2. Financial Highlights
- 11.11.3. Product Portfolio
- 11.11.4. SWOT Analysis
- 11.11.5. Key Strategies and Developments
- 11.12. Hensoldt AG
- 11.12.1. Company Overview
- 11.12.2. Financial Highlights
- 11.12.3. Product Portfolio
- 11.12.4. SWOT Analysis
- 11.12.5. Key Strategies and Developments
- 11.13.1. Company Overview
- 11.13.2. Financial Highlights
- 11.13.3. Product Portfolio
- 11.13.4. SWOT Analysis
- 11.13.5. Key Strategies and Developments
- 11.14. Kelvin Hughes Limited
- 11.14.1. Company Overview
- 11.14.2. Financial Highlights
- 11.14.3. Product Portfolio
- 11.14.4. SWOT Analysis
- 11.14.5. Key Strategies and Developments
- 11.15. Icom Inc.
- 11.15.1. Company Overview
- 11.15.2. Financial Highlights
- 11.15.3. Product Portfolio
- 11.15.4. SWOT Analysis
- 11.15.5. Key Strategies and Developments
- 11.16. Simrad
- 11.16.1. Company Overview
- 11.16.2. Financial Highlights
- 11.16.3. Product Portfolio
- 11.16.4. SWOT Analysis
- 11.16.5. Key Strategies and Developments
- 11.17. BendixKing
- 11.17.1. Company Overview
- 11.17.2. Financial Highlights
- 11.17.3. Product Portfolio
- 11.17.4. SWOT Analysis
- 11.17.5. Key Strategies and Developments
- 12. Assumptions and Acronyms
- 13. Research Methodology
- 14. Contact
"
- List of Figures
- "
- Figure 1: Global Marine Radar Market Revenue (US$ Mn) Market Share by Type in 2022
- Figure 2: Global Marine Radar Market Attractiveness Analysis by Type, 2016-2033
- Figure 3: Global Marine Radar Market Revenue (US$ Mn) Market Share by Technologyin 2022
- Figure 4: Global Marine Radar Market Attractiveness Analysis by Technology, 2016-2033
- Figure 5: Global Marine Radar Market Revenue (US$ Mn) Market Share by Applicationin 2022
- Figure 6: Global Marine Radar Market Attractiveness Analysis by Application, 2016-2033
- Figure 7: Global Marine Radar Market Revenue (US$ Mn) Market Share by End Userin 2022
- Figure 8: Global Marine Radar Market Attractiveness Analysis by End User, 2016-2033
- Figure 9: Global Marine Radar Market Revenue (US$ Mn) Market Share by Region in 2022
- Figure 10: Global Marine Radar Market Attractiveness Analysis by Region, 2016-2033
- Figure 11: Global Marine Radar Market Revenue (US$ Mn) (2016-2033)
- Figure 12: Global Marine Radar Market Revenue (US$ Mn) Comparison by Region (2016-2033)
- Figure 13: Global Marine Radar Market Revenue (US$ Mn) Comparison by Type (2016-2033)
- Figure 14: Global Marine Radar Market Revenue (US$ Mn) Comparison by Technology (2016-2033)
- Figure 15: Global Marine Radar Market Revenue (US$ Mn) Comparison by Application (2016-2033)
- Figure 16: Global Marine Radar Market Revenue (US$ Mn) Comparison by End User (2016-2033)
- Figure 17: Global Marine Radar Market Y-o-Y Growth Rate Comparison by Region (2016-2033)
- Figure 18: Global Marine Radar Market Y-o-Y Growth Rate Comparison by Type (2016-2033)
- Figure 19: Global Marine Radar Market Y-o-Y Growth Rate Comparison by Technology (2016-2033)
- Figure 20: Global Marine Radar Market Y-o-Y Growth Rate Comparison by Application (2016-2033)
- Figure 21: Global Marine Radar Market Y-o-Y Growth Rate Comparison by End User (2016-2033)
- Figure 22: Global Marine Radar Market Share Comparison by Region (2016-2033)
- Figure 23: Global Marine Radar Market Share Comparison by Type (2016-2033)
- Figure 24: Global Marine Radar Market Share Comparison by Technology (2016-2033)
- Figure 25: Global Marine Radar Market Share Comparison by Application (2016-2033)
- Figure 26: Global Marine Radar Market Share Comparison by End User (2016-2033)
- Figure 27: North America Marine Radar Market Revenue (US$ Mn) Market Share by Typein 2022
- Figure 28: North America Marine Radar Market Attractiveness Analysis by Type, 2016-2033
- Figure 29: North America Marine Radar Market Revenue (US$ Mn) Market Share by Technologyin 2022
- Figure 30: North America Marine Radar Market Attractiveness Analysis by Technology, 2016-2033
- Figure 31: North America Marine Radar Market Revenue (US$ Mn) Market Share by Applicationin 2022
- Figure 32: North America Marine Radar Market Attractiveness Analysis by Application, 2016-2033
- Figure 33: North America Marine Radar Market Revenue (US$ Mn) Market Share by End Userin 2022
- Figure 34: North America Marine Radar Market Attractiveness Analysis by End User, 2016-2033
- Figure 35: North America Marine Radar Market Revenue (US$ Mn) Market Share by Country in 2022
- Figure 36: North America Marine Radar Market Attractiveness Analysis by Country, 2016-2033
- Figure 37: North America Marine Radar Market Revenue (US$ Mn) (2016-2033)
- Figure 38: North America Marine Radar Market Revenue (US$ Mn) Comparison by Country (2016-2033)
- Figure 39: North America Marine Radar Market Revenue (US$ Mn) Comparison by Type (2016-2033)
- Figure 40: North America Marine Radar Market Revenue (US$ Mn) Comparison by Technology (2016-2033)
- Figure 41: North America Marine Radar Market Revenue (US$ Mn) Comparison by Application (2016-2033)
- Figure 42: North America Marine Radar Market Revenue (US$ Mn) Comparison by End User (2016-2033)
- Figure 43: North America Marine Radar Market Y-o-Y Growth Rate Comparison by Country (2016-2033)
- Figure 44: North America Marine Radar Market Y-o-Y Growth Rate Comparison by Type (2016-2033)
- Figure 45: North America Marine Radar Market Y-o-Y Growth Rate Comparison by Technology (2016-2033)
- Figure 46: North America Marine Radar Market Y-o-Y Growth Rate Comparison by Application (2016-2033)
- Figure 47: North America Marine Radar Market Y-o-Y Growth Rate Comparison by End User (2016-2033)
- Figure 48: North America Marine Radar Market Share Comparison by Country (2016-2033)
- Figure 49: North America Marine Radar Market Share Comparison by Type (2016-2033)
- Figure 50: North America Marine Radar Market Share Comparison by Technology (2016-2033)
- Figure 51: North America Marine Radar Market Share Comparison by Application (2016-2033)
- Figure 52: North America Marine Radar Market Share Comparison by End User (2016-2033)
- Figure 53: Western Europe Marine Radar Market Revenue (US$ Mn) Market Share by Typein 2022
- Figure 54: Western Europe Marine Radar Market Attractiveness Analysis by Type, 2016-2033
- Figure 55: Western Europe Marine Radar Market Revenue (US$ Mn) Market Share by Technologyin 2022
- Figure 56: Western Europe Marine Radar Market Attractiveness Analysis by Technology, 2016-2033
- Figure 57: Western Europe Marine Radar Market Revenue (US$ Mn) Market Share by Applicationin 2022
- Figure 58: Western Europe Marine Radar Market Attractiveness Analysis by Application, 2016-2033
- Figure 59: Western Europe Marine Radar Market Revenue (US$ Mn) Market Share by End Userin 2022
- Figure 60: Western Europe Marine Radar Market Attractiveness Analysis by End User, 2016-2033
- Figure 61: Western Europe Marine Radar Market Revenue (US$ Mn) Market Share by Country in 2022
- Figure 62: Western Europe Marine Radar Market Attractiveness Analysis by Country, 2016-2033
- Figure 63: Western Europe Marine Radar Market Revenue (US$ Mn) (2016-2033)
- Figure 64: Western Europe Marine Radar Market Revenue (US$ Mn) Comparison by Country (2016-2033)
- Figure 65: Western Europe Marine Radar Market Revenue (US$ Mn) Comparison by Type (2016-2033)
- Figure 66: Western Europe Marine Radar Market Revenue (US$ Mn) Comparison by Technology (2016-2033)
- Figure 67: Western Europe Marine Radar Market Revenue (US$ Mn) Comparison by Application (2016-2033)
- Figure 68: Western Europe Marine Radar Market Revenue (US$ Mn) Comparison by End User (2016-2033)
- Figure 69: Western Europe Marine Radar Market Y-o-Y Growth Rate Comparison by Country (2016-2033)
- Figure 70: Western Europe Marine Radar Market Y-o-Y Growth Rate Comparison by Type (2016-2033)
- Figure 71: Western Europe Marine Radar Market Y-o-Y Growth Rate Comparison by Technology (2016-2033)
- Figure 72: Western Europe Marine Radar Market Y-o-Y Growth Rate Comparison by Application (2016-2033)
- Figure 73: Western Europe Marine Radar Market Y-o-Y Growth Rate Comparison by End User (2016-2033)
- Figure 74: Western Europe Marine Radar Market Share Comparison by Country (2016-2033)
- Figure 75: Western Europe Marine Radar Market Share Comparison by Type (2016-2033)
- Figure 76: Western Europe Marine Radar Market Share Comparison by Technology (2016-2033)
- Figure 77: Western Europe Marine Radar Market Share Comparison by Application (2016-2033)
- Figure 78: Western Europe Marine Radar Market Share Comparison by End User (2016-2033)
- Figure 79: Eastern Europe Marine Radar Market Revenue (US$ Mn) Market Share by Typein 2022
- Figure 80: Eastern Europe Marine Radar Market Attractiveness Analysis by Type, 2016-2033
- Figure 81: Eastern Europe Marine Radar Market Revenue (US$ Mn) Market Share by Technologyin 2022
- Figure 82: Eastern Europe Marine Radar Market Attractiveness Analysis by Technology, 2016-2033
- Figure 83: Eastern Europe Marine Radar Market Revenue (US$ Mn) Market Share by Applicationin 2022
- Figure 84: Eastern Europe Marine Radar Market Attractiveness Analysis by Application, 2016-2033
- Figure 85: Eastern Europe Marine Radar Market Revenue (US$ Mn) Market Share by End Userin 2022
- Figure 86: Eastern Europe Marine Radar Market Attractiveness Analysis by End User, 2016-2033
- Figure 87: Eastern Europe Marine Radar Market Revenue (US$ Mn) Market Share by Country in 2022
- Figure 88: Eastern Europe Marine Radar Market Attractiveness Analysis by Country, 2016-2033
- Figure 89: Eastern Europe Marine Radar Market Revenue (US$ Mn) (2016-2033)
- Figure 90: Eastern Europe Marine Radar Market Revenue (US$ Mn) Comparison by Country (2016-2033)
- Figure 91: Eastern Europe Marine Radar Market Revenue (US$ Mn) Comparison by Type (2016-2033)
- Figure 92: Eastern Europe Marine Radar Market Revenue (US$ Mn) Comparison by Technology (2016-2033)
- Figure 93: Eastern Europe Marine Radar Market Revenue (US$ Mn) Comparison by Application (2016-2033)
- Figure 94: Eastern Europe Marine Radar Market Revenue (US$ Mn) Comparison by End User (2016-2033)
- Figure 95: Eastern Europe Marine Radar Market Y-o-Y Growth Rate Comparison by Country (2016-2033)
- Figure 96: Eastern Europe Marine Radar Market Y-o-Y Growth Rate Comparison by Type (2016-2033)
- Figure 97: Eastern Europe Marine Radar Market Y-o-Y Growth Rate Comparison by Technology (2016-2033)
- Figure 98: Eastern Europe Marine Radar Market Y-o-Y Growth Rate Comparison by Application (2016-2033)
- Figure 99: Eastern Europe Marine Radar Market Y-o-Y Growth Rate Comparison by End User (2016-2033)
- Figure 100: Eastern Europe Marine Radar Market Share Comparison by Country (2016-2033)
- Figure 101: Eastern Europe Marine Radar Market Share Comparison by Type (2016-2033)
- Figure 102: Eastern Europe Marine Radar Market Share Comparison by Technology (2016-2033)
- Figure 103: Eastern Europe Marine Radar Market Share Comparison by Application (2016-2033)
- Figure 104: Eastern Europe Marine Radar Market Share Comparison by End User (2016-2033)
- Figure 105: APAC Marine Radar Market Revenue (US$ Mn) Market Share by Typein 2022
- Figure 106: APAC Marine Radar Market Attractiveness Analysis by Type, 2016-2033
- Figure 107: APAC Marine Radar Market Revenue (US$ Mn) Market Share by Technologyin 2022
- Figure 108: APAC Marine Radar Market Attractiveness Analysis by Technology, 2016-2033
- Figure 109: APAC Marine Radar Market Revenue (US$ Mn) Market Share by Applicationin 2022
- Figure 110: APAC Marine Radar Market Attractiveness Analysis by Application, 2016-2033
- Figure 111: APAC Marine Radar Market Revenue (US$ Mn) Market Share by End Userin 2022
- Figure 112: APAC Marine Radar Market Attractiveness Analysis by End User, 2016-2033
- Figure 113: APAC Marine Radar Market Revenue (US$ Mn) Market Share by Country in 2022
- Figure 114: APAC Marine Radar Market Attractiveness Analysis by Country, 2016-2033
- Figure 115: APAC Marine Radar Market Revenue (US$ Mn) (2016-2033)
- Figure 116: APAC Marine Radar Market Revenue (US$ Mn) Comparison by Country (2016-2033)
- Figure 117: APAC Marine Radar Market Revenue (US$ Mn) Comparison by Type (2016-2033)
- Figure 118: APAC Marine Radar Market Revenue (US$ Mn) Comparison by Technology (2016-2033)
- Figure 119: APAC Marine Radar Market Revenue (US$ Mn) Comparison by Application (2016-2033)
- Figure 120: APAC Marine Radar Market Revenue (US$ Mn) Comparison by End User (2016-2033)
- Figure 121: APAC Marine Radar Market Y-o-Y Growth Rate Comparison by Country (2016-2033)
- Figure 122: APAC Marine Radar Market Y-o-Y Growth Rate Comparison by Type (2016-2033)
- Figure 123: APAC Marine Radar Market Y-o-Y Growth Rate Comparison by Technology (2016-2033)
- Figure 124: APAC Marine Radar Market Y-o-Y Growth Rate Comparison by Application (2016-2033)
- Figure 125: APAC Marine Radar Market Y-o-Y Growth Rate Comparison by End User (2016-2033)
- Figure 126: APAC Marine Radar Market Share Comparison by Country (2016-2033)
- Figure 127: APAC Marine Radar Market Share Comparison by Type (2016-2033)
- Figure 128: APAC Marine Radar Market Share Comparison by Technology (2016-2033)
- Figure 129: APAC Marine Radar Market Share Comparison by Application (2016-2033)
- Figure 130: APAC Marine Radar Market Share Comparison by End User (2016-2033)
- Figure 131: Latin America Marine Radar Market Revenue (US$ Mn) Market Share by Typein 2022
- Figure 132: Latin America Marine Radar Market Attractiveness Analysis by Type, 2016-2033
- Figure 133: Latin America Marine Radar Market Revenue (US$ Mn) Market Share by Technologyin 2022
- Figure 134: Latin America Marine Radar Market Attractiveness Analysis by Technology, 2016-2033
- Figure 135: Latin America Marine Radar Market Revenue (US$ Mn) Market Share by Applicationin 2022
- Figure 136: Latin America Marine Radar Market Attractiveness Analysis by Application, 2016-2033
- Figure 137: Latin America Marine Radar Market Revenue (US$ Mn) Market Share by End Userin 2022
- Figure 138: Latin America Marine Radar Market Attractiveness Analysis by End User, 2016-2033
- Figure 139: Latin America Marine Radar Market Revenue (US$ Mn) Market Share by Country in 2022
- Figure 140: Latin America Marine Radar Market Attractiveness Analysis by Country, 2016-2033
- Figure 141: Latin America Marine Radar Market Revenue (US$ Mn) (2016-2033)
- Figure 142: Latin America Marine Radar Market Revenue (US$ Mn) Comparison by Country (2016-2033)
- Figure 143: Latin America Marine Radar Market Revenue (US$ Mn) Comparison by Type (2016-2033)
- Figure 144: Latin America Marine Radar Market Revenue (US$ Mn) Comparison by Technology (2016-2033)
- Figure 145: Latin America Marine Radar Market Revenue (US$ Mn) Comparison by Application (2016-2033)
- Figure 146: Latin America Marine Radar Market Revenue (US$ Mn) Comparison by End User (2016-2033)
- Figure 147: Latin America Marine Radar Market Y-o-Y Growth Rate Comparison by Country (2016-2033)
- Figure 148: Latin America Marine Radar Market Y-o-Y Growth Rate Comparison by Type (2016-2033)
- Figure 149: Latin America Marine Radar Market Y-o-Y Growth Rate Comparison by Technology (2016-2033)
- Figure 150: Latin America Marine Radar Market Y-o-Y Growth Rate Comparison by Application (2016-2033)
- Figure 151: Latin America Marine Radar Market Y-o-Y Growth Rate Comparison by End User (2016-2033)
- Figure 152: Latin America Marine Radar Market Share Comparison by Country (2016-2033)
- Figure 153: Latin America Marine Radar Market Share Comparison by Type (2016-2033)
- Figure 154: Latin America Marine Radar Market Share Comparison by Technology (2016-2033)
- Figure 155: Latin America Marine Radar Market Share Comparison by Application (2016-2033)
- Figure 156: Latin America Marine Radar Market Share Comparison by End User (2016-2033)
- Figure 157: Middle East & Africa Marine Radar Market Revenue (US$ Mn) Market Share by Typein 2022
- Figure 158: Middle East & Africa Marine Radar Market Attractiveness Analysis by Type, 2016-2033
- Figure 159: Middle East & Africa Marine Radar Market Revenue (US$ Mn) Market Share by Technologyin 2022
- Figure 160: Middle East & Africa Marine Radar Market Attractiveness Analysis by Technology, 2016-2033
- Figure 161: Middle East & Africa Marine Radar Market Revenue (US$ Mn) Market Share by Applicationin 2022
- Figure 162: Middle East & Africa Marine Radar Market Attractiveness Analysis by Application, 2016-2033
- Figure 163: Middle East & Africa Marine Radar Market Revenue (US$ Mn) Market Share by End Userin 2022
- Figure 164: Middle East & Africa Marine Radar Market Attractiveness Analysis by End User, 2016-2033
- Figure 165: Middle East & Africa Marine Radar Market Revenue (US$ Mn) Market Share by Country in 2022
- Figure 166: Middle East & Africa Marine Radar Market Attractiveness Analysis by Country, 2016-2033
- Figure 167: Middle East & Africa Marine Radar Market Revenue (US$ Mn) (2016-2033)
- Figure 168: Middle East & Africa Marine Radar Market Revenue (US$ Mn) Comparison by Country (2016-2033)
- Figure 169: Middle East & Africa Marine Radar Market Revenue (US$ Mn) Comparison by Type (2016-2033)
- Figure 170: Middle East & Africa Marine Radar Market Revenue (US$ Mn) Comparison by Technology (2016-2033)
- Figure 171: Middle East & Africa Marine Radar Market Revenue (US$ Mn) Comparison by Application (2016-2033)
- Figure 172: Middle East & Africa Marine Radar Market Revenue (US$ Mn) Comparison by End User (2016-2033)
- Figure 173: Middle East & Africa Marine Radar Market Y-o-Y Growth Rate Comparison by Country (2016-2033)
- Figure 174: Middle East & Africa Marine Radar Market Y-o-Y Growth Rate Comparison by Type (2016-2033)
- Figure 175: Middle East & Africa Marine Radar Market Y-o-Y Growth Rate Comparison by Technology (2016-2033)
- Figure 176: Middle East & Africa Marine Radar Market Y-o-Y Growth Rate Comparison by Application (2016-2033)
- Figure 177: Middle East & Africa Marine Radar Market Y-o-Y Growth Rate Comparison by End User (2016-2033)
- Figure 178: Middle East & Africa Marine Radar Market Share Comparison by Country (2016-2033)
- Figure 179: Middle East & Africa Marine Radar Market Share Comparison by Type (2016-2033)
- Figure 180: Middle East & Africa Marine Radar Market Share Comparison by Technology (2016-2033)
- Figure 181: Middle East & Africa Marine Radar Market Share Comparison by Application (2016-2033)
- Figure 182: Middle East & Africa Marine Radar Market Share Comparison by End User (2016-2033)
"
- List of Tables
- "
- Table 1: Global Marine Radar Market Comparison by Type (2016-2033)
- Table 2: Global Marine Radar Market Comparison by Technology (2016-2033)
- Table 3: Global Marine Radar Market Comparison by Application (2016-2033)
- Table 4: Global Marine Radar Market Comparison by End User (2016-2033)
- Table 5: Global Marine Radar Market Revenue (US$ Mn) Comparison by Region (2016-2033)
- Table 6: Global Marine Radar Market Revenue (US$ Mn) (2016-2033)
- Table 7: Global Marine Radar Market Revenue (US$ Mn) Comparison by Region (2016-2033)
- Table 8: Global Marine Radar Market Revenue (US$ Mn) Comparison by Type (2016-2033)
- Table 9: Global Marine Radar Market Revenue (US$ Mn) Comparison by Technology (2016-2033)
- Table 10: Global Marine Radar Market Revenue (US$ Mn) Comparison by Application (2016-2033)
- Table 11: Global Marine Radar Market Revenue (US$ Mn) Comparison by End User (2016-2033)
- Table 12: Global Marine Radar Market Y-o-Y Growth Rate Comparison by Region (2016-2033)
- Table 13: Global Marine Radar Market Y-o-Y Growth Rate Comparison by Type (2016-2033)
- Table 14: Global Marine Radar Market Y-o-Y Growth Rate Comparison by Technology (2016-2033)
- Table 15: Global Marine Radar Market Y-o-Y Growth Rate Comparison by Application (2016-2033)
- Table 16: Global Marine Radar Market Y-o-Y Growth Rate Comparison by End User (2016-2033)
- Table 17: Global Marine Radar Market Share Comparison by Region (2016-2033)
- Table 18: Global Marine Radar Market Share Comparison by Type (2016-2033)
- Table 19: Global Marine Radar Market Share Comparison by Technology (2016-2033)
- Table 20: Global Marine Radar Market Share Comparison by Application (2016-2033)
- Table 21: Global Marine Radar Market Share Comparison by End User (2016-2033)
- Table 22: North America Marine Radar Market Comparison by Technology (2016-2033)
- Table 23: North America Marine Radar Market Comparison by Application (2016-2033)
- Table 24: North America Marine Radar Market Comparison by End User (2016-2033)
- Table 25: North America Marine Radar Market Revenue (US$ Mn) Comparison by Country (2016-2033)
- Table 26: North America Marine Radar Market Revenue (US$ Mn) (2016-2033)
- Table 27: North America Marine Radar Market Revenue (US$ Mn) Comparison by Country (2016-2033)
- Table 28: North America Marine Radar Market Revenue (US$ Mn) Comparison by Type (2016-2033)
- Table 29: North America Marine Radar Market Revenue (US$ Mn) Comparison by Technology (2016-2033)
- Table 30: North America Marine Radar Market Revenue (US$ Mn) Comparison by Application (2016-2033)
- Table 31: North America Marine Radar Market Revenue (US$ Mn) Comparison by End User (2016-2033)
- Table 32: North America Marine Radar Market Y-o-Y Growth Rate Comparison by Country (2016-2033)
- Table 33: North America Marine Radar Market Y-o-Y Growth Rate Comparison by Type (2016-2033)
- Table 34: North America Marine Radar Market Y-o-Y Growth Rate Comparison by Technology (2016-2033)
- Table 35: North America Marine Radar Market Y-o-Y Growth Rate Comparison by Application (2016-2033)
- Table 36: North America Marine Radar Market Y-o-Y Growth Rate Comparison by End User (2016-2033)
- Table 37: North America Marine Radar Market Share Comparison by Country (2016-2033)
- Table 38: North America Marine Radar Market Share Comparison by Type (2016-2033)
- Table 39: North America Marine Radar Market Share Comparison by Technology (2016-2033)
- Table 40: North America Marine Radar Market Share Comparison by Application (2016-2033)
- Table 41: North America Marine Radar Market Share Comparison by End User (2016-2033)
- Table 42: Western Europe Marine Radar Market Comparison by Type (2016-2033)
- Table 43: Western Europe Marine Radar Market Comparison by Technology (2016-2033)
- Table 44: Western Europe Marine Radar Market Comparison by Application (2016-2033)
- Table 45: Western Europe Marine Radar Market Comparison by End User (2016-2033)
- Table 46: Western Europe Marine Radar Market Revenue (US$ Mn) Comparison by Country (2016-2033)
- Table 47: Western Europe Marine Radar Market Revenue (US$ Mn) (2016-2033)
- Table 48: Western Europe Marine Radar Market Revenue (US$ Mn) Comparison by Country (2016-2033)
- Table 49: Western Europe Marine Radar Market Revenue (US$ Mn) Comparison by Type (2016-2033)
- Table 50: Western Europe Marine Radar Market Revenue (US$ Mn) Comparison by Technology (2016-2033)
- Table 51: Western Europe Marine Radar Market Revenue (US$ Mn) Comparison by Application (2016-2033)
- Table 52: Western Europe Marine Radar Market Revenue (US$ Mn) Comparison by End User (2016-2033)
- Table 53: Western Europe Marine Radar Market Y-o-Y Growth Rate Comparison by Country (2016-2033)
- Table 54: Western Europe Marine Radar Market Y-o-Y Growth Rate Comparison by Type (2016-2033)
- Table 55: Western Europe Marine Radar Market Y-o-Y Growth Rate Comparison by Technology (2016-2033)
- Table 56: Western Europe Marine Radar Market Y-o-Y Growth Rate Comparison by Application (2016-2033)
- Table 57: Western Europe Marine Radar Market Y-o-Y Growth Rate Comparison by End User (2016-2033)
- Table 58: Western Europe Marine Radar Market Share Comparison by Country (2016-2033)
- Table 59: Western Europe Marine Radar Market Share Comparison by Type (2016-2033)
- Table 60: Western Europe Marine Radar Market Share Comparison by Technology (2016-2033)
- Table 61: Western Europe Marine Radar Market Share Comparison by Application (2016-2033)
- Table 62: Western Europe Marine Radar Market Share Comparison by End User (2016-2033)
- Table 63: Eastern Europe Marine Radar Market Comparison by Type (2016-2033)
- Table 64: Eastern Europe Marine Radar Market Comparison by Technology (2016-2033)
- Table 65: Eastern Europe Marine Radar Market Comparison by Application (2016-2033)
- Table 66: Eastern Europe Marine Radar Market Comparison by End User (2016-2033)
- Table 67: Eastern Europe Marine Radar Market Revenue (US$ Mn) Comparison by Country (2016-2033)
- Table 68: Eastern Europe Marine Radar Market Revenue (US$ Mn) (2016-2033)
- Table 69: Eastern Europe Marine Radar Market Revenue (US$ Mn) Comparison by Country (2016-2033)
- Table 70: Eastern Europe Marine Radar Market Revenue (US$ Mn) Comparison by Type (2016-2033)
- Table 71: Eastern Europe Marine Radar Market Revenue (US$ Mn) Comparison by Technology (2016-2033)
- Table 72: Eastern Europe Marine Radar Market Revenue (US$ Mn) Comparison by Application (2016-2033)
- Table 73: Eastern Europe Marine Radar Market Revenue (US$ Mn) Comparison by End User (2016-2033)
- Table 74: Eastern Europe Marine Radar Market Y-o-Y Growth Rate Comparison by Country (2016-2033)
- Table 75: Eastern Europe Marine Radar Market Y-o-Y Growth Rate Comparison by Type (2016-2033)
- Table 76: Eastern Europe Marine Radar Market Y-o-Y Growth Rate Comparison by Technology (2016-2033)
- Table 77: Eastern Europe Marine Radar Market Y-o-Y Growth Rate Comparison by Application (2016-2033)
- Table 78: Eastern Europe Marine Radar Market Y-o-Y Growth Rate Comparison by End User (2016-2033)
- Table 79: Eastern Europe Marine Radar Market Share Comparison by Country (2016-2033)
- Table 80: Eastern Europe Marine Radar Market Share Comparison by Type (2016-2033)
- Table 81: Eastern Europe Marine Radar Market Share Comparison by Technology (2016-2033)
- Table 82: Eastern Europe Marine Radar Market Share Comparison by Application (2016-2033)
- Table 83: Eastern Europe Marine Radar Market Share Comparison by End User (2016-2033)
- Table 84: APAC Marine Radar Market Comparison by Type (2016-2033)
- Table 85: APAC Marine Radar Market Comparison by Technology (2016-2033)
- Table 86: APAC Marine Radar Market Comparison by Application (2016-2033)
- Table 87: APAC Marine Radar Market Comparison by End User (2016-2033)
- Table 88: APAC Marine Radar Market Revenue (US$ Mn) Comparison by Country (2016-2033)
- Table 89: APAC Marine Radar Market Revenue (US$ Mn) (2016-2033)
- Table 90: APAC Marine Radar Market Revenue (US$ Mn) Comparison by Country (2016-2033)
- Table 91: APAC Marine Radar Market Revenue (US$ Mn) Comparison by Type (2016-2033)
- Table 92: APAC Marine Radar Market Revenue (US$ Mn) Comparison by Technology (2016-2033)
- Table 93: APAC Marine Radar Market Revenue (US$ Mn) Comparison by Application (2016-2033)
- Table 94: APAC Marine Radar Market Revenue (US$ Mn) Comparison by End User (2016-2033)
- Table 95: APAC Marine Radar Market Y-o-Y Growth Rate Comparison by Country (2016-2033)
- Table 96: APAC Marine Radar Market Y-o-Y Growth Rate Comparison by Type (2016-2033)
- Table 97: APAC Marine Radar Market Y-o-Y Growth Rate Comparison by Technology (2016-2033)
- Table 98: APAC Marine Radar Market Y-o-Y Growth Rate Comparison by Application (2016-2033)
- Table 99: APAC Marine Radar Market Y-o-Y Growth Rate Comparison by End User (2016-2033)
- Table 100: APAC Marine Radar Market Share Comparison by Country (2016-2033)
- Table 101: APAC Marine Radar Market Share Comparison by Type (2016-2033)
- Table 102: APAC Marine Radar Market Share Comparison by Technology (2016-2033)
- Table 103: APAC Marine Radar Market Share Comparison by Application (2016-2033)
- Table 104: APAC Marine Radar Market Share Comparison by End User (2016-2033)
- Table 105: Latin America Marine Radar Market Comparison by Type (2016-2033)
- Table 106: Latin America Marine Radar Market Comparison by Technology (2016-2033)
- Table 107: Latin America Marine Radar Market Comparison by Application (2016-2033)
- Table 108: Latin America Marine Radar Market Comparison by End User (2016-2033)
- Table 109: Latin America Marine Radar Market Revenue (US$ Mn) Comparison by Country (2016-2033)
- Table 110: Latin America Marine Radar Market Revenue (US$ Mn) (2016-2033)
- Table 111: Latin America Marine Radar Market Revenue (US$ Mn) Comparison by Country (2016-2033)
- Table 112: Latin America Marine Radar Market Revenue (US$ Mn) Comparison by Type (2016-2033)
- Table 113: Latin America Marine Radar Market Revenue (US$ Mn) Comparison by Technology (2016-2033)
- Table 114: Latin America Marine Radar Market Revenue (US$ Mn) Comparison by Application (2016-2033)
- Table 115: Latin America Marine Radar Market Revenue (US$ Mn) Comparison by End User (2016-2033)
- Table 116: Latin America Marine Radar Market Y-o-Y Growth Rate Comparison by Country (2016-2033)
- Table 117: Latin America Marine Radar Market Y-o-Y Growth Rate Comparison by Type (2016-2033)
- Table 118: Latin America Marine Radar Market Y-o-Y Growth Rate Comparison by Technology (2016-2033)
- Table 119: Latin America Marine Radar Market Y-o-Y Growth Rate Comparison by Application (2016-2033)
- Table 120: Latin America Marine Radar Market Y-o-Y Growth Rate Comparison by End User (2016-2033)
- Table 121: Latin America Marine Radar Market Share Comparison by Country (2016-2033)
- Table 122: Latin America Marine Radar Market Share Comparison by Type (2016-2033)
- Table 123: Latin America Marine Radar Market Share Comparison by Technology (2016-2033)
- Table 124: Latin America Marine Radar Market Share Comparison by Application (2016-2033)
- Table 125: Latin America Marine Radar Market Share Comparison by End User (2016-2033)
- Table 126: Middle East & Africa Marine Radar Market Comparison by Type (2016-2033)
- Table 127: Middle East & Africa Marine Radar Market Comparison by Technology (2016-2033)
- Table 128: Middle East & Africa Marine Radar Market Comparison by Application (2016-2033)
- Table 129: Middle East & Africa Marine Radar Market Comparison by End User (2016-2033)
- Table 130: Middle East & Africa Marine Radar Market Revenue (US$ Mn) Comparison by Country (2016-2033)
- Table 131: Middle East & Africa Marine Radar Market Revenue (US$ Mn) (2016-2033)
- Table 132: Middle East & Africa Marine Radar Market Revenue (US$ Mn) Comparison by Country (2016-2033)
- Table 133: Middle East & Africa Marine Radar Market Revenue (US$ Mn) Comparison by Type (2016-2033)
- Table 134: Middle East & Africa Marine Radar Market Revenue (US$ Mn) Comparison by Technology (2016-2033)
- Table 135: Middle East & Africa Marine Radar Market Revenue (US$ Mn) Comparison by Application (2016-2033)
- Table 136: Middle East & Africa Marine Radar Market Revenue (US$ Mn) Comparison by End User (2016-2033)
- Table 137: Middle East & Africa Marine Radar Market Y-o-Y Growth Rate Comparison by Country (2016-2033)
- Table 138: Middle East & Africa Marine Radar Market Y-o-Y Growth Rate Comparison by Type (2016-2033)
- Table 139: Middle East & Africa Marine Radar Market Y-o-Y Growth Rate Comparison by Technology (2016-2033)
- Table 140: Middle East & Africa Marine Radar Market Y-o-Y Growth Rate Comparison by Application (2016-2033)
- Table 141: Middle East & Africa Marine Radar Market Y-o-Y Growth Rate Comparison by End User (2016-2033)
- Table 142: Middle East & Africa Marine Radar Market Share Comparison by Country (2016-2033)
- Table 143: Middle East & Africa Marine Radar Market Share Comparison by Type (2016-2033)
- Table 144: Middle East & Africa Marine Radar Market Share Comparison by Technology (2016-2033)
- Table 145: Middle East & Africa Marine Radar Market Share Comparison by Application (2016-2033)
- Table 146: Middle East & Africa Marine Radar Market Share Comparison by End User (2016-2033)
- 1. Executive Summary
-
- Raytheon Technologies Corporation
- Furuno Electric Co., Ltd.
- Northrop Grumman Corporation
- Lockheed Martin Corporation
- Saab AB
- Kongsberg Gruppen
- Japan Radio Co., Ltd.
- Terma A/S
- Garmin Ltd.
- Hensoldt AG
- Kelvin Hughes Limited
- Northrop Grumman Sperry Marine B.V.
- Icom Inc.
- Simrad
- BendixKing
Our Clients


View Our Licence Options
