
M2M Market By Organization Size(Large Enterprises, SMEs), By Components(Sensors, Actuators, Memory, RFID, Power Modules, Communication Modules), By Applications(Information Technologies (IT), Consumer Electronics, Retail, Transportations & Automotives, Healthcare, Security and Surveillance), By Region And Companies - Industry Segment Outlook, Market Assessment, Competition Scenario, Trends, And Forecast 2024-2033
-
43404
-
Feb 2024
-
179
-


-
This report was compiled by Vishwa Gaul Vishwa is an experienced market research and consulting professional with over 8 years of expertise in the ICT industry, contributing to over 700 reports across telecommunications, software, hardware, and digital solutions. Correspondence Team Lead- ICT Linkedin | Detailed Market research Methodology Our methodology involves a mix of primary research, including interviews with leading mental health experts, and secondary research from reputable medical journals and databases. View Detailed Methodology Page
-
Quick Navigation
Report Overview
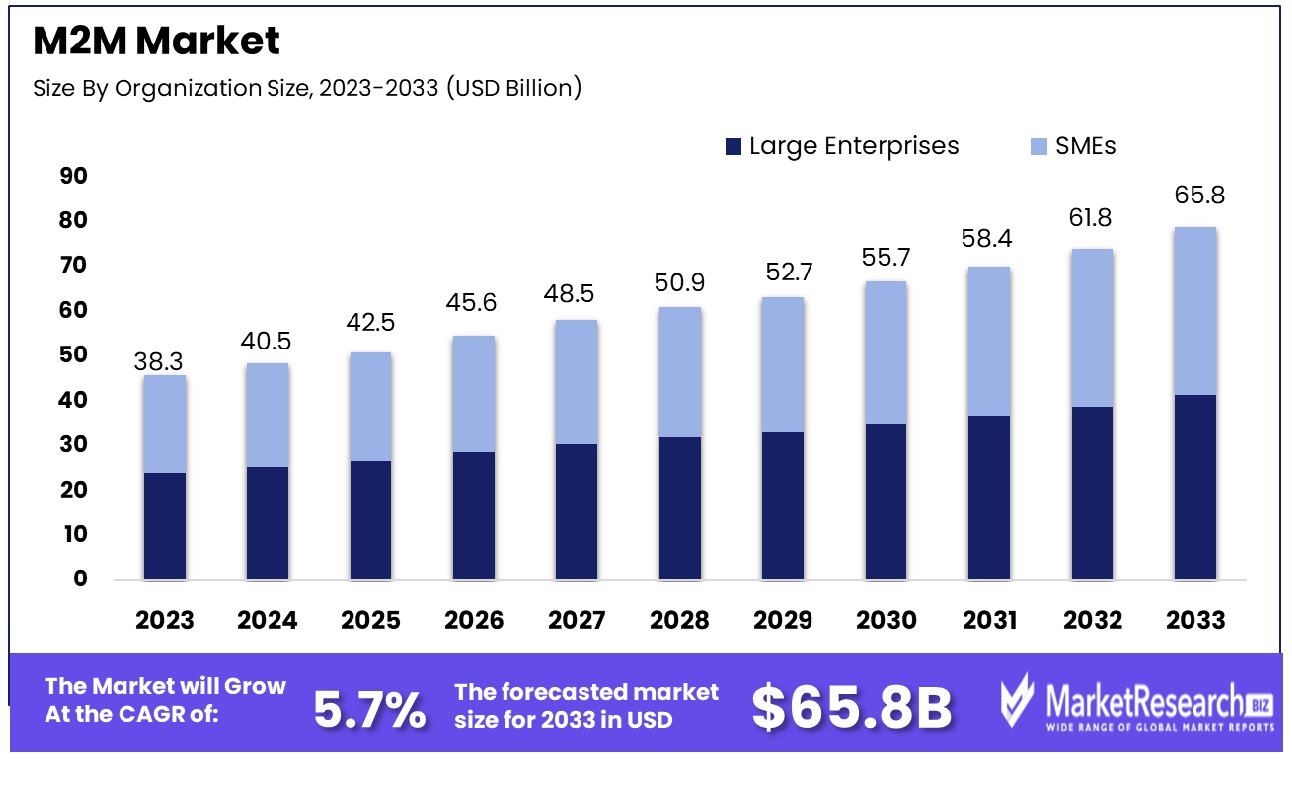
The M2M Market was valued at USD 38.3 billion in 2023. It is expected to reach USD 65.8 billion by 2033, with a CAGR of 5.7% during the forecast period from 2024 to 2033. The surge in demand for smart infrastructures and high internet usage are some of the main key driving factors for the M2M market.
M2M, which is also known as machine-to-machine defined as the automated exchange of information between devices without any manual interference by humans. These technologies are used for a broad range of applications starting from supervising and controlling machines to the indexing of websites by search engines. M2M focuses on different technical fields and how such types of communications work. It is also defined as a device that distinguishes several events and sends them to an application through a network. Such applications then further translate the transmitted event into clear information.
Machine-to-machine technology has gained much popularity due to the rise in internet usage and IP networks, which have made communication easier and effective for longer distances. According to a report published by CISCO, there will be nearly 5.3 billion total internet users by 2023, which is up from 3.9 billion in 2018. Moreover, there are 29.3 networked devices per capita by 2023, which is up from 18.3 networked devices per capita. Similarly, the M2M connection will gradually grow from 33% in 2018 to 50% by 2023. There will be 14.7 billion M2M connections by 2032. Among the M2M connection category which is also known as IoT, the connected home applications will nearly have 48% of the M2M share by 2023.
M2M IoT has different ranges of applications all across the industry vertical by changing the way, businesses work and individuals engage with technology. Industrial automation, agricultural farming, smart healthcare, smart cities, environmental monitoring, smart energy management, and customer engagements are some of the industrial verticals where M2M IoT is widely used. There are several benefits of using M2M communications such as it accelerates the process of transmission and data transfers. These also comprise remote control devices, decrease the requirement for maintenance, and are cost-effective. It also develops many new job and business opportunities in It sectors that enable the firms to enhance maintenance and customer services. The demand for the M2M will increase due to its requirement in various industrial sectors that will help in market expansion in the coming years.
Key Takeaways
- Market Growth: M2M Market was valued at USD 38.3 billion in 2023, It is expected to reach USD 65.8 billion by 2033, with a CAGR of 5.7% during the forecast period from 2024 to 2033.
- By Organization Size: In organization size, large enterprises dominate the M2M market, showcasing a prominent presence and influence.
- By Components: Sensors are the dominant component in M2M technology, playing a crucial role in data collection and transmission.
- By Applications: M2M applications span across diverse sectors including IT, consumer electronics, retail, transportation, healthcare, and security.
- Regional Dominance: In the M2M market, North America commands a significant 40% market share.
- Growth Opportunity: Connected cars drive M2M market growth, while M2M tech boosts energy efficiency, aligning with sustainability goals in various industries.
Driving factors
IoT Device Proliferation Catalyzes M2M Market Growth
The growing popularity of IoT devices is the reason for the growth market for the Machine-to-Machine (M2M) marketplace. With internet usage soaring to 5.3 billion users in 2023, approximately two-thirds of the global population is now connected. This dramatic rise from 2 billion users in 2011 signifies an unprecedented growth in digital connectivity. This burgeoning network of interconnected devices, encompassing smart homes, wearables, and connected cars, is forecasted to escalate the demand for M2M services, marking a transformative phase in the market.
Cellular Technology Advancements Fuel M2M Capabilities
The evolution of cellular network technologies, notably the transition to 4G, 5G, and the forthcoming 6G, is a pivotal factor in the M2M market's growth. These advancements, highlighted by Qualcomm's report of 5G delivering peak data rates up to 20 Gbps, significantly enhance the speed and reduce latency. This technological leap forward broadens the horizon for M2M applications, facilitating more efficient and responsive communication between machines.
Government Initiatives Amplify M2M Integration
Governmental initiatives and regulations promoting digitalization, particularly in the realm of smart city projects, are instrumental in driving the M2M market. With an increasing number of cities investing in open data portals, a shift from 18% to 67% in recent years, there's a clear trend towards leveraging M2M technology for urban management and services. The EU's eCall initiative, aimed at connected vehicles, exemplifies the governmental push towards integrating M2M solutions in critical sectors.
Restraining Factors
Security Concerns Impede M2M Market Adoption
The development of the machine-to-machine (M2M) industry is restricted by privacy and security issues. The nature of M2M data transmission, which often involves sensitive information, makes it susceptible to hacking and breaches. This vulnerability raises substantial concerns over data privacy and security, causing companies to hesitate in adopting M2M technologies.
The apprehension stems from the potential risks of data exploitation and the catastrophic consequences of security breaches. Addressing these security concerns is critical for the wider acceptance and implementation of M2M solutions, as major companies are wary of adopting technologies that might compromise their data integrity and customer trust.
Lack of Interoperability Slows M2M Integration
Interoperability issues present a major challenge to the growth rate of the M2M market. The diversity of connectivity options, including cellular, satellite, and WiFi, leads to a lack of standardization across hardware and networks. This fragmentation results in significant interoperability challenges, making it difficult for devices from different manufacturers or networks to communicate effectively.
The absence of universally accepted standards impedes seamless integration, adding complexity and potential costs to M2M deployments. For the market to expand, there needs to be a concerted effort towards standardization, ensuring that different systems can work together efficiently, which is crucial for the scalability and practicality of M2M solutions.
By Organization Size Analysis
Large Enterprises Dominate M2M Market By Organization Size.
Large Enterprises emerge as the dominant segment in the M2M market. This predominance is attributable to their substantial resources and capacity to invest in advanced M2M technologies, which are integral to enhancing operational efficiency, reducing costs, and improving decision-making processes. Large organizations leverage M2M solutions to optimize their supply chain, manage assets, and monitor operations in real-time. These enterprises often have extensive operations and customer bases, necessitating robust systems for data collection and analysis. M2M technology facilitates these needs by enabling seamless communication between machines and centralized control systems.
SMEs, while increasingly adopting M2M technologies, face challenges like limited budgets and less specialized personnel. But, as the cost for IoT and M2M technology, SMEs are progressively recognizing the benefits of M2M technology to scale operations and remain in the race to stay. Despite this, the complexity and scale of implementation in large enterprises underscore their dominance in this market segment.
By Components Analysis
Sensors Dominate M2M Market By Components.
In the M2M market, Sensors hold the most significant position as a component. Sensors are the critical elements in M2M ecosystems, responsible for collecting data from various sources. Their ability to detect changes in the physical environment and convert these into signals that can be read by machines or operators is crucial for the functioning of M2M technology. The data provided by sensors form the backbone of M2M applications across various industries, enabling automated processes and real-time monitoring.
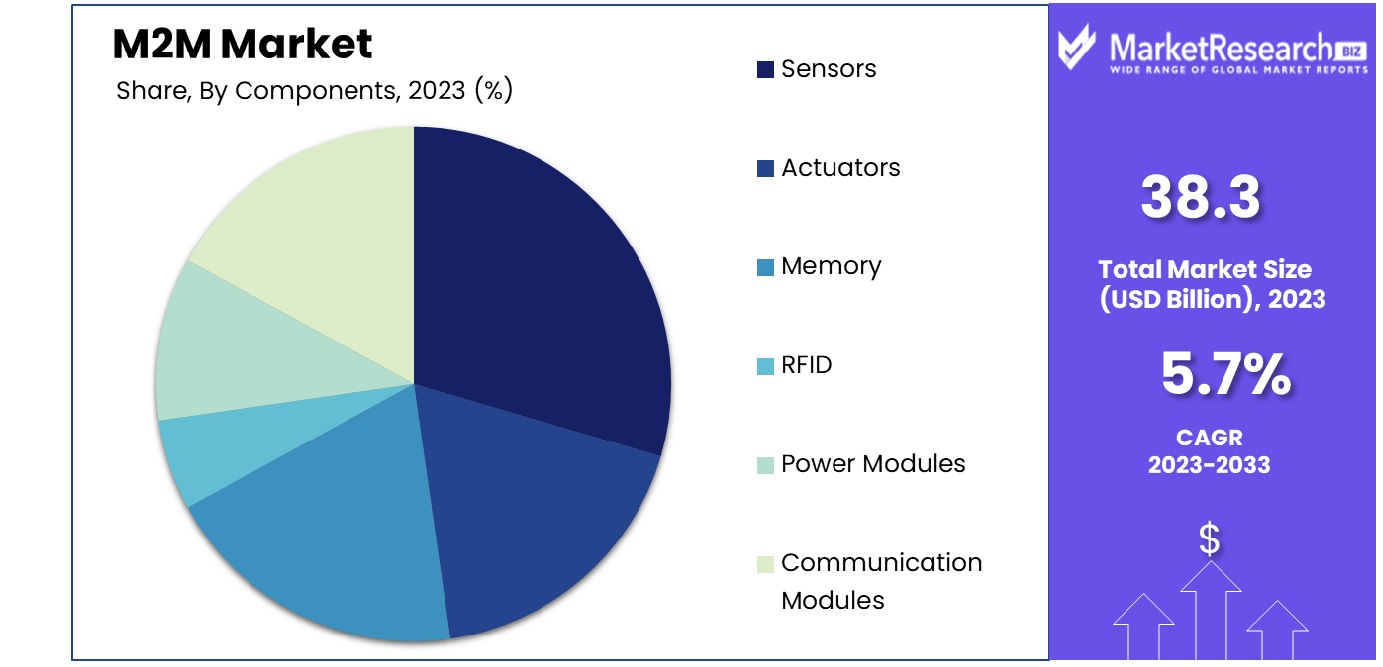
Other components like Actuators, Memory, RFID, Power Modules, and Communication Modules also play vital roles in the M2M value chain. Actuators facilitate actions based on sensor data, while memory units store this data. RFID and Communication Modules are essential for tracking and transmitting data. However, the foundational role of Sensors in capturing and initiating the M2M communication process positions them as the most critical component in this market.
By Applications Analysis
IT, Consumer Electronics, Retail, Transportation, Healthcare, and Security Drive M2M.
Information Technology (IT) is a leading application in the M2M market. IT applications of M2M technology span across data centers, network infrastructure, and cloud-based services, enabling organizations to manage their IT resources efficiently. M2M solutions in IT help in real-time monitoring of systems, predictive maintenance, and automation of routine tasks, leading to significant operational improvements.
Other application areas like Consumer Electronics, Retail, Transportation & automobiles, Healthcare, and Security and Surveillance are also significant. In Consumer Electronics, M2M is used for smart home devices; in Retail, for inventory management; in Transportation & Automotive, for fleet management; in Healthcare, for patient monitoring; and in Security and Surveillance, for automated alert systems. Despite the broad applicability of M2M across these sectors, its integration within IT infrastructures for enhancing organizational efficiency and productivity highlights its dominance in this application segment.
Key Market Segments
By Organization Size
- Large Enterprises
- SMEs
By Components
- Sensors
- Actuators
- Memory
- RFID
- Power Modules
- Communication Modules
By Applications
- Information Technologies (IT)
- Consumer Electronics
- Retail
- Transportations & Automotives
- Healthcare
- Security and Surveillance
Growth Opportunity
Connected Cars: Accelerating the M2M Market
The proliferation of connected cars represents a significant growth opportunity in the machine-to-machine (M2M) market. These vehicles, equipped with M2M connectivity, are revolutionizing the automotive industry with features like navigation, real-time diagnostics, and advanced safety systems. The increasing integration of M2M technology in connected cars, which is becoming more mainstream, drives the demand for sophisticated M2M solutions. This industry trend is not only enhancing the functionality and efficiency of vehicles but also catalyzing the evolution of the automotive sector toward greater connectivity and automation.
Energy Efficiency: M2M's Role in Sustainable Operations
Machine-to-machine (M2M) technology plays a pivotal role in enhancing energy efficiency across various industries. By implementing M2M remote monitoring and control systems, businesses can significantly optimize their energy usage. This technological advancement is crucial for companies aiming to reduce operational costs and their carbon footprint. The ability of M2M systems to provide real-time data and control mechanisms aligns with the growing global focus on sustainability and resource management. Consequently, this aspect of M2M technology is not just a business efficiency enhancer but also a contributor to broader environmental conservation efforts.
Latest Trends
Rapid Expansion of Industrial IoT Drives M2M Market Growth
The M2M (Machine-to-Machine) market is experiencing an explosion in growth driven by the rapid growth of Industrial IoT (Internet of Things). Industrial sectors are increasingly adopting M2M solutions to streamline operations, enhance efficiency, and enable real-time monitoring and control of machines and equipment. This trend is driven by the need for automation, predictive maintenance, and data-driven decision-making in industries such as manufacturing, logistics, and energy. As companies prioritize digital transformation initiatives, the M2M market is poised for significant expansion, with projections indicating sustained growth in the coming years.
The Emergence of 5G Technology Amplifies M2M Market Opportunities
The development technology 5G is changing the market landscape in the M2M (Machine-to-Machine) market, providing new possibilities for speed, connectivity, and scaling. With its ultra-fast data transmission capabilities and low latency, 5G enables seamless communication between interconnected devices, paving the way for innovative M2M applications across various industries. From autonomous vehicles and smart cities to remote healthcare and industrial automation, 5G-powered M2M solutions offer enhanced reliability and efficiency, driving adoption among businesses seeking to leverage the full potential of connected technologies. As 5G networks continue to expand globally, the M2M market is poised to capitalize on this transformative technology, unlocking unprecedented possibilities for interconnected ecosystems.
Regional Analysis
North America Dominates with 40% Market Share in the M2M Industry
North America's dominance in the machine-to-machine (M2M) market, holding a substantial 40% share, is primarily driven by advanced technological infrastructure and a robust telecommunications sector. Key players like AT&T, Verizon, and T-Mobile have been instrumental in implementing M2M solutions across various industries. The region's strong emphasis on IoT and smart technologies, coupled with significant R&D investments, further strengthens its market position.

The M2M market in North America is characterized by high adoption rates in sectors such as healthcare, automotive, and smart cities. The region's push towards connected devices and automation in manufacturing processes, as well as the burgeoning demand for smart home devices, significantly fuels the M2M market growth. Additionally, government initiatives towards smart city projects contribute to the expansion of M2M applications.
Europe's Growing Stake in the M2M Market
Europe's share in the M2M market is marked by a strong focus on innovation and sustainability. The region's stringent regulations on data security and privacy, along with government support for smart city and connected car projects, are key growth drivers. European telecom giants are actively expanding their M2M capabilities, facilitating wider adoption across various sectors.
Asia-Pacific’s Rising Influence in the M2M Market
The Asia-Pacific region, though holding a smaller share compared to North America, is witnessing rapid growth in the M2M market. This is due to the growing use of M2M-related solutions across emerging markets, the growing demand for industrial automation, and the growth of the IoT ecosystem. Countries like China, Japan, and South Korea are leading the way in integrating M2M technologies in manufacturing, automotive, and consumer electronics, indicating a promising future for the market in this region.
Key Regions and Countries
North America
- The US
- Canada
- Rest of North America
Europe
- Germany
- France
- The UK
- Spain
- Netherlands
- Russia
- Italy
- Rest of Europe
Asia-Pacific
- China
- Japan
- Singapore
- Thailand
- South Korea
- Vietnam
- India
- New Zealand
- Rest of Asia Pacific
Latin America
- Mexico
- Brazil
- Rest of Latin America
Middle East & Africa
- Saudi Arabia
- South Africa
- UAE
- Rest of Middle East & Africa
Key Players Analysis
In the dynamic Machine-to-Machine (M2M) market, each company listed brings distinct strategic advantages, shaping the industry's evolution. Cumulocity specializes in cloud-based M2M solutions, offering scalable platforms that enable businesses to swiftly deploy M2M applications. Their focus on ease of integration and flexibility makes them pivotal in IoT deployments.
Kore Wireless Group and Eurotech are recognized for their robust M2M communication solutions. Kore Wireless's comprehensive network coverage and Eurotech's integration capabilities cater to a wide range of industrial applications, from asset tracking to remote monitoring.
Ericsson and Huawei Technologies Co. Ltd. stand out for their telecommunications expertise, driving advancements in M2M connectivity through cutting-edge cellular technologies. Their contributions are critical in enhancing M2M communication reliability and speed, particularly in the 5G realm.
Market Key Players
- Cumulocity
- Kore Wireless Group
- Eurotech
- Ericsson
- Gemalto
- PTC
- Telit
- AT&T Inc. (US)
- Huawei Technologies Co. Ltd. (China)
- Vodafone Group PLC (UK)
- Zebra Technologies
- Eurotech
- Alphabet Inc. (Google)
- Amdocs Ltd.
- Cisco Systems Inc.
Recent Development
- In November 2023, Ericsson announced an intelligent cloud-based transport controller that utilizes machine learning and artificial intelligence to analyze and automate optical, microwave, and IP networks. It provides Communications service companies (CSPs) with an innovative solution to maximize the performance of their mobile transport networks.
- In October 2023, A5G Networks, Inc. announced its partnership with Intel(r) Smart Edge, the Kubernetes-based edge computing system for the deployment of edge networks as well as providing multi-access computing (MEC) for containers, applications as well as virtual machines. It's packaged in an easy-to-use platform that is designed to provide non-technical users with access to their Edge Computing platform.
Report Scope
Report Features Description Market Value (2023) USD 38.3 Billion Forecast Revenue (2033) USD 65.8 Billion CAGR (2024-2032) 5.7% Base Year for Estimation 2023 Historic Period 2016-2023 Forecast Period 2024-2033 Report Coverage Revenue Forecast, Market Dynamics, COVID-19 Impact, Competitive Landscape, Recent Developments Segments Covered By Organization Size(Large Enterprises, SMEs), By Components(Sensors, Actuators, Memory, RFID, Power Modules, Communication Modules), By Applications(Information Technologies (IT), Consumer Electronics, Retail, Transportations & Automotives, Healthcare, Security and Surveillance) Regional Analysis North America - The US, Canada, Rest of North America, Europe - Germany, France, The UK, Spain, Italy, Russia, Netherlands, Rest of Europe, Asia-Pacific - China, Japan, South Korea, India, New Zealand, Singapore, Thailand, Vietnam, Rest of Asia Pacific, Latin America - Brazil, Mexico, Rest of Latin America, Middle East & Africa - South Africa, Saudi Arabia, UAE, Rest of Middle East & Africa Competitive Landscape Cumulocity, Kore Wireless Group, Eurotech, Ericsson, Gemalto, PTC, Telit, AT&T Inc. (US), Huawei Technologies Co. Ltd. (China), Vodafone Group PLC (UK), Zebra Technologies, EuroTech, Alphabet Inc. (Google), Amdocs Ltd., Cisco Systems Inc. Customization Scope Customization for segments, region/country-level will be provided. Moreover, additional customization can be done based on the requirements. Purchase Options We have three licenses to opt for Single User License, Multi-User License (Up to 5 Users), Corporate Use License (Unlimited User and Printable PDF) - Market Growth: M2M Market was valued at USD 38.3 billion in 2023, It is expected to reach USD 65.8 billion by 2033, with a CAGR of 5.7% during the forecast period from 2024 to 2033.
-
- 1. Executive Summary
- 1.1. Definition
- 1.2. Taxonomy
- 1.3. Research Scope
- 1.4. Key Analysis
- 1.5. Key Findings by Major Segments
- 1.6. Top strategies by Major Players
- 2. Global M2M Market Overview
- 2.1. M2M Market Dynamics
- 2.1.1. Drivers
- 2.1.2. Opportunities
- 2.1.3. Restraints
- 2.1.4. Challenges
- 2.2. Macro-economic Factors
- 2.3. Regulatory Framework
- 2.4. Market Investment Feasibility Index
- 2.5. PEST Analysis
- 2.6. PORTER’S Five Force Analysis
- 2.7. Drivers & Restraints Impact Analysis
- 2.8. Industry Chain Analysis
- 2.9. Cost Structure Analysis
- 2.10. Marketing Strategy
- 2.11. Russia-Ukraine War Impact Analysis
- 2.12. Opportunity Map Analysis
- 2.13. Market Competition Scenario Analysis
- 2.14. Product Life Cycle Analysis
- 2.15. Opportunity Orbits
- 2.16. Manufacturer Intensity Map
- 2.17. Major Companies sales by Value & Volume
- 2.1. M2M Market Dynamics
- 3. Global M2M Market Analysis, Opportunity and Forecast, 2016-2032
- 3.1. Global M2M Market Analysis, 2016-2021
- 3.2. Global M2M Market Opportunity and Forecast, 2023-2032
- 3.3. Global M2M Market Analysis, Opportunity and Forecast, By By Organization Size, 2016-2032
- 3.3.1. Global M2M Market Analysis by By Organization Size: Introduction
- 3.3.2. Market Size Absolute $ Opportunity Analysis and Forecast, By By Organization Size, 2016-2032
- 3.3.3. Large Enterprises
- 3.3.4. SMEs
- 3.4. Global M2M Market Analysis, Opportunity and Forecast, By By Components, 2016-2032
- 3.4.1. Global M2M Market Analysis by By Components: Introduction
- 3.4.2. Market Size Absolute $ Opportunity Analysis and Forecast, By By Components, 2016-2032
- 3.4.3. Sensors
- 3.4.4. Actuators
- 3.4.5. Memory
- 3.4.6. RFID
- 3.4.7. Power Modules
- 3.4.8. Communication Modules
- 3.5. Global M2M Market Analysis, Opportunity and Forecast, By By Applications, 2016-2032
- 3.5.1. Global M2M Market Analysis by By Applications: Introduction
- 3.5.2. Market Size Absolute $ Opportunity Analysis and Forecast, By By Applications, 2016-2032
- 3.5.3. Information Technologies (IT)
- 3.5.4. Consumer Electronics
- 3.5.5. Retail
- 3.5.6. Transportations & Automotives
- 3.5.7. Healthcare
- 3.5.8. Security and Surveillance
- 4. North America M2M Market Analysis, Opportunity and Forecast, 2016-2032
- 4.1. North America M2M Market Analysis, 2016-2021
- 4.2. North America M2M Market Opportunity and Forecast, 2023-2032
- 4.3. North America M2M Market Analysis, Opportunity and Forecast, By By Organization Size, 2016-2032
- 4.3.1. North America M2M Market Analysis by By Organization Size: Introduction
- 4.3.2. Market Size Absolute $ Opportunity Analysis and Forecast, By By Organization Size, 2016-2032
- 4.3.3. Large Enterprises
- 4.3.4. SMEs
- 4.4. North America M2M Market Analysis, Opportunity and Forecast, By By Components, 2016-2032
- 4.4.1. North America M2M Market Analysis by By Components: Introduction
- 4.4.2. Market Size Absolute $ Opportunity Analysis and Forecast, By By Components, 2016-2032
- 4.4.3. Sensors
- 4.4.4. Actuators
- 4.4.5. Memory
- 4.4.6. RFID
- 4.4.7. Power Modules
- 4.4.8. Communication Modules
- 4.5. North America M2M Market Analysis, Opportunity and Forecast, By By Applications, 2016-2032
- 4.5.1. North America M2M Market Analysis by By Applications: Introduction
- 4.5.2. Market Size Absolute $ Opportunity Analysis and Forecast, By By Applications, 2016-2032
- 4.5.3. Information Technologies (IT)
- 4.5.4. Consumer Electronics
- 4.5.5. Retail
- 4.5.6. Transportations & Automotives
- 4.5.7. Healthcare
- 4.5.8. Security and Surveillance
- 4.6. North America M2M Market Analysis, Opportunity and Forecast, By Country , 2016-2032
- 4.6.1. North America M2M Market Analysis by Country : Introduction
- 4.6.2. Market Size Absolute $ Opportunity Analysis and Forecast, Country , 2016-2032
- 4.6.2.1. The US
- 4.6.2.2. Canada
- 4.6.2.3. Mexico
- 5. Western Europe M2M Market Analysis, Opportunity and Forecast, 2016-2032
- 5.1. Western Europe M2M Market Analysis, 2016-2021
- 5.2. Western Europe M2M Market Opportunity and Forecast, 2023-2032
- 5.3. Western Europe M2M Market Analysis, Opportunity and Forecast, By By Organization Size, 2016-2032
- 5.3.1. Western Europe M2M Market Analysis by By Organization Size: Introduction
- 5.3.2. Market Size Absolute $ Opportunity Analysis and Forecast, By By Organization Size, 2016-2032
- 5.3.3. Large Enterprises
- 5.3.4. SMEs
- 5.4. Western Europe M2M Market Analysis, Opportunity and Forecast, By By Components, 2016-2032
- 5.4.1. Western Europe M2M Market Analysis by By Components: Introduction
- 5.4.2. Market Size Absolute $ Opportunity Analysis and Forecast, By By Components, 2016-2032
- 5.4.3. Sensors
- 5.4.4. Actuators
- 5.4.5. Memory
- 5.4.6. RFID
- 5.4.7. Power Modules
- 5.4.8. Communication Modules
- 5.5. Western Europe M2M Market Analysis, Opportunity and Forecast, By By Applications, 2016-2032
- 5.5.1. Western Europe M2M Market Analysis by By Applications: Introduction
- 5.5.2. Market Size Absolute $ Opportunity Analysis and Forecast, By By Applications, 2016-2032
- 5.5.3. Information Technologies (IT)
- 5.5.4. Consumer Electronics
- 5.5.5. Retail
- 5.5.6. Transportations & Automotives
- 5.5.7. Healthcare
- 5.5.8. Security and Surveillance
- 5.6. Western Europe M2M Market Analysis, Opportunity and Forecast, By Country , 2016-2032
- 5.6.1. Western Europe M2M Market Analysis by Country : Introduction
- 5.6.2. Market Size Absolute $ Opportunity Analysis and Forecast, Country , 2016-2032
- 5.6.2.1. Germany
- 5.6.2.2. France
- 5.6.2.3. The UK
- 5.6.2.4. Spain
- 5.6.2.5. Italy
- 5.6.2.6. Portugal
- 5.6.2.7. Ireland
- 5.6.2.8. Austria
- 5.6.2.9. Switzerland
- 5.6.2.10. Benelux
- 5.6.2.11. Nordic
- 5.6.2.12. Rest of Western Europe
- 6. Eastern Europe M2M Market Analysis, Opportunity and Forecast, 2016-2032
- 6.1. Eastern Europe M2M Market Analysis, 2016-2021
- 6.2. Eastern Europe M2M Market Opportunity and Forecast, 2023-2032
- 6.3. Eastern Europe M2M Market Analysis, Opportunity and Forecast, By By Organization Size, 2016-2032
- 6.3.1. Eastern Europe M2M Market Analysis by By Organization Size: Introduction
- 6.3.2. Market Size Absolute $ Opportunity Analysis and Forecast, By By Organization Size, 2016-2032
- 6.3.3. Large Enterprises
- 6.3.4. SMEs
- 6.4. Eastern Europe M2M Market Analysis, Opportunity and Forecast, By By Components, 2016-2032
- 6.4.1. Eastern Europe M2M Market Analysis by By Components: Introduction
- 6.4.2. Market Size Absolute $ Opportunity Analysis and Forecast, By By Components, 2016-2032
- 6.4.3. Sensors
- 6.4.4. Actuators
- 6.4.5. Memory
- 6.4.6. RFID
- 6.4.7. Power Modules
- 6.4.8. Communication Modules
- 6.5. Eastern Europe M2M Market Analysis, Opportunity and Forecast, By By Applications, 2016-2032
- 6.5.1. Eastern Europe M2M Market Analysis by By Applications: Introduction
- 6.5.2. Market Size Absolute $ Opportunity Analysis and Forecast, By By Applications, 2016-2032
- 6.5.3. Information Technologies (IT)
- 6.5.4. Consumer Electronics
- 6.5.5. Retail
- 6.5.6. Transportations & Automotives
- 6.5.7. Healthcare
- 6.5.8. Security and Surveillance
- 6.6. Eastern Europe M2M Market Analysis, Opportunity and Forecast, By Country , 2016-2032
- 6.6.1. Eastern Europe M2M Market Analysis by Country : Introduction
- 6.6.2. Market Size Absolute $ Opportunity Analysis and Forecast, Country , 2016-2032
- 6.6.2.1. Russia
- 6.6.2.2. Poland
- 6.6.2.3. The Czech Republic
- 6.6.2.4. Greece
- 6.6.2.5. Rest of Eastern Europe
- 7. APAC M2M Market Analysis, Opportunity and Forecast, 2016-2032
- 7.1. APAC M2M Market Analysis, 2016-2021
- 7.2. APAC M2M Market Opportunity and Forecast, 2023-2032
- 7.3. APAC M2M Market Analysis, Opportunity and Forecast, By By Organization Size, 2016-2032
- 7.3.1. APAC M2M Market Analysis by By Organization Size: Introduction
- 7.3.2. Market Size Absolute $ Opportunity Analysis and Forecast, By By Organization Size, 2016-2032
- 7.3.3. Large Enterprises
- 7.3.4. SMEs
- 7.4. APAC M2M Market Analysis, Opportunity and Forecast, By By Components, 2016-2032
- 7.4.1. APAC M2M Market Analysis by By Components: Introduction
- 7.4.2. Market Size Absolute $ Opportunity Analysis and Forecast, By By Components, 2016-2032
- 7.4.3. Sensors
- 7.4.4. Actuators
- 7.4.5. Memory
- 7.4.6. RFID
- 7.4.7. Power Modules
- 7.4.8. Communication Modules
- 7.5. APAC M2M Market Analysis, Opportunity and Forecast, By By Applications, 2016-2032
- 7.5.1. APAC M2M Market Analysis by By Applications: Introduction
- 7.5.2. Market Size Absolute $ Opportunity Analysis and Forecast, By By Applications, 2016-2032
- 7.5.3. Information Technologies (IT)
- 7.5.4. Consumer Electronics
- 7.5.5. Retail
- 7.5.6. Transportations & Automotives
- 7.5.7. Healthcare
- 7.5.8. Security and Surveillance
- 7.6. APAC M2M Market Analysis, Opportunity and Forecast, By Country , 2016-2032
- 7.6.1. APAC M2M Market Analysis by Country : Introduction
- 7.6.2. Market Size Absolute $ Opportunity Analysis and Forecast, Country , 2016-2032
- 7.6.2.1. China
- 7.6.2.2. Japan
- 7.6.2.3. South Korea
- 7.6.2.4. India
- 7.6.2.5. Australia & New Zeland
- 7.6.2.6. Indonesia
- 7.6.2.7. Malaysia
- 7.6.2.8. Philippines
- 7.6.2.9. Singapore
- 7.6.2.10. Thailand
- 7.6.2.11. Vietnam
- 7.6.2.12. Rest of APAC
- 8. Latin America M2M Market Analysis, Opportunity and Forecast, 2016-2032
- 8.1. Latin America M2M Market Analysis, 2016-2021
- 8.2. Latin America M2M Market Opportunity and Forecast, 2023-2032
- 8.3. Latin America M2M Market Analysis, Opportunity and Forecast, By By Organization Size, 2016-2032
- 8.3.1. Latin America M2M Market Analysis by By Organization Size: Introduction
- 8.3.2. Market Size Absolute $ Opportunity Analysis and Forecast, By By Organization Size, 2016-2032
- 8.3.3. Large Enterprises
- 8.3.4. SMEs
- 8.4. Latin America M2M Market Analysis, Opportunity and Forecast, By By Components, 2016-2032
- 8.4.1. Latin America M2M Market Analysis by By Components: Introduction
- 8.4.2. Market Size Absolute $ Opportunity Analysis and Forecast, By By Components, 2016-2032
- 8.4.3. Sensors
- 8.4.4. Actuators
- 8.4.5. Memory
- 8.4.6. RFID
- 8.4.7. Power Modules
- 8.4.8. Communication Modules
- 8.5. Latin America M2M Market Analysis, Opportunity and Forecast, By By Applications, 2016-2032
- 8.5.1. Latin America M2M Market Analysis by By Applications: Introduction
- 8.5.2. Market Size Absolute $ Opportunity Analysis and Forecast, By By Applications, 2016-2032
- 8.5.3. Information Technologies (IT)
- 8.5.4. Consumer Electronics
- 8.5.5. Retail
- 8.5.6. Transportations & Automotives
- 8.5.7. Healthcare
- 8.5.8. Security and Surveillance
- 8.6. Latin America M2M Market Analysis, Opportunity and Forecast, By Country , 2016-2032
- 8.6.1. Latin America M2M Market Analysis by Country : Introduction
- 8.6.2. Market Size Absolute $ Opportunity Analysis and Forecast, Country , 2016-2032
- 8.6.2.1. Brazil
- 8.6.2.2. Colombia
- 8.6.2.3. Chile
- 8.6.2.4. Argentina
- 8.6.2.5. Costa Rica
- 8.6.2.6. Rest of Latin America
- 9. Middle East & Africa M2M Market Analysis, Opportunity and Forecast, 2016-2032
- 9.1. Middle East & Africa M2M Market Analysis, 2016-2021
- 9.2. Middle East & Africa M2M Market Opportunity and Forecast, 2023-2032
- 9.3. Middle East & Africa M2M Market Analysis, Opportunity and Forecast, By By Organization Size, 2016-2032
- 9.3.1. Middle East & Africa M2M Market Analysis by By Organization Size: Introduction
- 9.3.2. Market Size Absolute $ Opportunity Analysis and Forecast, By By Organization Size, 2016-2032
- 9.3.3. Large Enterprises
- 9.3.4. SMEs
- 9.4. Middle East & Africa M2M Market Analysis, Opportunity and Forecast, By By Components, 2016-2032
- 9.4.1. Middle East & Africa M2M Market Analysis by By Components: Introduction
- 9.4.2. Market Size Absolute $ Opportunity Analysis and Forecast, By By Components, 2016-2032
- 9.4.3. Sensors
- 9.4.4. Actuators
- 9.4.5. Memory
- 9.4.6. RFID
- 9.4.7. Power Modules
- 9.4.8. Communication Modules
- 9.5. Middle East & Africa M2M Market Analysis, Opportunity and Forecast, By By Applications, 2016-2032
- 9.5.1. Middle East & Africa M2M Market Analysis by By Applications: Introduction
- 9.5.2. Market Size Absolute $ Opportunity Analysis and Forecast, By By Applications, 2016-2032
- 9.5.3. Information Technologies (IT)
- 9.5.4. Consumer Electronics
- 9.5.5. Retail
- 9.5.6. Transportations & Automotives
- 9.5.7. Healthcare
- 9.5.8. Security and Surveillance
- 9.6. Middle East & Africa M2M Market Analysis, Opportunity and Forecast, By Country , 2016-2032
- 9.6.1. Middle East & Africa M2M Market Analysis by Country : Introduction
- 9.6.2. Market Size Absolute $ Opportunity Analysis and Forecast, Country , 2016-2032
- 9.6.2.1. Algeria
- 9.6.2.2. Egypt
- 9.6.2.3. Israel
- 9.6.2.4. Kuwait
- 9.6.2.5. Nigeria
- 9.6.2.6. Saudi Arabia
- 9.6.2.7. South Africa
- 9.6.2.8. Turkey
- 9.6.2.9. The UAE
- 9.6.2.10. Rest of MEA
- 10. Global M2M Market Analysis, Opportunity and Forecast, By Region , 2016-2032
- 10.1. Global M2M Market Analysis by Region : Introduction
- 10.2. Market Size Absolute $ Opportunity Analysis and Forecast, By Region , 2016-2032
- 10.2.1. North America
- 10.2.2. Western Europe
- 10.2.3. Eastern Europe
- 10.2.4. APAC
- 10.2.5. Latin America
- 10.2.6. Middle East & Africa
- 11. Global M2M Market Competitive Landscape, Market Share Analysis, and Company Profiles
- 11.1. Market Share Analysis
- 11.2. Company Profiles
- 11.3. Cumulocity
- 11.3.1. Company Overview
- 11.3.2. Financial Highlights
- 11.3.3. Product Portfolio
- 11.3.4. SWOT Analysis
- 11.3.5. Key Strategies and Developments
- 11.4. Kore Wireless Group
- 11.4.1. Company Overview
- 11.4.2. Financial Highlights
- 11.4.3. Product Portfolio
- 11.4.4. SWOT Analysis
- 11.4.5. Key Strategies and Developments
- 11.5. Eurotech
- 11.5.1. Company Overview
- 11.5.2. Financial Highlights
- 11.5.3. Product Portfolio
- 11.5.4. SWOT Analysis
- 11.5.5. Key Strategies and Developments
- 11.6. Ericsson
- 11.6.1. Company Overview
- 11.6.2. Financial Highlights
- 11.6.3. Product Portfolio
- 11.6.4. SWOT Analysis
- 11.6.5. Key Strategies and Developments
- 11.7. Gemalto
- 11.7.1. Company Overview
- 11.7.2. Financial Highlights
- 11.7.3. Product Portfolio
- 11.7.4. SWOT Analysis
- 11.7.5. Key Strategies and Developments
- 11.8. PTC
- 11.8.1. Company Overview
- 11.8.2. Financial Highlights
- 11.8.3. Product Portfolio
- 11.8.4. SWOT Analysis
- 11.8.5. Key Strategies and Developments
- 11.9. Telit
- 11.9.1. Company Overview
- 11.9.2. Financial Highlights
- 11.9.3. Product Portfolio
- 11.9.4. SWOT Analysis
- 11.9.5. Key Strategies and Developments
- 11.10. AT&T Inc. (US)
- 11.10.1. Company Overview
- 11.10.2. Financial Highlights
- 11.10.3. Product Portfolio
- 11.10.4. SWOT Analysis
- 11.10.5. Key Strategies and Developments
- 11.11. Huawei Technologies Co. Ltd. (China)
- 11.11.1. Company Overview
- 11.11.2. Financial Highlights
- 11.11.3. Product Portfolio
- 11.11.4. SWOT Analysis
- 11.11.5. Key Strategies and Developments
- 11.12. Vodafone Group PLC (UK)
- 11.12.1. Company Overview
- 11.12.2. Financial Highlights
- 11.12.3. Product Portfolio
- 11.12.4. SWOT Analysis
- 11.12.5. Key Strategies and Developments
- 11.13.1. Company Overview
- 11.13.2. Financial Highlights
- 11.13.3. Product Portfolio
- 11.13.4. SWOT Analysis
- 11.13.5. Key Strategies and Developments
- 11.14. Zebra Technologies
- 11.14.1. Company Overview
- 11.14.2. Financial Highlights
- 11.14.3. Product Portfolio
- 11.14.4. SWOT Analysis
- 11.14.5. Key Strategies and Developments
- 11.15. Alphabet Inc. (Google)
- 11.15.1. Company Overview
- 11.15.2. Financial Highlights
- 11.15.3. Product Portfolio
- 11.15.4. SWOT Analysis
- 11.15.5. Key Strategies and Developments
- 11.16. Amdocs Ltd.
- 11.16.1. Company Overview
- 11.16.2. Financial Highlights
- 11.16.3. Product Portfolio
- 11.16.4. SWOT Analysis
- 11.16.5. Key Strategies and Developments
- 11.17. Cisco Systems Inc.
- 11.17.1. Company Overview
- 11.17.2. Financial Highlights
- 11.17.3. Product Portfolio
- 11.17.4. SWOT Analysis
- 11.17.5. Key Strategies and Developments
- 12. Assumptions and Acronyms
- 13. Research Methodology
- 14. Contact
"
- List of Figures
- "
- Figure 1: Global M2M Market Revenue (US$ Mn) Market Share by By Organization Size in 2022
- Figure 2: Global M2M Market Market Attractiveness Analysis by By Organization Size, 2016-2032
- Figure 3: Global M2M Market Revenue (US$ Mn) Market Share by By Componentsin 2022
- Figure 4: Global M2M Market Market Attractiveness Analysis by By Components, 2016-2032
- Figure 5: Global M2M Market Revenue (US$ Mn) Market Share by By Applicationsin 2022
- Figure 6: Global M2M Market Market Attractiveness Analysis by By Applications, 2016-2032
- Figure 7: Global M2M Market Revenue (US$ Mn) Market Share by Region in 2022
- Figure 8: Global M2M Market Market Attractiveness Analysis by Region, 2016-2032
- Figure 9: Global M2M Market Market Revenue (US$ Mn) (2016-2032)
- Figure 10: Global M2M Market Market Revenue (US$ Mn) Comparison by Region (2016-2032)
- Figure 11: Global M2M Market Market Revenue (US$ Mn) Comparison by By Organization Size (2016-2032)
- Figure 12: Global M2M Market Market Revenue (US$ Mn) Comparison by By Components (2016-2032)
- Figure 13: Global M2M Market Market Revenue (US$ Mn) Comparison by By Applications (2016-2032)
- Figure 14: Global M2M Market Market Y-o-Y Growth Rate Comparison by Region (2016-2032)
- Figure 15: Global M2M Market Market Y-o-Y Growth Rate Comparison by By Organization Size (2016-2032)
- Figure 16: Global M2M Market Market Y-o-Y Growth Rate Comparison by By Components (2016-2032)
- Figure 17: Global M2M Market Market Y-o-Y Growth Rate Comparison by By Applications (2016-2032)
- Figure 18: Global M2M Market Market Share Comparison by Region (2016-2032)
- Figure 19: Global M2M Market Market Share Comparison by By Organization Size (2016-2032)
- Figure 20: Global M2M Market Market Share Comparison by By Components (2016-2032)
- Figure 21: Global M2M Market Market Share Comparison by By Applications (2016-2032)
- Figure 22: North America M2M Market Revenue (US$ Mn) Market Share by By Organization Sizein 2022
- Figure 23: North America M2M Market Market Attractiveness Analysis by By Organization Size, 2016-2032
- Figure 24: North America M2M Market Revenue (US$ Mn) Market Share by By Componentsin 2022
- Figure 25: North America M2M Market Market Attractiveness Analysis by By Components, 2016-2032
- Figure 26: North America M2M Market Revenue (US$ Mn) Market Share by By Applicationsin 2022
- Figure 27: North America M2M Market Market Attractiveness Analysis by By Applications, 2016-2032
- Figure 28: North America M2M Market Revenue (US$ Mn) Market Share by Country in 2022
- Figure 29: North America M2M Market Market Attractiveness Analysis by Country, 2016-2032
- Figure 30: North America M2M Market Market Revenue (US$ Mn) (2016-2032)
- Figure 31: North America M2M Market Market Revenue (US$ Mn) Comparison by Country (2016-2032)
- Figure 32: North America M2M Market Market Revenue (US$ Mn) Comparison by By Organization Size (2016-2032)
- Figure 33: North America M2M Market Market Revenue (US$ Mn) Comparison by By Components (2016-2032)
- Figure 34: North America M2M Market Market Revenue (US$ Mn) Comparison by By Applications (2016-2032)
- Figure 35: North America M2M Market Market Y-o-Y Growth Rate Comparison by Country (2016-2032)
- Figure 36: North America M2M Market Market Y-o-Y Growth Rate Comparison by By Organization Size (2016-2032)
- Figure 37: North America M2M Market Market Y-o-Y Growth Rate Comparison by By Components (2016-2032)
- Figure 38: North America M2M Market Market Y-o-Y Growth Rate Comparison by By Applications (2016-2032)
- Figure 39: North America M2M Market Market Share Comparison by Country (2016-2032)
- Figure 40: North America M2M Market Market Share Comparison by By Organization Size (2016-2032)
- Figure 41: North America M2M Market Market Share Comparison by By Components (2016-2032)
- Figure 42: North America M2M Market Market Share Comparison by By Applications (2016-2032)
- Figure 43: Western Europe M2M Market Revenue (US$ Mn) Market Share by By Organization Sizein 2022
- Figure 44: Western Europe M2M Market Market Attractiveness Analysis by By Organization Size, 2016-2032
- Figure 45: Western Europe M2M Market Revenue (US$ Mn) Market Share by By Componentsin 2022
- Figure 46: Western Europe M2M Market Market Attractiveness Analysis by By Components, 2016-2032
- Figure 47: Western Europe M2M Market Revenue (US$ Mn) Market Share by By Applicationsin 2022
- Figure 48: Western Europe M2M Market Market Attractiveness Analysis by By Applications, 2016-2032
- Figure 49: Western Europe M2M Market Revenue (US$ Mn) Market Share by Country in 2022
- Figure 50: Western Europe M2M Market Market Attractiveness Analysis by Country, 2016-2032
- Figure 51: Western Europe M2M Market Market Revenue (US$ Mn) (2016-2032)
- Figure 52: Western Europe M2M Market Market Revenue (US$ Mn) Comparison by Country (2016-2032)
- Figure 53: Western Europe M2M Market Market Revenue (US$ Mn) Comparison by By Organization Size (2016-2032)
- Figure 54: Western Europe M2M Market Market Revenue (US$ Mn) Comparison by By Components (2016-2032)
- Figure 55: Western Europe M2M Market Market Revenue (US$ Mn) Comparison by By Applications (2016-2032)
- Figure 56: Western Europe M2M Market Market Y-o-Y Growth Rate Comparison by Country (2016-2032)
- Figure 57: Western Europe M2M Market Market Y-o-Y Growth Rate Comparison by By Organization Size (2016-2032)
- Figure 58: Western Europe M2M Market Market Y-o-Y Growth Rate Comparison by By Components (2016-2032)
- Figure 59: Western Europe M2M Market Market Y-o-Y Growth Rate Comparison by By Applications (2016-2032)
- Figure 60: Western Europe M2M Market Market Share Comparison by Country (2016-2032)
- Figure 61: Western Europe M2M Market Market Share Comparison by By Organization Size (2016-2032)
- Figure 62: Western Europe M2M Market Market Share Comparison by By Components (2016-2032)
- Figure 63: Western Europe M2M Market Market Share Comparison by By Applications (2016-2032)
- Figure 64: Eastern Europe M2M Market Revenue (US$ Mn) Market Share by By Organization Sizein 2022
- Figure 65: Eastern Europe M2M Market Market Attractiveness Analysis by By Organization Size, 2016-2032
- Figure 66: Eastern Europe M2M Market Revenue (US$ Mn) Market Share by By Componentsin 2022
- Figure 67: Eastern Europe M2M Market Market Attractiveness Analysis by By Components, 2016-2032
- Figure 68: Eastern Europe M2M Market Revenue (US$ Mn) Market Share by By Applicationsin 2022
- Figure 69: Eastern Europe M2M Market Market Attractiveness Analysis by By Applications, 2016-2032
- Figure 70: Eastern Europe M2M Market Revenue (US$ Mn) Market Share by Country in 2022
- Figure 71: Eastern Europe M2M Market Market Attractiveness Analysis by Country, 2016-2032
- Figure 72: Eastern Europe M2M Market Market Revenue (US$ Mn) (2016-2032)
- Figure 73: Eastern Europe M2M Market Market Revenue (US$ Mn) Comparison by Country (2016-2032)
- Figure 74: Eastern Europe M2M Market Market Revenue (US$ Mn) Comparison by By Organization Size (2016-2032)
- Figure 75: Eastern Europe M2M Market Market Revenue (US$ Mn) Comparison by By Components (2016-2032)
- Figure 76: Eastern Europe M2M Market Market Revenue (US$ Mn) Comparison by By Applications (2016-2032)
- Figure 77: Eastern Europe M2M Market Market Y-o-Y Growth Rate Comparison by Country (2016-2032)
- Figure 78: Eastern Europe M2M Market Market Y-o-Y Growth Rate Comparison by By Organization Size (2016-2032)
- Figure 79: Eastern Europe M2M Market Market Y-o-Y Growth Rate Comparison by By Components (2016-2032)
- Figure 80: Eastern Europe M2M Market Market Y-o-Y Growth Rate Comparison by By Applications (2016-2032)
- Figure 81: Eastern Europe M2M Market Market Share Comparison by Country (2016-2032)
- Figure 82: Eastern Europe M2M Market Market Share Comparison by By Organization Size (2016-2032)
- Figure 83: Eastern Europe M2M Market Market Share Comparison by By Components (2016-2032)
- Figure 84: Eastern Europe M2M Market Market Share Comparison by By Applications (2016-2032)
- Figure 85: APAC M2M Market Revenue (US$ Mn) Market Share by By Organization Sizein 2022
- Figure 86: APAC M2M Market Market Attractiveness Analysis by By Organization Size, 2016-2032
- Figure 87: APAC M2M Market Revenue (US$ Mn) Market Share by By Componentsin 2022
- Figure 88: APAC M2M Market Market Attractiveness Analysis by By Components, 2016-2032
- Figure 89: APAC M2M Market Revenue (US$ Mn) Market Share by By Applicationsin 2022
- Figure 90: APAC M2M Market Market Attractiveness Analysis by By Applications, 2016-2032
- Figure 91: APAC M2M Market Revenue (US$ Mn) Market Share by Country in 2022
- Figure 92: APAC M2M Market Market Attractiveness Analysis by Country, 2016-2032
- Figure 93: APAC M2M Market Market Revenue (US$ Mn) (2016-2032)
- Figure 94: APAC M2M Market Market Revenue (US$ Mn) Comparison by Country (2016-2032)
- Figure 95: APAC M2M Market Market Revenue (US$ Mn) Comparison by By Organization Size (2016-2032)
- Figure 96: APAC M2M Market Market Revenue (US$ Mn) Comparison by By Components (2016-2032)
- Figure 97: APAC M2M Market Market Revenue (US$ Mn) Comparison by By Applications (2016-2032)
- Figure 98: APAC M2M Market Market Y-o-Y Growth Rate Comparison by Country (2016-2032)
- Figure 99: APAC M2M Market Market Y-o-Y Growth Rate Comparison by By Organization Size (2016-2032)
- Figure 100: APAC M2M Market Market Y-o-Y Growth Rate Comparison by By Components (2016-2032)
- Figure 101: APAC M2M Market Market Y-o-Y Growth Rate Comparison by By Applications (2016-2032)
- Figure 102: APAC M2M Market Market Share Comparison by Country (2016-2032)
- Figure 103: APAC M2M Market Market Share Comparison by By Organization Size (2016-2032)
- Figure 104: APAC M2M Market Market Share Comparison by By Components (2016-2032)
- Figure 105: APAC M2M Market Market Share Comparison by By Applications (2016-2032)
- Figure 106: Latin America M2M Market Revenue (US$ Mn) Market Share by By Organization Sizein 2022
- Figure 107: Latin America M2M Market Market Attractiveness Analysis by By Organization Size, 2016-2032
- Figure 108: Latin America M2M Market Revenue (US$ Mn) Market Share by By Componentsin 2022
- Figure 109: Latin America M2M Market Market Attractiveness Analysis by By Components, 2016-2032
- Figure 110: Latin America M2M Market Revenue (US$ Mn) Market Share by By Applicationsin 2022
- Figure 111: Latin America M2M Market Market Attractiveness Analysis by By Applications, 2016-2032
- Figure 112: Latin America M2M Market Revenue (US$ Mn) Market Share by Country in 2022
- Figure 113: Latin America M2M Market Market Attractiveness Analysis by Country, 2016-2032
- Figure 114: Latin America M2M Market Market Revenue (US$ Mn) (2016-2032)
- Figure 115: Latin America M2M Market Market Revenue (US$ Mn) Comparison by Country (2016-2032)
- Figure 116: Latin America M2M Market Market Revenue (US$ Mn) Comparison by By Organization Size (2016-2032)
- Figure 117: Latin America M2M Market Market Revenue (US$ Mn) Comparison by By Components (2016-2032)
- Figure 118: Latin America M2M Market Market Revenue (US$ Mn) Comparison by By Applications (2016-2032)
- Figure 119: Latin America M2M Market Market Y-o-Y Growth Rate Comparison by Country (2016-2032)
- Figure 120: Latin America M2M Market Market Y-o-Y Growth Rate Comparison by By Organization Size (2016-2032)
- Figure 121: Latin America M2M Market Market Y-o-Y Growth Rate Comparison by By Components (2016-2032)
- Figure 122: Latin America M2M Market Market Y-o-Y Growth Rate Comparison by By Applications (2016-2032)
- Figure 123: Latin America M2M Market Market Share Comparison by Country (2016-2032)
- Figure 124: Latin America M2M Market Market Share Comparison by By Organization Size (2016-2032)
- Figure 125: Latin America M2M Market Market Share Comparison by By Components (2016-2032)
- Figure 126: Latin America M2M Market Market Share Comparison by By Applications (2016-2032)
- Figure 127: Middle East & Africa M2M Market Revenue (US$ Mn) Market Share by By Organization Sizein 2022
- Figure 128: Middle East & Africa M2M Market Market Attractiveness Analysis by By Organization Size, 2016-2032
- Figure 129: Middle East & Africa M2M Market Revenue (US$ Mn) Market Share by By Componentsin 2022
- Figure 130: Middle East & Africa M2M Market Market Attractiveness Analysis by By Components, 2016-2032
- Figure 131: Middle East & Africa M2M Market Revenue (US$ Mn) Market Share by By Applicationsin 2022
- Figure 132: Middle East & Africa M2M Market Market Attractiveness Analysis by By Applications, 2016-2032
- Figure 133: Middle East & Africa M2M Market Revenue (US$ Mn) Market Share by Country in 2022
- Figure 134: Middle East & Africa M2M Market Market Attractiveness Analysis by Country, 2016-2032
- Figure 135: Middle East & Africa M2M Market Market Revenue (US$ Mn) (2016-2032)
- Figure 136: Middle East & Africa M2M Market Market Revenue (US$ Mn) Comparison by Country (2016-2032)
- Figure 137: Middle East & Africa M2M Market Market Revenue (US$ Mn) Comparison by By Organization Size (2016-2032)
- Figure 138: Middle East & Africa M2M Market Market Revenue (US$ Mn) Comparison by By Components (2016-2032)
- Figure 139: Middle East & Africa M2M Market Market Revenue (US$ Mn) Comparison by By Applications (2016-2032)
- Figure 140: Middle East & Africa M2M Market Market Y-o-Y Growth Rate Comparison by Country (2016-2032)
- Figure 141: Middle East & Africa M2M Market Market Y-o-Y Growth Rate Comparison by By Organization Size (2016-2032)
- Figure 142: Middle East & Africa M2M Market Market Y-o-Y Growth Rate Comparison by By Components (2016-2032)
- Figure 143: Middle East & Africa M2M Market Market Y-o-Y Growth Rate Comparison by By Applications (2016-2032)
- Figure 144: Middle East & Africa M2M Market Market Share Comparison by Country (2016-2032)
- Figure 145: Middle East & Africa M2M Market Market Share Comparison by By Organization Size (2016-2032)
- Figure 146: Middle East & Africa M2M Market Market Share Comparison by By Components (2016-2032)
- Figure 147: Middle East & Africa M2M Market Market Share Comparison by By Applications (2016-2032)
"
- List of Tables
- "
- Table 1: Global M2M Market Market Comparison by By Organization Size (2016-2032)
- Table 2: Global M2M Market Market Comparison by By Components (2016-2032)
- Table 3: Global M2M Market Market Comparison by By Applications (2016-2032)
- Table 4: Global M2M Market Revenue (US$ Mn) Comparison by Region (2016-2032)
- Table 5: Global M2M Market Market Revenue (US$ Mn) (2016-2032)
- Table 6: Global M2M Market Market Revenue (US$ Mn) Comparison by Region (2016-2032)
- Table 7: Global M2M Market Market Revenue (US$ Mn) Comparison by By Organization Size (2016-2032)
- Table 8: Global M2M Market Market Revenue (US$ Mn) Comparison by By Components (2016-2032)
- Table 9: Global M2M Market Market Revenue (US$ Mn) Comparison by By Applications (2016-2032)
- Table 10: Global M2M Market Market Y-o-Y Growth Rate Comparison by Region (2016-2032)
- Table 11: Global M2M Market Market Y-o-Y Growth Rate Comparison by By Organization Size (2016-2032)
- Table 12: Global M2M Market Market Y-o-Y Growth Rate Comparison by By Components (2016-2032)
- Table 13: Global M2M Market Market Y-o-Y Growth Rate Comparison by By Applications (2016-2032)
- Table 14: Global M2M Market Market Share Comparison by Region (2016-2032)
- Table 15: Global M2M Market Market Share Comparison by By Organization Size (2016-2032)
- Table 16: Global M2M Market Market Share Comparison by By Components (2016-2032)
- Table 17: Global M2M Market Market Share Comparison by By Applications (2016-2032)
- Table 18: North America M2M Market Market Comparison by By Components (2016-2032)
- Table 19: North America M2M Market Market Comparison by By Applications (2016-2032)
- Table 20: North America M2M Market Revenue (US$ Mn) Comparison by Country (2016-2032)
- Table 21: North America M2M Market Market Revenue (US$ Mn) (2016-2032)
- Table 22: North America M2M Market Market Revenue (US$ Mn) Comparison by Country (2016-2032)
- Table 23: North America M2M Market Market Revenue (US$ Mn) Comparison by By Organization Size (2016-2032)
- Table 24: North America M2M Market Market Revenue (US$ Mn) Comparison by By Components (2016-2032)
- Table 25: North America M2M Market Market Revenue (US$ Mn) Comparison by By Applications (2016-2032)
- Table 26: North America M2M Market Market Y-o-Y Growth Rate Comparison by Country (2016-2032)
- Table 27: North America M2M Market Market Y-o-Y Growth Rate Comparison by By Organization Size (2016-2032)
- Table 28: North America M2M Market Market Y-o-Y Growth Rate Comparison by By Components (2016-2032)
- Table 29: North America M2M Market Market Y-o-Y Growth Rate Comparison by By Applications (2016-2032)
- Table 30: North America M2M Market Market Share Comparison by Country (2016-2032)
- Table 31: North America M2M Market Market Share Comparison by By Organization Size (2016-2032)
- Table 32: North America M2M Market Market Share Comparison by By Components (2016-2032)
- Table 33: North America M2M Market Market Share Comparison by By Applications (2016-2032)
- Table 34: Western Europe M2M Market Market Comparison by By Organization Size (2016-2032)
- Table 35: Western Europe M2M Market Market Comparison by By Components (2016-2032)
- Table 36: Western Europe M2M Market Market Comparison by By Applications (2016-2032)
- Table 37: Western Europe M2M Market Revenue (US$ Mn) Comparison by Country (2016-2032)
- Table 38: Western Europe M2M Market Market Revenue (US$ Mn) (2016-2032)
- Table 39: Western Europe M2M Market Market Revenue (US$ Mn) Comparison by Country (2016-2032)
- Table 40: Western Europe M2M Market Market Revenue (US$ Mn) Comparison by By Organization Size (2016-2032)
- Table 41: Western Europe M2M Market Market Revenue (US$ Mn) Comparison by By Components (2016-2032)
- Table 42: Western Europe M2M Market Market Revenue (US$ Mn) Comparison by By Applications (2016-2032)
- Table 43: Western Europe M2M Market Market Y-o-Y Growth Rate Comparison by Country (2016-2032)
- Table 44: Western Europe M2M Market Market Y-o-Y Growth Rate Comparison by By Organization Size (2016-2032)
- Table 45: Western Europe M2M Market Market Y-o-Y Growth Rate Comparison by By Components (2016-2032)
- Table 46: Western Europe M2M Market Market Y-o-Y Growth Rate Comparison by By Applications (2016-2032)
- Table 47: Western Europe M2M Market Market Share Comparison by Country (2016-2032)
- Table 48: Western Europe M2M Market Market Share Comparison by By Organization Size (2016-2032)
- Table 49: Western Europe M2M Market Market Share Comparison by By Components (2016-2032)
- Table 50: Western Europe M2M Market Market Share Comparison by By Applications (2016-2032)
- Table 51: Eastern Europe M2M Market Market Comparison by By Organization Size (2016-2032)
- Table 52: Eastern Europe M2M Market Market Comparison by By Components (2016-2032)
- Table 53: Eastern Europe M2M Market Market Comparison by By Applications (2016-2032)
- Table 54: Eastern Europe M2M Market Revenue (US$ Mn) Comparison by Country (2016-2032)
- Table 55: Eastern Europe M2M Market Market Revenue (US$ Mn) (2016-2032)
- Table 56: Eastern Europe M2M Market Market Revenue (US$ Mn) Comparison by Country (2016-2032)
- Table 57: Eastern Europe M2M Market Market Revenue (US$ Mn) Comparison by By Organization Size (2016-2032)
- Table 58: Eastern Europe M2M Market Market Revenue (US$ Mn) Comparison by By Components (2016-2032)
- Table 59: Eastern Europe M2M Market Market Revenue (US$ Mn) Comparison by By Applications (2016-2032)
- Table 60: Eastern Europe M2M Market Market Y-o-Y Growth Rate Comparison by Country (2016-2032)
- Table 61: Eastern Europe M2M Market Market Y-o-Y Growth Rate Comparison by By Organization Size (2016-2032)
- Table 62: Eastern Europe M2M Market Market Y-o-Y Growth Rate Comparison by By Components (2016-2032)
- Table 63: Eastern Europe M2M Market Market Y-o-Y Growth Rate Comparison by By Applications (2016-2032)
- Table 64: Eastern Europe M2M Market Market Share Comparison by Country (2016-2032)
- Table 65: Eastern Europe M2M Market Market Share Comparison by By Organization Size (2016-2032)
- Table 66: Eastern Europe M2M Market Market Share Comparison by By Components (2016-2032)
- Table 67: Eastern Europe M2M Market Market Share Comparison by By Applications (2016-2032)
- Table 68: APAC M2M Market Market Comparison by By Organization Size (2016-2032)
- Table 69: APAC M2M Market Market Comparison by By Components (2016-2032)
- Table 70: APAC M2M Market Market Comparison by By Applications (2016-2032)
- Table 71: APAC M2M Market Revenue (US$ Mn) Comparison by Country (2016-2032)
- Table 72: APAC M2M Market Market Revenue (US$ Mn) (2016-2032)
- Table 73: APAC M2M Market Market Revenue (US$ Mn) Comparison by Country (2016-2032)
- Table 74: APAC M2M Market Market Revenue (US$ Mn) Comparison by By Organization Size (2016-2032)
- Table 75: APAC M2M Market Market Revenue (US$ Mn) Comparison by By Components (2016-2032)
- Table 76: APAC M2M Market Market Revenue (US$ Mn) Comparison by By Applications (2016-2032)
- Table 77: APAC M2M Market Market Y-o-Y Growth Rate Comparison by Country (2016-2032)
- Table 78: APAC M2M Market Market Y-o-Y Growth Rate Comparison by By Organization Size (2016-2032)
- Table 79: APAC M2M Market Market Y-o-Y Growth Rate Comparison by By Components (2016-2032)
- Table 80: APAC M2M Market Market Y-o-Y Growth Rate Comparison by By Applications (2016-2032)
- Table 81: APAC M2M Market Market Share Comparison by Country (2016-2032)
- Table 82: APAC M2M Market Market Share Comparison by By Organization Size (2016-2032)
- Table 83: APAC M2M Market Market Share Comparison by By Components (2016-2032)
- Table 84: APAC M2M Market Market Share Comparison by By Applications (2016-2032)
- Table 85: Latin America M2M Market Market Comparison by By Organization Size (2016-2032)
- Table 86: Latin America M2M Market Market Comparison by By Components (2016-2032)
- Table 87: Latin America M2M Market Market Comparison by By Applications (2016-2032)
- Table 88: Latin America M2M Market Revenue (US$ Mn) Comparison by Country (2016-2032)
- Table 89: Latin America M2M Market Market Revenue (US$ Mn) (2016-2032)
- Table 90: Latin America M2M Market Market Revenue (US$ Mn) Comparison by Country (2016-2032)
- Table 91: Latin America M2M Market Market Revenue (US$ Mn) Comparison by By Organization Size (2016-2032)
- Table 92: Latin America M2M Market Market Revenue (US$ Mn) Comparison by By Components (2016-2032)
- Table 93: Latin America M2M Market Market Revenue (US$ Mn) Comparison by By Applications (2016-2032)
- Table 94: Latin America M2M Market Market Y-o-Y Growth Rate Comparison by Country (2016-2032)
- Table 95: Latin America M2M Market Market Y-o-Y Growth Rate Comparison by By Organization Size (2016-2032)
- Table 96: Latin America M2M Market Market Y-o-Y Growth Rate Comparison by By Components (2016-2032)
- Table 97: Latin America M2M Market Market Y-o-Y Growth Rate Comparison by By Applications (2016-2032)
- Table 98: Latin America M2M Market Market Share Comparison by Country (2016-2032)
- Table 99: Latin America M2M Market Market Share Comparison by By Organization Size (2016-2032)
- Table 100: Latin America M2M Market Market Share Comparison by By Components (2016-2032)
- Table 101: Latin America M2M Market Market Share Comparison by By Applications (2016-2032)
- Table 102: Middle East & Africa M2M Market Market Comparison by By Organization Size (2016-2032)
- Table 103: Middle East & Africa M2M Market Market Comparison by By Components (2016-2032)
- Table 104: Middle East & Africa M2M Market Market Comparison by By Applications (2016-2032)
- Table 105: Middle East & Africa M2M Market Revenue (US$ Mn) Comparison by Country (2016-2032)
- Table 106: Middle East & Africa M2M Market Market Revenue (US$ Mn) (2016-2032)
- Table 107: Middle East & Africa M2M Market Market Revenue (US$ Mn) Comparison by Country (2016-2032)
- Table 108: Middle East & Africa M2M Market Market Revenue (US$ Mn) Comparison by By Organization Size (2016-2032)
- Table 109: Middle East & Africa M2M Market Market Revenue (US$ Mn) Comparison by By Components (2016-2032)
- Table 110: Middle East & Africa M2M Market Market Revenue (US$ Mn) Comparison by By Applications (2016-2032)
- Table 111: Middle East & Africa M2M Market Market Y-o-Y Growth Rate Comparison by Country (2016-2032)
- Table 112: Middle East & Africa M2M Market Market Y-o-Y Growth Rate Comparison by By Organization Size (2016-2032)
- Table 113: Middle East & Africa M2M Market Market Y-o-Y Growth Rate Comparison by By Components (2016-2032)
- Table 114: Middle East & Africa M2M Market Market Y-o-Y Growth Rate Comparison by By Applications (2016-2032)
- Table 115: Middle East & Africa M2M Market Market Share Comparison by Country (2016-2032)
- Table 116: Middle East & Africa M2M Market Market Share Comparison by By Organization Size (2016-2032)
- Table 117: Middle East & Africa M2M Market Market Share Comparison by By Components (2016-2032)
- Table 118: Middle East & Africa M2M Market Market Share Comparison by By Applications (2016-2032)
- 1. Executive Summary
-
- Cumulocity
- Kore Wireless Group
- Eurotech
- Ericsson
- Gemalto
- PTC
- Telit
- AT&T Inc. (US)
- Huawei Technologies Co. Ltd. (China)
- Vodafone Group PLC (UK)
- Zebra Technologies
- Eurotech
- Alphabet Inc. (Google)
- Amdocs Ltd.
- Cisco Systems Inc.
Our Clients


View Our Licence Options
