
Liquid Soap Market By Type Analysis (Organic, Natural, Conventional), By Application Analysis (Commercial , Residential), By Distribution Channel Analysis (Specialty Stores, Supermarkets & Hypermarkets , Other), By Region And Companies - Industry Segment Outlook, Market Assessment, Competition Scenario, Trends, And Forecast 2023-2032
-
12116
-
May 2023
-
151
-


-
This report was compiled by Research Team Research team of over 50 passionate professionals leverages advanced research methodologies and analytical expertise to deliver insightful, data-driven market intelligence that empowers businesses across diverse industries to make strategic, well-informed Correspondence Research Team Linkedin | Detailed Market research Methodology Our methodology involves a mix of primary research, including interviews with leading mental health experts, and secondary research from reputable medical journals and databases. View Detailed Methodology Page
-
Quick Navigation
Report Overview
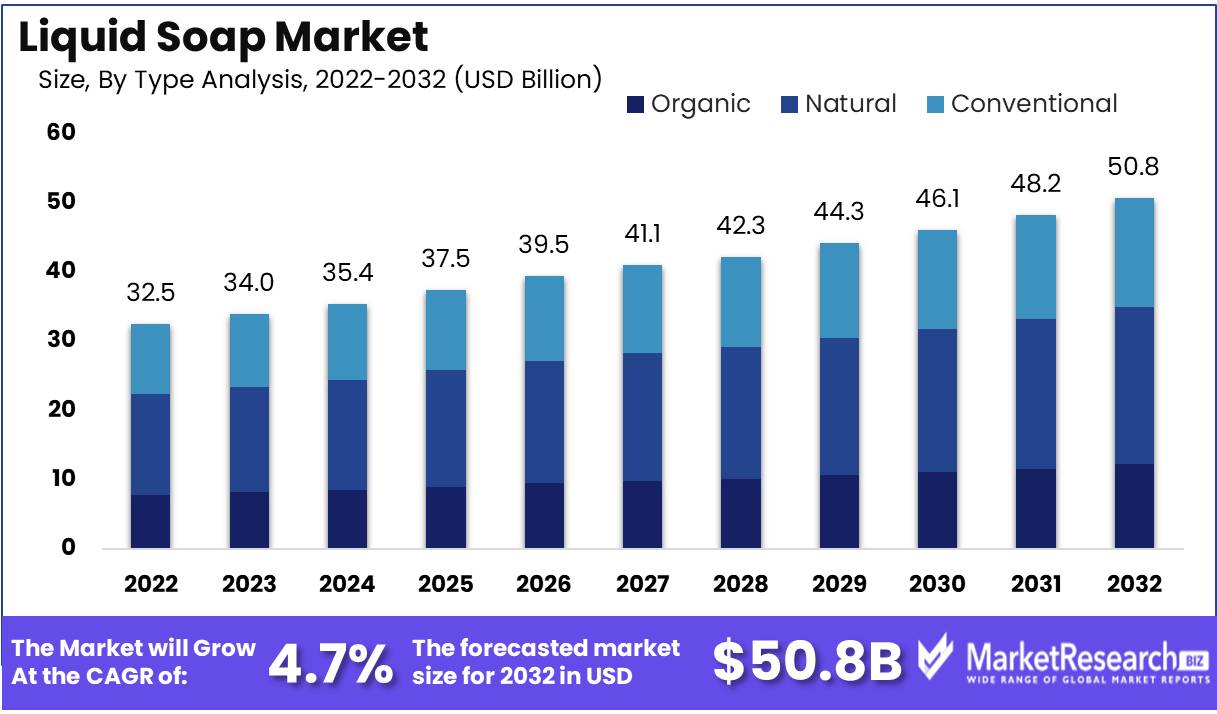
Liquid Soap Market size is expected to be worth around USD 50.8 Bn by 2032 from USD 32.5 Bn in 2022, growing at a CAGR of 4.7% during the forecast period from 2023 to 2032.
A small portion of the vast personal hygiene market, which includes shampoo, body wash, and hand sanitizers, is occupied by the realm of liquid soap. Liquid soap, a remarkably inventive soap formulation created for the noble purposes of maintaining hand and body hygiene, takes the form of a fluid substance, making it easy to apply and rinse away.
Behold the elevated ambitions of the liquid soap market, which is unceasing in its pursuit of providing consumers with an effective means of achieving impeccable hand and body hygiene, a mission characterized by convenience and usability. Its essence lies in the art of forging a product that not only possesses formidable efficacy but also brims with consummate efficiency, ensuring that users derive the greatest possible benefit from its use.
In the maze-like landscape of the liquid soap market, one innovation shines with brilliant brilliance: the advent of effervescent liquid soap. This audacious variant of liquid soap offers a veritable plethora of benefits, resembling its traditional liquid counterpart while also harnessing the sublime ability to generate opulent lather, thereby enhancing its efficacy in removing stubborn grime and unsightly oils from the skin.
With the passage of time, the liquid soap market has become a mesmerizing oasis, attracting torrents of investment from a myriad of companies, each of which seeks to leave its imprint. In recent years, countless personal hygiene brands have adopted the liquid soap revolution, adorning their product portfolios with hand and body hygiene solutions of their own design and even deftly incorporating liquid soap into the very composition of hand sanitizers and household cleaning agents.
The inexorable growth of this burgeoning market can be attributed to an increase in demand for personal hygiene products, the tantalizing availability of a myriad of enticing varieties, and the advent of environmentally conscious, nature-embracing alternatives that resonate harmoniously with the organic-loving public.
The primary beneficiaries of the liquid soap market can be found within the personal hygiene industry, specifically the sanctuaries of hand and body hygiene. As the insatiable demand for personal hygiene products continues to grow, companies are compelled to expand the scope of their product lines, incorporating liquid soap into their illustrious domains.
The dynamic forces that propel the liquid soap market forward can be reduced to a handful of fundamental forces. The escalating demand for personal hygiene products, the advent of environmentally responsible and organic alternatives, and the undeniable appeal of liquid soap's convenience and ease of use, a notable departure from the time-honored realm of traditional bar soap, are chief among these factors.
As with all personal hygiene consumables, the liquid soap market faces a plethora of ethical dilemmas, the most prominent of which involve the product's responsible employment and disposal. Companies operating in this ethereal realm have an unwavering commitment to transparency, detailing the interior workings of their production processes and forging a steadfast path toward accountability and clarification.
Driving factors
Demand for Natural Liquid Soaps is Growing
One such factor is a rise in sanitation and cleanliness awareness among consumers. The demand for hygienic and natural detergent products has increased as consumers become more conscious of their personal hygiene. This has led to a growing demand for natural and eco-friendly liquid detergents.
Convenience and Selection Drive the Market for Liquid Soap
The increasing availability of liquid soaps in a variety of fragrances and sizes is another factor contributing to the growth of the liquid soap market. Liquid soap is now a popular alternative to traditional bar soap thanks to advances in packaging technology that have also led to ease of use and convenience. In addition, the hospitality and healthcare industries have a growing demand for luxury and premium liquid detergents.
Urbanization Increases Sales of Liquid Soap
The increase in the use of liquid soap for personal hygiene is another significant factor propelling the growth of the liquid soap market. Increasing urbanization and a shift in lifestyle habits have fueled the demand for liquid detergent products even further. This has led to the availability of an extensive selection of liquid detergent products at reasonable prices.
Regulatory Changes Influence the Market for Liquid Soap
Existing or prospective regulatory changes may have an impact on the liquid soap market. Many nations have implemented restrictions on the use of specific chemicals in detergent products. For instance, REACH restricts the use of certain chemicals in detergent products.
Technological Progresses Shape the Liquid Soap Industry
Emerging technologies, such as sophisticated mixing and blending techniques, may have a future impact on the liquid soap market. In addition, potential disruptors, such as new entrants and innovative products, may impact the competitive landscape of the liquid detergent market.
Increasing Demand for Eco-Friendly Liquid Soaps
Consumer behavior is constantly evolving, and emerging trends may have an impact on the market for liquid detergent. For example, consumers are becoming more conscious of ethical and environmentally friendly products. Consequently, there is a growing demand for natural and eco-friendly detergent products.
Restraining Factors
Raw Material Price Volatility Dilemma
High competition among established competitors is one of the main restraining factors in the liquid soap market. This competition results in a price war that has a negative impact on profitability and long-term viability. As more brands penetrate the market, price-based competition becomes increasingly difficult. To combat this, companies must differentiate their products through the use of novel characteristics, attractive packaging, and strategic marketing campaigns.
Confronting Counterfeit Dangers in Liquid Soap
The volatility of raw material prices is an additional factor restraining the liquid soap market. The cost of basic materials, including oils, fragrances, and preservatives, can fluctuate based on supply and demand, seasonal fluctuations, and other external factors. This circumstance makes it difficult to calculate and predict production costs, making it difficult to appropriately price liquid soap products.
Cheaper Substitutes Impact Liquid Soap
Genuine liquid soap sales are severely threatened by counterfeit products. As the demand for liquid soap products rises, unscrupulous people and companies attempt to take advantage of the market by manufacturing and selling counterfeit liquid soap that resembles authentic versions but is manufactured with inferior materials. The impact of counterfeiting is felt in terms of both lost revenues for legitimate actors and potential health risks posed by substandard products.
Sustainable Packaging Is Expensive Due to Environmental Pressures
The availability of inexpensive substitutes is another significant factor restraining the market for liquid soap. With the increase in competition, lesser players may be able to produce products at a lower cost than larger brands cannot match. These less expensive substitutes frequently have disadvantages, such as inferior ingredients and substandard performance. Nevertheless, these factors do not deter some consumers who are prepared to pay less for inexpensive substitutes.
Cost-Effectiveness Analysis of Liquid Soap
The use of liquid soap products necessitates the proper disposal of packaging materials. Manufacturers are under pressure to use biodegradable or recyclable packaging materials as a result of the growing environmental consciousness, particularly in developed nations. While such packaging materials can be eco-friendly, they are also costly to manufacture, which can increase the ultimate price of the product.
Type Analysis
The world is experiencing a transition toward natural products, and the market for liquid soap reflects this trend. The Natural Segment dominates the liquid soap market, and its dominance is expected to persist in the future years. This market segment is driven by consumer demand and heightened awareness of the advantages of using natural products.
The adoption of the Natural Segment is driven by the accelerating economic growth of emerging economies. As their purchasing power increases, consumers in these regions are more prepared to pay a premium for natural products as they become more informed about their benefits.
The increasing health consciousness and environmental consciousness of consumers is reflected in their purchasing decisions. They are more willing to pay a premium for natural, sustainable products that are free of hazardous chemicals. As a consequence, the Natural Segment is anticipated to expand rapidly.
In the coming years, the Natural Segment of the liquid soap market is anticipated to record the highest growth rate. This expansion can be attributed to the growing demand for natural products brought on by a shift in consumer preferences.
Application Analysis
The Commercial Segment dominates the liquid soap market, and its growth is anticipated to continue over the next few years. Demand from industries such as hospitality, healthcare, and food processing drives the Commercial Segment.
Commercial Segment adoption is driven by the economic development of emerging economies. As these economies develop, the demand for commercial spaces such as hotels and restaurants increases, which drives the demand for commercial liquid soap.
Consumers in the hospitality, healthcare, and food processing industries demand liquid soaps of superior quality that meet their specific requirements. They are searching for antimicrobial products that are effective and gentle on the skin.
Over the future years, it is anticipated that the Commercial Segment of the Liquid Soap Market will experience the fastest growth rate. The expansion is attributable to rising demand from the hospitality, healthcare, and food processing industries, as well as the rising demand for high-quality liquid soap products.
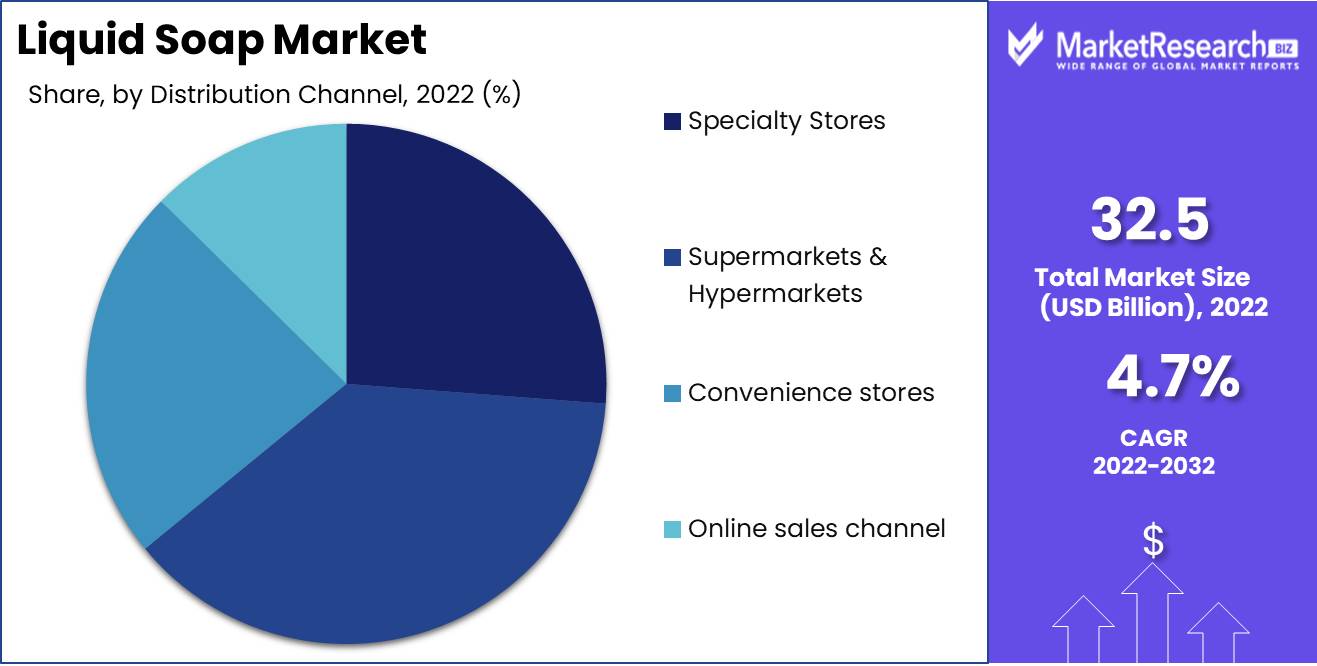
Distribution Channel Analysis
The Supermarkets/Hypermarkets Segment dominates the liquid soap market, and its dominance is anticipated to persist in the coming years. Supermarkets and hypermarkets provide an extensive and convenient selection of liquid soap products.
The adoption of the Supermarkets/Hypermarkets Segment is driven by economic growth in emerging economies. As these economies expand, the demand for retail spaces, such as supermarkets and hypermarkets, rises, thereby driving the demand for liquid soap products.
Due to their convenience and extensive product selection, supermarkets and hypermarkets are gaining popularity with consumers. Liquid soap is a fixture in these stores, and consumers prefer to purchase liquid soap from these establishments.
In the liquid soap market, it is anticipated that the supermarket/Hypermarkets Segment will experience the highest growth rate in the future years. The development is attributable to the rising demand for liquid soap products in supermarkets and superstores.
Key Market Segments
Type Analysis
- Organic
- Natural
- Conventional
Application Analysis
- Commercial
- Residential
Distribution Channel Analysis
- Specialty Stores
- Supermarkets & Hypermarkets
- Convenience stores
- Online sales channel
Growth Opportunity
The Extreme Growth of Organic Liquid Soaps
As consumers become more aware of what they put on their epidermis, the demand for organic and natural liquid soaps increases. In terms of popularity, liquid soaps have surpassed bar soaps due to their convenience, adaptability, and ease of use. This shift in consumer preferences, coupled with the growth of online shopping for consumer goods and the emergence of new market players offering innovative and specialized liquid soap products, presents an expansion opportunity for the liquid soap market.
Convenience Fuels Liquid Soap Boom
In recent years, the wellness industry has grown substantially, with an increasing number of consumers opting for natural and organic hygiene products. Manufacturers of liquid soap have responded to this trend by creating organic and natural liquid soaps devoid of hazardous chemicals and preservatives. Organic and natural liquid soaps offer numerous benefits to consumers, including gentle and effective cleansing, nourishment, and anti-inflammatory properties. Ideal for individuals with sensitive skin, allergies, or dermatological conditions.
The Development of Liquid Eco-Friendly Soap
Leading brands of organic and natural liquid soap incorporate eco-friendly ingredients and packaging into their products. Due to these practices, customers associate these brands with environmentally responsible consumption. Online shopping has revolutionized the way consumers purchase products, including liquid soaps. With e-commerce platforms offering rapid, dependable, and affordable shipping, it has become increasingly advantageous for consumers to buy liquid soaps online.
Online, Specialty Players Do Well
The ease of online shopping has created new markets and provided niche actors with the opportunity to market their specialized products to a larger audience. Innovative liquid soap products, such as those with exotic fragrances, customized formulations, and distinctive packaging, are now available to a global consumer base thanks to e-commerce platforms. In emerging economies, the growth of the hospitality and healthcare industries has increased the demand for liquid soaps in bulk.
Innovative Packaging Solutions
Manufacturers of liquid soap are implementing innovative and sustainable packaging solutions, such as recyclable bottles, biodegradable pouches, and paper-based packaging, in order to meet the rising demand for eco-friendly products among consumers. New market participants have entered the liquid soap market, bringing with them innovative and specialized products that meet the specific needs of consumers.
Latest Trends
The Emergence of Multi-Purpose Liquid Soaps
As the world becomes more health-conscious and focused on eco-friendly and sustainable products, the market for liquid detergent has undergone significant transformations. The industry is experiencing a number of trends that are reshaping the market and influencing how consumers use and select liquid detergent products.
Eco-friendly Liquid Soap Boom
Consumers are becoming more and more interested in multi-functional liquid soaps. These products feature moisturizing, anti-bacterial, anti-viral, and aromatherapeutic properties. As a result of the COVID-19 pandemic, the demand for anti-bacterial products has skyrocketed, and multi-purpose liquid soaps have become a necessity in many homes.
Innovative Packaging Techniques
Consumers are now more conscious of how their purchases affect the environment, and this trend is increasingly influencing their selection of liquid detergent products. In recent years, plant-based liquid soap products made from natural ingredients have acquired significant popularity. These products are eco-friendly, biodegradable, and chemical-free, making them safer for the environment and the epidermis of consumers.
Unique Fragrances Transform Liquid Soaps
Packaging plays a crucial function in the market for liquid soap. Consumers are attracted to products that are aesthetically pleasing and easy to use. Consequently, the market is observing packaging innovations that enhance the product's appeal. Some liquid soap products, for instance, are now packaged in bottles with pumps, making it simpler to dispense the product with one hand.
Increasing Interest in Eco-Friendly Liquid Soaps
To stand out in a competitive market, manufacturers of liquid detergent are increasingly focusing on product differentiation. Unique fragrances and ingredients are gaining popularity as a means to distinguish oneself in the marketplace. For instance, some liquid detergent products now contain essential oils such as lavender, peppermint, or rosemary. In addition to providing a pleasant experience, these unique fragrances also provide additional benefits such as relaxation, tension relief, and skin nourishment.
Regional Analysis
Natural and organic liquid soap products have grown significantly in North America during the past few years. Demand for natural and organic personal care products has increased as people become more conscious of what they put on their skin. Natural and organic liquid soap products meet consumer needs for safer and better hygiene options.
Several reasons are driving North American demand for natural and organic liquid soap products. First, people are more aware of how synthetic chemicals and harsh ingredients affect their skin. Thus, they seek gentler, safer options that don't irritate the skin, create allergies, or disrupt hormones.
Second, consumers are becoming more environmentally conscious of personal care products. Biodegradable and sustainable ingredients are used in natural and organic liquid soap products. This makes them appealing to carbon-conscious people.
Finally, small, local firms that make natural and organic products are gaining popularity. Handmade, sustainable, and locally sourced products give customers a more customized experience.
The fact that they are manufactured from premium ingredients without synthetic chemicals like parabens or SLS is one of the biggest benefits of natural and organic liquid soap products. These chemicals can irritate the skin and harm health. Natural and organic liquid soap products are safer and healthier.

Key Regions and Countries
North America
- US
- Canada
- Mexico
Western Europe
- Germany
- France
- The UK
- Spain
- Italy
- Portugal
- Ireland
- Austria
- Switzerland
- Benelux
- Nordic
- Rest of Western Europe
Eastern Europe
- Russia
- Poland
- The Czech Republic
- Greece
- Rest of Eastern Europe
APAC
- China
- Japan
- South Korea
- India
- Australia & New Zealand
- Indonesia
- Malaysia
- Philippines
- Singapore
- Thailand
- Vietnam
- Rest of APAC
Latin America
- Brazil
- Colombia
- Chile
- Argentina
- Costa Rica
- Rest of Latin America
Middle East & Africa
- Algeria
- Egypt
- Israel
- Kuwait
- Nigeria
- Saudi Arabia
- South Africa
- Turkey
- United Arab Emirates
- Rest of MEA
Key Players Analysis
As more players enter the liquid soap market with novel ideas and new product offers, the industry has become more competitive. Procter & Gamble, Unilever, and Colgate-Palmolive are key market players.
Procter & Gamble's Ivory is one of the top players in the liquid soap market. The company has been in business for decades and is trusted in the industry. Unilever is a key player with Dove, Lux, and Lifebuoy.
Johnson & Johnson, Reckitt Benckiser, and Henkel are also market players. These companies have a large market share and compete with new and existing players. Seventh Generation and Mrs. Meyers, smaller companies that specialize in eco-friendly and sustainable products, have also become industry leaders.
Rising hygiene and sanitation awareness and consumer preference for liquid soaps over bar soaps will drive the liquid soap market. To keep ahead of the competition and match client requests, key market players must innovate. Companies that can include eco-friendly and sustainable characteristics in their liquid soap offerings will succeed.
Top Key Players in Liquid Soap Market
- Premier English Manufacturing Ltd.
- Procter & Gamble
- Unilever
- Cleenol Group Ltd.
- Christina May Ltd.
- Reckitt Benckiser Group plc
- GlaxoSmithKline
- Unilever
- LES ROBINETS PRESTO S.A.
- Colgate-Palmolive Company
- Henkel Corporation
Recent Development
- In 2021, Unilever pledged to make all of its plastic packaging, including liquid soap packaging, recyclable, reusable, or compostable by 2025.
- In 2020, Johnson & Johnson Consumer Health launched a new line of liquid hand soaps under the Aveeno brand name.
- In 2019, Procter & Gamble launched "Microban 24 Hour," a new line of liquid soap hand products.
- In 2018, Method Products launched a line of foaming hand washes made from plant-based ingredients and packaged in bottles made from ocean plastic.
- In 2017, Colgate-Palmolive launched "Softsoap Earth Blends," a new line of liquid soap hand products.
Report Scope:
Report Features Description Market Value (2022) USD 32.5 Bn Forecast Revenue (2032) USD 50.8 Bn CAGR (2023-2032) 4.7% Base Year for Estimation 2022 Historic Period 2016-2022 Forecast Period 2023-2032 Report Coverage Revenue Forecast, Market Dynamics, COVID-19 Impact, Competitive Landscape, Recent Developments Segments Covered By Type Analysis (Organic, Natural, Conventional), By Application Analysis (Commercial, Residential), By Distribution Channel Analysis (Specialty Stores, Supermarkets & Hypermarkets, Convenience stores, Online sales channel) Regional Analysis North America – The US, Canada, & Mexico; Western Europe – Germany, France, The UK, Spain, Italy, Portugal, Ireland, Austria, Switzerland, Benelux, Nordic, & Rest of Western Europe; Eastern Europe – Russia, Poland, The Czech Republic, Greece, & Rest of Eastern Europe; APAC – China, Japan, South Korea, India, Australia & New Zealand, Indonesia, Malaysia, Philippines, Singapore, Thailand, Vietnam, & Rest of APAC; Latin America – Brazil, Colombia, Chile, Argentina, Costa Rica, & Rest of Latin America; Middle East & Africa – Algeria, Egypt, Israel, Kuwait, Nigeria, Saudi Arabia, South Africa, Turkey, United Arab Emirates, & Rest of MEA Competitive Landscape Premier English Manufacturing Ltd., Procter & Gamble, Unilever, Cleenol Group Ltd., Christina May Ltd., Reckitt Benckiser Group plc, GlaxoSmithKline, Unilever, LES ROBINETS PRESTO S.A., Colgate-Palmolive Company, Henkel Corporation Customization Scope Customization for segments, region/country-level will be provided. Moreover, additional customization can be done based on the requirements. Purchase Options We have three licenses to opt for: Single User License, Multi-User License (Up to 5 Users), Corporate Use License (Unlimited User and Printable PDF) -
- 1. Executive Summary
- 1.1. Definition
- 1.2. Taxonomy
- 1.3. Research Scope
- 1.4. Key Analysis
- 1.5. Key Findings by Major Segments
- 1.6. Top strategies by Major Players
- 2. Global Liquid Soap Market Overview
- 2.1. Liquid Soap Market Dynamics
- 2.1.1. Drivers
- 2.1.2. Opportunities
- 2.1.3. Restraints
- 2.1.4. Challenges
- 2.2. Macro-economic Factors
- 2.3. Regulatory Framework
- 2.4. Market Investment Feasibility Index
- 2.5. PEST Analysis
- 2.6. PORTER’S Five Force Analysis
- 2.7. Drivers & Restraints Impact Analysis
- 2.8. Industry Chain Analysis
- 2.9. Cost Structure Analysis
- 2.10. Marketing Strategy
- 2.11. Russia-Ukraine War Impact Analysis
- 2.12. Opportunity Map Analysis
- 2.13. Market Competition Scenario Analysis
- 2.14. Product Life Cycle Analysis
- 2.15. Opportunity Orbits
- 2.16. Manufacturer Intensity Map
- 2.17. Major Companies sales by Value & Volume
- 2.1. Liquid Soap Market Dynamics
- 3. Global Liquid Soap Market Analysis, Opportunity and Forecast, 2016-2032
- 3.1. Global Liquid Soap Market Analysis, 2016-2021
- 3.2. Global Liquid Soap Market Opportunity and Forecast, 2023-2032
- 3.3. Global Liquid Soap Market Analysis, Opportunity and Forecast, By Type Analysis, 2016-2032
- 3.3.1. Global Liquid Soap Market Analysis by Type Analysis: Introduction
- 3.3.2. Market Size Absolute $ Opportunity Analysis and Forecast, By Type Analysis, 2016-2032
- 3.3.3. Organic
- 3.3.4. Natural
- 3.3.5. Conventional
- 3.4. Global Liquid Soap Market Analysis, Opportunity and Forecast, By Application Analysis, 2016-2032
- 3.4.1. Global Liquid Soap Market Analysis by Application Analysis: Introduction
- 3.4.2. Market Size Absolute $ Opportunity Analysis and Forecast, By Application Analysis, 2016-2032
- 3.4.3. Commercial
- 3.4.4. Residential
- 3.5. Global Liquid Soap Market Analysis, Opportunity and Forecast, By Distribution Channel Analysis, 2016-2032
- 3.5.1. Global Liquid Soap Market Analysis by Distribution Channel Analysis: Introduction
- 3.5.2. Market Size Absolute $ Opportunity Analysis and Forecast, By Distribution Channel Analysis, 2016-2032
- 3.5.3. Specialty Stores
- 3.5.4. Supermarkets & Hypermarkets
- 3.5.5. Convenience stores
- 3.5.6. Online sales channel
- 4. North America Liquid Soap Market Analysis, Opportunity and Forecast, 2016-2032
- 4.1. North America Liquid Soap Market Analysis, 2016-2021
- 4.2. North America Liquid Soap Market Opportunity and Forecast, 2023-2032
- 4.3. North America Liquid Soap Market Analysis, Opportunity and Forecast, By Type Analysis, 2016-2032
- 4.3.1. North America Liquid Soap Market Analysis by Type Analysis: Introduction
- 4.3.2. Market Size Absolute $ Opportunity Analysis and Forecast, By Type Analysis, 2016-2032
- 4.3.3. Organic
- 4.3.4. Natural
- 4.3.5. Conventional
- 4.4. North America Liquid Soap Market Analysis, Opportunity and Forecast, By Application Analysis, 2016-2032
- 4.4.1. North America Liquid Soap Market Analysis by Application Analysis: Introduction
- 4.4.2. Market Size Absolute $ Opportunity Analysis and Forecast, By Application Analysis, 2016-2032
- 4.4.3. Commercial
- 4.4.4. Residential
- 4.5. North America Liquid Soap Market Analysis, Opportunity and Forecast, By Distribution Channel Analysis, 2016-2032
- 4.5.1. North America Liquid Soap Market Analysis by Distribution Channel Analysis: Introduction
- 4.5.2. Market Size Absolute $ Opportunity Analysis and Forecast, By Distribution Channel Analysis, 2016-2032
- 4.5.3. Specialty Stores
- 4.5.4. Supermarkets & Hypermarkets
- 4.5.5. Convenience stores
- 4.5.6. Online sales channel
- 4.6. North America Liquid Soap Market Analysis, Opportunity and Forecast, By Country , 2016-2032
- 4.6.1. North America Liquid Soap Market Analysis by Country : Introduction
- 4.6.2. Market Size Absolute $ Opportunity Analysis and Forecast, Country , 2016-2032
- 4.6.2.1. The US
- 4.6.2.2. Canada
- 4.6.2.3. Mexico
- 5. Western Europe Liquid Soap Market Analysis, Opportunity and Forecast, 2016-2032
- 5.1. Western Europe Liquid Soap Market Analysis, 2016-2021
- 5.2. Western Europe Liquid Soap Market Opportunity and Forecast, 2023-2032
- 5.3. Western Europe Liquid Soap Market Analysis, Opportunity and Forecast, By Type Analysis, 2016-2032
- 5.3.1. Western Europe Liquid Soap Market Analysis by Type Analysis: Introduction
- 5.3.2. Market Size Absolute $ Opportunity Analysis and Forecast, By Type Analysis, 2016-2032
- 5.3.3. Organic
- 5.3.4. Natural
- 5.3.5. Conventional
- 5.4. Western Europe Liquid Soap Market Analysis, Opportunity and Forecast, By Application Analysis, 2016-2032
- 5.4.1. Western Europe Liquid Soap Market Analysis by Application Analysis: Introduction
- 5.4.2. Market Size Absolute $ Opportunity Analysis and Forecast, By Application Analysis, 2016-2032
- 5.4.3. Commercial
- 5.4.4. Residential
- 5.5. Western Europe Liquid Soap Market Analysis, Opportunity and Forecast, By Distribution Channel Analysis, 2016-2032
- 5.5.1. Western Europe Liquid Soap Market Analysis by Distribution Channel Analysis: Introduction
- 5.5.2. Market Size Absolute $ Opportunity Analysis and Forecast, By Distribution Channel Analysis, 2016-2032
- 5.5.3. Specialty Stores
- 5.5.4. Supermarkets & Hypermarkets
- 5.5.5. Convenience stores
- 5.5.6. Online sales channel
- 5.6. Western Europe Liquid Soap Market Analysis, Opportunity and Forecast, By Country , 2016-2032
- 5.6.1. Western Europe Liquid Soap Market Analysis by Country : Introduction
- 5.6.2. Market Size Absolute $ Opportunity Analysis and Forecast, Country , 2016-2032
- 5.6.2.1. Germany
- 5.6.2.2. France
- 5.6.2.3. The UK
- 5.6.2.4. Spain
- 5.6.2.5. Italy
- 5.6.2.6. Portugal
- 5.6.2.7. Ireland
- 5.6.2.8. Austria
- 5.6.2.9. Switzerland
- 5.6.2.10. Benelux
- 5.6.2.11. Nordic
- 5.6.2.12. Rest of Western Europe
- 6. Eastern Europe Liquid Soap Market Analysis, Opportunity and Forecast, 2016-2032
- 6.1. Eastern Europe Liquid Soap Market Analysis, 2016-2021
- 6.2. Eastern Europe Liquid Soap Market Opportunity and Forecast, 2023-2032
- 6.3. Eastern Europe Liquid Soap Market Analysis, Opportunity and Forecast, By Type Analysis, 2016-2032
- 6.3.1. Eastern Europe Liquid Soap Market Analysis by Type Analysis: Introduction
- 6.3.2. Market Size Absolute $ Opportunity Analysis and Forecast, By Type Analysis, 2016-2032
- 6.3.3. Organic
- 6.3.4. Natural
- 6.3.5. Conventional
- 6.4. Eastern Europe Liquid Soap Market Analysis, Opportunity and Forecast, By Application Analysis, 2016-2032
- 6.4.1. Eastern Europe Liquid Soap Market Analysis by Application Analysis: Introduction
- 6.4.2. Market Size Absolute $ Opportunity Analysis and Forecast, By Application Analysis, 2016-2032
- 6.4.3. Commercial
- 6.4.4. Residential
- 6.5. Eastern Europe Liquid Soap Market Analysis, Opportunity and Forecast, By Distribution Channel Analysis, 2016-2032
- 6.5.1. Eastern Europe Liquid Soap Market Analysis by Distribution Channel Analysis: Introduction
- 6.5.2. Market Size Absolute $ Opportunity Analysis and Forecast, By Distribution Channel Analysis, 2016-2032
- 6.5.3. Specialty Stores
- 6.5.4. Supermarkets & Hypermarkets
- 6.5.5. Convenience stores
- 6.5.6. Online sales channel
- 6.6. Eastern Europe Liquid Soap Market Analysis, Opportunity and Forecast, By Country , 2016-2032
- 6.6.1. Eastern Europe Liquid Soap Market Analysis by Country : Introduction
- 6.6.2. Market Size Absolute $ Opportunity Analysis and Forecast, Country , 2016-2032
- 6.6.2.1. Russia
- 6.6.2.2. Poland
- 6.6.2.3. The Czech Republic
- 6.6.2.4. Greece
- 6.6.2.5. Rest of Eastern Europe
- 7. APAC Liquid Soap Market Analysis, Opportunity and Forecast, 2016-2032
- 7.1. APAC Liquid Soap Market Analysis, 2016-2021
- 7.2. APAC Liquid Soap Market Opportunity and Forecast, 2023-2032
- 7.3. APAC Liquid Soap Market Analysis, Opportunity and Forecast, By Type Analysis, 2016-2032
- 7.3.1. APAC Liquid Soap Market Analysis by Type Analysis: Introduction
- 7.3.2. Market Size Absolute $ Opportunity Analysis and Forecast, By Type Analysis, 2016-2032
- 7.3.3. Organic
- 7.3.4. Natural
- 7.3.5. Conventional
- 7.4. APAC Liquid Soap Market Analysis, Opportunity and Forecast, By Application Analysis, 2016-2032
- 7.4.1. APAC Liquid Soap Market Analysis by Application Analysis: Introduction
- 7.4.2. Market Size Absolute $ Opportunity Analysis and Forecast, By Application Analysis, 2016-2032
- 7.4.3. Commercial
- 7.4.4. Residential
- 7.5. APAC Liquid Soap Market Analysis, Opportunity and Forecast, By Distribution Channel Analysis, 2016-2032
- 7.5.1. APAC Liquid Soap Market Analysis by Distribution Channel Analysis: Introduction
- 7.5.2. Market Size Absolute $ Opportunity Analysis and Forecast, By Distribution Channel Analysis, 2016-2032
- 7.5.3. Specialty Stores
- 7.5.4. Supermarkets & Hypermarkets
- 7.5.5. Convenience stores
- 7.5.6. Online sales channel
- 7.6. APAC Liquid Soap Market Analysis, Opportunity and Forecast, By Country , 2016-2032
- 7.6.1. APAC Liquid Soap Market Analysis by Country : Introduction
- 7.6.2. Market Size Absolute $ Opportunity Analysis and Forecast, Country , 2016-2032
- 7.6.2.1. China
- 7.6.2.2. Japan
- 7.6.2.3. South Korea
- 7.6.2.4. India
- 7.6.2.5. Australia & New Zeland
- 7.6.2.6. Indonesia
- 7.6.2.7. Malaysia
- 7.6.2.8. Philippines
- 7.6.2.9. Singapore
- 7.6.2.10. Thailand
- 7.6.2.11. Vietnam
- 7.6.2.12. Rest of APAC
- 8. Latin America Liquid Soap Market Analysis, Opportunity and Forecast, 2016-2032
- 8.1. Latin America Liquid Soap Market Analysis, 2016-2021
- 8.2. Latin America Liquid Soap Market Opportunity and Forecast, 2023-2032
- 8.3. Latin America Liquid Soap Market Analysis, Opportunity and Forecast, By Type Analysis, 2016-2032
- 8.3.1. Latin America Liquid Soap Market Analysis by Type Analysis: Introduction
- 8.3.2. Market Size Absolute $ Opportunity Analysis and Forecast, By Type Analysis, 2016-2032
- 8.3.3. Organic
- 8.3.4. Natural
- 8.3.5. Conventional
- 8.4. Latin America Liquid Soap Market Analysis, Opportunity and Forecast, By Application Analysis, 2016-2032
- 8.4.1. Latin America Liquid Soap Market Analysis by Application Analysis: Introduction
- 8.4.2. Market Size Absolute $ Opportunity Analysis and Forecast, By Application Analysis, 2016-2032
- 8.4.3. Commercial
- 8.4.4. Residential
- 8.5. Latin America Liquid Soap Market Analysis, Opportunity and Forecast, By Distribution Channel Analysis, 2016-2032
- 8.5.1. Latin America Liquid Soap Market Analysis by Distribution Channel Analysis: Introduction
- 8.5.2. Market Size Absolute $ Opportunity Analysis and Forecast, By Distribution Channel Analysis, 2016-2032
- 8.5.3. Specialty Stores
- 8.5.4. Supermarkets & Hypermarkets
- 8.5.5. Convenience stores
- 8.5.6. Online sales channel
- 8.6. Latin America Liquid Soap Market Analysis, Opportunity and Forecast, By Country , 2016-2032
- 8.6.1. Latin America Liquid Soap Market Analysis by Country : Introduction
- 8.6.2. Market Size Absolute $ Opportunity Analysis and Forecast, Country , 2016-2032
- 8.6.2.1. Brazil
- 8.6.2.2. Colombia
- 8.6.2.3. Chile
- 8.6.2.4. Argentina
- 8.6.2.5. Costa Rica
- 8.6.2.6. Rest of Latin America
- 9. Middle East & Africa Liquid Soap Market Analysis, Opportunity and Forecast, 2016-2032
- 9.1. Middle East & Africa Liquid Soap Market Analysis, 2016-2021
- 9.2. Middle East & Africa Liquid Soap Market Opportunity and Forecast, 2023-2032
- 9.3. Middle East & Africa Liquid Soap Market Analysis, Opportunity and Forecast, By Type Analysis, 2016-2032
- 9.3.1. Middle East & Africa Liquid Soap Market Analysis by Type Analysis: Introduction
- 9.3.2. Market Size Absolute $ Opportunity Analysis and Forecast, By Type Analysis, 2016-2032
- 9.3.3. Organic
- 9.3.4. Natural
- 9.3.5. Conventional
- 9.4. Middle East & Africa Liquid Soap Market Analysis, Opportunity and Forecast, By Application Analysis, 2016-2032
- 9.4.1. Middle East & Africa Liquid Soap Market Analysis by Application Analysis: Introduction
- 9.4.2. Market Size Absolute $ Opportunity Analysis and Forecast, By Application Analysis, 2016-2032
- 9.4.3. Commercial
- 9.4.4. Residential
- 9.5. Middle East & Africa Liquid Soap Market Analysis, Opportunity and Forecast, By Distribution Channel Analysis, 2016-2032
- 9.5.1. Middle East & Africa Liquid Soap Market Analysis by Distribution Channel Analysis: Introduction
- 9.5.2. Market Size Absolute $ Opportunity Analysis and Forecast, By Distribution Channel Analysis, 2016-2032
- 9.5.3. Specialty Stores
- 9.5.4. Supermarkets & Hypermarkets
- 9.5.5. Convenience stores
- 9.5.6. Online sales channel
- 9.6. Middle East & Africa Liquid Soap Market Analysis, Opportunity and Forecast, By Country , 2016-2032
- 9.6.1. Middle East & Africa Liquid Soap Market Analysis by Country : Introduction
- 9.6.2. Market Size Absolute $ Opportunity Analysis and Forecast, Country , 2016-2032
- 9.6.2.1. Algeria
- 9.6.2.2. Egypt
- 9.6.2.3. Israel
- 9.6.2.4. Kuwait
- 9.6.2.5. Nigeria
- 9.6.2.6. Saudi Arabia
- 9.6.2.7. South Africa
- 9.6.2.8. Turkey
- 9.6.2.9. The UAE
- 9.6.2.10. Rest of MEA
- 10. Global Liquid Soap Market Analysis, Opportunity and Forecast, By Region , 2016-2032
- 10.1. Global Liquid Soap Market Analysis by Region : Introduction
- 10.2. Market Size Absolute $ Opportunity Analysis and Forecast, By Region , 2016-2032
- 10.2.1. North America
- 10.2.2. Western Europe
- 10.2.3. Eastern Europe
- 10.2.4. APAC
- 10.2.5. Latin America
- 10.2.6. Middle East & Africa
- 11. Global Liquid Soap Market Competitive Landscape, Market Share Analysis, and Company Profiles
- 11.1. Market Share Analysis
- 11.2. Company Profiles
- 11.3. Premier English Manufacturing Ltd.
- 11.3.1. Company Overview
- 11.3.2. Financial Highlights
- 11.3.3. Product Portfolio
- 11.3.4. SWOT Analysis
- 11.3.5. Key Strategies and Developments
- 11.4. Procter & Gamble
- 11.4.1. Company Overview
- 11.4.2. Financial Highlights
- 11.4.3. Product Portfolio
- 11.4.4. SWOT Analysis
- 11.4.5. Key Strategies and Developments
- 11.5. Unilever
- 11.5.1. Company Overview
- 11.5.2. Financial Highlights
- 11.5.3. Product Portfolio
- 11.5.4. SWOT Analysis
- 11.5.5. Key Strategies and Developments
- 11.6. Cleenol Group Ltd.
- 11.6.1. Company Overview
- 11.6.2. Financial Highlights
- 11.6.3. Product Portfolio
- 11.6.4. SWOT Analysis
- 11.6.5. Key Strategies and Developments
- 11.7. Christina May Ltd.
- 11.7.1. Company Overview
- 11.7.2. Financial Highlights
- 11.7.3. Product Portfolio
- 11.7.4. SWOT Analysis
- 11.7.5. Key Strategies and Developments
- 11.8. Reckitt Benckiser Group plc
- 11.8.1. Company Overview
- 11.8.2. Financial Highlights
- 11.8.3. Product Portfolio
- 11.8.4. SWOT Analysis
- 11.8.5. Key Strategies and Developments
- 11.9. GlaxoSmithKline
- 11.9.1. Company Overview
- 11.9.2. Financial Highlights
- 11.9.3. Product Portfolio
- 11.9.4. SWOT Analysis
- 11.9.5. Key Strategies and Developments
- 11.10. Unilever
- 11.10.1. Company Overview
- 11.10.2. Financial Highlights
- 11.10.3. Product Portfolio
- 11.10.4. SWOT Analysis
- 11.10.5. Key Strategies and Developments
- 11.11. LES ROBINETS PRESTO S.A.
- 11.11.1. Company Overview
- 11.11.2. Financial Highlights
- 11.11.3. Product Portfolio
- 11.11.4. SWOT Analysis
- 11.11.5. Key Strategies and Developments
- 11.12. Colgate-Palmolive Company
- 11.12.1. Company Overview
- 11.12.2. Financial Highlights
- 11.12.3. Product Portfolio
- 11.12.4. SWOT Analysis
- 11.12.5. Key Strategies and Developments
- 11.13. Henkel Corporation
- 11.13.1. Company Overview
- 11.13.2. Financial Highlights
- 11.13.3. Product Portfolio
- 11.13.4. SWOT Analysis
- 11.13.5. Key Strategies and Developments
- 12. Assumptions and Acronyms
- 13. Research Methodology
- 14. Contact
List of Figures
-
- Figure 1: Global Liquid Soap Market Revenue (US$ Mn) Market Share by Type Analysis in 2022
- Figure 2: Global Liquid Soap Market Attractiveness Analysis by Type Analysis, 2016-2032
- Figure 3: Global Liquid Soap Market Revenue (US$ Mn) Market Share by Application Analysisin 2022
- Figure 4: Global Liquid Soap Market Attractiveness Analysis by Application Analysis, 2016-2032
- Figure 5: Global Liquid Soap Market Revenue (US$ Mn) Market Share by Distribution Channel Analysisin 2022
- Figure 6: Global Liquid Soap Market Attractiveness Analysis by Distribution Channel Analysis, 2016-2032
- Figure 7: Global Liquid Soap Market Revenue (US$ Mn) Market Share by Region in 2022
- Figure 8: Global Liquid Soap Market Attractiveness Analysis by Region, 2016-2032
- Figure 9: Global Liquid Soap Market Revenue (US$ Mn) (2016-2032)
- Figure 10: Global Liquid Soap Market Revenue (US$ Mn) Comparison by Region (2016-2032)
- Figure 11: Global Liquid Soap Market Revenue (US$ Mn) Comparison by Type Analysis (2016-2032)
- Figure 12: Global Liquid Soap Market Revenue (US$ Mn) Comparison by Application Analysis (2016-2032)
- Figure 13: Global Liquid Soap Market Revenue (US$ Mn) Comparison by Distribution Channel Analysis (2016-2032)
- Figure 14: Global Liquid Soap Market Y-o-Y Growth Rate Comparison by Region (2016-2032)
- Figure 15: Global Liquid Soap Market Y-o-Y Growth Rate Comparison by Type Analysis (2016-2032)
- Figure 16: Global Liquid Soap Market Y-o-Y Growth Rate Comparison by Application Analysis (2016-2032)
- Figure 17: Global Liquid Soap Market Y-o-Y Growth Rate Comparison by Distribution Channel Analysis (2016-2032)
- Figure 18: Global Liquid Soap Market Share Comparison by Region (2016-2032)
- Figure 19: Global Liquid Soap Market Share Comparison by Type Analysis (2016-2032)
- Figure 20: Global Liquid Soap Market Share Comparison by Application Analysis (2016-2032)
- Figure 21: Global Liquid Soap Market Share Comparison by Distribution Channel Analysis (2016-2032)
- Figure 22: North America Liquid Soap Market Revenue (US$ Mn) Market Share by Type Analysisin 2022
- Figure 23: North America Liquid Soap Market Attractiveness Analysis by Type Analysis, 2016-2032
- Figure 24: North America Liquid Soap Market Revenue (US$ Mn) Market Share by Application Analysisin 2022
- Figure 25: North America Liquid Soap Market Attractiveness Analysis by Application Analysis, 2016-2032
- Figure 26: North America Liquid Soap Market Revenue (US$ Mn) Market Share by Distribution Channel Analysisin 2022
- Figure 27: North America Liquid Soap Market Attractiveness Analysis by Distribution Channel Analysis, 2016-2032
- Figure 28: North America Liquid Soap Market Revenue (US$ Mn) Market Share by Country in 2022
- Figure 29: North America Liquid Soap Market Attractiveness Analysis by Country, 2016-2032
- Figure 30: North America Liquid Soap Market Revenue (US$ Mn) (2016-2032)
- Figure 31: North America Liquid Soap Market Revenue (US$ Mn) Comparison by Country (2016-2032)
- Figure 32: North America Liquid Soap Market Revenue (US$ Mn) Comparison by Type Analysis (2016-2032)
- Figure 33: North America Liquid Soap Market Revenue (US$ Mn) Comparison by Application Analysis (2016-2032)
- Figure 34: North America Liquid Soap Market Revenue (US$ Mn) Comparison by Distribution Channel Analysis (2016-2032)
- Figure 35: North America Liquid Soap Market Y-o-Y Growth Rate Comparison by Country (2016-2032)
- Figure 36: North America Liquid Soap Market Y-o-Y Growth Rate Comparison by Type Analysis (2016-2032)
- Figure 37: North America Liquid Soap Market Y-o-Y Growth Rate Comparison by Application Analysis (2016-2032)
- Figure 38: North America Liquid Soap Market Y-o-Y Growth Rate Comparison by Distribution Channel Analysis (2016-2032)
- Figure 39: North America Liquid Soap Market Share Comparison by Country (2016-2032)
- Figure 40: North America Liquid Soap Market Share Comparison by Type Analysis (2016-2032)
- Figure 41: North America Liquid Soap Market Share Comparison by Application Analysis (2016-2032)
- Figure 42: North America Liquid Soap Market Share Comparison by Distribution Channel Analysis (2016-2032)
- Figure 43: Western Europe Liquid Soap Market Revenue (US$ Mn) Market Share by Type Analysisin 2022
- Figure 44: Western Europe Liquid Soap Market Attractiveness Analysis by Type Analysis, 2016-2032
- Figure 45: Western Europe Liquid Soap Market Revenue (US$ Mn) Market Share by Application Analysisin 2022
- Figure 46: Western Europe Liquid Soap Market Attractiveness Analysis by Application Analysis, 2016-2032
- Figure 47: Western Europe Liquid Soap Market Revenue (US$ Mn) Market Share by Distribution Channel Analysisin 2022
- Figure 48: Western Europe Liquid Soap Market Attractiveness Analysis by Distribution Channel Analysis, 2016-2032
- Figure 49: Western Europe Liquid Soap Market Revenue (US$ Mn) Market Share by Country in 2022
- Figure 50: Western Europe Liquid Soap Market Attractiveness Analysis by Country, 2016-2032
- Figure 51: Western Europe Liquid Soap Market Revenue (US$ Mn) (2016-2032)
- Figure 52: Western Europe Liquid Soap Market Revenue (US$ Mn) Comparison by Country (2016-2032)
- Figure 53: Western Europe Liquid Soap Market Revenue (US$ Mn) Comparison by Type Analysis (2016-2032)
- Figure 54: Western Europe Liquid Soap Market Revenue (US$ Mn) Comparison by Application Analysis (2016-2032)
- Figure 55: Western Europe Liquid Soap Market Revenue (US$ Mn) Comparison by Distribution Channel Analysis (2016-2032)
- Figure 56: Western Europe Liquid Soap Market Y-o-Y Growth Rate Comparison by Country (2016-2032)
- Figure 57: Western Europe Liquid Soap Market Y-o-Y Growth Rate Comparison by Type Analysis (2016-2032)
- Figure 58: Western Europe Liquid Soap Market Y-o-Y Growth Rate Comparison by Application Analysis (2016-2032)
- Figure 59: Western Europe Liquid Soap Market Y-o-Y Growth Rate Comparison by Distribution Channel Analysis (2016-2032)
- Figure 60: Western Europe Liquid Soap Market Share Comparison by Country (2016-2032)
- Figure 61: Western Europe Liquid Soap Market Share Comparison by Type Analysis (2016-2032)
- Figure 62: Western Europe Liquid Soap Market Share Comparison by Application Analysis (2016-2032)
- Figure 63: Western Europe Liquid Soap Market Share Comparison by Distribution Channel Analysis (2016-2032)
- Figure 64: Eastern Europe Liquid Soap Market Revenue (US$ Mn) Market Share by Type Analysisin 2022
- Figure 65: Eastern Europe Liquid Soap Market Attractiveness Analysis by Type Analysis, 2016-2032
- Figure 66: Eastern Europe Liquid Soap Market Revenue (US$ Mn) Market Share by Application Analysisin 2022
- Figure 67: Eastern Europe Liquid Soap Market Attractiveness Analysis by Application Analysis, 2016-2032
- Figure 68: Eastern Europe Liquid Soap Market Revenue (US$ Mn) Market Share by Distribution Channel Analysisin 2022
- Figure 69: Eastern Europe Liquid Soap Market Attractiveness Analysis by Distribution Channel Analysis, 2016-2032
- Figure 70: Eastern Europe Liquid Soap Market Revenue (US$ Mn) Market Share by Country in 2022
- Figure 71: Eastern Europe Liquid Soap Market Attractiveness Analysis by Country, 2016-2032
- Figure 72: Eastern Europe Liquid Soap Market Revenue (US$ Mn) (2016-2032)
- Figure 73: Eastern Europe Liquid Soap Market Revenue (US$ Mn) Comparison by Country (2016-2032)
- Figure 74: Eastern Europe Liquid Soap Market Revenue (US$ Mn) Comparison by Type Analysis (2016-2032)
- Figure 75: Eastern Europe Liquid Soap Market Revenue (US$ Mn) Comparison by Application Analysis (2016-2032)
- Figure 76: Eastern Europe Liquid Soap Market Revenue (US$ Mn) Comparison by Distribution Channel Analysis (2016-2032)
- Figure 77: Eastern Europe Liquid Soap Market Y-o-Y Growth Rate Comparison by Country (2016-2032)
- Figure 78: Eastern Europe Liquid Soap Market Y-o-Y Growth Rate Comparison by Type Analysis (2016-2032)
- Figure 79: Eastern Europe Liquid Soap Market Y-o-Y Growth Rate Comparison by Application Analysis (2016-2032)
- Figure 80: Eastern Europe Liquid Soap Market Y-o-Y Growth Rate Comparison by Distribution Channel Analysis (2016-2032)
- Figure 81: Eastern Europe Liquid Soap Market Share Comparison by Country (2016-2032)
- Figure 82: Eastern Europe Liquid Soap Market Share Comparison by Type Analysis (2016-2032)
- Figure 83: Eastern Europe Liquid Soap Market Share Comparison by Application Analysis (2016-2032)
- Figure 84: Eastern Europe Liquid Soap Market Share Comparison by Distribution Channel Analysis (2016-2032)
- Figure 85: APAC Liquid Soap Market Revenue (US$ Mn) Market Share by Type Analysisin 2022
- Figure 86: APAC Liquid Soap Market Attractiveness Analysis by Type Analysis, 2016-2032
- Figure 87: APAC Liquid Soap Market Revenue (US$ Mn) Market Share by Application Analysisin 2022
- Figure 88: APAC Liquid Soap Market Attractiveness Analysis by Application Analysis, 2016-2032
- Figure 89: APAC Liquid Soap Market Revenue (US$ Mn) Market Share by Distribution Channel Analysisin 2022
- Figure 90: APAC Liquid Soap Market Attractiveness Analysis by Distribution Channel Analysis, 2016-2032
- Figure 91: APAC Liquid Soap Market Revenue (US$ Mn) Market Share by Country in 2022
- Figure 92: APAC Liquid Soap Market Attractiveness Analysis by Country, 2016-2032
- Figure 93: APAC Liquid Soap Market Revenue (US$ Mn) (2016-2032)
- Figure 94: APAC Liquid Soap Market Revenue (US$ Mn) Comparison by Country (2016-2032)
- Figure 95: APAC Liquid Soap Market Revenue (US$ Mn) Comparison by Type Analysis (2016-2032)
- Figure 96: APAC Liquid Soap Market Revenue (US$ Mn) Comparison by Application Analysis (2016-2032)
- Figure 97: APAC Liquid Soap Market Revenue (US$ Mn) Comparison by Distribution Channel Analysis (2016-2032)
- Figure 98: APAC Liquid Soap Market Y-o-Y Growth Rate Comparison by Country (2016-2032)
- Figure 99: APAC Liquid Soap Market Y-o-Y Growth Rate Comparison by Type Analysis (2016-2032)
- Figure 100: APAC Liquid Soap Market Y-o-Y Growth Rate Comparison by Application Analysis (2016-2032)
- Figure 101: APAC Liquid Soap Market Y-o-Y Growth Rate Comparison by Distribution Channel Analysis (2016-2032)
- Figure 102: APAC Liquid Soap Market Share Comparison by Country (2016-2032)
- Figure 103: APAC Liquid Soap Market Share Comparison by Type Analysis (2016-2032)
- Figure 104: APAC Liquid Soap Market Share Comparison by Application Analysis (2016-2032)
- Figure 105: APAC Liquid Soap Market Share Comparison by Distribution Channel Analysis (2016-2032)
- Figure 106: Latin America Liquid Soap Market Revenue (US$ Mn) Market Share by Type Analysisin 2022
- Figure 107: Latin America Liquid Soap Market Attractiveness Analysis by Type Analysis, 2016-2032
- Figure 108: Latin America Liquid Soap Market Revenue (US$ Mn) Market Share by Application Analysisin 2022
- Figure 109: Latin America Liquid Soap Market Attractiveness Analysis by Application Analysis, 2016-2032
- Figure 110: Latin America Liquid Soap Market Revenue (US$ Mn) Market Share by Distribution Channel Analysisin 2022
- Figure 111: Latin America Liquid Soap Market Attractiveness Analysis by Distribution Channel Analysis, 2016-2032
- Figure 112: Latin America Liquid Soap Market Revenue (US$ Mn) Market Share by Country in 2022
- Figure 113: Latin America Liquid Soap Market Attractiveness Analysis by Country, 2016-2032
- Figure 114: Latin America Liquid Soap Market Revenue (US$ Mn) (2016-2032)
- Figure 115: Latin America Liquid Soap Market Revenue (US$ Mn) Comparison by Country (2016-2032)
- Figure 116: Latin America Liquid Soap Market Revenue (US$ Mn) Comparison by Type Analysis (2016-2032)
- Figure 117: Latin America Liquid Soap Market Revenue (US$ Mn) Comparison by Application Analysis (2016-2032)
- Figure 118: Latin America Liquid Soap Market Revenue (US$ Mn) Comparison by Distribution Channel Analysis (2016-2032)
- Figure 119: Latin America Liquid Soap Market Y-o-Y Growth Rate Comparison by Country (2016-2032)
- Figure 120: Latin America Liquid Soap Market Y-o-Y Growth Rate Comparison by Type Analysis (2016-2032)
- Figure 121: Latin America Liquid Soap Market Y-o-Y Growth Rate Comparison by Application Analysis (2016-2032)
- Figure 122: Latin America Liquid Soap Market Y-o-Y Growth Rate Comparison by Distribution Channel Analysis (2016-2032)
- Figure 123: Latin America Liquid Soap Market Share Comparison by Country (2016-2032)
- Figure 124: Latin America Liquid Soap Market Share Comparison by Type Analysis (2016-2032)
- Figure 125: Latin America Liquid Soap Market Share Comparison by Application Analysis (2016-2032)
- Figure 126: Latin America Liquid Soap Market Share Comparison by Distribution Channel Analysis (2016-2032)
- Figure 127: Middle East & Africa Liquid Soap Market Revenue (US$ Mn) Market Share by Type Analysisin 2022
- Figure 128: Middle East & Africa Liquid Soap Market Attractiveness Analysis by Type Analysis, 2016-2032
- Figure 129: Middle East & Africa Liquid Soap Market Revenue (US$ Mn) Market Share by Application Analysisin 2022
- Figure 130: Middle East & Africa Liquid Soap Market Attractiveness Analysis by Application Analysis, 2016-2032
- Figure 131: Middle East & Africa Liquid Soap Market Revenue (US$ Mn) Market Share by Distribution Channel Analysisin 2022
- Figure 132: Middle East & Africa Liquid Soap Market Attractiveness Analysis by Distribution Channel Analysis, 2016-2032
- Figure 133: Middle East & Africa Liquid Soap Market Revenue (US$ Mn) Market Share by Country in 2022
- Figure 134: Middle East & Africa Liquid Soap Market Attractiveness Analysis by Country, 2016-2032
- Figure 135: Middle East & Africa Liquid Soap Market Revenue (US$ Mn) (2016-2032)
- Figure 136: Middle East & Africa Liquid Soap Market Revenue (US$ Mn) Comparison by Country (2016-2032)
- Figure 137: Middle East & Africa Liquid Soap Market Revenue (US$ Mn) Comparison by Type Analysis (2016-2032)
- Figure 138: Middle East & Africa Liquid Soap Market Revenue (US$ Mn) Comparison by Application Analysis (2016-2032)
- Figure 139: Middle East & Africa Liquid Soap Market Revenue (US$ Mn) Comparison by Distribution Channel Analysis (2016-2032)
- Figure 140: Middle East & Africa Liquid Soap Market Y-o-Y Growth Rate Comparison by Country (2016-2032)
- Figure 141: Middle East & Africa Liquid Soap Market Y-o-Y Growth Rate Comparison by Type Analysis (2016-2032)
- Figure 142: Middle East & Africa Liquid Soap Market Y-o-Y Growth Rate Comparison by Application Analysis (2016-2032)
- Figure 143: Middle East & Africa Liquid Soap Market Y-o-Y Growth Rate Comparison by Distribution Channel Analysis (2016-2032)
- Figure 144: Middle East & Africa Liquid Soap Market Share Comparison by Country (2016-2032)
- Figure 145: Middle East & Africa Liquid Soap Market Share Comparison by Type Analysis (2016-2032)
- Figure 146: Middle East & Africa Liquid Soap Market Share Comparison by Application Analysis (2016-2032)
- Figure 147: Middle East & Africa Liquid Soap Market Share Comparison by Distribution Channel Analysis (2016-2032)
List of Tables
- Table 1: Global Liquid Soap Market Comparison by Type Analysis (2016-2032)
- Table 2: Global Liquid Soap Market Comparison by Application Analysis (2016-2032)
- Table 3: Global Liquid Soap Market Comparison by Distribution Channel Analysis (2016-2032)
- Table 4: Global Liquid Soap Market Revenue (US$ Mn) Comparison by Region (2016-2032)
- Table 5: Global Liquid Soap Market Revenue (US$ Mn) (2016-2032)
- Table 6: Global Liquid Soap Market Revenue (US$ Mn) Comparison by Region (2016-2032)
- Table 7: Global Liquid Soap Market Revenue (US$ Mn) Comparison by Type Analysis (2016-2032)
- Table 8: Global Liquid Soap Market Revenue (US$ Mn) Comparison by Application Analysis (2016-2032)
- Table 9: Global Liquid Soap Market Revenue (US$ Mn) Comparison by Distribution Channel Analysis (2016-2032)
- Table 10: Global Liquid Soap Market Y-o-Y Growth Rate Comparison by Region (2016-2032)
- Table 11: Global Liquid Soap Market Y-o-Y Growth Rate Comparison by Type Analysis (2016-2032)
- Table 12: Global Liquid Soap Market Y-o-Y Growth Rate Comparison by Application Analysis (2016-2032)
- Table 13: Global Liquid Soap Market Y-o-Y Growth Rate Comparison by Distribution Channel Analysis (2016-2032)
- Table 14: Global Liquid Soap Market Share Comparison by Region (2016-2032)
- Table 15: Global Liquid Soap Market Share Comparison by Type Analysis (2016-2032)
- Table 16: Global Liquid Soap Market Share Comparison by Application Analysis (2016-2032)
- Table 17: Global Liquid Soap Market Share Comparison by Distribution Channel Analysis (2016-2032)
- Table 18: North America Liquid Soap Market Comparison by Application Analysis (2016-2032)
- Table 19: North America Liquid Soap Market Comparison by Distribution Channel Analysis (2016-2032)
- Table 20: North America Liquid Soap Market Revenue (US$ Mn) Comparison by Country (2016-2032)
- Table 21: North America Liquid Soap Market Revenue (US$ Mn) (2016-2032)
- Table 22: North America Liquid Soap Market Revenue (US$ Mn) Comparison by Country (2016-2032)
- Table 23: North America Liquid Soap Market Revenue (US$ Mn) Comparison by Type Analysis (2016-2032)
- Table 24: North America Liquid Soap Market Revenue (US$ Mn) Comparison by Application Analysis (2016-2032)
- Table 25: North America Liquid Soap Market Revenue (US$ Mn) Comparison by Distribution Channel Analysis (2016-2032)
- Table 26: North America Liquid Soap Market Y-o-Y Growth Rate Comparison by Country (2016-2032)
- Table 27: North America Liquid Soap Market Y-o-Y Growth Rate Comparison by Type Analysis (2016-2032)
- Table 28: North America Liquid Soap Market Y-o-Y Growth Rate Comparison by Application Analysis (2016-2032)
- Table 29: North America Liquid Soap Market Y-o-Y Growth Rate Comparison by Distribution Channel Analysis (2016-2032)
- Table 30: North America Liquid Soap Market Share Comparison by Country (2016-2032)
- Table 31: North America Liquid Soap Market Share Comparison by Type Analysis (2016-2032)
- Table 32: North America Liquid Soap Market Share Comparison by Application Analysis (2016-2032)
- Table 33: North America Liquid Soap Market Share Comparison by Distribution Channel Analysis (2016-2032)
- Table 34: Western Europe Liquid Soap Market Comparison by Type Analysis (2016-2032)
- Table 35: Western Europe Liquid Soap Market Comparison by Application Analysis (2016-2032)
- Table 36: Western Europe Liquid Soap Market Comparison by Distribution Channel Analysis (2016-2032)
- Table 37: Western Europe Liquid Soap Market Revenue (US$ Mn) Comparison by Country (2016-2032)
- Table 38: Western Europe Liquid Soap Market Revenue (US$ Mn) (2016-2032)
- Table 39: Western Europe Liquid Soap Market Revenue (US$ Mn) Comparison by Country (2016-2032)
- Table 40: Western Europe Liquid Soap Market Revenue (US$ Mn) Comparison by Type Analysis (2016-2032)
- Table 41: Western Europe Liquid Soap Market Revenue (US$ Mn) Comparison by Application Analysis (2016-2032)
- Table 42: Western Europe Liquid Soap Market Revenue (US$ Mn) Comparison by Distribution Channel Analysis (2016-2032)
- Table 43: Western Europe Liquid Soap Market Y-o-Y Growth Rate Comparison by Country (2016-2032)
- Table 44: Western Europe Liquid Soap Market Y-o-Y Growth Rate Comparison by Type Analysis (2016-2032)
- Table 45: Western Europe Liquid Soap Market Y-o-Y Growth Rate Comparison by Application Analysis (2016-2032)
- Table 46: Western Europe Liquid Soap Market Y-o-Y Growth Rate Comparison by Distribution Channel Analysis (2016-2032)
- Table 47: Western Europe Liquid Soap Market Share Comparison by Country (2016-2032)
- Table 48: Western Europe Liquid Soap Market Share Comparison by Type Analysis (2016-2032)
- Table 49: Western Europe Liquid Soap Market Share Comparison by Application Analysis (2016-2032)
- Table 50: Western Europe Liquid Soap Market Share Comparison by Distribution Channel Analysis (2016-2032)
- Table 51: Eastern Europe Liquid Soap Market Comparison by Type Analysis (2016-2032)
- Table 52: Eastern Europe Liquid Soap Market Comparison by Application Analysis (2016-2032)
- Table 53: Eastern Europe Liquid Soap Market Comparison by Distribution Channel Analysis (2016-2032)
- Table 54: Eastern Europe Liquid Soap Market Revenue (US$ Mn) Comparison by Country (2016-2032)
- Table 55: Eastern Europe Liquid Soap Market Revenue (US$ Mn) (2016-2032)
- Table 56: Eastern Europe Liquid Soap Market Revenue (US$ Mn) Comparison by Country (2016-2032)
- Table 57: Eastern Europe Liquid Soap Market Revenue (US$ Mn) Comparison by Type Analysis (2016-2032)
- Table 58: Eastern Europe Liquid Soap Market Revenue (US$ Mn) Comparison by Application Analysis (2016-2032)
- Table 59: Eastern Europe Liquid Soap Market Revenue (US$ Mn) Comparison by Distribution Channel Analysis (2016-2032)
- Table 60: Eastern Europe Liquid Soap Market Y-o-Y Growth Rate Comparison by Country (2016-2032)
- Table 61: Eastern Europe Liquid Soap Market Y-o-Y Growth Rate Comparison by Type Analysis (2016-2032)
- Table 62: Eastern Europe Liquid Soap Market Y-o-Y Growth Rate Comparison by Application Analysis (2016-2032)
- Table 63: Eastern Europe Liquid Soap Market Y-o-Y Growth Rate Comparison by Distribution Channel Analysis (2016-2032)
- Table 64: Eastern Europe Liquid Soap Market Share Comparison by Country (2016-2032)
- Table 65: Eastern Europe Liquid Soap Market Share Comparison by Type Analysis (2016-2032)
- Table 66: Eastern Europe Liquid Soap Market Share Comparison by Application Analysis (2016-2032)
- Table 67: Eastern Europe Liquid Soap Market Share Comparison by Distribution Channel Analysis (2016-2032)
- Table 68: APAC Liquid Soap Market Comparison by Type Analysis (2016-2032)
- Table 69: APAC Liquid Soap Market Comparison by Application Analysis (2016-2032)
- Table 70: APAC Liquid Soap Market Comparison by Distribution Channel Analysis (2016-2032)
- Table 71: APAC Liquid Soap Market Revenue (US$ Mn) Comparison by Country (2016-2032)
- Table 72: APAC Liquid Soap Market Revenue (US$ Mn) (2016-2032)
- Table 73: APAC Liquid Soap Market Revenue (US$ Mn) Comparison by Country (2016-2032)
- Table 74: APAC Liquid Soap Market Revenue (US$ Mn) Comparison by Type Analysis (2016-2032)
- Table 75: APAC Liquid Soap Market Revenue (US$ Mn) Comparison by Application Analysis (2016-2032)
- Table 76: APAC Liquid Soap Market Revenue (US$ Mn) Comparison by Distribution Channel Analysis (2016-2032)
- Table 77: APAC Liquid Soap Market Y-o-Y Growth Rate Comparison by Country (2016-2032)
- Table 78: APAC Liquid Soap Market Y-o-Y Growth Rate Comparison by Type Analysis (2016-2032)
- Table 79: APAC Liquid Soap Market Y-o-Y Growth Rate Comparison by Application Analysis (2016-2032)
- Table 80: APAC Liquid Soap Market Y-o-Y Growth Rate Comparison by Distribution Channel Analysis (2016-2032)
- Table 81: APAC Liquid Soap Market Share Comparison by Country (2016-2032)
- Table 82: APAC Liquid Soap Market Share Comparison by Type Analysis (2016-2032)
- Table 83: APAC Liquid Soap Market Share Comparison by Application Analysis (2016-2032)
- Table 84: APAC Liquid Soap Market Share Comparison by Distribution Channel Analysis (2016-2032)
- Table 85: Latin America Liquid Soap Market Comparison by Type Analysis (2016-2032)
- Table 86: Latin America Liquid Soap Market Comparison by Application Analysis (2016-2032)
- Table 87: Latin America Liquid Soap Market Comparison by Distribution Channel Analysis (2016-2032)
- Table 88: Latin America Liquid Soap Market Revenue (US$ Mn) Comparison by Country (2016-2032)
- Table 89: Latin America Liquid Soap Market Revenue (US$ Mn) (2016-2032)
- Table 90: Latin America Liquid Soap Market Revenue (US$ Mn) Comparison by Country (2016-2032)
- Table 91: Latin America Liquid Soap Market Revenue (US$ Mn) Comparison by Type Analysis (2016-2032)
- Table 92: Latin America Liquid Soap Market Revenue (US$ Mn) Comparison by Application Analysis (2016-2032)
- Table 93: Latin America Liquid Soap Market Revenue (US$ Mn) Comparison by Distribution Channel Analysis (2016-2032)
- Table 94: Latin America Liquid Soap Market Y-o-Y Growth Rate Comparison by Country (2016-2032)
- Table 95: Latin America Liquid Soap Market Y-o-Y Growth Rate Comparison by Type Analysis (2016-2032)
- Table 96: Latin America Liquid Soap Market Y-o-Y Growth Rate Comparison by Application Analysis (2016-2032)
- Table 97: Latin America Liquid Soap Market Y-o-Y Growth Rate Comparison by Distribution Channel Analysis (2016-2032)
- Table 98: Latin America Liquid Soap Market Share Comparison by Country (2016-2032)
- Table 99: Latin America Liquid Soap Market Share Comparison by Type Analysis (2016-2032)
- Table 100: Latin America Liquid Soap Market Share Comparison by Application Analysis (2016-2032)
- Table 101: Latin America Liquid Soap Market Share Comparison by Distribution Channel Analysis (2016-2032)
- Table 102: Middle East & Africa Liquid Soap Market Comparison by Type Analysis (2016-2032)
- Table 103: Middle East & Africa Liquid Soap Market Comparison by Application Analysis (2016-2032)
- Table 104: Middle East & Africa Liquid Soap Market Comparison by Distribution Channel Analysis (2016-2032)
- Table 105: Middle East & Africa Liquid Soap Market Revenue (US$ Mn) Comparison by Country (2016-2032)
- Table 106: Middle East & Africa Liquid Soap Market Revenue (US$ Mn) (2016-2032)
- Table 107: Middle East & Africa Liquid Soap Market Revenue (US$ Mn) Comparison by Country (2016-2032)
- Table 108: Middle East & Africa Liquid Soap Market Revenue (US$ Mn) Comparison by Type Analysis (2016-2032)
- Table 109: Middle East & Africa Liquid Soap Market Revenue (US$ Mn) Comparison by Application Analysis (2016-2032)
- Table 110: Middle East & Africa Liquid Soap Market Revenue (US$ Mn) Comparison by Distribution Channel Analysis (2016-2032)
- Table 111: Middle East & Africa Liquid Soap Market Y-o-Y Growth Rate Comparison by Country (2016-2032)
- Table 112: Middle East & Africa Liquid Soap Market Y-o-Y Growth Rate Comparison by Type Analysis (2016-2032)
- Table 113: Middle East & Africa Liquid Soap Market Y-o-Y Growth Rate Comparison by Application Analysis (2016-2032)
- Table 114: Middle East & Africa Liquid Soap Market Y-o-Y Growth Rate Comparison by Distribution Channel Analysis (2016-2032)
- Table 115: Middle East & Africa Liquid Soap Market Share Comparison by Country (2016-2032)
- Table 116: Middle East & Africa Liquid Soap Market Share Comparison by Type Analysis (2016-2032)
- Table 117: Middle East & Africa Liquid Soap Market Share Comparison by Application Analysis (2016-2032)
- Table 118: Middle East & Africa Liquid Soap Market Share Comparison by Distribution Channel Analysis (2016-2032)
- 1. Executive Summary
-
- Premier English Manufacturing Ltd.
- Procter & Gamble
- Unilever
- Cleenol Group Ltd.
- Christina May Ltd.
- Reckitt Benckiser Group plc
- GlaxoSmithKline
- Unilever
- LES ROBINETS PRESTO S.A.
- Colgate-Palmolive Company
- Henkel Corporation
Our Clients


View Our Licence Options
