
Global Liquid Nitrogen Market By Production Process Analysis (Cryogenic Distillation, Pressure Swing Adsorption), By End-User Industry Analysis (Healthcare, Chemicals & Pharmaceuticals, Food & Beverage, Others), By Region And Companies - Industry Segment Outlook, Market Assessment, Competition Scenario, Trends, And Forecast 2023-2032
-
6631
-
May 2023
-
155
-


-
This report was compiled by Shreyas Rokade Shreyas Rokade is a seasoned Research Analyst with CMFE, bringing extensive expertise in market research and consulting, with a strong background in Chemical Engineering. Correspondence Team Lead-CMFE Linkedin | Detailed Market research Methodology Our methodology involves a mix of primary research, including interviews with leading mental health experts, and secondary research from reputable medical journals and databases. View Detailed Methodology Page
-
Quick Navigation
Report Overview
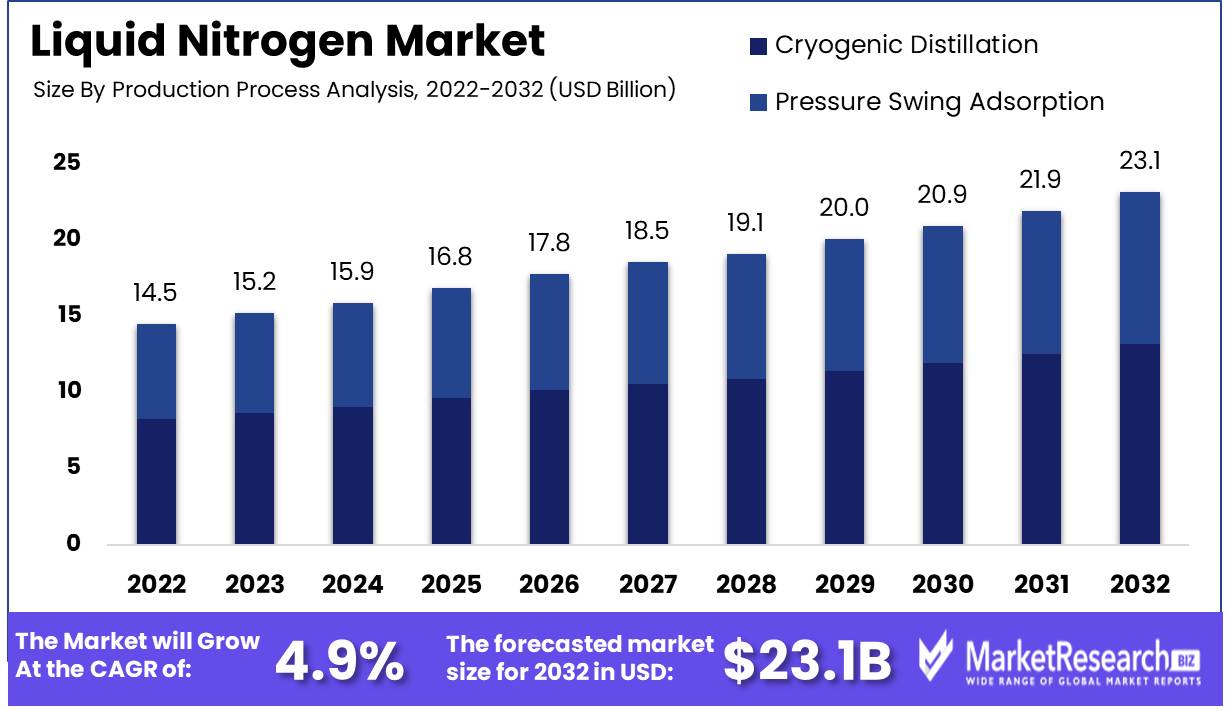
Global Liquid Nitrogen Market size is expected to be worth around USD 23.5 Bn by 2032 from USD 14.5 Bn in 2022, growing at a CAGR of 4.9% during the forecast period from 2023 to 2032.
Generating any discernible indications of slowing down, the liquid nitrogen market, an industry characterized by rapid growth and unyielding momentum, continues to advance. In this exhaustive analysis, we will examine the many facets of liquid nitrogen, including its definitive essence, unwavering significance, and numerous benefits. In addition, we will delve into the realm of groundbreaking innovations and remarkable advancements that have irrevocably shaped this field.
Immersing ourselves in the realm of liquid nitrogen, we come across a colorless, odorless, non-combustible, and extremely frigid substance that has won over an array of industries, including culinary, medical, and aerospace. Indeed, the use of liquid nitrogen has yielded a vast array of advantages, most notably its unparalleled speed in freezing products, its commendable cost-effectiveness, and its effortless application.
Within the extensive tapestry of the liquid nitrogen market, a multitude of extraordinary innovations have captured the collective imagination. The revolutionary use of liquid nitrogen in the production of ice cream, for instance, has completely transformed the ice cream industry, eliminating the need for expensive apparatus and enabling the instantaneous production of this delectable frozen treat. Liquid nitrogen has found a purpose in the innovative realm of the cryotherapy market, where it plays a crucial role in the cryogenic eradication of cancerous cells. This is another significant advancement in the medical field.
The liquid nitrogen market is soaring to unprecedented heights, bolstered by a multitude of businesses making sizeable investments in the expectation of exponential growth and enormous returns. Recognizing the market's vast potential, these enterprising entities have seamlessly integrated liquid nitrogen into their array of products and services. Notable manifestations include the incorporation of liquid nitrogen into the realm of patisserie, which imparts an ethereal quality to the creation of cakes and the art of cocktails.
Unveiling the enthralling story of the growth of the liquid nitrogen market reveals an intricate tapestry woven by its diverse implementations across a variety of industries, including but not limited to the food and beverage, healthcare, and aerospace sectors. Among the numerous applications for which liquid nitrogen is indispensable are cryotherapy, the preservation of perishable foods, and the temperature regulation of complex electronic components.
The liquid nitrogen market transcends the confines of a single industry, attracting the attention of a wide array of sectors. Undoubtedly, a number of stakeholders, including those from the food industry, the medical community, and the aerospace realm, have shown interest in and invested in this burgeoning industry.
The skyrocketing demand for chilled foods, coupled with the introduction of liquid nitrogen-powered medical procedures, is an indisputable factor driving the liquid nitrogen market to new heights of prosperity. Concurrently, the increased use of liquid nitrogen in the electronics industry propels the market's relentless expansion, constituting an undeniable driving force behind its unparalleled growth trajectory.
Driving factors
Significant Growth in the Liquid Nitrogen Market is Driven by Growing Applications in Healthcare and Beyond:
The global market for liquid nitrogen is anticipated to experience significant growth in the coming years, primarily as a result of a broad variety of applications in numerous industries. The healthcare industry makes extensive use of liquid nitrogen for cryotherapy and other medical applications. Cryotherapy is a swiftly growing trend for treating a variety of health conditions, and liquid nitrogen is a crucial component of this procedure.
Demand for Liquid Nitrogen in Freezing and Cooling Applications is Driven by the Food and Beverage Industry:
The food and beverage industry has contributed significantly to the growth of the liquid nitrogen market. The industry's rising demand for freezing and cooling applications has substantially increased the demand for liquid nitrogen. In addition, the electronics industry has been a significant liquid nitrogen consumer. The demand for liquid nitrogen is anticipated to increase due to the growing need for cooling and cleaning applications in the industrial sector.
With Welding and Cryogenic Treatment, the Automotive and Metal Fabrication Industries Boost the Liquid Nitrogen Market:
Additionally, the automotive industry has been utilizing liquid nitrogen for welding and cutting. This trend is anticipated to continue to expand, contributing to the growth of the market. In addition, the metal fabrication industry has utilized liquid nitrogen for chilling and cryogenic treatment purposes. The oil and gas industry has also been a significant consumer of liquid nitrogen, using it primarily for enhanced hydrocarbon recovery and fracking.
Transportation and Logistics Sector Adopts Liquid Nitrogen as a Refrigerant, Boosting Market:
In the transportation and logistics industry, liquid nitrogen is also used as a refrigerant, which further contributes to market growth. The chemical and pharmaceutical industries have also seen a growing demand for liquid nitrogen, and it is anticipated that this trend will continue to drive market growth.
Demand for liquid nitrogen is driven by the chemical, pharmaceutical, and cosmetics industries:
Furthermore, the cosmetics market and personal care industry have recently witnessed a rise in demand for cryogenic skin treatments utilizing liquid nitrogen. In addition, the aerospace industry has been a significant consumer of liquid nitrogen, predominantly for rocket fuel and other uses.
Expanding Market Opportunities Aerospace Industry Depends on Liquid Nitrogen for Rocket Fuel and Beyond:
The rising demand for liquid nitrogen has resulted in a number of prospective changes to market-affecting regulations. In addition, emerging technologies such as additive manufacturing may have a positive impact on the liquid nitrogen market in the future. However, the competitive landscape of the liquid nitrogen market could be impacted by a number of factors. The emergence of alternative technologies, for instance, could pose a threat to the growth of the market.
Restraining Factors
Limiting Factors of the Liquid Nitrogen Market
As demand for refrigeration in the food industry and medical fields continues to rise, the market for liquid nitrogen has experienced unprecedented growth. However, the market is not devoid of its own restrictions. This report examines the factors restraining the growth of the liquid nitrogen market, including the high production and transportation costs, the hazardous nature of liquid nitrogen handling and storage, the availability of alternative cooling and freezing solutions, the stringent regulations and safety standards associated with the use of liquid nitrogen, and the limited availability of liquid nitrogen in some regions.
High Costs Related to Production and Transport
The costly production and transportation costs of liquid nitrogen are one of the primary factors that limit its market growth. Large-scale liquid nitrogen production necessitates extensive infrastructure and high energy consumption, resulting in high production costs.
Alternative Cooling and Freezing Solutions
Although liquid nitrogen is an efficient coolant with numerous industrial applications, it is not the only option. There are alternative chilling and freezing solutions, such as dry ice, that can be effective in specific circumstances. In certain applications, the availability of such substitute solutions can pose a threat to the growth of the liquid nitrogen market. Cryocooler technology revolutionizes the Liquid Nitrogen Market, efficiently maintaining low temperatures for various applications, enhancing productivity and versatility
Production Process Analysis
The liquid nitrogen market is dominated by the cryogenic distillation segment, which holds a substantial market share. The separation of gases at exceptionally low temperatures is a highly specialized process known as cryogenic distillation. In this process, the air is compressed and chilled, and the various components, such as nitrogen, oxygen, and argon, are separated according to their respective boiling points.
The growth of emerging economies is propelling the liquid nitrogen market segment for cryogenic distillation. The increased adoption of cryogenic distillation for the production of nitrogen gas in these economies is attributable to the rising demand for healthcare and culinary products.
Additionally, consumer trends and behavior toward the segment of cryogenic distillation are evolving. Due to its extensive applicability in numerous end-user industries, demand for nitrogen gas is increasing. Consumers are becoming increasingly aware of the benefits of using high-purity nitrogen gas, including its ability to preserve product quality, prolong expiration life, and reduce the risk of contamination.
In the coming years, the cryogenic distillation segment of the liquid nitrogen market is anticipated to record the highest growth rate. One of the primary drivers of this growth is the increasing demand for liquid nitrogen in the healthcare industry.
End-User Industry Analysis
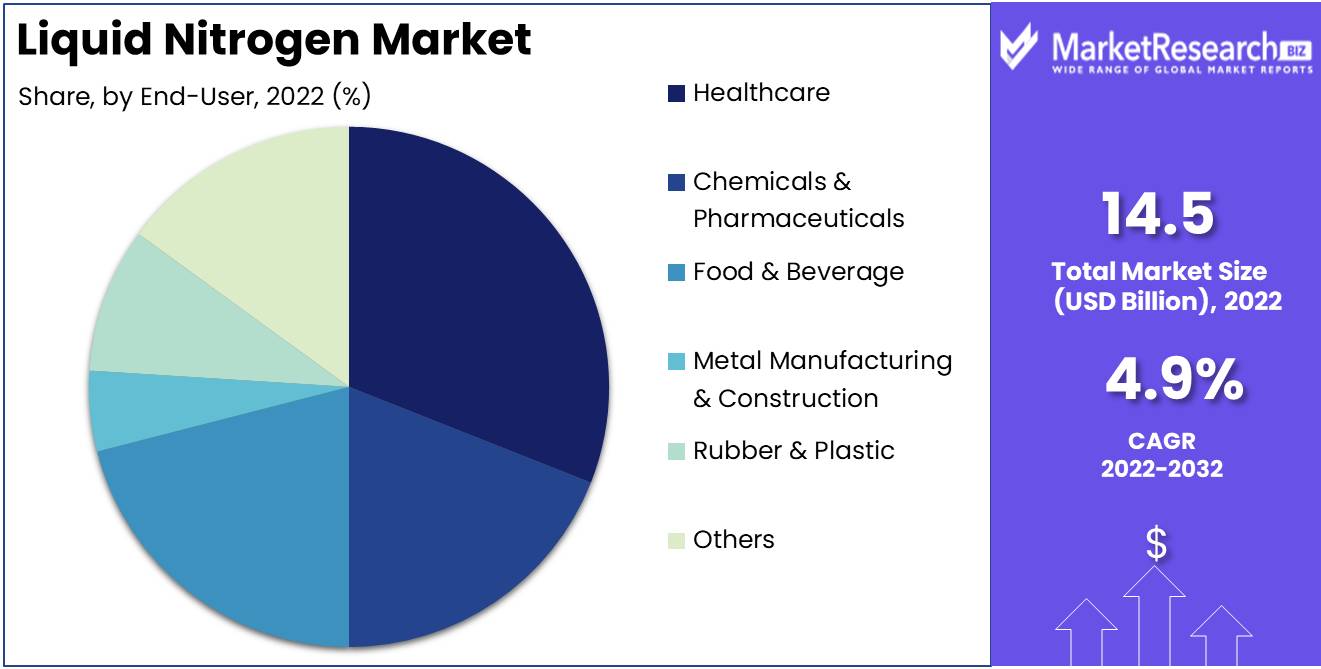
With a significant market share, the healthcare segment dominates the liquid nitrogen market. In the healthcare industry, liquid nitrogen is commonly used to store and convey biological samples, vaccines, and other low-temperature-sensitive medical products. The increasing demand for organ transplants is also propelling the healthcare industry's adoption of liquid nitrogen.
The economic growth of emerging economies is propelling the liquid nitrogen market's healthcare segment adoption. These economies have experienced an increase in demand for healthcare products and services due to their expanding populations and increasing rates of chronic diseases.
The healthcare segment's consumer trends and behavior are also evolving. Consumers are becoming increasingly aware of the benefits of using products that are stored and transported in a low-temperature environment as the demand for high-quality healthcare products and services increases.
In the future years, the healthcare segment of the liquid nitrogen market is anticipated to record the highest growth rate. The increasing demand for organ transplantation, pharmaceuticals, and medical equipment is one of the primary factors driving the segment's growth.
Key Market Segments
By Production Process Analysis
- Cryogenic Distillation
- Pressure Swing Adsorption
By End-User Industry Analysis
- Healthcare
- Chemicals & Pharmaceuticals
- Food & Beverage
- Metal Manufacturing & Construction
- Rubber & Plastic
- Others (Electronics and Energy)
Growth Opportunity
Emerging Economies Drive Liquid Nitrogen Market Demand:
Potential for growth in the liquid nitrogen market due to Opportunity: In emerging economies such as China, India, and Brazil, the demand for liquid nitrogen is increasing. Increasing use of liquid nitrogen for cryotherapy and other medical applications in the healthcare industry growing demand for liquid nitrogen for chilling and cooling applications in the food and beverage industry technology advancements that result in enhanced production processes and more efficient storage and transportation options.
The market for Liquid Nitrogen Booms Due to Increasing Healthcare and Food Industry Applications:
Due to a number of factors, including the rising demand in emerging economies such as China, India, and Brazil, the market for liquid nitrogen has experienced rapid growth in recent years. The healthcare industry is also a significant contributor to the growth of the liquid nitrogen market, as more and more medical applications employ cryotherapy utilizing liquid nitrogen.
China, India, and Brazil Drive the Expansion of the Liquid Nitrogen Market:
Emerging economies, including China, India, and Brazil, are the primary market drivers for liquid nitrogen. These nations have experienced significant industrialization growth, which has positively impacted the liquid nitrogen market. China is the world's largest liquid nitrogen producer and consumer, and this trend is anticipated to continue in the coming years.
The Healthcare Industry Benefits Considerably from Cryotherapy:
Cryotherapy is a medical technique that employs extremely low temperatures to treat a variety of skin conditions, including warts, moles, and lesions. Due to its ability to maintain low temperatures for an extended period, liquid nitrogen is extensively used in this process. The increasing demand for cryotherapy treatments has fueled the growth of the liquid nitrogen market.
Liquid Nitrogen is utilized by the Food and Beverage Industry for Freezing and Cooling:
In the food and beverage industry, liquid nitrogen has become an essential ingredient for chilling and cooling applications. This procedure assists in preserving the integrity of food and beverage products. For various purposes, including the freezing of confectionery and cocktails and the production of dry ice, high-end restaurants, and beverage manufacturers have been using liquid nitrogen.
Technology Leads to Improved Transportation and Production:
Technology advancements have significantly contributed to the growth of the liquid nitrogen market by introducing new production methods and more efficient storage and transport solutions. Manufacturers have adopted new techniques, such as cryogenic distillation, to produce large quantities of liquid nitrogen.
Latest Trends
The Increasing use of Liquid Nitrogen for Innovative Culinary Applications in the Food and Beverage Industry:
In the food and beverage industry, liquid nitrogen has become a popular instrument for producing innovative dishes and beverages that impress consumers. Flash-freezing ingredients, such as fruits and herbs, with liquid nitrogen produces intense flavors and textures that cannot be accomplished with conventional cooking methods.
The use of liquid nitrogen in cookery is known as molecular gastronomy, and it has become an international trend among foodies. Everything from ice creams and sorbets to cocktails and desserts can be made with liquid nitrogen; the possibilities are infinite.
The Increasing Demand for Cryogenic Skin Treatments in the Cosmetics and Personal Care Sector:
In recent years, cryogenic skin treatments have become increasingly prevalent in the cosmetics and personal care industries. In these treatments, liquid nitrogen is used to stimulate collagen production, reduce inflammation, and promote healthier, more youthful-looking skin.
Cryotherapy has been shown to be an effective treatment for acne, eczema, and psoriasis, among other skin conditions. As a consequence, it has become a popular treatment at spas and wellness centers around the globe.
The Increasing Adoption of Liquid Nitrogen for Welding and Cutting Applications in the Automotive Industry:
The use of liquid nitrogen as an alternative to conventional welding and cutting techniques is increasing in the automotive industry. This industry uses liquid nitrogen to create precise cuts and spotless welds, resulting in a higher-quality finish and less waste.
The Increasing Demand for Liquid Nitrogen in Fracking Applications in the Oil and Gas Industry:
In the oil and gas industry, liquid nitrogen is used in hydraulic fracturing, also known as fracking. Liquid nitrogen is utilized to cool the gases produced during fracking, thereby decreasing the danger of explosion and increasing the process's efficiency.
Fracking has become an essential technique for extracting oil and gas from shale formations, and the use of liquid nitrogen has become an integral part of this process.
The Increasing Use of Liquid Nitrogen for Rocket Fuel and Other Applications in the Aerospace Industry:
The aerospace industry uses liquid nitrogen for a variety of purposes, including rocket propellant and cryogenic storage. Because it can be stored at extremely low temperatures, liquid nitrogen is a popular choice for rocket propellant due to its efficiency.
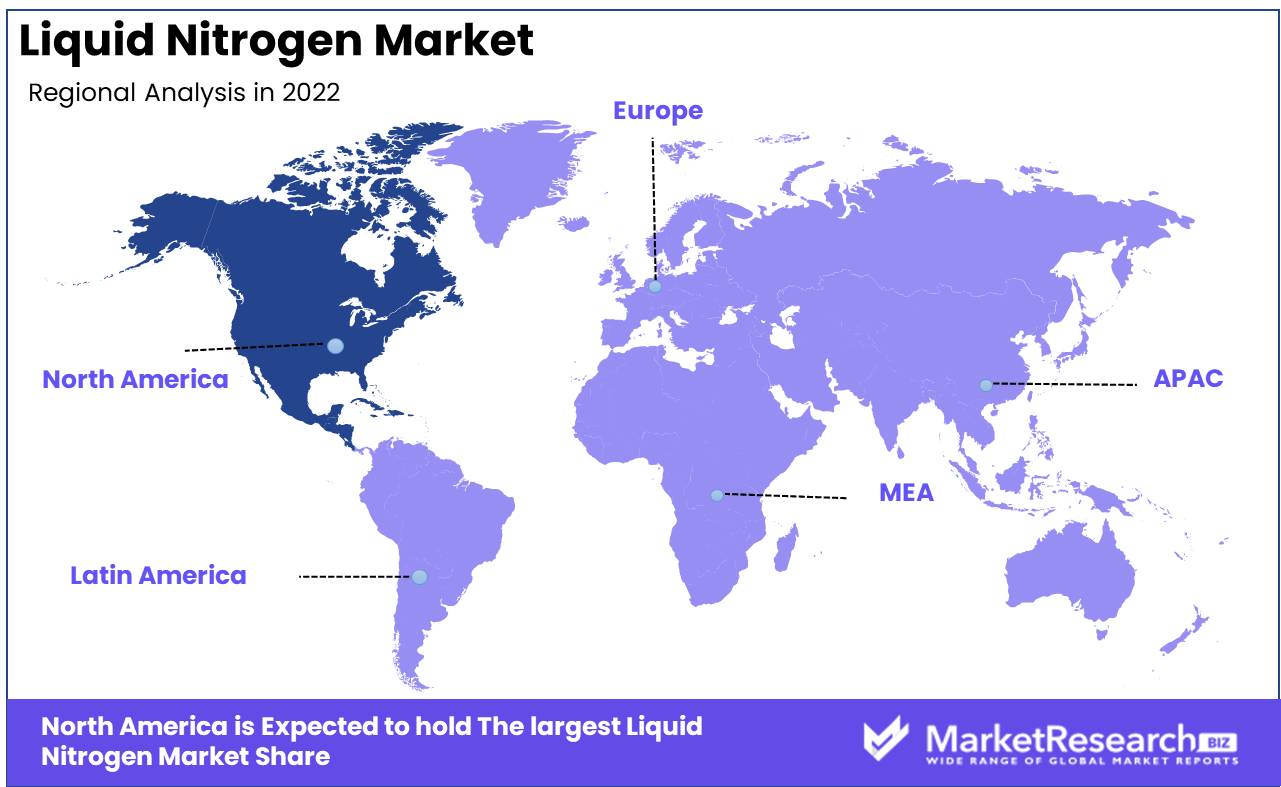
Regional Analysis
Liquid nitrogen is a versatile and widely-applied industrial gas with a broad range of applications in a variety of industries. It is especially popular in North America, which has become the largest market for liquid nitrogen as a result of the presence of significant end-user industries such as healthcare, food and beverage, and electronics.
One of the primary reasons for liquid nitrogen's popularity in North America is its low boiling point, which enables it to freeze and preserve a wide range of products very effectively. In the food and beverage industry, for example, it is used to preserve and freeze meats, fruits, and vegetables.
Additionally contributing to liquid nitrogen's popularity in North America is its ability to generate a clean and sterile environment. It can also be used to sterilize medical equipment and other products that must be kept free of bacteria and pathogens.
In order to improve oil recovery from aging wells, liquid nitrogen is becoming increasingly popular in the oil and gas industry. By injecting liquid nitrogen into the well, the viscosity of the crude oil is reduced, making its extraction simpler. This can considerably improve the longevity of wells and the efficiency of oil recovery.
Key Regions and Countries
North America
- US
- Canada
- Mexico
Western Europe
- Germany
- France
- The UK
- Spain
- Italy
- Portugal
- Ireland
- Austria
- Switzerland
- Benelux
- Nordic
- Rest of Western Europe
Eastern Europe
- Russia
- Poland
- The Czech Republic
- Greece
- Rest of Eastern Europe
APAC
- China
- Japan
- South Korea
- India
- Australia & New Zealand
- Indonesia
- Malaysia
- Philippines
- Singapore
- Thailand
- Vietnam
- Rest of APAC
Latin America
- Brazil
- Colombia
- Chile
- Argentina
- Costa Rica
- Rest of Latin America
Middle East & Africa
- Algeria
- Egypt
- Israel
- Kuwait
- Nigeria
- Saudi Arabia
- South Africa
- Turkey
- United Arab Emirates
- Rest of MEA
Key Players Analysis
The demand for numerous medical, industrial, and food applications is driving the rapid growth of the liquid nitrogen market. Liquid nitrogen is a colorless, non-toxic, and non-combustible cryogenic fluid used for a variety of applications, including the freezing of food, cryogenic operations, and the cryopreservation of biological specimens.
Linde AG, Air Products and Chemicals, Inc., Praxair Technology, Inc., Air Liquide S.A., Taiyo Nippon Sanso Corporation, Messer Group GmbH, Gulf Cryo, Emirates Industrial Gases Co. LLC, Southern Industrial Gas Sdn Bhd, and SOL Group are some of the key players in the liquid nitrogen market.
Linde AG is one of the primary players in the liquid nitrogen market, providing a vast array of products including liquid nitrogen, nitrogen gas, and other cryogenic gases. The company has operations in more than 100 countries and a diverse customer base, which includes healthcare facilities, food processors, and electronic manufacturers.
In general, the liquid nitrogen market is extremely competitive, with a large number of global players operating in the industry. These companies are concentrated on expanding their geographic presence, developing new liquid nitrogen applications, and investing in R&D to drive market innovation.
Top Key Players in Liquid Nitrogen Market
- The Linde Group
- Refrigeration & Oxygen Company Limited
- Air Liquide
- Gulf Cryo
- Air Products and Chemicals, Inc.
- Messer Group GmbH
- SOUTHERN INDUSTRIAL GAS SDN. BHD.
- TAIYO NIPPON SANSO CORPORATION
- Asia Technical Gas Co Pte Ltd
- BUZWAIR INDUSTRIAL GASES FACTORIES
Recent Development
- In 2023, Efforts to enhance the storage and transportation of liquid nitrogen were ongoing. New insulation technologies and container designs improve the safety and efficacy of liquid nitrogen handling.
- In 2022, Advances were made in the use of liquid nitrogen in cryotherapy, a medical treatment involving the therapeutic exposure of the body to extremely frigid temperatures.
- In 2021, The University of Bristol developed a new technique to produce liquid nitrogen using solar energy. They used a solar thermal reactor to convert sunlight and air into high-temperature heat, which was then used to separate nitrogen from the air and produce liquid nitrogen.
- In 2020, The use of liquid nitrogen as a potential coolant for COVID-19 vaccine storage acquired prominence. The exceedingly low temperature of liquid nitrogen (-196°C or -321°F) makes it appropriate for preserving vaccines, such as the Pfizer-BioNTech COVID-19 vaccine, which requires ultra-cold storage.
- In 2019, The University of Cambridge devised a method to produce liquid nitrogen from the air using an innovative cryocooler.
Report Scope
Report Features Description Market Value (2022) USD 14.5 Bn Forecast Revenue (2032) USD 23.5 Bn CAGR (2023-2032) 4.9% Base Year for Estimation 2022 Historic Period 2016-2022 Forecast Period 2023-2032 Report Coverage Revenue Forecast, Market Dynamics, COVID-19 Impact, Competitive Landscape, Recent Developments Segments Covered By Production Process Analysis (Cryogenic Distillation, Pressure Swing Adsorption), By End-User Industry Analysis(Healthcare, Chemicals & Pharmaceuticals, Food & Beverage, Metal Manufacturing & Construction, Rubber & Plastic, Others) Regional Analysis North America – The US, Canada, & Mexico; Western Europe – Germany, France, The UK, Spain, Italy, Portugal, Ireland, Austria, Switzerland, Benelux, Nordic, & Rest of Western Europe; Eastern Europe – Russia, Poland, The Czech Republic, Greece, & Rest of Eastern Europe; APAC – China, Japan, South Korea, India, Australia & New Zealand, Indonesia, Malaysia, Philippines, Singapore, Thailand, Vietnam, & Rest of APAC; Latin America – Brazil, Colombia, Chile, Argentina, Costa Rica, & Rest of Latin America; Middle East & Africa – Algeria, Egypt, Israel, Kuwait, Nigeria, Saudi Arabia, South Africa, Turkey, United Arab Emirates, & Rest of MEA Competitive Landscape The Linde Group, Refrigeration & Oxygen Company Limited, Air Liquide, Gulf Cryo, Air Products and Chemicals, Inc., Messer Group GmbH, SOUTHERN INDUSTRIAL GAS SDN. BHD., TAIYO NIPPON SANSO CORPORATION, Asia Technical Gas Co Pte Ltd, BUZWAIR INDUSTRIAL GASES FACTORIES Customization Scope Customization for segments, region/country-level will be provided. Moreover, additional customization can be done based on the requirements. Purchase Options We have three licenses to opt for: Single User License, Multi-User License (Up to 5 Users), Corporate Use License (Unlimited User and Printable PDF) -
- 1. Executive Summary
- 1.1. Definition
- 1.2. Taxonomy
- 1.3. Research Scope
- 1.4. Key Analysis
- 1.5. Key Findings by Major Segments
- 1.6. Top strategies by Major Players
- 2. Global Liquid Nitrogen Market Overview
- 2.1. Liquid Nitrogen Market Dynamics
- 2.1.1. Drivers
- 2.1.2. Opportunities
- 2.1.3. Restraints
- 2.1.4. Challenges
- 2.2. Macro-economic Factors
- 2.3. Regulatory Framework
- 2.4. Market Investment Feasibility Index
- 2.5. PEST Analysis
- 2.6. PORTER’S Five Force Analysis
- 2.7. Drivers & Restraints Impact Analysis
- 2.8. Industry Chain Analysis
- 2.9. Cost Structure Analysis
- 2.10. Marketing Strategy
- 2.11. Russia-Ukraine War Impact Analysis
- 2.12. Opportunity Map Analysis
- 2.13. Market Competition Scenario Analysis
- 2.14. Product Life Cycle Analysis
- 2.15. Opportunity Orbits
- 2.16. Manufacturer Intensity Map
- 2.17. Major Companies sales by Value & Volume
- 2.1. Liquid Nitrogen Market Dynamics
- 3. Global Liquid Nitrogen Market Analysis, Opportunity and Forecast, 2016-2032
- 3.1. Global Liquid Nitrogen Market Analysis, 2016-2021
- 3.2. Global Liquid Nitrogen Market Opportunity and Forecast, 2023-2032
- 3.3. Global Liquid Nitrogen Market Analysis, Opportunity and Forecast, By By Production Process Analysis, 2016-2032
- 3.3.1. Global Liquid Nitrogen Market Analysis by By Production Process Analysis: Introduction
- 3.3.2. Market Size Absolute $ Opportunity Analysis and Forecast, By By Production Process Analysis, 2016-2032
- 3.3.3. Cryogenic Distillation
- 3.3.4. Pressure Swing Adsorption
- 3.4. Global Liquid Nitrogen Market Analysis, Opportunity and Forecast, By By End-User Industry Analysis, 2016-2032
- 3.4.1. Global Liquid Nitrogen Market Analysis by By End-User Industry Analysis: Introduction
- 3.4.2. Market Size Absolute $ Opportunity Analysis and Forecast, By By End-User Industry Analysis, 2016-2032
- 3.4.3. Healthcare
- 3.4.4. Chemicals & Pharmaceuticals
- 3.4.5. Food & Beverage
- 3.4.6. Metal Manufacturing & Construction
- 3.4.7. Rubber & Plastic
- 3.4.8. Others (Electronics and Energy)
- 3.5. Global Liquid Nitrogen Market Analysis, Opportunity and Forecast, By , 2016-2032
- 3.5.1. Global Liquid Nitrogen Market Analysis by : Introduction
- 3.5.2. Market Size Absolute $ Opportunity Analysis and Forecast, By , 2016-2032
- 4. North America Liquid Nitrogen Market Analysis, Opportunity and Forecast, 2016-2032
- 4.1. North America Liquid Nitrogen Market Analysis, 2016-2021
- 4.2. North America Liquid Nitrogen Market Opportunity and Forecast, 2023-2032
- 4.3. North America Liquid Nitrogen Market Analysis, Opportunity and Forecast, By By Production Process Analysis, 2016-2032
- 4.3.1. North America Liquid Nitrogen Market Analysis by By Production Process Analysis: Introduction
- 4.3.2. Market Size Absolute $ Opportunity Analysis and Forecast, By By Production Process Analysis, 2016-2032
- 4.3.3. Cryogenic Distillation
- 4.3.4. Pressure Swing Adsorption
- 4.4. North America Liquid Nitrogen Market Analysis, Opportunity and Forecast, By By End-User Industry Analysis, 2016-2032
- 4.4.1. North America Liquid Nitrogen Market Analysis by By End-User Industry Analysis: Introduction
- 4.4.2. Market Size Absolute $ Opportunity Analysis and Forecast, By By End-User Industry Analysis, 2016-2032
- 4.4.3. Healthcare
- 4.4.4. Chemicals & Pharmaceuticals
- 4.4.5. Food & Beverage
- 4.4.6. Metal Manufacturing & Construction
- 4.4.7. Rubber & Plastic
- 4.4.8. Others (Electronics and Energy)
- 4.5. North America Liquid Nitrogen Market Analysis, Opportunity and Forecast, By , 2016-2032
- 4.5.1. North America Liquid Nitrogen Market Analysis by : Introduction
- 4.5.2. Market Size Absolute $ Opportunity Analysis and Forecast, By , 2016-2032
- 4.6. North America Liquid Nitrogen Market Analysis, Opportunity and Forecast, By Country , 2016-2032
- 4.6.1. North America Liquid Nitrogen Market Analysis by Country : Introduction
- 4.6.2. Market Size Absolute $ Opportunity Analysis and Forecast, Country , 2016-2032
- 4.6.2.1. The US
- 4.6.2.2. Canada
- 4.6.2.3. Mexico
- 5. Western Europe Liquid Nitrogen Market Analysis, Opportunity and Forecast, 2016-2032
- 5.1. Western Europe Liquid Nitrogen Market Analysis, 2016-2021
- 5.2. Western Europe Liquid Nitrogen Market Opportunity and Forecast, 2023-2032
- 5.3. Western Europe Liquid Nitrogen Market Analysis, Opportunity and Forecast, By By Production Process Analysis, 2016-2032
- 5.3.1. Western Europe Liquid Nitrogen Market Analysis by By Production Process Analysis: Introduction
- 5.3.2. Market Size Absolute $ Opportunity Analysis and Forecast, By By Production Process Analysis, 2016-2032
- 5.3.3. Cryogenic Distillation
- 5.3.4. Pressure Swing Adsorption
- 5.4. Western Europe Liquid Nitrogen Market Analysis, Opportunity and Forecast, By By End-User Industry Analysis, 2016-2032
- 5.4.1. Western Europe Liquid Nitrogen Market Analysis by By End-User Industry Analysis: Introduction
- 5.4.2. Market Size Absolute $ Opportunity Analysis and Forecast, By By End-User Industry Analysis, 2016-2032
- 5.4.3. Healthcare
- 5.4.4. Chemicals & Pharmaceuticals
- 5.4.5. Food & Beverage
- 5.4.6. Metal Manufacturing & Construction
- 5.4.7. Rubber & Plastic
- 5.4.8. Others (Electronics and Energy)
- 5.5. Western Europe Liquid Nitrogen Market Analysis, Opportunity and Forecast, By , 2016-2032
- 5.5.1. Western Europe Liquid Nitrogen Market Analysis by : Introduction
- 5.5.2. Market Size Absolute $ Opportunity Analysis and Forecast, By , 2016-2032
- 5.6. Western Europe Liquid Nitrogen Market Analysis, Opportunity and Forecast, By Country , 2016-2032
- 5.6.1. Western Europe Liquid Nitrogen Market Analysis by Country : Introduction
- 5.6.2. Market Size Absolute $ Opportunity Analysis and Forecast, Country , 2016-2032
- 5.6.2.1. Germany
- 5.6.2.2. France
- 5.6.2.3. The UK
- 5.6.2.4. Spain
- 5.6.2.5. Italy
- 5.6.2.6. Portugal
- 5.6.2.7. Ireland
- 5.6.2.8. Austria
- 5.6.2.9. Switzerland
- 5.6.2.10. Benelux
- 5.6.2.11. Nordic
- 5.6.2.12. Rest of Western Europe
- 6. Eastern Europe Liquid Nitrogen Market Analysis, Opportunity and Forecast, 2016-2032
- 6.1. Eastern Europe Liquid Nitrogen Market Analysis, 2016-2021
- 6.2. Eastern Europe Liquid Nitrogen Market Opportunity and Forecast, 2023-2032
- 6.3. Eastern Europe Liquid Nitrogen Market Analysis, Opportunity and Forecast, By By Production Process Analysis, 2016-2032
- 6.3.1. Eastern Europe Liquid Nitrogen Market Analysis by By Production Process Analysis: Introduction
- 6.3.2. Market Size Absolute $ Opportunity Analysis and Forecast, By By Production Process Analysis, 2016-2032
- 6.3.3. Cryogenic Distillation
- 6.3.4. Pressure Swing Adsorption
- 6.4. Eastern Europe Liquid Nitrogen Market Analysis, Opportunity and Forecast, By By End-User Industry Analysis, 2016-2032
- 6.4.1. Eastern Europe Liquid Nitrogen Market Analysis by By End-User Industry Analysis: Introduction
- 6.4.2. Market Size Absolute $ Opportunity Analysis and Forecast, By By End-User Industry Analysis, 2016-2032
- 6.4.3. Healthcare
- 6.4.4. Chemicals & Pharmaceuticals
- 6.4.5. Food & Beverage
- 6.4.6. Metal Manufacturing & Construction
- 6.4.7. Rubber & Plastic
- 6.4.8. Others (Electronics and Energy)
- 6.5. Eastern Europe Liquid Nitrogen Market Analysis, Opportunity and Forecast, By , 2016-2032
- 6.5.1. Eastern Europe Liquid Nitrogen Market Analysis by : Introduction
- 6.5.2. Market Size Absolute $ Opportunity Analysis and Forecast, By , 2016-2032
- 6.6. Eastern Europe Liquid Nitrogen Market Analysis, Opportunity and Forecast, By Country , 2016-2032
- 6.6.1. Eastern Europe Liquid Nitrogen Market Analysis by Country : Introduction
- 6.6.2. Market Size Absolute $ Opportunity Analysis and Forecast, Country , 2016-2032
- 6.6.2.1. Russia
- 6.6.2.2. Poland
- 6.6.2.3. The Czech Republic
- 6.6.2.4. Greece
- 6.6.2.5. Rest of Eastern Europe
- 7. APAC Liquid Nitrogen Market Analysis, Opportunity and Forecast, 2016-2032
- 7.1. APAC Liquid Nitrogen Market Analysis, 2016-2021
- 7.2. APAC Liquid Nitrogen Market Opportunity and Forecast, 2023-2032
- 7.3. APAC Liquid Nitrogen Market Analysis, Opportunity and Forecast, By By Production Process Analysis, 2016-2032
- 7.3.1. APAC Liquid Nitrogen Market Analysis by By Production Process Analysis: Introduction
- 7.3.2. Market Size Absolute $ Opportunity Analysis and Forecast, By By Production Process Analysis, 2016-2032
- 7.3.3. Cryogenic Distillation
- 7.3.4. Pressure Swing Adsorption
- 7.4. APAC Liquid Nitrogen Market Analysis, Opportunity and Forecast, By By End-User Industry Analysis, 2016-2032
- 7.4.1. APAC Liquid Nitrogen Market Analysis by By End-User Industry Analysis: Introduction
- 7.4.2. Market Size Absolute $ Opportunity Analysis and Forecast, By By End-User Industry Analysis, 2016-2032
- 7.4.3. Healthcare
- 7.4.4. Chemicals & Pharmaceuticals
- 7.4.5. Food & Beverage
- 7.4.6. Metal Manufacturing & Construction
- 7.4.7. Rubber & Plastic
- 7.4.8. Others (Electronics and Energy)
- 7.5. APAC Liquid Nitrogen Market Analysis, Opportunity and Forecast, By , 2016-2032
- 7.5.1. APAC Liquid Nitrogen Market Analysis by : Introduction
- 7.5.2. Market Size Absolute $ Opportunity Analysis and Forecast, By , 2016-2032
- 7.6. APAC Liquid Nitrogen Market Analysis, Opportunity and Forecast, By Country , 2016-2032
- 7.6.1. APAC Liquid Nitrogen Market Analysis by Country : Introduction
- 7.6.2. Market Size Absolute $ Opportunity Analysis and Forecast, Country , 2016-2032
- 7.6.2.1. China
- 7.6.2.2. Japan
- 7.6.2.3. South Korea
- 7.6.2.4. India
- 7.6.2.5. Australia & New Zeland
- 7.6.2.6. Indonesia
- 7.6.2.7. Malaysia
- 7.6.2.8. Philippines
- 7.6.2.9. Singapore
- 7.6.2.10. Thailand
- 7.6.2.11. Vietnam
- 7.6.2.12. Rest of APAC
- 8. Latin America Liquid Nitrogen Market Analysis, Opportunity and Forecast, 2016-2032
- 8.1. Latin America Liquid Nitrogen Market Analysis, 2016-2021
- 8.2. Latin America Liquid Nitrogen Market Opportunity and Forecast, 2023-2032
- 8.3. Latin America Liquid Nitrogen Market Analysis, Opportunity and Forecast, By By Production Process Analysis, 2016-2032
- 8.3.1. Latin America Liquid Nitrogen Market Analysis by By Production Process Analysis: Introduction
- 8.3.2. Market Size Absolute $ Opportunity Analysis and Forecast, By By Production Process Analysis, 2016-2032
- 8.3.3. Cryogenic Distillation
- 8.3.4. Pressure Swing Adsorption
- 8.4. Latin America Liquid Nitrogen Market Analysis, Opportunity and Forecast, By By End-User Industry Analysis, 2016-2032
- 8.4.1. Latin America Liquid Nitrogen Market Analysis by By End-User Industry Analysis: Introduction
- 8.4.2. Market Size Absolute $ Opportunity Analysis and Forecast, By By End-User Industry Analysis, 2016-2032
- 8.4.3. Healthcare
- 8.4.4. Chemicals & Pharmaceuticals
- 8.4.5. Food & Beverage
- 8.4.6. Metal Manufacturing & Construction
- 8.4.7. Rubber & Plastic
- 8.4.8. Others (Electronics and Energy)
- 8.5. Latin America Liquid Nitrogen Market Analysis, Opportunity and Forecast, By , 2016-2032
- 8.5.1. Latin America Liquid Nitrogen Market Analysis by : Introduction
- 8.5.2. Market Size Absolute $ Opportunity Analysis and Forecast, By , 2016-2032
- 8.6. Latin America Liquid Nitrogen Market Analysis, Opportunity and Forecast, By Country , 2016-2032
- 8.6.1. Latin America Liquid Nitrogen Market Analysis by Country : Introduction
- 8.6.2. Market Size Absolute $ Opportunity Analysis and Forecast, Country , 2016-2032
- 8.6.2.1. Brazil
- 8.6.2.2. Colombia
- 8.6.2.3. Chile
- 8.6.2.4. Argentina
- 8.6.2.5. Costa Rica
- 8.6.2.6. Rest of Latin America
- 9. Middle East & Africa Liquid Nitrogen Market Analysis, Opportunity and Forecast, 2016-2032
- 9.1. Middle East & Africa Liquid Nitrogen Market Analysis, 2016-2021
- 9.2. Middle East & Africa Liquid Nitrogen Market Opportunity and Forecast, 2023-2032
- 9.3. Middle East & Africa Liquid Nitrogen Market Analysis, Opportunity and Forecast, By By Production Process Analysis, 2016-2032
- 9.3.1. Middle East & Africa Liquid Nitrogen Market Analysis by By Production Process Analysis: Introduction
- 9.3.2. Market Size Absolute $ Opportunity Analysis and Forecast, By By Production Process Analysis, 2016-2032
- 9.3.3. Cryogenic Distillation
- 9.3.4. Pressure Swing Adsorption
- 9.4. Middle East & Africa Liquid Nitrogen Market Analysis, Opportunity and Forecast, By By End-User Industry Analysis, 2016-2032
- 9.4.1. Middle East & Africa Liquid Nitrogen Market Analysis by By End-User Industry Analysis: Introduction
- 9.4.2. Market Size Absolute $ Opportunity Analysis and Forecast, By By End-User Industry Analysis, 2016-2032
- 9.4.3. Healthcare
- 9.4.4. Chemicals & Pharmaceuticals
- 9.4.5. Food & Beverage
- 9.4.6. Metal Manufacturing & Construction
- 9.4.7. Rubber & Plastic
- 9.4.8. Others (Electronics and Energy)
- 9.5. Middle East & Africa Liquid Nitrogen Market Analysis, Opportunity and Forecast, By , 2016-2032
- 9.5.1. Middle East & Africa Liquid Nitrogen Market Analysis by : Introduction
- 9.5.2. Market Size Absolute $ Opportunity Analysis and Forecast, By , 2016-2032
- 9.6. Middle East & Africa Liquid Nitrogen Market Analysis, Opportunity and Forecast, By Country , 2016-2032
- 9.6.1. Middle East & Africa Liquid Nitrogen Market Analysis by Country : Introduction
- 9.6.2. Market Size Absolute $ Opportunity Analysis and Forecast, Country , 2016-2032
- 9.6.2.1. Algeria
- 9.6.2.2. Egypt
- 9.6.2.3. Israel
- 9.6.2.4. Kuwait
- 9.6.2.5. Nigeria
- 9.6.2.6. Saudi Arabia
- 9.6.2.7. South Africa
- 9.6.2.8. Turkey
- 9.6.2.9. The UAE
- 9.6.2.10. Rest of MEA
- 10. Global Liquid Nitrogen Market Analysis, Opportunity and Forecast, By Region , 2016-2032
- 10.1. Global Liquid Nitrogen Market Analysis by Region : Introduction
- 10.2. Market Size Absolute $ Opportunity Analysis and Forecast, By Region , 2016-2032
- 10.2.1. North America
- 10.2.2. Western Europe
- 10.2.3. Eastern Europe
- 10.2.4. APAC
- 10.2.5. Latin America
- 10.2.6. Middle East & Africa
- 11. Global Liquid Nitrogen Market Competitive Landscape, Market Share Analysis, and Company Profiles
- 11.1. Market Share Analysis
- 11.2. Company Profiles
- 11.3. The Linde Group
- 11.3.1. Company Overview
- 11.3.2. Financial Highlights
- 11.3.3. Product Portfolio
- 11.3.4. SWOT Analysis
- 11.3.5. Key Strategies and Developments
- 11.4. Refrigeration & Oxygen Company Limited
- 11.4.1. Company Overview
- 11.4.2. Financial Highlights
- 11.4.3. Product Portfolio
- 11.4.4. SWOT Analysis
- 11.4.5. Key Strategies and Developments
- 11.5. Air Liquide
- 11.5.1. Company Overview
- 11.5.2. Financial Highlights
- 11.5.3. Product Portfolio
- 11.5.4. SWOT Analysis
- 11.5.5. Key Strategies and Developments
- 11.6. Gulf Cryo
- 11.6.1. Company Overview
- 11.6.2. Financial Highlights
- 11.6.3. Product Portfolio
- 11.6.4. SWOT Analysis
- 11.6.5. Key Strategies and Developments
- 11.7. Air Products and Chemicals, Inc.
- 11.7.1. Company Overview
- 11.7.2. Financial Highlights
- 11.7.3. Product Portfolio
- 11.7.4. SWOT Analysis
- 11.7.5. Key Strategies and Developments
- 11.8. Messer Group GmbH
- 11.8.1. Company Overview
- 11.8.2. Financial Highlights
- 11.8.3. Product Portfolio
- 11.8.4. SWOT Analysis
- 11.8.5. Key Strategies and Developments
- 11.9. SOUTHERN INDUSTRIAL GAS SDN. BHD.
- 11.9.1. Company Overview
- 11.9.2. Financial Highlights
- 11.9.3. Product Portfolio
- 11.9.4. SWOT Analysis
- 11.9.5. Key Strategies and Developments
- 11.10. TAIYO NIPPON SANSO CORPORATION
- 11.10.1. Company Overview
- 11.10.2. Financial Highlights
- 11.10.3. Product Portfolio
- 11.10.4. SWOT Analysis
- 11.10.5. Key Strategies and Developments
- 11.11. Asia Technical Gas Co Pte Ltd
- 11.11.1. Company Overview
- 11.11.2. Financial Highlights
- 11.11.3. Product Portfolio
- 11.11.4. SWOT Analysis
- 11.11.5. Key Strategies and Developments
- 11.12. BUZWAIR INDUSTRIAL GASES FACTORIES
- 11.12.1. Company Overview
- 11.12.2. Financial Highlights
- 11.12.3. Product Portfolio
- 11.12.4. SWOT Analysis
- 11.12.5. Key Strategies and Developments
- 12. Assumptions and Acronyms
- 13. Research Methodology
- 14. Contact
- List of Figures
- Figure 1: Global Liquid Nitrogen Market Revenue (US$ Mn) Market Share by Production Process Analysis in 2022
- Figure 2: Global Liquid Nitrogen Market Attractiveness Analysis by Production Process Analysis, 2016-2032
- Figure 3: Global Liquid Nitrogen Market Revenue (US$ Mn) Market Share by End-User Industry Analysisin 2022
- Figure 4: Global Liquid Nitrogen Market Attractiveness Analysis by End-User Industry Analysis, 2016-2032
- Figure 5: Global Liquid Nitrogen Market Revenue (US$ Mn) Market Share by in 2022
- Figure 6: Global Liquid Nitrogen Market Attractiveness Analysis by , 2016-2032
- Figure 7: Global Liquid Nitrogen Market Revenue (US$ Mn) Market Share by Region in 2022
- Figure 8: Global Liquid Nitrogen Market Attractiveness Analysis by Region, 2016-2032
- Figure 9: Global Liquid Nitrogen Market Revenue (US$ Mn) (2016-2032)
- Figure 10: Global Liquid Nitrogen Market Revenue (US$ Mn) Comparison by Region (2016-2032)
- Figure 11: Global Liquid Nitrogen Market Revenue (US$ Mn) Comparison by Production Process Analysis (2016-2032)
- Figure 12: Global Liquid Nitrogen Market Revenue (US$ Mn) Comparison by End-User Industry Analysis (2016-2032)
- Figure 13: Global Liquid Nitrogen Market Revenue (US$ Mn) Comparison by (2016-2032)
- Figure 14: Global Liquid Nitrogen Market Y-o-Y Growth Rate Comparison by Region (2016-2032)
- Figure 15: Global Liquid Nitrogen Market Y-o-Y Growth Rate Comparison by Production Process Analysis (2016-2032)
- Figure 16: Global Liquid Nitrogen Market Y-o-Y Growth Rate Comparison by End-User Industry Analysis (2016-2032)
- Figure 17: Global Liquid Nitrogen Market Y-o-Y Growth Rate Comparison by (2016-2032)
- Figure 18: Global Liquid Nitrogen Market Share Comparison by Region (2016-2032)
- Figure 19: Global Liquid Nitrogen Market Share Comparison by Production Process Analysis (2016-2032)
- Figure 20: Global Liquid Nitrogen Market Share Comparison by End-User Industry Analysis (2016-2032)
- Figure 21: Global Liquid Nitrogen Market Share Comparison by (2016-2032)
- Figure 22: North America Liquid Nitrogen Market Revenue (US$ Mn) Market Share by Production Process Analysisin 2022
- Figure 23: North America Liquid Nitrogen Market Attractiveness Analysis by Production Process Analysis, 2016-2032
- Figure 24: North America Liquid Nitrogen Market Revenue (US$ Mn) Market Share by End-User Industry Analysisin 2022
- Figure 25: North America Liquid Nitrogen Market Attractiveness Analysis by End-User Industry Analysis, 2016-2032
- Figure 26: North America Liquid Nitrogen Market Revenue (US$ Mn) Market Share by in 2022
- Figure 27: North America Liquid Nitrogen Market Attractiveness Analysis by , 2016-2032
- Figure 28: North America Liquid Nitrogen Market Revenue (US$ Mn) Market Share by Country in 2022
- Figure 29: North America Liquid Nitrogen Market Attractiveness Analysis by Country, 2016-2032
- Figure 30: North America Liquid Nitrogen Market Revenue (US$ Mn) (2016-2032)
- Figure 31: North America Liquid Nitrogen Market Revenue (US$ Mn) Comparison by Country (2016-2032)
- Figure 32: North America Liquid Nitrogen Market Revenue (US$ Mn) Comparison by Production Process Analysis (2016-2032)
- Figure 33: North America Liquid Nitrogen Market Revenue (US$ Mn) Comparison by End-User Industry Analysis (2016-2032)
- Figure 34: North America Liquid Nitrogen Market Revenue (US$ Mn) Comparison by (2016-2032)
- Figure 35: North America Liquid Nitrogen Market Y-o-Y Growth Rate Comparison by Country (2016-2032)
- Figure 36: North America Liquid Nitrogen Market Y-o-Y Growth Rate Comparison by Production Process Analysis (2016-2032)
- Figure 37: North America Liquid Nitrogen Market Y-o-Y Growth Rate Comparison by End-User Industry Analysis (2016-2032)
- Figure 38: North America Liquid Nitrogen Market Y-o-Y Growth Rate Comparison by (2016-2032)
- Figure 39: North America Liquid Nitrogen Market Share Comparison by Country (2016-2032)
- Figure 40: North America Liquid Nitrogen Market Share Comparison by Production Process Analysis (2016-2032)
- Figure 41: North America Liquid Nitrogen Market Share Comparison by End-User Industry Analysis (2016-2032)
- Figure 42: North America Liquid Nitrogen Market Share Comparison by (2016-2032)
- Figure 43: Western Europe Liquid Nitrogen Market Revenue (US$ Mn) Market Share by Production Process Analysisin 2022
- Figure 44: Western Europe Liquid Nitrogen Market Attractiveness Analysis by Production Process Analysis, 2016-2032
- Figure 45: Western Europe Liquid Nitrogen Market Revenue (US$ Mn) Market Share by End-User Industry Analysisin 2022
- Figure 46: Western Europe Liquid Nitrogen Market Attractiveness Analysis by End-User Industry Analysis, 2016-2032
- Figure 47: Western Europe Liquid Nitrogen Market Revenue (US$ Mn) Market Share by in 2022
- Figure 48: Western Europe Liquid Nitrogen Market Attractiveness Analysis by , 2016-2032
- Figure 49: Western Europe Liquid Nitrogen Market Revenue (US$ Mn) Market Share by Country in 2022
- Figure 50: Western Europe Liquid Nitrogen Market Attractiveness Analysis by Country, 2016-2032
- Figure 51: Western Europe Liquid Nitrogen Market Revenue (US$ Mn) (2016-2032)
- Figure 52: Western Europe Liquid Nitrogen Market Revenue (US$ Mn) Comparison by Country (2016-2032)
- Figure 53: Western Europe Liquid Nitrogen Market Revenue (US$ Mn) Comparison by Production Process Analysis (2016-2032)
- Figure 54: Western Europe Liquid Nitrogen Market Revenue (US$ Mn) Comparison by End-User Industry Analysis (2016-2032)
- Figure 55: Western Europe Liquid Nitrogen Market Revenue (US$ Mn) Comparison by (2016-2032)
- Figure 56: Western Europe Liquid Nitrogen Market Y-o-Y Growth Rate Comparison by Country (2016-2032)
- Figure 57: Western Europe Liquid Nitrogen Market Y-o-Y Growth Rate Comparison by Production Process Analysis (2016-2032)
- Figure 58: Western Europe Liquid Nitrogen Market Y-o-Y Growth Rate Comparison by End-User Industry Analysis (2016-2032)
- Figure 59: Western Europe Liquid Nitrogen Market Y-o-Y Growth Rate Comparison by (2016-2032)
- Figure 60: Western Europe Liquid Nitrogen Market Share Comparison by Country (2016-2032)
- Figure 61: Western Europe Liquid Nitrogen Market Share Comparison by Production Process Analysis (2016-2032)
- Figure 62: Western Europe Liquid Nitrogen Market Share Comparison by End-User Industry Analysis (2016-2032)
- Figure 63: Western Europe Liquid Nitrogen Market Share Comparison by (2016-2032)
- Figure 64: Eastern Europe Liquid Nitrogen Market Revenue (US$ Mn) Market Share by Production Process Analysisin 2022
- Figure 65: Eastern Europe Liquid Nitrogen Market Attractiveness Analysis by Production Process Analysis, 2016-2032
- Figure 66: Eastern Europe Liquid Nitrogen Market Revenue (US$ Mn) Market Share by End-User Industry Analysisin 2022
- Figure 67: Eastern Europe Liquid Nitrogen Market Attractiveness Analysis by End-User Industry Analysis, 2016-2032
- Figure 68: Eastern Europe Liquid Nitrogen Market Revenue (US$ Mn) Market Share by in 2022
- Figure 69: Eastern Europe Liquid Nitrogen Market Attractiveness Analysis by , 2016-2032
- Figure 70: Eastern Europe Liquid Nitrogen Market Revenue (US$ Mn) Market Share by Country in 2022
- Figure 71: Eastern Europe Liquid Nitrogen Market Attractiveness Analysis by Country, 2016-2032
- Figure 72: Eastern Europe Liquid Nitrogen Market Revenue (US$ Mn) (2016-2032)
- Figure 73: Eastern Europe Liquid Nitrogen Market Revenue (US$ Mn) Comparison by Country (2016-2032)
- Figure 74: Eastern Europe Liquid Nitrogen Market Revenue (US$ Mn) Comparison by Production Process Analysis (2016-2032)
- Figure 75: Eastern Europe Liquid Nitrogen Market Revenue (US$ Mn) Comparison by End-User Industry Analysis (2016-2032)
- Figure 76: Eastern Europe Liquid Nitrogen Market Revenue (US$ Mn) Comparison by (2016-2032)
- Figure 77: Eastern Europe Liquid Nitrogen Market Y-o-Y Growth Rate Comparison by Country (2016-2032)
- Figure 78: Eastern Europe Liquid Nitrogen Market Y-o-Y Growth Rate Comparison by Production Process Analysis (2016-2032)
- Figure 79: Eastern Europe Liquid Nitrogen Market Y-o-Y Growth Rate Comparison by End-User Industry Analysis (2016-2032)
- Figure 80: Eastern Europe Liquid Nitrogen Market Y-o-Y Growth Rate Comparison by (2016-2032)
- Figure 81: Eastern Europe Liquid Nitrogen Market Share Comparison by Country (2016-2032)
- Figure 82: Eastern Europe Liquid Nitrogen Market Share Comparison by Production Process Analysis (2016-2032)
- Figure 83: Eastern Europe Liquid Nitrogen Market Share Comparison by End-User Industry Analysis (2016-2032)
- Figure 84: Eastern Europe Liquid Nitrogen Market Share Comparison by (2016-2032)
- Figure 85: APAC Liquid Nitrogen Market Revenue (US$ Mn) Market Share by Production Process Analysisin 2022
- Figure 86: APAC Liquid Nitrogen Market Attractiveness Analysis by Production Process Analysis, 2016-2032
- Figure 87: APAC Liquid Nitrogen Market Revenue (US$ Mn) Market Share by End-User Industry Analysisin 2022
- Figure 88: APAC Liquid Nitrogen Market Attractiveness Analysis by End-User Industry Analysis, 2016-2032
- Figure 89: APAC Liquid Nitrogen Market Revenue (US$ Mn) Market Share by in 2022
- Figure 90: APAC Liquid Nitrogen Market Attractiveness Analysis by , 2016-2032
- Figure 91: APAC Liquid Nitrogen Market Revenue (US$ Mn) Market Share by Country in 2022
- Figure 92: APAC Liquid Nitrogen Market Attractiveness Analysis by Country, 2016-2032
- Figure 93: APAC Liquid Nitrogen Market Revenue (US$ Mn) (2016-2032)
- Figure 94: APAC Liquid Nitrogen Market Revenue (US$ Mn) Comparison by Country (2016-2032)
- Figure 95: APAC Liquid Nitrogen Market Revenue (US$ Mn) Comparison by Production Process Analysis (2016-2032)
- Figure 96: APAC Liquid Nitrogen Market Revenue (US$ Mn) Comparison by End-User Industry Analysis (2016-2032)
- Figure 97: APAC Liquid Nitrogen Market Revenue (US$ Mn) Comparison by (2016-2032)
- Figure 98: APAC Liquid Nitrogen Market Y-o-Y Growth Rate Comparison by Country (2016-2032)
- Figure 99: APAC Liquid Nitrogen Market Y-o-Y Growth Rate Comparison by Production Process Analysis (2016-2032)
- Figure 100: APAC Liquid Nitrogen Market Y-o-Y Growth Rate Comparison by End-User Industry Analysis (2016-2032)
- Figure 101: APAC Liquid Nitrogen Market Y-o-Y Growth Rate Comparison by (2016-2032)
- Figure 102: APAC Liquid Nitrogen Market Share Comparison by Country (2016-2032)
- Figure 103: APAC Liquid Nitrogen Market Share Comparison by Production Process Analysis (2016-2032)
- Figure 104: APAC Liquid Nitrogen Market Share Comparison by End-User Industry Analysis (2016-2032)
- Figure 105: APAC Liquid Nitrogen Market Share Comparison by (2016-2032)
- Figure 106: Latin America Liquid Nitrogen Market Revenue (US$ Mn) Market Share by Production Process Analysisin 2022
- Figure 107: Latin America Liquid Nitrogen Market Attractiveness Analysis by Production Process Analysis, 2016-2032
- Figure 108: Latin America Liquid Nitrogen Market Revenue (US$ Mn) Market Share by End-User Industry Analysisin 2022
- Figure 109: Latin America Liquid Nitrogen Market Attractiveness Analysis by End-User Industry Analysis, 2016-2032
- Figure 110: Latin America Liquid Nitrogen Market Revenue (US$ Mn) Market Share by in 2022
- Figure 111: Latin America Liquid Nitrogen Market Attractiveness Analysis by , 2016-2032
- Figure 112: Latin America Liquid Nitrogen Market Revenue (US$ Mn) Market Share by Country in 2022
- Figure 113: Latin America Liquid Nitrogen Market Attractiveness Analysis by Country, 2016-2032
- Figure 114: Latin America Liquid Nitrogen Market Revenue (US$ Mn) (2016-2032)
- Figure 115: Latin America Liquid Nitrogen Market Revenue (US$ Mn) Comparison by Country (2016-2032)
- Figure 116: Latin America Liquid Nitrogen Market Revenue (US$ Mn) Comparison by Production Process Analysis (2016-2032)
- Figure 117: Latin America Liquid Nitrogen Market Revenue (US$ Mn) Comparison by End-User Industry Analysis (2016-2032)
- Figure 118: Latin America Liquid Nitrogen Market Revenue (US$ Mn) Comparison by (2016-2032)
- Figure 119: Latin America Liquid Nitrogen Market Y-o-Y Growth Rate Comparison by Country (2016-2032)
- Figure 120: Latin America Liquid Nitrogen Market Y-o-Y Growth Rate Comparison by Production Process Analysis (2016-2032)
- Figure 121: Latin America Liquid Nitrogen Market Y-o-Y Growth Rate Comparison by End-User Industry Analysis (2016-2032)
- Figure 122: Latin America Liquid Nitrogen Market Y-o-Y Growth Rate Comparison by (2016-2032)
- Figure 123: Latin America Liquid Nitrogen Market Share Comparison by Country (2016-2032)
- Figure 124: Latin America Liquid Nitrogen Market Share Comparison by Production Process Analysis (2016-2032)
- Figure 125: Latin America Liquid Nitrogen Market Share Comparison by End-User Industry Analysis (2016-2032)
- Figure 126: Latin America Liquid Nitrogen Market Share Comparison by (2016-2032)
- Figure 127: Middle East & Africa Liquid Nitrogen Market Revenue (US$ Mn) Market Share by Production Process Analysisin 2022
- Figure 128: Middle East & Africa Liquid Nitrogen Market Attractiveness Analysis by Production Process Analysis, 2016-2032
- Figure 129: Middle East & Africa Liquid Nitrogen Market Revenue (US$ Mn) Market Share by End-User Industry Analysisin 2022
- Figure 130: Middle East & Africa Liquid Nitrogen Market Attractiveness Analysis by End-User Industry Analysis, 2016-2032
- Figure 131: Middle East & Africa Liquid Nitrogen Market Revenue (US$ Mn) Market Share by in 2022
- Figure 132: Middle East & Africa Liquid Nitrogen Market Attractiveness Analysis by , 2016-2032
- Figure 133: Middle East & Africa Liquid Nitrogen Market Revenue (US$ Mn) Market Share by Country in 2022
- Figure 134: Middle East & Africa Liquid Nitrogen Market Attractiveness Analysis by Country, 2016-2032
- Figure 135: Middle East & Africa Liquid Nitrogen Market Revenue (US$ Mn) (2016-2032)
- Figure 136: Middle East & Africa Liquid Nitrogen Market Revenue (US$ Mn) Comparison by Country (2016-2032)
- Figure 137: Middle East & Africa Liquid Nitrogen Market Revenue (US$ Mn) Comparison by Production Process Analysis (2016-2032)
- Figure 138: Middle East & Africa Liquid Nitrogen Market Revenue (US$ Mn) Comparison by End-User Industry Analysis (2016-2032)
- Figure 139: Middle East & Africa Liquid Nitrogen Market Revenue (US$ Mn) Comparison by (2016-2032)
- Figure 140: Middle East & Africa Liquid Nitrogen Market Y-o-Y Growth Rate Comparison by Country (2016-2032)
- Figure 141: Middle East & Africa Liquid Nitrogen Market Y-o-Y Growth Rate Comparison by Production Process Analysis (2016-2032)
- Figure 142: Middle East & Africa Liquid Nitrogen Market Y-o-Y Growth Rate Comparison by End-User Industry Analysis (2016-2032)
- Figure 143: Middle East & Africa Liquid Nitrogen Market Y-o-Y Growth Rate Comparison by (2016-2032)
- Figure 144: Middle East & Africa Liquid Nitrogen Market Share Comparison by Country (2016-2032)
- Figure 145: Middle East & Africa Liquid Nitrogen Market Share Comparison by Production Process Analysis (2016-2032)
- Figure 146: Middle East & Africa Liquid Nitrogen Market Share Comparison by End-User Industry Analysis (2016-2032)
- Figure 147: Middle East & Africa Liquid Nitrogen Market Share Comparison by (2016-2032)
List of Tables
- Table 1: Global Liquid Nitrogen Market Comparison by Production Process Analysis (2016-2032)
- Table 2: Global Liquid Nitrogen Market Comparison by End-User Industry Analysis (2016-2032)
- Table 3: Global Liquid Nitrogen Market Comparison by (2016-2032)
- Table 4: Global Liquid Nitrogen Market Revenue (US$ Mn) Comparison by Region (2016-2032)
- Table 5: Global Liquid Nitrogen Market Revenue (US$ Mn) (2016-2032)
- Table 6: Global Liquid Nitrogen Market Revenue (US$ Mn) Comparison by Region (2016-2032)
- Table 7: Global Liquid Nitrogen Market Revenue (US$ Mn) Comparison by Production Process Analysis (2016-2032)
- Table 8: Global Liquid Nitrogen Market Revenue (US$ Mn) Comparison by End-User Industry Analysis (2016-2032)
- Table 9: Global Liquid Nitrogen Market Revenue (US$ Mn) Comparison by (2016-2032)
- Table 10: Global Liquid Nitrogen Market Y-o-Y Growth Rate Comparison by Region (2016-2032)
- Table 11: Global Liquid Nitrogen Market Y-o-Y Growth Rate Comparison by Production Process Analysis (2016-2032)
- Table 12: Global Liquid Nitrogen Market Y-o-Y Growth Rate Comparison by End-User Industry Analysis (2016-2032)
- Table 13: Global Liquid Nitrogen Market Y-o-Y Growth Rate Comparison by (2016-2032)
- Table 14: Global Liquid Nitrogen Market Share Comparison by Region (2016-2032)
- Table 15: Global Liquid Nitrogen Market Share Comparison by Production Process Analysis (2016-2032)
- Table 16: Global Liquid Nitrogen Market Share Comparison by End-User Industry Analysis (2016-2032)
- Table 17: Global Liquid Nitrogen Market Share Comparison by (2016-2032)
- Table 18: North America Liquid Nitrogen Market Comparison by End-User Industry Analysis (2016-2032)
- Table 19: North America Liquid Nitrogen Market Comparison by (2016-2032)
- Table 20: North America Liquid Nitrogen Market Revenue (US$ Mn) Comparison by Country (2016-2032)
- Table 21: North America Liquid Nitrogen Market Revenue (US$ Mn) (2016-2032)
- Table 22: North America Liquid Nitrogen Market Revenue (US$ Mn) Comparison by Country (2016-2032)
- Table 23: North America Liquid Nitrogen Market Revenue (US$ Mn) Comparison by Production Process Analysis (2016-2032)
- Table 24: North America Liquid Nitrogen Market Revenue (US$ Mn) Comparison by End-User Industry Analysis (2016-2032)
- Table 25: North America Liquid Nitrogen Market Revenue (US$ Mn) Comparison by (2016-2032)
- Table 26: North America Liquid Nitrogen Market Y-o-Y Growth Rate Comparison by Country (2016-2032)
- Table 27: North America Liquid Nitrogen Market Y-o-Y Growth Rate Comparison by Production Process Analysis (2016-2032)
- Table 28: North America Liquid Nitrogen Market Y-o-Y Growth Rate Comparison by End-User Industry Analysis (2016-2032)
- Table 29: North America Liquid Nitrogen Market Y-o-Y Growth Rate Comparison by (2016-2032)
- Table 30: North America Liquid Nitrogen Market Share Comparison by Country (2016-2032)
- Table 31: North America Liquid Nitrogen Market Share Comparison by Production Process Analysis (2016-2032)
- Table 32: North America Liquid Nitrogen Market Share Comparison by End-User Industry Analysis (2016-2032)
- Table 33: North America Liquid Nitrogen Market Share Comparison by (2016-2032)
- Table 34: Western Europe Liquid Nitrogen Market Comparison by Production Process Analysis (2016-2032)
- Table 35: Western Europe Liquid Nitrogen Market Comparison by End-User Industry Analysis (2016-2032)
- Table 36: Western Europe Liquid Nitrogen Market Comparison by (2016-2032)
- Table 37: Western Europe Liquid Nitrogen Market Revenue (US$ Mn) Comparison by Country (2016-2032)
- Table 38: Western Europe Liquid Nitrogen Market Revenue (US$ Mn) (2016-2032)
- Table 39: Western Europe Liquid Nitrogen Market Revenue (US$ Mn) Comparison by Country (2016-2032)
- Table 40: Western Europe Liquid Nitrogen Market Revenue (US$ Mn) Comparison by Production Process Analysis (2016-2032)
- Table 41: Western Europe Liquid Nitrogen Market Revenue (US$ Mn) Comparison by End-User Industry Analysis (2016-2032)
- Table 42: Western Europe Liquid Nitrogen Market Revenue (US$ Mn) Comparison by (2016-2032)
- Table 43: Western Europe Liquid Nitrogen Market Y-o-Y Growth Rate Comparison by Country (2016-2032)
- Table 44: Western Europe Liquid Nitrogen Market Y-o-Y Growth Rate Comparison by Production Process Analysis (2016-2032)
- Table 45: Western Europe Liquid Nitrogen Market Y-o-Y Growth Rate Comparison by End-User Industry Analysis (2016-2032)
- Table 46: Western Europe Liquid Nitrogen Market Y-o-Y Growth Rate Comparison by (2016-2032)
- Table 47: Western Europe Liquid Nitrogen Market Share Comparison by Country (2016-2032)
- Table 48: Western Europe Liquid Nitrogen Market Share Comparison by Production Process Analysis (2016-2032)
- Table 49: Western Europe Liquid Nitrogen Market Share Comparison by End-User Industry Analysis (2016-2032)
- Table 50: Western Europe Liquid Nitrogen Market Share Comparison by (2016-2032)
- Table 51: Eastern Europe Liquid Nitrogen Market Comparison by Production Process Analysis (2016-2032)
- Table 52: Eastern Europe Liquid Nitrogen Market Comparison by End-User Industry Analysis (2016-2032)
- Table 53: Eastern Europe Liquid Nitrogen Market Comparison by (2016-2032)
- Table 54: Eastern Europe Liquid Nitrogen Market Revenue (US$ Mn) Comparison by Country (2016-2032)
- Table 55: Eastern Europe Liquid Nitrogen Market Revenue (US$ Mn) (2016-2032)
- Table 56: Eastern Europe Liquid Nitrogen Market Revenue (US$ Mn) Comparison by Country (2016-2032)
- Table 57: Eastern Europe Liquid Nitrogen Market Revenue (US$ Mn) Comparison by Production Process Analysis (2016-2032)
- Table 58: Eastern Europe Liquid Nitrogen Market Revenue (US$ Mn) Comparison by End-User Industry Analysis (2016-2032)
- Table 59: Eastern Europe Liquid Nitrogen Market Revenue (US$ Mn) Comparison by (2016-2032)
- Table 60: Eastern Europe Liquid Nitrogen Market Y-o-Y Growth Rate Comparison by Country (2016-2032)
- Table 61: Eastern Europe Liquid Nitrogen Market Y-o-Y Growth Rate Comparison by Production Process Analysis (2016-2032)
- Table 62: Eastern Europe Liquid Nitrogen Market Y-o-Y Growth Rate Comparison by End-User Industry Analysis (2016-2032)
- Table 63: Eastern Europe Liquid Nitrogen Market Y-o-Y Growth Rate Comparison by (2016-2032)
- Table 64: Eastern Europe Liquid Nitrogen Market Share Comparison by Country (2016-2032)
- Table 65: Eastern Europe Liquid Nitrogen Market Share Comparison by Production Process Analysis (2016-2032)
- Table 66: Eastern Europe Liquid Nitrogen Market Share Comparison by End-User Industry Analysis (2016-2032)
- Table 67: Eastern Europe Liquid Nitrogen Market Share Comparison by (2016-2032)
- Table 68: APAC Liquid Nitrogen Market Comparison by Production Process Analysis (2016-2032)
- Table 69: APAC Liquid Nitrogen Market Comparison by End-User Industry Analysis (2016-2032)
- Table 70: APAC Liquid Nitrogen Market Comparison by (2016-2032)
- Table 71: APAC Liquid Nitrogen Market Revenue (US$ Mn) Comparison by Country (2016-2032)
- Table 72: APAC Liquid Nitrogen Market Revenue (US$ Mn) (2016-2032)
- Table 73: APAC Liquid Nitrogen Market Revenue (US$ Mn) Comparison by Country (2016-2032)
- Table 74: APAC Liquid Nitrogen Market Revenue (US$ Mn) Comparison by Production Process Analysis (2016-2032)
- Table 75: APAC Liquid Nitrogen Market Revenue (US$ Mn) Comparison by End-User Industry Analysis (2016-2032)
- Table 76: APAC Liquid Nitrogen Market Revenue (US$ Mn) Comparison by (2016-2032)
- Table 77: APAC Liquid Nitrogen Market Y-o-Y Growth Rate Comparison by Country (2016-2032)
- Table 78: APAC Liquid Nitrogen Market Y-o-Y Growth Rate Comparison by Production Process Analysis (2016-2032)
- Table 79: APAC Liquid Nitrogen Market Y-o-Y Growth Rate Comparison by End-User Industry Analysis (2016-2032)
- Table 80: APAC Liquid Nitrogen Market Y-o-Y Growth Rate Comparison by (2016-2032)
- Table 81: APAC Liquid Nitrogen Market Share Comparison by Country (2016-2032)
- Table 82: APAC Liquid Nitrogen Market Share Comparison by Production Process Analysis (2016-2032)
- Table 83: APAC Liquid Nitrogen Market Share Comparison by End-User Industry Analysis (2016-2032)
- Table 84: APAC Liquid Nitrogen Market Share Comparison by (2016-2032)
- Table 85: Latin America Liquid Nitrogen Market Comparison by Production Process Analysis (2016-2032)
- Table 86: Latin America Liquid Nitrogen Market Comparison by End-User Industry Analysis (2016-2032)
- Table 87: Latin America Liquid Nitrogen Market Comparison by (2016-2032)
- Table 88: Latin America Liquid Nitrogen Market Revenue (US$ Mn) Comparison by Country (2016-2032)
- Table 89: Latin America Liquid Nitrogen Market Revenue (US$ Mn) (2016-2032)
- Table 90: Latin America Liquid Nitrogen Market Revenue (US$ Mn) Comparison by Country (2016-2032)
- Table 91: Latin America Liquid Nitrogen Market Revenue (US$ Mn) Comparison by Production Process Analysis (2016-2032)
- Table 92: Latin America Liquid Nitrogen Market Revenue (US$ Mn) Comparison by End-User Industry Analysis (2016-2032)
- Table 93: Latin America Liquid Nitrogen Market Revenue (US$ Mn) Comparison by (2016-2032)
- Table 94: Latin America Liquid Nitrogen Market Y-o-Y Growth Rate Comparison by Country (2016-2032)
- Table 95: Latin America Liquid Nitrogen Market Y-o-Y Growth Rate Comparison by Production Process Analysis (2016-2032)
- Table 96: Latin America Liquid Nitrogen Market Y-o-Y Growth Rate Comparison by End-User Industry Analysis (2016-2032)
- Table 97: Latin America Liquid Nitrogen Market Y-o-Y Growth Rate Comparison by (2016-2032)
- Table 98: Latin America Liquid Nitrogen Market Share Comparison by Country (2016-2032)
- Table 99: Latin America Liquid Nitrogen Market Share Comparison by Production Process Analysis (2016-2032)
- Table 100: Latin America Liquid Nitrogen Market Share Comparison by End-User Industry Analysis (2016-2032)
- Table 101: Latin America Liquid Nitrogen Market Share Comparison by (2016-2032)
- Table 102: Middle East & Africa Liquid Nitrogen Market Comparison by Production Process Analysis (2016-2032)
- Table 103: Middle East & Africa Liquid Nitrogen Market Comparison by End-User Industry Analysis (2016-2032)
- Table 104: Middle East & Africa Liquid Nitrogen Market Comparison by (2016-2032)
- Table 105: Middle East & Africa Liquid Nitrogen Market Revenue (US$ Mn) Comparison by Country (2016-2032)
- Table 106: Middle East & Africa Liquid Nitrogen Market Revenue (US$ Mn) (2016-2032)
- Table 107: Middle East & Africa Liquid Nitrogen Market Revenue (US$ Mn) Comparison by Country (2016-2032)
- Table 108: Middle East & Africa Liquid Nitrogen Market Revenue (US$ Mn) Comparison by Production Process Analysis (2016-2032)
- Table 109: Middle East & Africa Liquid Nitrogen Market Revenue (US$ Mn) Comparison by End-User Industry Analysis (2016-2032)
- Table 110: Middle East & Africa Liquid Nitrogen Market Revenue (US$ Mn) Comparison by (2016-2032)
- Table 111: Middle East & Africa Liquid Nitrogen Market Y-o-Y Growth Rate Comparison by Country (2016-2032)
- Table 112: Middle East & Africa Liquid Nitrogen Market Y-o-Y Growth Rate Comparison by Production Process Analysis (2016-2032)
- Table 113: Middle East & Africa Liquid Nitrogen Market Y-o-Y Growth Rate Comparison by End-User Industry Analysis (2016-2032)
- Table 114: Middle East & Africa Liquid Nitrogen Market Y-o-Y Growth Rate Comparison by (2016-2032)
- Table 115: Middle East & Africa Liquid Nitrogen Market Share Comparison by Country (2016-2032)
- Table 116: Middle East & Africa Liquid Nitrogen Market Share Comparison by Production Process Analysis (2016-2032)
- Table 117: Middle East & Africa Liquid Nitrogen Market Share Comparison by End-User Industry Analysis (2016-2032)
- Table 118: Middle East & Africa Liquid Nitrogen Market Share Comparison by (2016-2032)
- 1. Executive Summary
-
- The Linde Group
- Refrigeration & Oxygen Company Limited
- Air Liquide
- Gulf Cryo
- Air Products and Chemicals, Inc.
- Messer Group GmbH
- SOUTHERN INDUSTRIAL GAS SDN. BHD.
- TAIYO NIPPON SANSO CORPORATION
- Asia Technical Gas Co Pte Ltd
- BUZWAIR INDUSTRIAL GASES FACTORIES
Our Clients


View Our Licence Options
