
Knitwear Market Report By Product Type (Innerwear, T-Shirts & Shirts, Sweaters & Jackets, Sweatshirts & Hoodies, and Others), By Material Type (Natural, Synthetic, Blended, Others), By End-User, Distribution Channel , By Region And Companies - Industry Segment Outlook, Market Assessment, Competition Scenario, Trends And Forecast 2024-2033
-
44382
-
May 2023
-
199
-


-
This report was compiled by Research Team Research team of over 50 passionate professionals leverages advanced research methodologies and analytical expertise to deliver insightful, data-driven market intelligence that empowers businesses across diverse industries to make strategic, well-informed Correspondence Research Team Linkedin | Detailed Market research Methodology Our methodology involves a mix of primary research, including interviews with leading mental health experts, and secondary research from reputable medical journals and databases. View Detailed Methodology Page
-
Quick Navigation
Report Overview
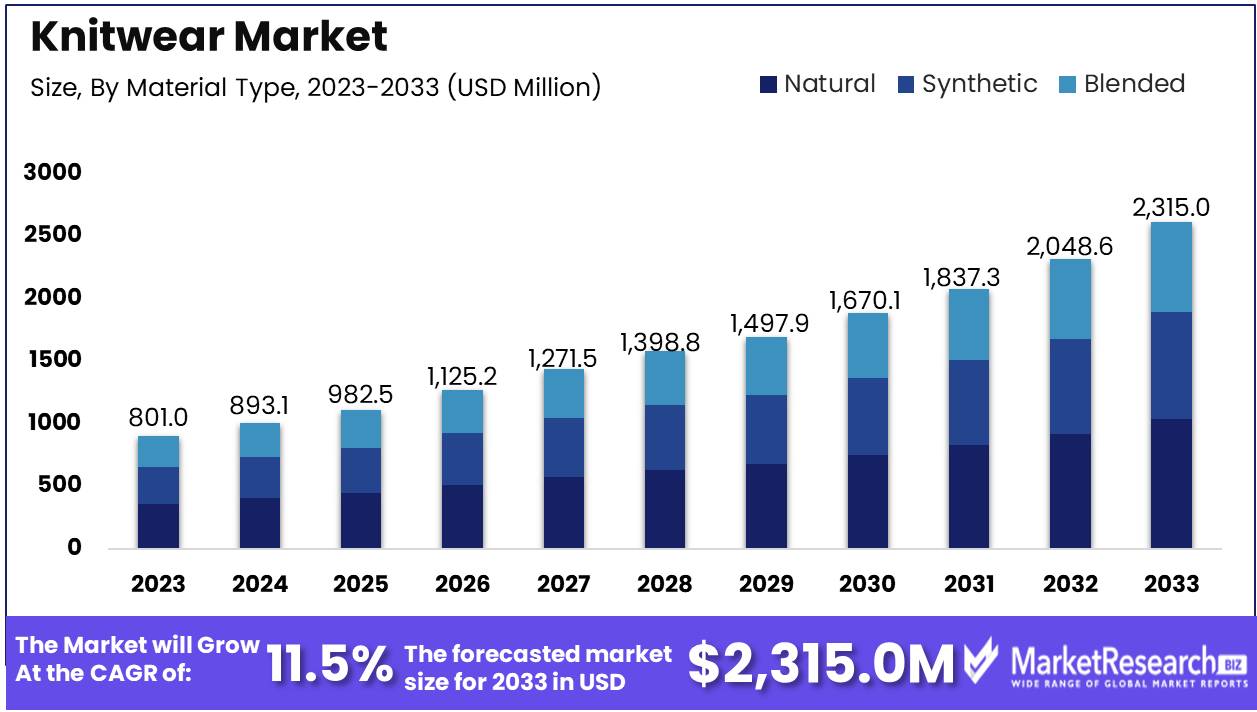
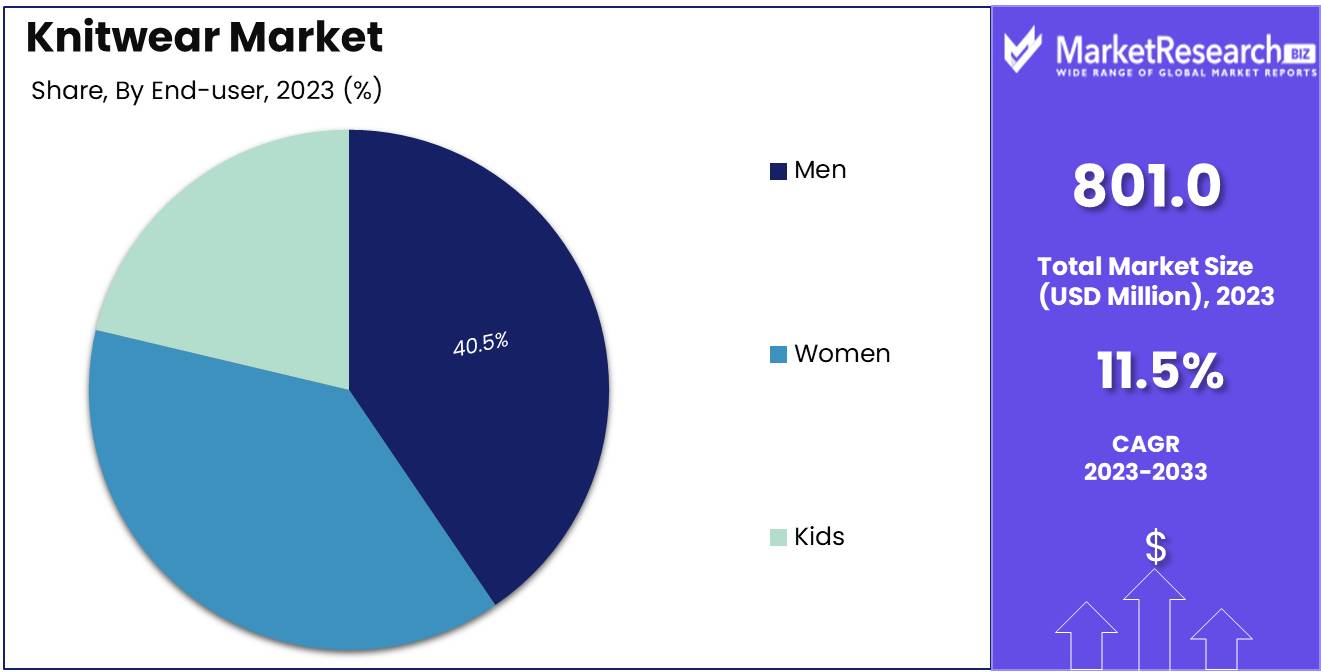
The Knitwear Market was valued at USD 801.0 million in 2023. It is expected to reach USD 2,315.0 million in 2033, with a CAGR of 11.5 % during the forecast period from 2024 to 2033.
The Knitwear Market is a dynamic and multifaceted sector that plays a significant role in the global apparel industry. Product offerings in this market include sweaters, cardigans, knit tops, dresses, and other accessories available in men, women, and children categories, so their scope is quite broad. The Activity thus in the market would come from the fusion between traditional craftsmanship with contemporary or modern technical innovations, hence a space of growth and creativity.
The knitwear market is undergoing a major shift, highlighted by key investments and partnerships that showcase the industry's changing landscape and potential for future growth. For instance, in 2023, Fakir Knitwear Limited announced a significant move with a $45.82 million investment to build a new knit composite factory in Bangabandhu Sheikh Mujib Shilpa Nagar (BSMSN), Chattogram. This decision reflects a larger trend towards increasing production capacity and enhancing the integration of different processes within the knitwear sector.
In another development, Ramp Knitwear and similar companies successfully raised over $32.9 million through two rounds of funding in 2024, involving three investors. This influx of funds highlights the industry's appeal to investors and its readiness for innovation and expansion. Moreover, the collaboration between Danish fashion brand Object and recycling pioneer Sodra Group in 2024 to create a knitwear line partly made from textile waste marks a significant step towards sustainable practices and innovation in materials within the knitwear market.
Technological progress is also a key theme, as seen with the introduction of Autarkic Direct Feeding (ADF) machines by Stoll. These machines bring new possibilities for flexibility and creativity in knitwear design, showing a strong push towards innovation. This is happening in a market that's being shaped by various factors, such as changing fashion trends, the impact of seasons, new materials, cultural and lifestyle shifts, and changes in consumer demographics.
These developments collectively signal a knitwear market that's not just growing and becoming more diverse, but also moving towards sustainability, technological advancement, and a stronger focus on meeting consumer needs. This creates a rich landscape for strategic investments and partnerships, offering a way to leverage new opportunities and tackle the challenges in an ever-evolving market environment.
Key Takeaways
- Market Growth - In 2023, the value of the Knitwear Market was $801.0 million. It's projected to grow to $2,315.0 million by 2033, experiencing an annual growth rate of 25.4% from 2024 to 2033.
- Analyst view Point - The knitwear market is experiencing transformative growth through strategic investments, technological innovation, and a shift towards sustainable practices.
- Product Type: Sweatshirts & Hoodies dominate the knitwear market, commanding a 35.2% share, reflecting a strong consumer preference for casual and versatile attire.
- Material Type : Natural fibers dominate the knitwear market with a commanding 48.5% share, underscoring a consumer shift towards eco-friendly and sustainable materials.
- End-user : The men segment dominates the knitwear market with a 40.5% share, driven by increasing demand for versatile and comfortable apparel
- Regional Dominance: The Asia-Pacific region dominates the knitwear market with a 45.32% share, driven by its robust manufacturing capabilities and expanding consumer base.
- Growth Opportunity: Rising demand in developing countries and the expansion of e-commerce are key growth drivers for the knitwear market, with digital platforms expected to play a crucial role in reaching a broader consumer base in 2024.
Driving Factor
Fashion Trends Drive Market Growth
Fashion trends are a pivotal force propelling the knitwear market forward. As the global fashion landscape evolves, so does consumer demand for knitwear that aligns with the latest styles, colors, and designs. This constant flux encourages innovation among knitwear manufacturers and designers, who strive to incorporate contemporary fashion elements into their products. The influence of fashion trends is not just about aesthetics; it also involves the integration of new fabrics and knitting technologies to create pieces that are not only stylish but also comfortable and functional.
Cultural and Lifestyle Influences Reshape Market Contours
The knitwear market is deeply influenced by cultural and lifestyle trends, reflecting broader societal shifts towards casual, comfortable, and sustainable clothing. The rise of remote work, for instance, has amplified the demand for cozy, versatile knitwear suitable for both home and office settings, illustrating how lifestyle changes directly impact market dynamics.
Moreover, the increasing consumer consciousness around ethical and sustainable fashion has pushed brands to adopt eco-friendly practices and materials, resonating with a growing segment of the market. These cultural shifts not only shape product design and marketing strategies but also foster a more engaged and loyal customer base, driving growth through a strong alignment with consumer values and expectations.
Material Innovation Shapes Market Dynamics
Material innovation stands at the core of the knitwear market's evolution, offering new opportunities for differentiation and value addition. Advances in textile technology have led to the development of high-performance, sustainable, and versatile yarns, revolutionizing product offerings. These innovations meet a growing consumer demand for durability, comfort, and eco-friendliness, attributes increasingly sought after in the fashion industry.
The integration of smart textiles, capable of temperature regulation, moisture management, and even health monitoring, further exemplifies how material innovation not only caters to aesthetic preferences but also functional needs. This convergence of fashion, functionality, and sustainability through material innovation significantly contributes to market growth, appealing to a broader consumer base looking for products that align with their values and lifestyle needs.
Retraining Factors
Fluctuating Raw Materials Prices Retraining Market Growth
The volatility of raw material prices significantly restraints the growth of the knitwear market. Costs of essential materials like cotton, nylon, rayon, and polyester are closely tied to global commodities markets, including crude oil prices, and are subject to natural fluctuations in conditions such as rainfall, humidity, and solar radiation. These fluctuations can lead to unpredictability in production costs, impacting the bottom line for knitwear manufacturers. When raw material costs rise, manufacturers may be forced to increase product prices, potentially reducing consumer demand.
Moreover, smaller players in the market, with less capacity to absorb cost increases, may find it particularly challenging to compete, leading to reduced diversity within the market. The interplay between raw material cost volatility and market dynamics underscores a complex relationship where manufacturers must navigate price sensitivities while striving to maintain quality and innovation in a competitive landscape.
Limited Supply of Raw Materials and Costly Production Processes Retraining Market Growth
The knitwear market's growth is further restrained by the limited availability of certain high-demand raw materials, such as cashmere wool, and the intricate, often costly, production processes involved. Cashmere wool, known for its softness, warmth, and lightweight properties, is highly sought after in the knitwear industry. However, its production involves extensive labor and resource inputs, from the careful rearing of cashmere goats to the delicate processing of their wool.
This limited supply, coupled with high demand, drives up costs, making cashmere products more expensive and less accessible to a broader market segment. The challenge is exacerbated for manufacturers striving to balance cost-efficiency with the growing consumer demand for sustainable and ethically produced goods. This constraint not only affects pricing and accessibility but also influences market competition and innovation, as brands seek alternative materials and production methods that offer similar quality without the associated high costs and supply limitations.
Product Type Analysis
In 2023, Sweatshirts & Hoodies held a dominant market position in the Product Type segment of the knitwear market, capturing more than a 35.2% share. This significant market share can be attributed to the growing consumer preference for casual and comfortable clothing, bolstered by the rise of remote working and the increasing popularity of athleisure trends. The versatility and functionality of sweatshirts and hoodies, catering to both fitness enthusiasts and those seeking comfort in day-to-day wear, have positioned them as staple items in consumers' wardrobes.
Following closely, T-Shirts & Shirts accounted for a 22.3% share of the market, driven by the universal appeal of these garments. Their ease of integration into various styles, from casual to semi-formal, along with the vast array of designs and materials available, has solidified their position within the knitwear sector.
Sweaters & Jackets constituted a 17.8% share, reflecting their essential role in colder climates and transitional seasons. Innovations in materials and knitting techniques have expanded their appeal beyond just warmth and comfort, incorporating fashion-forward designs that cater to a broad demographic.
The Innerwear segment, though more niche, captured a 10.1% share, emphasizing the importance of comfort, fabric quality, and durability in consumer choices for foundational garments. This segment's growth is also influenced by increasing awareness and demand for sustainable and ethically produced knitwear.
Shorts & Trousers, Evening Dresses, Suits, & Leggings, and Other Accessories collectively accounted for the remaining 14.6% of the market share. These segments benefit from seasonal trends, evolving fashion preferences, and the expansion of knitwear into formal and occasion wear, demonstrating the versatility and adaptability of knit fabrics across various apparel categories.
Material Type Analysis
In 2023, Natural Material held a dominant market position in the Material Type segment of the knitwear market, capturing more than a 48.5% share. This prominence underscores a growing consumer inclination towards sustainability and eco-friendliness, with natural materials like cotton, wool, and silk being highly prized for their comfort, breath ability, and biodegradability. The push towards environmentally responsible fashion has significantly influenced this shift, with both consumers and brands prioritizing materials that offer lower environmental footprints without compromising on quality and durability.
Synthetic fibers followed closely, accounting for a 31.7% share of the market. The popularity of synthetic materials such as polyester, nylon, and acrylic can be attributed to their durability, ease of maintenance, and versatility in design and coloration.
Blended materials, combining the best of both natural and synthetic fibers, captured a 19.8% share of the market. This segment benefits from the synergistic qualities of blended fibers, such as enhanced durability, improved texture, and added functionality .
End-user Analysis
In 2023, Men held a dominant market position in the End-user segment of the knitwear market, capturing more than a 40.5% share. This significant portion of the market can be attributed to the expanding range of knitwear options catering to men's fashion, combining functionality with style. The growth in this segment reflects a broader trend towards casual, versatile clothing that suits various occasions, from office wear to leisure activities. The increased focus on comfort, coupled with the rising interest in fashion among men, has contributed to the expansion of knitwear products tailored to their needs, including sweaters, cardigans, and knit-based activewear.
Women constituted a close second, accounting for 38.2% of the market share. The women's segment benefits from a wide variety of styles, patterns, and innovations in knitwear, ranging from everyday essentials to high-fashion items.
Kids' knitwear captured a 21.3% share, underlining the importance of durability, comfort, and ease of care in clothing for this demographic. The segment's growth is fueled by the parents' desire for high-quality, versatile knitwear that withstands the active lifestyle of children while being gentle on their sensitive skin.
Key Market Segments
Product Type
- Innerwear
- T-Shirts & Shirts
- Sweaters & Jackets
- Sweatshirts & Hoodies
- Shorts & Trousers
- Evening Dresses, Suits, & Leggings
- Other Accessories
Material Type
- Natural
- Synthetic
- Blended
End-user
- Men
- Women
- Kids
Distribution Channel
- Online
- Offline
Growth Opportunities
Emerging Markets Driving Demand
One of the most significant opportunities for the knitwear market in 2024 lies in the rising demand from developing countries. As economies grow, so does the middle class, bringing with it increased disposable income and a keen interest in fashion. This demographic shift presents a vast potential customer base for knitwear products, particularly in regions experiencing rapid urbanization and Westernization of consumer tastes. Brands that can tap into these markets with tailored marketing strategies and localized product offerings stand to gain a substantial foothold.
E-Commerce Expansion
The increasing penetration of the e-commerce industry offers another lucrative avenue for knitwear market growth. Online retail platforms provide an accessible, wide-reaching channel for brands to connect with consumers globally, breaking down traditional geographical and logistical barriers. In 2024, leveraging digital marketing and e-commerce platforms will be crucial for knitwear brands aiming to expand their reach and capitalize on the convenience and personalized shopping experiences that online retail offers.
Trends Analysis
Embracing Sustainability and Eco-Friendly Practices
As we move into 2024, sustainability is not just a trend but a cornerstone of the knitwear market's evolution. Brands are increasingly committing to eco-friendly practices, from sourcing sustainable materials to implementing energy-efficient production methods. This shift is driven by a growing consumer awareness of environmental issues and a demand for products that align with greener lifestyles. The use of organic fibers, recycling of textile waste, and reduction of water and chemical use in manufacturing processes are becoming standard practices, as both consumers and companies prioritize the planet's health alongside product quality.
Integration of Smart Fabrics
The knitwear market is set to be revolutionized by the incorporation of smart fabrics, which blend traditional comfort and warmth with cutting-edge technology. In 2024, expect to see knitwear items embedded with sensors and wearable technology, offering functionalities such as temperature regulation, health monitoring, and even connectivity to smartphones and other devices. This trend caters to a tech-savvy consumer base that values functionality and innovation, opening up new possibilities for knitwear in sports, healthcare, and everyday fashion.
Regional analysis
Asia-Pacific: The Leading knitwear Market Share with 45.32% Share: Dominating the global landscape, Asia-Pacific's stronghold in the knitwear market is unmistakable, holding a 45.32% share. This dominance is largely fueled by the powerhouse economies of China and India, both of which are key players in textile manufacturing and exportation. The region benefits from advanced production capabilities, cost efficiencies, and a rapidly expanding middle class with increasing disposable incomes, particularly in countries like South Korea and those within the ASEAN group. The diversity in fashion trends across these countries further propels market growth, making Asia-Pacific a crucial region for knitwear sales and innovation.
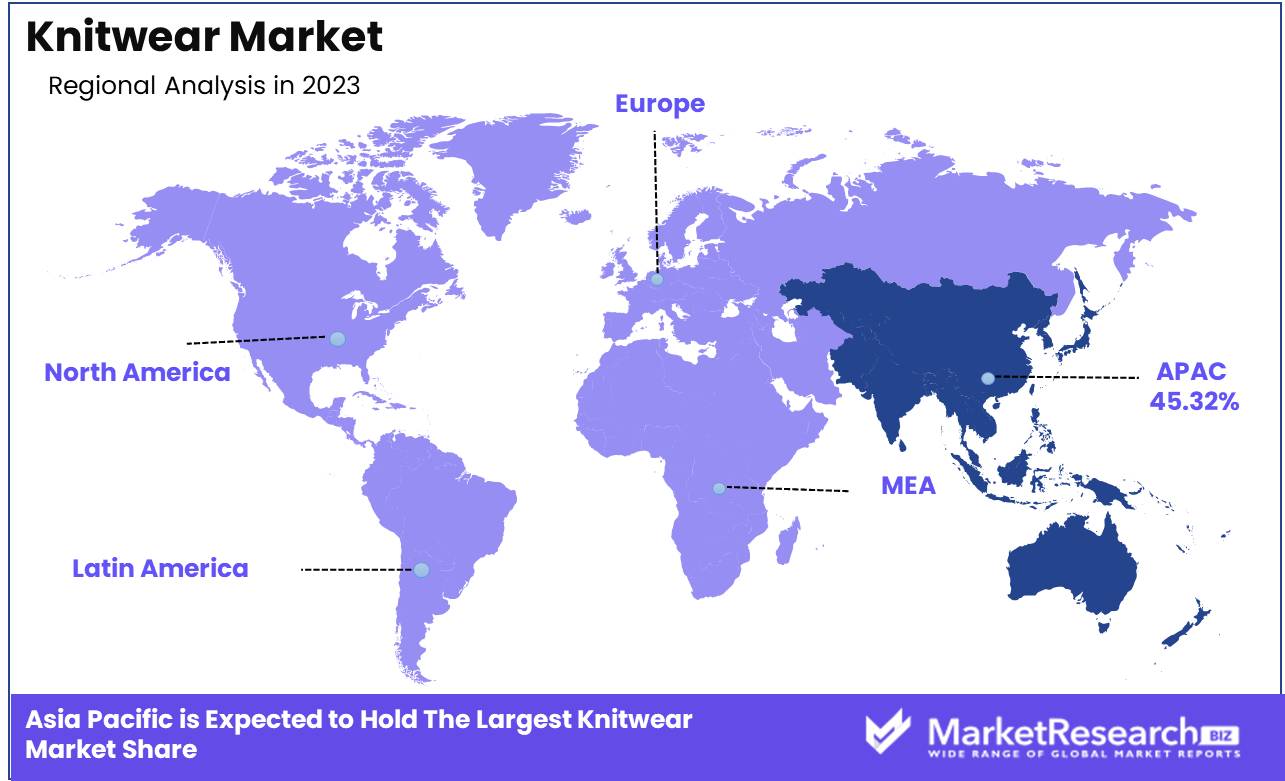
North America: A Hub of Innovation and Sustainability: In North America, the US and Canada represent significant markets, characterized by a strong demand for high-quality, sustainable knitwear. The region's consumers show a pronounced preference for eco-friendly and ethically produced garments, driving brands to focus on sustainable practices. The presence of both established and emerging designers, particularly in the US, adds to the region's reputation for innovative and trend-setting knitwear designs.
Europe: Tradition and Luxury Define the Market: Europe's knitwear market is deeply rooted in a rich tradition of textile craftsmanship, with countries like Italy and France being synonymous with luxury knitwear.
Latin America: Emerging with Vibrant Potential: Latin America, led by Brazil and Mexico, is emerging as a vibrant market for knitwear, thanks to its growing fashion industry and increasing consumer spending power.
Middle East & Africa: Luxury and Expanding Markets: The Middle East, particularly the GCC countries, represents a niche but lucrative knitwear Industry, characterized by a demand for luxury and high-end knitwear products.
Key Regions and Countries
North America
- US
- Canada
- Mexico
Western Europe
- Germany
- France
- The UK
- Spain
- Italy
- Portugal
- Ireland
- Austria
- Switzerland
- Benelux
- Nordic
- Rest of Western Europe
Eastern Europe
- Russia
- Poland
- The Czech Republic
- Greece
- Rest of Eastern Europe
APAC
- China
- Japan
- South Korea
- India
- Australia & New Zealand
- Indonesia
- Malaysia
- Philippines
- Singapore
- Thailand
- Vietnam
- Rest of APAC
Latin America
- Brazil
- Colombia
- Chile
- Argentina
- Costa Rica
- Rest of Latin America
Middle East & Africa
- Algeria
- Egypt
- Israel
- Kuwait
- Nigeria
- Saudi Arabia
- South Africa
- Turkey
- United Arab Emirates
- Rest of MEA
Key Players Analysis
In the dynamic landscape of the 2024 global knitwear market, key players are poised to leverage their unique strengths and strategic initiatives to navigate the evolving consumer preferences and technological advancements. Among these, Adidas AG and Puma SE, both hailing from Germany, stand out for their strong foothold in the sportswear segment, continuously innovating with smart fabrics and sustaainable materials to meet the growing demand for eco-friendly and high-performance knitwear. Their commitment to sustainability and innovation aligns closely with the market's shift towards environmentally responsible fashion.
Gildan Activewear Inc is another significant contender, known for its vast range of casual and activewear. The company's focus on ethical manufacturing and supply chain transparency resonates well with the increasing consumer demand for brands with strong corporate social responsibility.
Italian luxury brands like Loro Piana S.p.A. and Maglificio Ripa S.p.a stand at the forefront of the high-end segment, offering exquisite knitwear that combines traditional craftsmanship with modern aesthetics. Their emphasis on quality and heritage appeals to a niche market that values artisanal luxury.
In the U.S., Ralph Lauren and Nike Inc. continue to be key players, with their iconic designs and broad market appeal. Ralph Lauren's classic American styling and Nike's innovation in athletic knitwear offer diverse choices to consumers across various segments.
The U.K. 's Marks and Spencer Group plc and Hackett Ltd are notable for their blend of quality, value, and style, catering to a wide audience with their extensive knitwear collections.
Emerging players like Ecowool from New Zealand and Sana Hastakala (P) Ltd. from Nepal are carving out niches with their focus on sustainable, locally sourced wool and artisanal craftsmanship, appealing to the global market's growing appetite for ethically produced and unique knitwear.
As we look to 2024, these key players, with their diverse strategies and market positioning, are set to drive the global knitwear market forward, navigating challenges and seizing opportunities in a rapidly changing fashion landscape.
Top Key Players in Knitwear Market
- Adidas AG (Germany)
- Gildan Activewear Inc
- Loro Piana S.p.A. (Italy)
- Puma SE (Germany)
- Ralph Lauren (U.S.)
- The Nautical Company (UK) Ltd
- Victoria's Secret (the USA)
- Maglificio Ripa S.p.a (Italy)
- LENZING AG (Austria)
- Ecowool (New Zealand)
- Sana Hastakala (P) Ltd. (Nepal)
- THE GAP, INC (U.S.)
- Hackett Ltd (London)
- Marks and Spencer Group plc. (U.K)
- Nike Inc., (U.S.)
Recent Developments
- In 2023, Fakir Knitwear Limited plans to spend around $45.82 million to build a new factory at Bangabandhu Sheikh Mujib Shilpa Nagar in Mirsarai, Chattogram.
- In 2024, Ramp Knitwear and some other companies together got more than $32.9 million from two rounds of investment from three different investors.
- In 2024, the Danish fashion company Object, which is part of Bestseller, teamed up with the recycling company Sodra Group to create a new line of knitwear that includes materials made from recycled textiles.
- In 2023, a new type of knitting machine called Autarkic Direct Feeding (ADF) was introduced by Stoll. These machines can work with yarn in a more flexible way, allowing for more creative knitting designs.
Report Scope
Report Features Description Market Value (2023) USD 801.0 Million Forecast Revenue (2033) USD 2,315.0 Million CAGR (2024-2033) 11.5% Base Year for Estimation 2023 Historic Period 2018-2023 Forecast Period 2024-2033 Report Coverage Revenue Forecast, Market Dynamics, Competitive Landscape, Recent Developments Segments Covered Product Type (Innerwear, T-Shirts & Shirts, Sweaters & Jackets, Sweatshirts & Hoodies, Shorts & Trousers, Evening Dresses, Suits, & Leggings, Other Accessories), Material Type (Natural, Synthetic, Blended), End-user (Men, Women, Kids), Distribution Channel (Online, Offline) Regional Analysis North America - The US, Canada, & Mexico; Western Europe - Germany, France, The UK, Spain, Italy, Portugal, Ireland, Austria, Switzerland, Benelux, Nordic, & Rest of Western Europe; Eastern Europe - Russia, Poland, The Czech Republic, Greece, & Rest of Eastern Europe; APAC - China, Japan, South Korea, India, Australia & New Zealand, Indonesia, Malaysia, Philippines, Singapore, Thailand, Vietnam, & Rest of APAC; Latin America - Brazil, Colombia, Chile, Argentina, Costa Rica, & Rest of Latin America; Middle East & Africa - Algeria, Egypt, Israel, Kuwait, Nigeria, Saudi Arabia, South Africa, Turkey, United Arab Emirates, & Rest of MEA Competitive Landscape Adidas AG (Germany), Gildan Activewear Inc, Loro Piana S.p.A. (Italy), Puma SE (Germany), Ralph Lauren (U.S.), The Nautical Company (UK) Ltd, Victoria's Secret (the USA), Maglificio Ripa S.p.a (Italy), LENZING AG (Austria), Ecowool (New Zealand), Sana Hastakala (P) Ltd. (Nepal), THE GAP, INC (U.S.), Hackett Ltd (London), Marks and Spencer Group plc. (U.K), Nike Inc., (U.S.) Customization Scope Customization for segments, region/country-level will be provided. Moreover, additional customization can be done based on the requirements. Purchase Options We have three licenses to opt for: Single User License, Multi-User License (Up to 5 Users), Corporate Use License (Unlimited User and Printable PDF) -
- 1. Executive Summary
- 1.1. Definition
- 1.2. Taxonomy
- 1.3. Research Scope
- 1.4. Key Analysis
- 1.5. Key Findings by Major Segments
- 1.6. Top strategies by Major Players
- 2. Global Knitwear Market Overview
- 2.1. Knitwear Market Dynamics
- 2.1.1. Drivers
- 2.1.2. Opportunities
- 2.1.3. Restraints
- 2.1.4. Challenges
- 2.2. Macro-economic Factors
- 2.3. Regulatory Framework
- 2.4. Market Investment Feasibility Index
- 2.5. PEST Analysis
- 2.6. PORTER’S Five Force Analysis
- 2.7. Drivers & Restraints Impact Analysis
- 2.8. Industry Chain Analysis
- 2.9. Cost Structure Analysis
- 2.10. Marketing Strategy
- 2.11. Russia-Ukraine War Impact Analysis
- 2.12. Opportunity Map Analysis
- 2.13. Market Competition Scenario Analysis
- 2.14. Product Life Cycle Analysis
- 2.15. Opportunity Orbits
- 2.16. Manufacturer Intensity Map
- 2.17. Major Companies sales by Value & Volume
- 2.1. Knitwear Market Dynamics
- 3. Global Knitwear Market Analysis, Opportunity and Forecast, 2016-2032
- 3.1. Global Knitwear Market Analysis, 2016-2021
- 3.2. Global Knitwear Market Opportunity and Forecast, 2023-2032
- 3.3. Global Knitwear Market Analysis, Opportunity and Forecast, By Product Type, 2016-2032
- 3.3.1. Global Knitwear Market Analysis by Product Type: Introduction
- 3.3.2. Market Size Absolute $ Opportunity Analysis and Forecast, By Product Type, 2016-2032
- 3.3.3. Innerwear
- 3.3.4. T-Shirts & Shirts
- 3.3.5. Sweaters & Jackets
- 3.3.6. Sweatshirts & Hoodies
- 3.3.7. Shorts & Trousers
- 3.3.8. Evening Dresses, Suits, & Leggings
- 3.3.9. Other Accessories
- 3.4. Global Knitwear Market Analysis, Opportunity and Forecast, By Material Type, 2016-2032
- 3.4.1. Global Knitwear Market Analysis by Material Type: Introduction
- 3.4.2. Market Size Absolute $ Opportunity Analysis and Forecast, By Material Type, 2016-2032
- 3.4.3. Natural
- 3.4.4. Synthetic
- 3.4.5. Blended
- 3.5. Global Knitwear Market Analysis, Opportunity and Forecast, By End-user, 2016-2032
- 3.5.1. Global Knitwear Market Analysis by End-user: Introduction
- 3.5.2. Market Size Absolute $ Opportunity Analysis and Forecast, By End-user, 2016-2032
- 3.5.3. Men
- 3.5.4. Women
- 3.5.5. Kids
- 3.6. Global Knitwear Market Analysis, Opportunity and Forecast, By Distribution Channel, 2016-2032
- 3.6.1. Global Knitwear Market Analysis by Distribution Channel: Introduction
- 3.6.2. Market Size Absolute $ Opportunity Analysis and Forecast, By Distribution Channel, 2016-2032
- 3.6.3. Online
- 3.6.4. Offline
- 4. North America Knitwear Market Analysis, Opportunity and Forecast, 2016-2032
- 4.1. North America Knitwear Market Analysis, 2016-2021
- 4.2. North America Knitwear Market Opportunity and Forecast, 2023-2032
- 4.3. North America Knitwear Market Analysis, Opportunity and Forecast, By Product Type, 2016-2032
- 4.3.1. North America Knitwear Market Analysis by Product Type: Introduction
- 4.3.2. Market Size Absolute $ Opportunity Analysis and Forecast, By Product Type, 2016-2032
- 4.3.3. Innerwear
- 4.3.4. T-Shirts & Shirts
- 4.3.5. Sweaters & Jackets
- 4.3.6. Sweatshirts & Hoodies
- 4.3.7. Shorts & Trousers
- 4.3.8. Evening Dresses, Suits, & Leggings
- 4.3.9. Other Accessories
- 4.4. North America Knitwear Market Analysis, Opportunity and Forecast, By Material Type, 2016-2032
- 4.4.1. North America Knitwear Market Analysis by Material Type: Introduction
- 4.4.2. Market Size Absolute $ Opportunity Analysis and Forecast, By Material Type, 2016-2032
- 4.4.3. Natural
- 4.4.4. Synthetic
- 4.4.5. Blended
- 4.5. North America Knitwear Market Analysis, Opportunity and Forecast, By End-user, 2016-2032
- 4.5.1. North America Knitwear Market Analysis by End-user: Introduction
- 4.5.2. Market Size Absolute $ Opportunity Analysis and Forecast, By End-user, 2016-2032
- 4.5.3. Men
- 4.5.4. Women
- 4.5.5. Kids
- 4.6. North America Knitwear Market Analysis, Opportunity and Forecast, By Distribution Channel, 2016-2032
- 4.6.1. North America Knitwear Market Analysis by Distribution Channel: Introduction
- 4.6.2. Market Size Absolute $ Opportunity Analysis and Forecast, By Distribution Channel, 2016-2032
- 4.6.3. Online
- 4.6.4. Offline
- 4.7. North America Knitwear Market Analysis, Opportunity and Forecast, By Country , 2016-2032
- 4.7.1. North America Knitwear Market Analysis by Country : Introduction
- 4.7.2. Market Size Absolute $ Opportunity Analysis and Forecast, Country , 2016-2032
- 4.7.2.1. The US
- 4.7.2.2. Canada
- 4.7.2.3. Mexico
- 5. Western Europe Knitwear Market Analysis, Opportunity and Forecast, 2016-2032
- 5.1. Western Europe Knitwear Market Analysis, 2016-2021
- 5.2. Western Europe Knitwear Market Opportunity and Forecast, 2023-2032
- 5.3. Western Europe Knitwear Market Analysis, Opportunity and Forecast, By Product Type, 2016-2032
- 5.3.1. Western Europe Knitwear Market Analysis by Product Type: Introduction
- 5.3.2. Market Size Absolute $ Opportunity Analysis and Forecast, By Product Type, 2016-2032
- 5.3.3. Innerwear
- 5.3.4. T-Shirts & Shirts
- 5.3.5. Sweaters & Jackets
- 5.3.6. Sweatshirts & Hoodies
- 5.3.7. Shorts & Trousers
- 5.3.8. Evening Dresses, Suits, & Leggings
- 5.3.9. Other Accessories
- 5.4. Western Europe Knitwear Market Analysis, Opportunity and Forecast, By Material Type, 2016-2032
- 5.4.1. Western Europe Knitwear Market Analysis by Material Type: Introduction
- 5.4.2. Market Size Absolute $ Opportunity Analysis and Forecast, By Material Type, 2016-2032
- 5.4.3. Natural
- 5.4.4. Synthetic
- 5.4.5. Blended
- 5.5. Western Europe Knitwear Market Analysis, Opportunity and Forecast, By End-user, 2016-2032
- 5.5.1. Western Europe Knitwear Market Analysis by End-user: Introduction
- 5.5.2. Market Size Absolute $ Opportunity Analysis and Forecast, By End-user, 2016-2032
- 5.5.3. Men
- 5.5.4. Women
- 5.5.5. Kids
- 5.6. Western Europe Knitwear Market Analysis, Opportunity and Forecast, By Distribution Channel, 2016-2032
- 5.6.1. Western Europe Knitwear Market Analysis by Distribution Channel: Introduction
- 5.6.2. Market Size Absolute $ Opportunity Analysis and Forecast, By Distribution Channel, 2016-2032
- 5.6.3. Online
- 5.6.4. Offline
- 5.7. Western Europe Knitwear Market Analysis, Opportunity and Forecast, By Country , 2016-2032
- 5.7.1. Western Europe Knitwear Market Analysis by Country : Introduction
- 5.7.2. Market Size Absolute $ Opportunity Analysis and Forecast, Country , 2016-2032
- 5.7.2.1. Germany
- 5.7.2.2. France
- 5.7.2.3. The UK
- 5.7.2.4. Spain
- 5.7.2.5. Italy
- 5.7.2.6. Portugal
- 5.7.2.7. Ireland
- 5.7.2.8. Austria
- 5.7.2.9. Switzerland
- 5.7.2.10. Benelux
- 5.7.2.11. Nordic
- 5.7.2.12. Rest of Western Europe
- 6. Eastern Europe Knitwear Market Analysis, Opportunity and Forecast, 2016-2032
- 6.1. Eastern Europe Knitwear Market Analysis, 2016-2021
- 6.2. Eastern Europe Knitwear Market Opportunity and Forecast, 2023-2032
- 6.3. Eastern Europe Knitwear Market Analysis, Opportunity and Forecast, By Product Type, 2016-2032
- 6.3.1. Eastern Europe Knitwear Market Analysis by Product Type: Introduction
- 6.3.2. Market Size Absolute $ Opportunity Analysis and Forecast, By Product Type, 2016-2032
- 6.3.3. Innerwear
- 6.3.4. T-Shirts & Shirts
- 6.3.5. Sweaters & Jackets
- 6.3.6. Sweatshirts & Hoodies
- 6.3.7. Shorts & Trousers
- 6.3.8. Evening Dresses, Suits, & Leggings
- 6.3.9. Other Accessories
- 6.4. Eastern Europe Knitwear Market Analysis, Opportunity and Forecast, By Material Type, 2016-2032
- 6.4.1. Eastern Europe Knitwear Market Analysis by Material Type: Introduction
- 6.4.2. Market Size Absolute $ Opportunity Analysis and Forecast, By Material Type, 2016-2032
- 6.4.3. Natural
- 6.4.4. Synthetic
- 6.4.5. Blended
- 6.5. Eastern Europe Knitwear Market Analysis, Opportunity and Forecast, By End-user, 2016-2032
- 6.5.1. Eastern Europe Knitwear Market Analysis by End-user: Introduction
- 6.5.2. Market Size Absolute $ Opportunity Analysis and Forecast, By End-user, 2016-2032
- 6.5.3. Men
- 6.5.4. Women
- 6.5.5. Kids
- 6.6. Eastern Europe Knitwear Market Analysis, Opportunity and Forecast, By Distribution Channel, 2016-2032
- 6.6.1. Eastern Europe Knitwear Market Analysis by Distribution Channel: Introduction
- 6.6.2. Market Size Absolute $ Opportunity Analysis and Forecast, By Distribution Channel, 2016-2032
- 6.6.3. Online
- 6.6.4. Offline
- 6.7. Eastern Europe Knitwear Market Analysis, Opportunity and Forecast, By Country , 2016-2032
- 6.7.1. Eastern Europe Knitwear Market Analysis by Country : Introduction
- 6.7.2. Market Size Absolute $ Opportunity Analysis and Forecast, Country , 2016-2032
- 6.7.2.1. Russia
- 6.7.2.2. Poland
- 6.7.2.3. The Czech Republic
- 6.7.2.4. Greece
- 6.7.2.5. Rest of Eastern Europe
- 7. APAC Knitwear Market Analysis, Opportunity and Forecast, 2016-2032
- 7.1. APAC Knitwear Market Analysis, 2016-2021
- 7.2. APAC Knitwear Market Opportunity and Forecast, 2023-2032
- 7.3. APAC Knitwear Market Analysis, Opportunity and Forecast, By Product Type, 2016-2032
- 7.3.1. APAC Knitwear Market Analysis by Product Type: Introduction
- 7.3.2. Market Size Absolute $ Opportunity Analysis and Forecast, By Product Type, 2016-2032
- 7.3.3. Innerwear
- 7.3.4. T-Shirts & Shirts
- 7.3.5. Sweaters & Jackets
- 7.3.6. Sweatshirts & Hoodies
- 7.3.7. Shorts & Trousers
- 7.3.8. Evening Dresses, Suits, & Leggings
- 7.3.9. Other Accessories
- 7.4. APAC Knitwear Market Analysis, Opportunity and Forecast, By Material Type, 2016-2032
- 7.4.1. APAC Knitwear Market Analysis by Material Type: Introduction
- 7.4.2. Market Size Absolute $ Opportunity Analysis and Forecast, By Material Type, 2016-2032
- 7.4.3. Natural
- 7.4.4. Synthetic
- 7.4.5. Blended
- 7.5. APAC Knitwear Market Analysis, Opportunity and Forecast, By End-user, 2016-2032
- 7.5.1. APAC Knitwear Market Analysis by End-user: Introduction
- 7.5.2. Market Size Absolute $ Opportunity Analysis and Forecast, By End-user, 2016-2032
- 7.5.3. Men
- 7.5.4. Women
- 7.5.5. Kids
- 7.6. APAC Knitwear Market Analysis, Opportunity and Forecast, By Distribution Channel, 2016-2032
- 7.6.1. APAC Knitwear Market Analysis by Distribution Channel: Introduction
- 7.6.2. Market Size Absolute $ Opportunity Analysis and Forecast, By Distribution Channel, 2016-2032
- 7.6.3. Online
- 7.6.4. Offline
- 7.7. APAC Knitwear Market Analysis, Opportunity and Forecast, By Country , 2016-2032
- 7.7.1. APAC Knitwear Market Analysis by Country : Introduction
- 7.7.2. Market Size Absolute $ Opportunity Analysis and Forecast, Country , 2016-2032
- 7.7.2.1. China
- 7.7.2.2. Japan
- 7.7.2.3. South Korea
- 7.7.2.4. India
- 7.7.2.5. Australia & New Zeland
- 7.7.2.6. Indonesia
- 7.7.2.7. Malaysia
- 7.7.2.8. Philippines
- 7.7.2.9. Singapore
- 7.7.2.10. Thailand
- 7.7.2.11. Vietnam
- 7.7.2.12. Rest of APAC
- 8. Latin America Knitwear Market Analysis, Opportunity and Forecast, 2016-2032
- 8.1. Latin America Knitwear Market Analysis, 2016-2021
- 8.2. Latin America Knitwear Market Opportunity and Forecast, 2023-2032
- 8.3. Latin America Knitwear Market Analysis, Opportunity and Forecast, By Product Type, 2016-2032
- 8.3.1. Latin America Knitwear Market Analysis by Product Type: Introduction
- 8.3.2. Market Size Absolute $ Opportunity Analysis and Forecast, By Product Type, 2016-2032
- 8.3.3. Innerwear
- 8.3.4. T-Shirts & Shirts
- 8.3.5. Sweaters & Jackets
- 8.3.6. Sweatshirts & Hoodies
- 8.3.7. Shorts & Trousers
- 8.3.8. Evening Dresses, Suits, & Leggings
- 8.3.9. Other Accessories
- 8.4. Latin America Knitwear Market Analysis, Opportunity and Forecast, By Material Type, 2016-2032
- 8.4.1. Latin America Knitwear Market Analysis by Material Type: Introduction
- 8.4.2. Market Size Absolute $ Opportunity Analysis and Forecast, By Material Type, 2016-2032
- 8.4.3. Natural
- 8.4.4. Synthetic
- 8.4.5. Blended
- 8.5. Latin America Knitwear Market Analysis, Opportunity and Forecast, By End-user, 2016-2032
- 8.5.1. Latin America Knitwear Market Analysis by End-user: Introduction
- 8.5.2. Market Size Absolute $ Opportunity Analysis and Forecast, By End-user, 2016-2032
- 8.5.3. Men
- 8.5.4. Women
- 8.5.5. Kids
- 8.6. Latin America Knitwear Market Analysis, Opportunity and Forecast, By Distribution Channel, 2016-2032
- 8.6.1. Latin America Knitwear Market Analysis by Distribution Channel: Introduction
- 8.6.2. Market Size Absolute $ Opportunity Analysis and Forecast, By Distribution Channel, 2016-2032
- 8.6.3. Online
- 8.6.4. Offline
- 8.7. Latin America Knitwear Market Analysis, Opportunity and Forecast, By Country , 2016-2032
- 8.7.1. Latin America Knitwear Market Analysis by Country : Introduction
- 8.7.2. Market Size Absolute $ Opportunity Analysis and Forecast, Country , 2016-2032
- 8.7.2.1. Brazil
- 8.7.2.2. Colombia
- 8.7.2.3. Chile
- 8.7.2.4. Argentina
- 8.7.2.5. Costa Rica
- 8.7.2.6. Rest of Latin America
- 9. Middle East & Africa Knitwear Market Analysis, Opportunity and Forecast, 2016-2032
- 9.1. Middle East & Africa Knitwear Market Analysis, 2016-2021
- 9.2. Middle East & Africa Knitwear Market Opportunity and Forecast, 2023-2032
- 9.3. Middle East & Africa Knitwear Market Analysis, Opportunity and Forecast, By Product Type, 2016-2032
- 9.3.1. Middle East & Africa Knitwear Market Analysis by Product Type: Introduction
- 9.3.2. Market Size Absolute $ Opportunity Analysis and Forecast, By Product Type, 2016-2032
- 9.3.3. Innerwear
- 9.3.4. T-Shirts & Shirts
- 9.3.5. Sweaters & Jackets
- 9.3.6. Sweatshirts & Hoodies
- 9.3.7. Shorts & Trousers
- 9.3.8. Evening Dresses, Suits, & Leggings
- 9.3.9. Other Accessories
- 9.4. Middle East & Africa Knitwear Market Analysis, Opportunity and Forecast, By Material Type, 2016-2032
- 9.4.1. Middle East & Africa Knitwear Market Analysis by Material Type: Introduction
- 9.4.2. Market Size Absolute $ Opportunity Analysis and Forecast, By Material Type, 2016-2032
- 9.4.3. Natural
- 9.4.4. Synthetic
- 9.4.5. Blended
- 9.5. Middle East & Africa Knitwear Market Analysis, Opportunity and Forecast, By End-user, 2016-2032
- 9.5.1. Middle East & Africa Knitwear Market Analysis by End-user: Introduction
- 9.5.2. Market Size Absolute $ Opportunity Analysis and Forecast, By End-user, 2016-2032
- 9.5.3. Men
- 9.5.4. Women
- 9.5.5. Kids
- 9.6. Middle East & Africa Knitwear Market Analysis, Opportunity and Forecast, By Distribution Channel, 2016-2032
- 9.6.1. Middle East & Africa Knitwear Market Analysis by Distribution Channel: Introduction
- 9.6.2. Market Size Absolute $ Opportunity Analysis and Forecast, By Distribution Channel, 2016-2032
- 9.6.3. Online
- 9.6.4. Offline
- 9.7. Middle East & Africa Knitwear Market Analysis, Opportunity and Forecast, By Country , 2016-2032
- 9.7.1. Middle East & Africa Knitwear Market Analysis by Country : Introduction
- 9.7.2. Market Size Absolute $ Opportunity Analysis and Forecast, Country , 2016-2032
- 9.7.2.1. Algeria
- 9.7.2.2. Egypt
- 9.7.2.3. Israel
- 9.7.2.4. Kuwait
- 9.7.2.5. Nigeria
- 9.7.2.6. Saudi Arabia
- 9.7.2.7. South Africa
- 9.7.2.8. Turkey
- 9.7.2.9. The UAE
- 9.7.2.10. Rest of MEA
- 10. Global Knitwear Market Analysis, Opportunity and Forecast, By Region , 2016-2032
- 10.1. Global Knitwear Market Analysis by Region : Introduction
- 10.2. Market Size Absolute $ Opportunity Analysis and Forecast, By Region , 2016-2032
- 10.2.1. North America
- 10.2.2. Western Europe
- 10.2.3. Eastern Europe
- 10.2.4. APAC
- 10.2.5. Latin America
- 10.2.6. Middle East & Africa
- 11. Global Knitwear Market Competitive Landscape, Market Share Analysis, and Company Profiles
- 11.1. Market Share Analysis
- 11.2. Company Profiles
- 11.3. Adidas AG (Germany)
- 11.3.1. Company Overview
- 11.3.2. Financial Highlights
- 11.3.3. Product Portfolio
- 11.3.4. SWOT Analysis
- 11.3.5. Key Strategies and Developments
- 11.4. Gildan Activewear Inc
- 11.4.1. Company Overview
- 11.4.2. Financial Highlights
- 11.4.3. Product Portfolio
- 11.4.4. SWOT Analysis
- 11.4.5. Key Strategies and Developments
- 11.5. Loro Piana S.p.A. (Italy)
- 11.5.1. Company Overview
- 11.5.2. Financial Highlights
- 11.5.3. Product Portfolio
- 11.5.4. SWOT Analysis
- 11.5.5. Key Strategies and Developments
- 11.6. Puma SE (Germany)
- 11.6.1. Company Overview
- 11.6.2. Financial Highlights
- 11.6.3. Product Portfolio
- 11.6.4. SWOT Analysis
- 11.6.5. Key Strategies and Developments
- 11.7. Ralph Lauren (U.S.)
- 11.7.1. Company Overview
- 11.7.2. Financial Highlights
- 11.7.3. Product Portfolio
- 11.7.4. SWOT Analysis
- 11.7.5. Key Strategies and Developments
- 11.8. The Nautical Company (UK) Ltd
- 11.8.1. Company Overview
- 11.8.2. Financial Highlights
- 11.8.3. Product Portfolio
- 11.8.4. SWOT Analysis
- 11.8.5. Key Strategies and Developments
- 11.9. Victoria's Secret (the USA)
- 11.9.1. Company Overview
- 11.9.2. Financial Highlights
- 11.9.3. Product Portfolio
- 11.9.4. SWOT Analysis
- 11.9.5. Key Strategies and Developments
- 11.10. Maglificio Ripa S.p.a (Italy)
- 11.10.1. Company Overview
- 11.10.2. Financial Highlights
- 11.10.3. Product Portfolio
- 11.10.4. SWOT Analysis
- 11.10.5. Key Strategies and Developments
- 11.11. LENZING AG (Austria)
- 11.11.1. Company Overview
- 11.11.2. Financial Highlights
- 11.11.3. Product Portfolio
- 11.11.4. SWOT Analysis
- 11.11.5. Key Strategies and Developments
- 11.12. Ecowool (New Zealand)
- 11.12.1. Company Overview
- 11.12.2. Financial Highlights
- 11.12.3. Product Portfolio
- 11.12.4. SWOT Analysis
- 11.12.5. Key Strategies and Developments
- 11.13. Sana Hastakala (P) Ltd. (Nepal)
- 11.13.1. Company Overview
- 11.13.2. Financial Highlights
- 11.13.3. Product Portfolio
- 11.13.4. SWOT Analysis
- 11.13.5. Key Strategies and Developments
- 11.14. THE GAP, INC (U.S.)
- 11.14.1. Company Overview
- 11.14.2. Financial Highlights
- 11.14.3. Product Portfolio
- 11.14.4. SWOT Analysis
- 11.14.5. Key Strategies and Developments
- 11.15. Hackett Ltd (London)
- 11.15.1. Company Overview
- 11.15.2. Financial Highlights
- 11.15.3. Product Portfolio
- 11.15.4. SWOT Analysis
- 11.15.5. Key Strategies and Developments
- 11.16. Marks and Spencer Group plc. (U.K)
- 11.16.1. Company Overview
- 11.16.2. Financial Highlights
- 11.16.3. Product Portfolio
- 11.16.4. SWOT Analysis
- 11.16.5. Key Strategies and Developments
- 11.17. Nike Inc., (U.S.)
- 11.17.1. Company Overview
- 11.17.2. Financial Highlights
- 11.17.3. Product Portfolio
- 11.17.4. SWOT Analysis
- 11.17.5. Key Strategies and Developments
- 12. Assumptions and Acronyms
- 13. Research Methodology
- 14. Contact
- List of Figures
- Figure 1: Global Knitwear Market Revenue (US$ Mn) Market Share by Product Type in 2022
- Figure 2: Global Knitwear Market Attractiveness Analysis by Product Type, 2016-2032
- Figure 3: Global Knitwear Market Revenue (US$ Mn) Market Share by Material Typein 2022
- Figure 4: Global Knitwear Market Attractiveness Analysis by Material Type, 2016-2032
- Figure 5: Global Knitwear Market Revenue (US$ Mn) Market Share by End-userin 2022
- Figure 6: Global Knitwear Market Attractiveness Analysis by End-user, 2016-2032
- Figure 7: Global Knitwear Market Revenue (US$ Mn) Market Share by Distribution Channelin 2022
- Figure 8: Global Knitwear Market Attractiveness Analysis by Distribution Channel, 2016-2032
- Figure 9: Global Knitwear Market Revenue (US$ Mn) Market Share by Region in 2022
- Figure 10: Global Knitwear Market Attractiveness Analysis by Region, 2016-2032
- Figure 11: Global Knitwear Market Revenue (US$ Mn) (2016-2032)
- Figure 12: Global Knitwear Market Revenue (US$ Mn) Comparison by Region (2016-2032)
- Figure 13: Global Knitwear Market Revenue (US$ Mn) Comparison by Product Type (2016-2032)
- Figure 14: Global Knitwear Market Revenue (US$ Mn) Comparison by Material Type (2016-2032)
- Figure 15: Global Knitwear Market Revenue (US$ Mn) Comparison by End-user (2016-2032)
- Figure 16: Global Knitwear Market Revenue (US$ Mn) Comparison by Distribution Channel (2016-2032)
- Figure 17: Global Knitwear Market Y-o-Y Growth Rate Comparison by Region (2016-2032)
- Figure 18: Global Knitwear Market Y-o-Y Growth Rate Comparison by Product Type (2016-2032)
- Figure 19: Global Knitwear Market Y-o-Y Growth Rate Comparison by Material Type (2016-2032)
- Figure 20: Global Knitwear Market Y-o-Y Growth Rate Comparison by End-user (2016-2032)
- Figure 21: Global Knitwear Market Y-o-Y Growth Rate Comparison by Distribution Channel (2016-2032)
- Figure 22: Global Knitwear Market Share Comparison by Region (2016-2032)
- Figure 23: Global Knitwear Market Share Comparison by Product Type (2016-2032)
- Figure 24: Global Knitwear Market Share Comparison by Material Type (2016-2032)
- Figure 25: Global Knitwear Market Share Comparison by End-user (2016-2032)
- Figure 26: Global Knitwear Market Share Comparison by Distribution Channel (2016-2032)
- Figure 27: North America Knitwear Market Revenue (US$ Mn) Market Share by Product Typein 2022
- Figure 28: North America Knitwear Market Attractiveness Analysis by Product Type, 2016-2032
- Figure 29: North America Knitwear Market Revenue (US$ Mn) Market Share by Material Typein 2022
- Figure 30: North America Knitwear Market Attractiveness Analysis by Material Type, 2016-2032
- Figure 31: North America Knitwear Market Revenue (US$ Mn) Market Share by End-userin 2022
- Figure 32: North America Knitwear Market Attractiveness Analysis by End-user, 2016-2032
- Figure 33: North America Knitwear Market Revenue (US$ Mn) Market Share by Distribution Channelin 2022
- Figure 34: North America Knitwear Market Attractiveness Analysis by Distribution Channel, 2016-2032
- Figure 35: North America Knitwear Market Revenue (US$ Mn) Market Share by Country in 2022
- Figure 36: North America Knitwear Market Attractiveness Analysis by Country, 2016-2032
- Figure 37: North America Knitwear Market Revenue (US$ Mn) (2016-2032)
- Figure 38: North America Knitwear Market Revenue (US$ Mn) Comparison by Country (2016-2032)
- Figure 39: North America Knitwear Market Revenue (US$ Mn) Comparison by Product Type (2016-2032)
- Figure 40: North America Knitwear Market Revenue (US$ Mn) Comparison by Material Type (2016-2032)
- Figure 41: North America Knitwear Market Revenue (US$ Mn) Comparison by End-user (2016-2032)
- Figure 42: North America Knitwear Market Revenue (US$ Mn) Comparison by Distribution Channel (2016-2032)
- Figure 43: North America Knitwear Market Y-o-Y Growth Rate Comparison by Country (2016-2032)
- Figure 44: North America Knitwear Market Y-o-Y Growth Rate Comparison by Product Type (2016-2032)
- Figure 45: North America Knitwear Market Y-o-Y Growth Rate Comparison by Material Type (2016-2032)
- Figure 46: North America Knitwear Market Y-o-Y Growth Rate Comparison by End-user (2016-2032)
- Figure 47: North America Knitwear Market Y-o-Y Growth Rate Comparison by Distribution Channel (2016-2032)
- Figure 48: North America Knitwear Market Share Comparison by Country (2016-2032)
- Figure 49: North America Knitwear Market Share Comparison by Product Type (2016-2032)
- Figure 50: North America Knitwear Market Share Comparison by Material Type (2016-2032)
- Figure 51: North America Knitwear Market Share Comparison by End-user (2016-2032)
- Figure 52: North America Knitwear Market Share Comparison by Distribution Channel (2016-2032)
- Figure 53: Western Europe Knitwear Market Revenue (US$ Mn) Market Share by Product Typein 2022
- Figure 54: Western Europe Knitwear Market Attractiveness Analysis by Product Type, 2016-2032
- Figure 55: Western Europe Knitwear Market Revenue (US$ Mn) Market Share by Material Typein 2022
- Figure 56: Western Europe Knitwear Market Attractiveness Analysis by Material Type, 2016-2032
- Figure 57: Western Europe Knitwear Market Revenue (US$ Mn) Market Share by End-userin 2022
- Figure 58: Western Europe Knitwear Market Attractiveness Analysis by End-user, 2016-2032
- Figure 59: Western Europe Knitwear Market Revenue (US$ Mn) Market Share by Distribution Channelin 2022
- Figure 60: Western Europe Knitwear Market Attractiveness Analysis by Distribution Channel, 2016-2032
- Figure 61: Western Europe Knitwear Market Revenue (US$ Mn) Market Share by Country in 2022
- Figure 62: Western Europe Knitwear Market Attractiveness Analysis by Country, 2016-2032
- Figure 63: Western Europe Knitwear Market Revenue (US$ Mn) (2016-2032)
- Figure 64: Western Europe Knitwear Market Revenue (US$ Mn) Comparison by Country (2016-2032)
- Figure 65: Western Europe Knitwear Market Revenue (US$ Mn) Comparison by Product Type (2016-2032)
- Figure 66: Western Europe Knitwear Market Revenue (US$ Mn) Comparison by Material Type (2016-2032)
- Figure 67: Western Europe Knitwear Market Revenue (US$ Mn) Comparison by End-user (2016-2032)
- Figure 68: Western Europe Knitwear Market Revenue (US$ Mn) Comparison by Distribution Channel (2016-2032)
- Figure 69: Western Europe Knitwear Market Y-o-Y Growth Rate Comparison by Country (2016-2032)
- Figure 70: Western Europe Knitwear Market Y-o-Y Growth Rate Comparison by Product Type (2016-2032)
- Figure 71: Western Europe Knitwear Market Y-o-Y Growth Rate Comparison by Material Type (2016-2032)
- Figure 72: Western Europe Knitwear Market Y-o-Y Growth Rate Comparison by End-user (2016-2032)
- Figure 73: Western Europe Knitwear Market Y-o-Y Growth Rate Comparison by Distribution Channel (2016-2032)
- Figure 74: Western Europe Knitwear Market Share Comparison by Country (2016-2032)
- Figure 75: Western Europe Knitwear Market Share Comparison by Product Type (2016-2032)
- Figure 76: Western Europe Knitwear Market Share Comparison by Material Type (2016-2032)
- Figure 77: Western Europe Knitwear Market Share Comparison by End-user (2016-2032)
- Figure 78: Western Europe Knitwear Market Share Comparison by Distribution Channel (2016-2032)
- Figure 79: Eastern Europe Knitwear Market Revenue (US$ Mn) Market Share by Product Typein 2022
- Figure 80: Eastern Europe Knitwear Market Attractiveness Analysis by Product Type, 2016-2032
- Figure 81: Eastern Europe Knitwear Market Revenue (US$ Mn) Market Share by Material Typein 2022
- Figure 82: Eastern Europe Knitwear Market Attractiveness Analysis by Material Type, 2016-2032
- Figure 83: Eastern Europe Knitwear Market Revenue (US$ Mn) Market Share by End-userin 2022
- Figure 84: Eastern Europe Knitwear Market Attractiveness Analysis by End-user, 2016-2032
- Figure 85: Eastern Europe Knitwear Market Revenue (US$ Mn) Market Share by Distribution Channelin 2022
- Figure 86: Eastern Europe Knitwear Market Attractiveness Analysis by Distribution Channel, 2016-2032
- Figure 87: Eastern Europe Knitwear Market Revenue (US$ Mn) Market Share by Country in 2022
- Figure 88: Eastern Europe Knitwear Market Attractiveness Analysis by Country, 2016-2032
- Figure 89: Eastern Europe Knitwear Market Revenue (US$ Mn) (2016-2032)
- Figure 90: Eastern Europe Knitwear Market Revenue (US$ Mn) Comparison by Country (2016-2032)
- Figure 91: Eastern Europe Knitwear Market Revenue (US$ Mn) Comparison by Product Type (2016-2032)
- Figure 92: Eastern Europe Knitwear Market Revenue (US$ Mn) Comparison by Material Type (2016-2032)
- Figure 93: Eastern Europe Knitwear Market Revenue (US$ Mn) Comparison by End-user (2016-2032)
- Figure 94: Eastern Europe Knitwear Market Revenue (US$ Mn) Comparison by Distribution Channel (2016-2032)
- Figure 95: Eastern Europe Knitwear Market Y-o-Y Growth Rate Comparison by Country (2016-2032)
- Figure 96: Eastern Europe Knitwear Market Y-o-Y Growth Rate Comparison by Product Type (2016-2032)
- Figure 97: Eastern Europe Knitwear Market Y-o-Y Growth Rate Comparison by Material Type (2016-2032)
- Figure 98: Eastern Europe Knitwear Market Y-o-Y Growth Rate Comparison by End-user (2016-2032)
- Figure 99: Eastern Europe Knitwear Market Y-o-Y Growth Rate Comparison by Distribution Channel (2016-2032)
- Figure 100: Eastern Europe Knitwear Market Share Comparison by Country (2016-2032)
- Figure 101: Eastern Europe Knitwear Market Share Comparison by Product Type (2016-2032)
- Figure 102: Eastern Europe Knitwear Market Share Comparison by Material Type (2016-2032)
- Figure 103: Eastern Europe Knitwear Market Share Comparison by End-user (2016-2032)
- Figure 104: Eastern Europe Knitwear Market Share Comparison by Distribution Channel (2016-2032)
- Figure 105: APAC Knitwear Market Revenue (US$ Mn) Market Share by Product Typein 2022
- Figure 106: APAC Knitwear Market Attractiveness Analysis by Product Type, 2016-2032
- Figure 107: APAC Knitwear Market Revenue (US$ Mn) Market Share by Material Typein 2022
- Figure 108: APAC Knitwear Market Attractiveness Analysis by Material Type, 2016-2032
- Figure 109: APAC Knitwear Market Revenue (US$ Mn) Market Share by End-userin 2022
- Figure 110: APAC Knitwear Market Attractiveness Analysis by End-user, 2016-2032
- Figure 111: APAC Knitwear Market Revenue (US$ Mn) Market Share by Distribution Channelin 2022
- Figure 112: APAC Knitwear Market Attractiveness Analysis by Distribution Channel, 2016-2032
- Figure 113: APAC Knitwear Market Revenue (US$ Mn) Market Share by Country in 2022
- Figure 114: APAC Knitwear Market Attractiveness Analysis by Country, 2016-2032
- Figure 115: APAC Knitwear Market Revenue (US$ Mn) (2016-2032)
- Figure 116: APAC Knitwear Market Revenue (US$ Mn) Comparison by Country (2016-2032)
- Figure 117: APAC Knitwear Market Revenue (US$ Mn) Comparison by Product Type (2016-2032)
- Figure 118: APAC Knitwear Market Revenue (US$ Mn) Comparison by Material Type (2016-2032)
- Figure 119: APAC Knitwear Market Revenue (US$ Mn) Comparison by End-user (2016-2032)
- Figure 120: APAC Knitwear Market Revenue (US$ Mn) Comparison by Distribution Channel (2016-2032)
- Figure 121: APAC Knitwear Market Y-o-Y Growth Rate Comparison by Country (2016-2032)
- Figure 122: APAC Knitwear Market Y-o-Y Growth Rate Comparison by Product Type (2016-2032)
- Figure 123: APAC Knitwear Market Y-o-Y Growth Rate Comparison by Material Type (2016-2032)
- Figure 124: APAC Knitwear Market Y-o-Y Growth Rate Comparison by End-user (2016-2032)
- Figure 125: APAC Knitwear Market Y-o-Y Growth Rate Comparison by Distribution Channel (2016-2032)
- Figure 126: APAC Knitwear Market Share Comparison by Country (2016-2032)
- Figure 127: APAC Knitwear Market Share Comparison by Product Type (2016-2032)
- Figure 128: APAC Knitwear Market Share Comparison by Material Type (2016-2032)
- Figure 129: APAC Knitwear Market Share Comparison by End-user (2016-2032)
- Figure 130: APAC Knitwear Market Share Comparison by Distribution Channel (2016-2032)
- Figure 131: Latin America Knitwear Market Revenue (US$ Mn) Market Share by Product Typein 2022
- Figure 132: Latin America Knitwear Market Attractiveness Analysis by Product Type, 2016-2032
- Figure 133: Latin America Knitwear Market Revenue (US$ Mn) Market Share by Material Typein 2022
- Figure 134: Latin America Knitwear Market Attractiveness Analysis by Material Type, 2016-2032
- Figure 135: Latin America Knitwear Market Revenue (US$ Mn) Market Share by End-userin 2022
- Figure 136: Latin America Knitwear Market Attractiveness Analysis by End-user, 2016-2032
- Figure 137: Latin America Knitwear Market Revenue (US$ Mn) Market Share by Distribution Channelin 2022
- Figure 138: Latin America Knitwear Market Attractiveness Analysis by Distribution Channel, 2016-2032
- Figure 139: Latin America Knitwear Market Revenue (US$ Mn) Market Share by Country in 2022
- Figure 140: Latin America Knitwear Market Attractiveness Analysis by Country, 2016-2032
- Figure 141: Latin America Knitwear Market Revenue (US$ Mn) (2016-2032)
- Figure 142: Latin America Knitwear Market Revenue (US$ Mn) Comparison by Country (2016-2032)
- Figure 143: Latin America Knitwear Market Revenue (US$ Mn) Comparison by Product Type (2016-2032)
- Figure 144: Latin America Knitwear Market Revenue (US$ Mn) Comparison by Material Type (2016-2032)
- Figure 145: Latin America Knitwear Market Revenue (US$ Mn) Comparison by End-user (2016-2032)
- Figure 146: Latin America Knitwear Market Revenue (US$ Mn) Comparison by Distribution Channel (2016-2032)
- Figure 147: Latin America Knitwear Market Y-o-Y Growth Rate Comparison by Country (2016-2032)
- Figure 148: Latin America Knitwear Market Y-o-Y Growth Rate Comparison by Product Type (2016-2032)
- Figure 149: Latin America Knitwear Market Y-o-Y Growth Rate Comparison by Material Type (2016-2032)
- Figure 150: Latin America Knitwear Market Y-o-Y Growth Rate Comparison by End-user (2016-2032)
- Figure 151: Latin America Knitwear Market Y-o-Y Growth Rate Comparison by Distribution Channel (2016-2032)
- Figure 152: Latin America Knitwear Market Share Comparison by Country (2016-2032)
- Figure 153: Latin America Knitwear Market Share Comparison by Product Type (2016-2032)
- Figure 154: Latin America Knitwear Market Share Comparison by Material Type (2016-2032)
- Figure 155: Latin America Knitwear Market Share Comparison by End-user (2016-2032)
- Figure 156: Latin America Knitwear Market Share Comparison by Distribution Channel (2016-2032)
- Figure 157: Middle East & Africa Knitwear Market Revenue (US$ Mn) Market Share by Product Typein 2022
- Figure 158: Middle East & Africa Knitwear Market Attractiveness Analysis by Product Type, 2016-2032
- Figure 159: Middle East & Africa Knitwear Market Revenue (US$ Mn) Market Share by Material Typein 2022
- Figure 160: Middle East & Africa Knitwear Market Attractiveness Analysis by Material Type, 2016-2032
- Figure 161: Middle East & Africa Knitwear Market Revenue (US$ Mn) Market Share by End-userin 2022
- Figure 162: Middle East & Africa Knitwear Market Attractiveness Analysis by End-user, 2016-2032
- Figure 163: Middle East & Africa Knitwear Market Revenue (US$ Mn) Market Share by Distribution Channelin 2022
- Figure 164: Middle East & Africa Knitwear Market Attractiveness Analysis by Distribution Channel, 2016-2032
- Figure 165: Middle East & Africa Knitwear Market Revenue (US$ Mn) Market Share by Country in 2022
- Figure 166: Middle East & Africa Knitwear Market Attractiveness Analysis by Country, 2016-2032
- Figure 167: Middle East & Africa Knitwear Market Revenue (US$ Mn) (2016-2032)
- Figure 168: Middle East & Africa Knitwear Market Revenue (US$ Mn) Comparison by Country (2016-2032)
- Figure 169: Middle East & Africa Knitwear Market Revenue (US$ Mn) Comparison by Product Type (2016-2032)
- Figure 170: Middle East & Africa Knitwear Market Revenue (US$ Mn) Comparison by Material Type (2016-2032)
- Figure 171: Middle East & Africa Knitwear Market Revenue (US$ Mn) Comparison by End-user (2016-2032)
- Figure 172: Middle East & Africa Knitwear Market Revenue (US$ Mn) Comparison by Distribution Channel (2016-2032)
- Figure 173: Middle East & Africa Knitwear Market Y-o-Y Growth Rate Comparison by Country (2016-2032)
- Figure 174: Middle East & Africa Knitwear Market Y-o-Y Growth Rate Comparison by Product Type (2016-2032)
- Figure 175: Middle East & Africa Knitwear Market Y-o-Y Growth Rate Comparison by Material Type (2016-2032)
- Figure 176: Middle East & Africa Knitwear Market Y-o-Y Growth Rate Comparison by End-user (2016-2032)
- Figure 177: Middle East & Africa Knitwear Market Y-o-Y Growth Rate Comparison by Distribution Channel (2016-2032)
- Figure 178: Middle East & Africa Knitwear Market Share Comparison by Country (2016-2032)
- Figure 179: Middle East & Africa Knitwear Market Share Comparison by Product Type (2016-2032)
- Figure 180: Middle East & Africa Knitwear Market Share Comparison by Material Type (2016-2032)
- Figure 181: Middle East & Africa Knitwear Market Share Comparison by End-user (2016-2032)
- Figure 182: Middle East & Africa Knitwear Market Share Comparison by Distribution Channel (2016-2032)
- List of Tables
- Table 1: Global Knitwear Market Comparison by Product Type (2016-2032)
- Table 2: Global Knitwear Market Comparison by Material Type (2016-2032)
- Table 3: Global Knitwear Market Comparison by End-user (2016-2032)
- Table 4: Global Knitwear Market Comparison by Distribution Channel (2016-2032)
- Table 5: Global Knitwear Market Revenue (US$ Mn) Comparison by Region (2016-2032)
- Table 6: Global Knitwear Market Revenue (US$ Mn) (2016-2032)
- Table 7: Global Knitwear Market Revenue (US$ Mn) Comparison by Region (2016-2032)
- Table 8: Global Knitwear Market Revenue (US$ Mn) Comparison by Product Type (2016-2032)
- Table 9: Global Knitwear Market Revenue (US$ Mn) Comparison by Material Type (2016-2032)
- Table 10: Global Knitwear Market Revenue (US$ Mn) Comparison by End-user (2016-2032)
- Table 11: Global Knitwear Market Revenue (US$ Mn) Comparison by Distribution Channel (2016-2032)
- Table 12: Global Knitwear Market Y-o-Y Growth Rate Comparison by Region (2016-2032)
- Table 13: Global Knitwear Market Y-o-Y Growth Rate Comparison by Product Type (2016-2032)
- Table 14: Global Knitwear Market Y-o-Y Growth Rate Comparison by Material Type (2016-2032)
- Table 15: Global Knitwear Market Y-o-Y Growth Rate Comparison by End-user (2016-2032)
- Table 16: Global Knitwear Market Y-o-Y Growth Rate Comparison by Distribution Channel (2016-2032)
- Table 17: Global Knitwear Market Share Comparison by Region (2016-2032)
- Table 18: Global Knitwear Market Share Comparison by Product Type (2016-2032)
- Table 19: Global Knitwear Market Share Comparison by Material Type (2016-2032)
- Table 20: Global Knitwear Market Share Comparison by End-user (2016-2032)
- Table 21: Global Knitwear Market Share Comparison by Distribution Channel (2016-2032)
- Table 22: North America Knitwear Market Comparison by Material Type (2016-2032)
- Table 23: North America Knitwear Market Comparison by End-user (2016-2032)
- Table 24: North America Knitwear Market Comparison by Distribution Channel (2016-2032)
- Table 25: North America Knitwear Market Revenue (US$ Mn) Comparison by Country (2016-2032)
- Table 26: North America Knitwear Market Revenue (US$ Mn) (2016-2032)
- Table 27: North America Knitwear Market Revenue (US$ Mn) Comparison by Country (2016-2032)
- Table 28: North America Knitwear Market Revenue (US$ Mn) Comparison by Product Type (2016-2032)
- Table 29: North America Knitwear Market Revenue (US$ Mn) Comparison by Material Type (2016-2032)
- Table 30: North America Knitwear Market Revenue (US$ Mn) Comparison by End-user (2016-2032)
- Table 31: North America Knitwear Market Revenue (US$ Mn) Comparison by Distribution Channel (2016-2032)
- Table 32: North America Knitwear Market Y-o-Y Growth Rate Comparison by Country (2016-2032)
- Table 33: North America Knitwear Market Y-o-Y Growth Rate Comparison by Product Type (2016-2032)
- Table 34: North America Knitwear Market Y-o-Y Growth Rate Comparison by Material Type (2016-2032)
- Table 35: North America Knitwear Market Y-o-Y Growth Rate Comparison by End-user (2016-2032)
- Table 36: North America Knitwear Market Y-o-Y Growth Rate Comparison by Distribution Channel (2016-2032)
- Table 37: North America Knitwear Market Share Comparison by Country (2016-2032)
- Table 38: North America Knitwear Market Share Comparison by Product Type (2016-2032)
- Table 39: North America Knitwear Market Share Comparison by Material Type (2016-2032)
- Table 40: North America Knitwear Market Share Comparison by End-user (2016-2032)
- Table 41: North America Knitwear Market Share Comparison by Distribution Channel (2016-2032)
- Table 42: Western Europe Knitwear Market Comparison by Product Type (2016-2032)
- Table 43: Western Europe Knitwear Market Comparison by Material Type (2016-2032)
- Table 44: Western Europe Knitwear Market Comparison by End-user (2016-2032)
- Table 45: Western Europe Knitwear Market Comparison by Distribution Channel (2016-2032)
- Table 46: Western Europe Knitwear Market Revenue (US$ Mn) Comparison by Country (2016-2032)
- Table 47: Western Europe Knitwear Market Revenue (US$ Mn) (2016-2032)
- Table 48: Western Europe Knitwear Market Revenue (US$ Mn) Comparison by Country (2016-2032)
- Table 49: Western Europe Knitwear Market Revenue (US$ Mn) Comparison by Product Type (2016-2032)
- Table 50: Western Europe Knitwear Market Revenue (US$ Mn) Comparison by Material Type (2016-2032)
- Table 51: Western Europe Knitwear Market Revenue (US$ Mn) Comparison by End-user (2016-2032)
- Table 52: Western Europe Knitwear Market Revenue (US$ Mn) Comparison by Distribution Channel (2016-2032)
- Table 53: Western Europe Knitwear Market Y-o-Y Growth Rate Comparison by Country (2016-2032)
- Table 54: Western Europe Knitwear Market Y-o-Y Growth Rate Comparison by Product Type (2016-2032)
- Table 55: Western Europe Knitwear Market Y-o-Y Growth Rate Comparison by Material Type (2016-2032)
- Table 56: Western Europe Knitwear Market Y-o-Y Growth Rate Comparison by End-user (2016-2032)
- Table 57: Western Europe Knitwear Market Y-o-Y Growth Rate Comparison by Distribution Channel (2016-2032)
- Table 58: Western Europe Knitwear Market Share Comparison by Country (2016-2032)
- Table 59: Western Europe Knitwear Market Share Comparison by Product Type (2016-2032)
- Table 60: Western Europe Knitwear Market Share Comparison by Material Type (2016-2032)
- Table 61: Western Europe Knitwear Market Share Comparison by End-user (2016-2032)
- Table 62: Western Europe Knitwear Market Share Comparison by Distribution Channel (2016-2032)
- Table 63: Eastern Europe Knitwear Market Comparison by Product Type (2016-2032)
- Table 64: Eastern Europe Knitwear Market Comparison by Material Type (2016-2032)
- Table 65: Eastern Europe Knitwear Market Comparison by End-user (2016-2032)
- Table 66: Eastern Europe Knitwear Market Comparison by Distribution Channel (2016-2032)
- Table 67: Eastern Europe Knitwear Market Revenue (US$ Mn) Comparison by Country (2016-2032)
- Table 68: Eastern Europe Knitwear Market Revenue (US$ Mn) (2016-2032)
- Table 69: Eastern Europe Knitwear Market Revenue (US$ Mn) Comparison by Country (2016-2032)
- Table 70: Eastern Europe Knitwear Market Revenue (US$ Mn) Comparison by Product Type (2016-2032)
- Table 71: Eastern Europe Knitwear Market Revenue (US$ Mn) Comparison by Material Type (2016-2032)
- Table 72: Eastern Europe Knitwear Market Revenue (US$ Mn) Comparison by End-user (2016-2032)
- Table 73: Eastern Europe Knitwear Market Revenue (US$ Mn) Comparison by Distribution Channel (2016-2032)
- Table 74: Eastern Europe Knitwear Market Y-o-Y Growth Rate Comparison by Country (2016-2032)
- Table 75: Eastern Europe Knitwear Market Y-o-Y Growth Rate Comparison by Product Type (2016-2032)
- Table 76: Eastern Europe Knitwear Market Y-o-Y Growth Rate Comparison by Material Type (2016-2032)
- Table 77: Eastern Europe Knitwear Market Y-o-Y Growth Rate Comparison by End-user (2016-2032)
- Table 78: Eastern Europe Knitwear Market Y-o-Y Growth Rate Comparison by Distribution Channel (2016-2032)
- Table 79: Eastern Europe Knitwear Market Share Comparison by Country (2016-2032)
- Table 80: Eastern Europe Knitwear Market Share Comparison by Product Type (2016-2032)
- Table 81: Eastern Europe Knitwear Market Share Comparison by Material Type (2016-2032)
- Table 82: Eastern Europe Knitwear Market Share Comparison by End-user (2016-2032)
- Table 83: Eastern Europe Knitwear Market Share Comparison by Distribution Channel (2016-2032)
- Table 84: APAC Knitwear Market Comparison by Product Type (2016-2032)
- Table 85: APAC Knitwear Market Comparison by Material Type (2016-2032)
- Table 86: APAC Knitwear Market Comparison by End-user (2016-2032)
- Table 87: APAC Knitwear Market Comparison by Distribution Channel (2016-2032)
- Table 88: APAC Knitwear Market Revenue (US$ Mn) Comparison by Country (2016-2032)
- Table 89: APAC Knitwear Market Revenue (US$ Mn) (2016-2032)
- Table 90: APAC Knitwear Market Revenue (US$ Mn) Comparison by Country (2016-2032)
- Table 91: APAC Knitwear Market Revenue (US$ Mn) Comparison by Product Type (2016-2032)
- Table 92: APAC Knitwear Market Revenue (US$ Mn) Comparison by Material Type (2016-2032)
- Table 93: APAC Knitwear Market Revenue (US$ Mn) Comparison by End-user (2016-2032)
- Table 94: APAC Knitwear Market Revenue (US$ Mn) Comparison by Distribution Channel (2016-2032)
- Table 95: APAC Knitwear Market Y-o-Y Growth Rate Comparison by Country (2016-2032)
- Table 96: APAC Knitwear Market Y-o-Y Growth Rate Comparison by Product Type (2016-2032)
- Table 97: APAC Knitwear Market Y-o-Y Growth Rate Comparison by Material Type (2016-2032)
- Table 98: APAC Knitwear Market Y-o-Y Growth Rate Comparison by End-user (2016-2032)
- Table 99: APAC Knitwear Market Y-o-Y Growth Rate Comparison by Distribution Channel (2016-2032)
- Table 100: APAC Knitwear Market Share Comparison by Country (2016-2032)
- Table 101: APAC Knitwear Market Share Comparison by Product Type (2016-2032)
- Table 102: APAC Knitwear Market Share Comparison by Material Type (2016-2032)
- Table 103: APAC Knitwear Market Share Comparison by End-user (2016-2032)
- Table 104: APAC Knitwear Market Share Comparison by Distribution Channel (2016-2032)
- Table 105: Latin America Knitwear Market Comparison by Product Type (2016-2032)
- Table 106: Latin America Knitwear Market Comparison by Material Type (2016-2032)
- Table 107: Latin America Knitwear Market Comparison by End-user (2016-2032)
- Table 108: Latin America Knitwear Market Comparison by Distribution Channel (2016-2032)
- Table 109: Latin America Knitwear Market Revenue (US$ Mn) Comparison by Country (2016-2032)
- Table 110: Latin America Knitwear Market Revenue (US$ Mn) (2016-2032)
- Table 111: Latin America Knitwear Market Revenue (US$ Mn) Comparison by Country (2016-2032)
- Table 112: Latin America Knitwear Market Revenue (US$ Mn) Comparison by Product Type (2016-2032)
- Table 113: Latin America Knitwear Market Revenue (US$ Mn) Comparison by Material Type (2016-2032)
- Table 114: Latin America Knitwear Market Revenue (US$ Mn) Comparison by End-user (2016-2032)
- Table 115: Latin America Knitwear Market Revenue (US$ Mn) Comparison by Distribution Channel (2016-2032)
- Table 116: Latin America Knitwear Market Y-o-Y Growth Rate Comparison by Country (2016-2032)
- Table 117: Latin America Knitwear Market Y-o-Y Growth Rate Comparison by Product Type (2016-2032)
- Table 118: Latin America Knitwear Market Y-o-Y Growth Rate Comparison by Material Type (2016-2032)
- Table 119: Latin America Knitwear Market Y-o-Y Growth Rate Comparison by End-user (2016-2032)
- Table 120: Latin America Knitwear Market Y-o-Y Growth Rate Comparison by Distribution Channel (2016-2032)
- Table 121: Latin America Knitwear Market Share Comparison by Country (2016-2032)
- Table 122: Latin America Knitwear Market Share Comparison by Product Type (2016-2032)
- Table 123: Latin America Knitwear Market Share Comparison by Material Type (2016-2032)
- Table 124: Latin America Knitwear Market Share Comparison by End-user (2016-2032)
- Table 125: Latin America Knitwear Market Share Comparison by Distribution Channel (2016-2032)
- Table 126: Middle East & Africa Knitwear Market Comparison by Product Type (2016-2032)
- Table 127: Middle East & Africa Knitwear Market Comparison by Material Type (2016-2032)
- Table 128: Middle East & Africa Knitwear Market Comparison by End-user (2016-2032)
- Table 129: Middle East & Africa Knitwear Market Comparison by Distribution Channel (2016-2032)
- Table 130: Middle East & Africa Knitwear Market Revenue (US$ Mn) Comparison by Country (2016-2032)
- Table 131: Middle East & Africa Knitwear Market Revenue (US$ Mn) (2016-2032)
- Table 132: Middle East & Africa Knitwear Market Revenue (US$ Mn) Comparison by Country (2016-2032)
- Table 133: Middle East & Africa Knitwear Market Revenue (US$ Mn) Comparison by Product Type (2016-2032)
- Table 134: Middle East & Africa Knitwear Market Revenue (US$ Mn) Comparison by Material Type (2016-2032)
- Table 135: Middle East & Africa Knitwear Market Revenue (US$ Mn) Comparison by End-user (2016-2032)
- Table 136: Middle East & Africa Knitwear Market Revenue (US$ Mn) Comparison by Distribution Channel (2016-2032)
- Table 137: Middle East & Africa Knitwear Market Y-o-Y Growth Rate Comparison by Country (2016-2032)
- Table 138: Middle East & Africa Knitwear Market Y-o-Y Growth Rate Comparison by Product Type (2016-2032)
- Table 139: Middle East & Africa Knitwear Market Y-o-Y Growth Rate Comparison by Material Type (2016-2032)
- Table 140: Middle East & Africa Knitwear Market Y-o-Y Growth Rate Comparison by End-user (2016-2032)
- Table 141: Middle East & Africa Knitwear Market Y-o-Y Growth Rate Comparison by Distribution Channel (2016-2032)
- Table 142: Middle East & Africa Knitwear Market Share Comparison by Country (2016-2032)
- Table 143: Middle East & Africa Knitwear Market Share Comparison by Product Type (2016-2032)
- Table 144: Middle East & Africa Knitwear Market Share Comparison by Material Type (2016-2032)
- Table 145: Middle East & Africa Knitwear Market Share Comparison by End-user (2016-2032)
- Table 146: Middle East & Africa Knitwear Market Share Comparison by Distribution Channel (2016-2032)
- 1. Executive Summary
-
Our Clients


View Our Licence Options
