Kaolin Market By Grade(Hydrous, Calcined, Delaminated, Surface Treated, Structured), By Application(Paper, Ceramics, Paint & Coatings, Pharmaceuticals & Medical, Cosmetics, Fiberglass, Plastic, Rubber, Others), By Region And Companies - Industry Segment Outlook, Market Assessment, Competition Scenario, Trends, And Forecast 2024-2033
-
4244
-
Feb 2024
-
169
-


-
This report was compiled by Research Team Research team of over 50 passionate professionals leverages advanced research methodologies and analytical expertise to deliver insightful, data-driven market intelligence that empowers businesses across diverse industries to make strategic, well-informed Correspondence Research Team Linkedin | Detailed Market research Methodology Our methodology involves a mix of primary research, including interviews with leading mental health experts, and secondary research from reputable medical journals and databases. View Detailed Methodology Page
-
Quick Navigation
Report Overview
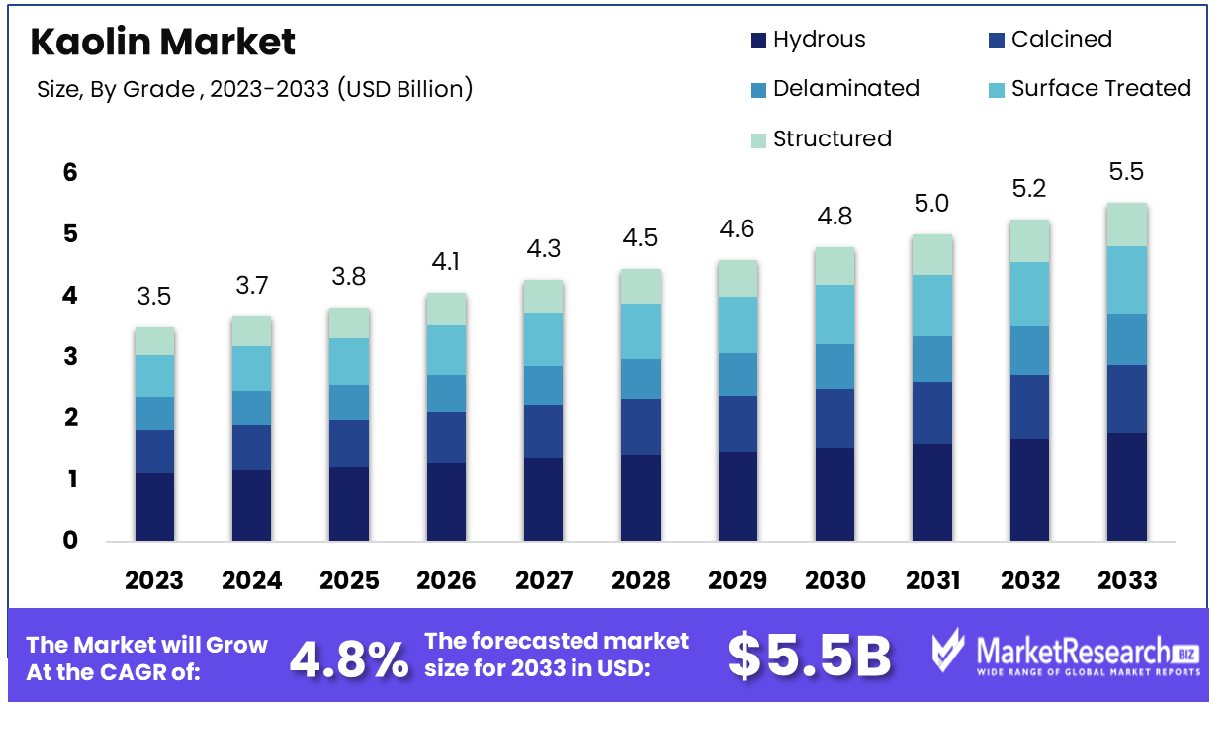
The kaolin market was valued at USD 3.5 billion in 2023. It is expected to reach USD 5.5 billion in 2033, with a CAGR of 4.8% during the forecast period from 2024 to 2033.
The surge in demand for ceramic products, the paper industry, and the sudden rise in the global population are some of the main key driving factors for the kaolin market. Kaolin is also known as kaolinite which is defined as the soft, naturally occurring white clay mineral that mainly comprises the mineral kaolinite along with different amounts of other minerals such as feldspare, anatase, quartz, and muscovite.
It is primarily used in multiple industrial applications like cosmetics, agriculture, paints, ceramics, demand for paper, and pharmaceuticals due to its excellent features that comprise chemical inertness, non-swelling skills, and permeability. The kaolin deposits seem to be in the soil and soil all across many regions globally, comprising eastern and western Europe, southeast Asia, sub-Saharan Africa, and Australia. Moreover, in the USA, kaolin is a most profuse element in Georgia, which also includes the city of Sandersville, which is the kaolin capital. The kaolin clay extracted from the earth requires mining. The manufacturers route the kaolin minerals extraction and prepare them into powder forms for commercial purposes.
According to an article published by Australian Resource and Investment in October 2023, WA Kaolin has announced a 113% surge to the ore reserve as its Wickepin Kaolin project in WA. The latest JORC ore reserve is projected to report a 64.7 million tonnes deposit at Wickepin, an upsurge of 113%. The anticipated ore reserve provides Wickepin with a mine production life of 73 years.
There are several advantages of using Kaolin in various industries due to its versatile features. When it is used in crops, it develops a shield film on leaves, eliminating the pests and decreasing the requirement for chemical features. Kaolin also has several types of environmental benefits such as it acts as the natural filter while processing water treatment. The demand for kaolin will increase rapidly due to its various health, skincare, and industrial advantages that will help in market expansion in the coming years.
Key Takeaways
- Market Growth: Kaolin Market was valued at USD 3.5 billion in 2023. It is expected to reach USD 5.5 billion in 2033, with a CAGR of 4.8% during the forecast period from 2024 to 2033.
- By Grade: In the Hydrous subsegment, domination was evident, classified by grade.
- By Application: The dominance of the Paper subsegment was pronounced and categorized by application.
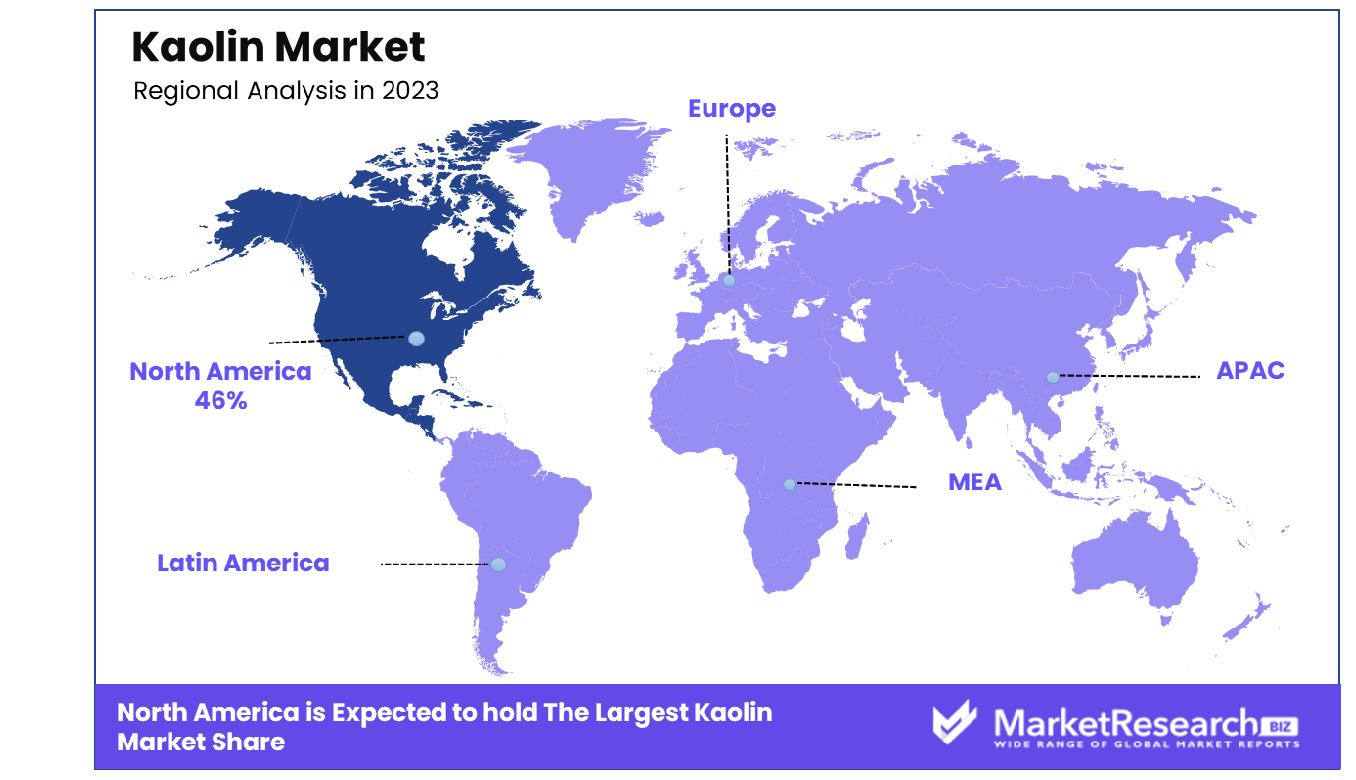
- Regional Dominance: North America commands a dominant position, capturing a substantial 46% share in the Kaolin industry.
- Growth Opportunity: The Kaolin market expands fueled by rising demand in emerging economies across sectors like construction and agriculture, fostering sustainable growth prospects.
Driving factors
Paper Industry's Expansion Boosts Kaolin Market
Kaolin's role as a critical component in paper manufacturing significantly contributes to its market growth. Particularly in the Asia Pacific region, the paper industry is witnessing substantial expansion. With China's paper production expected to increase annually by more than 4.3% through 2025, kaolin's demand as a filler and coating pigment will likely surge. This trend is a direct reflection of the growing paper market production, emphasizing kaolin's indispensability in the industry.
Ceramics and Sanitaryware Sector Drives Kaolin Usage
Enhanced construction activities and economic upturns, especially in developing countries, have escalated the demand for ceramic products. Notably, the ceramic tile market is on an upward trajectory, with projections of over 7.5% annual growth through 2027, further stimulating kaolin's market demand.
Paints and Coatings Industry Fuels Demand for Kaolin
Kaolin's usage rise in demand in the global market for paints and coatings is anticipated to progress steadily, propelled by burgeoning demands from the construction and automotive sectors. Kaolin's attributes make it integral to this industry, aligning its market rapid growth with the sector's expansion.
Restraining Factors
Competition from Alternative Minerals Constrains Kaolin Market Expansion
The kaolin market is encountering significant competition from alternative minerals such as calcium carbonate, talc, and mica. These substitutes are increasingly preferred in various applications, particularly in the paper manufacturing industry, where calcium carbonate is replacing kaolin as a cost-effective filler. The shift towards these alternatives is primarily driven by their lower cost and similar functional properties. For instance, the increasing adoption of calcium carbonate in paper manufacturing is a direct response to its affordability, thereby limiting the growth potential of the kaolin market in this significant industrial sector.
Environmental and Mining Regulations Impact Kaolin Market Dynamics
Kaolin mining and production are subject to stringent environmental regulations and mining restrictions, which present substantial challenges to the market's growth. These regulations often lead to increased compliance costs, impacting the profitability and operational efficiency of kaolin producers. The need to adhere to these environmental standards and mining policies not only elevates the cost of production but also limits the scalability and speed of kaolin extraction processes.
By Grade Analysis
Hydrous Dominates By Grade In The Market.
Hydrous Kaolin is the dominant grade in the kaolin market. This supremacy can be attributed to its extensive use in various applications due to its natural state, ease of processing, and cost-effectiveness. Hydrous kaolin is predominantly utilized in the paper industry for improving printability and appearance by enhancing gloss, smoothness, brightness, and ink absorption. Additionally, it finds applications in the ceramics industry, paints, and coatings, where it contributes to improved opacity, gloss control, and suspension properties.
Other grades like Calcined, Delaminated, Surface Treated, and Structured kaolin have specific uses. Calcined Kaolin of paints and papers. Delaminated kaolin, which has smaller particles, is more popular in ceramic coatings for paper and paper. Surface Treated kaolin finds applications in rubber and plastics due to its enhanced compatibility with organic materials, and Structured kaolin is utilized for its rheology modification properties. Despite their specialized uses, the broad applicability of Hydrous kaolin underpins its market dominance.
By Application Analysis
Paper Dominates The Market By Application.
Papier is the single most popular application of kaolin and its essential role in the process of making paper. When it comes to papermaking, Kaolin can be used as a coating material and additive material that is an important contributing factor to the texture of paper as well as its luminosity and printing capabilities. Its ability to enhance various paper properties, including opacity, gloss, and smoothness, coupled with its cost-effectiveness, makes it an indispensable component in the paper industry.
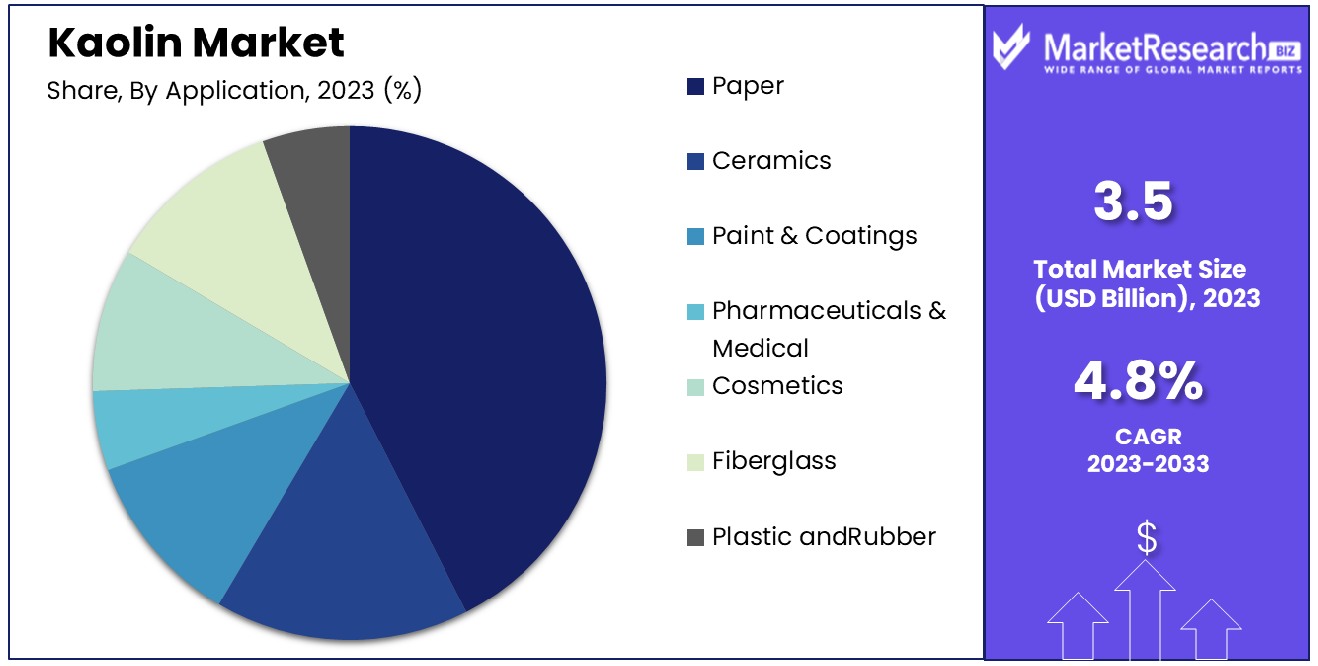
Other industries like Ceramics, Paint & Coatings, Pharmaceuticals & Medical, Cosmetics, Fiberglass, Plastic, and Rubber are also among the many that employ the mineral kaolin. In Ceramics it enhances the strength and moldability of the materials, and when used as Paints & Coatings, it increases opacity and endurance. Kaolin is used in Pharmaceuticals & Medical and is known for its adsorbent properties. It is used in Cosmetics due to its skin-friendly properties as well as in Fiberglass plastic and rubber for its strength and stability improvement. Despite the many different applications and uses, the Paper industry's huge consumption of and dependence on kaolin strengthens its position as the dominant sector.
Key Market Segments
By Grade
- Hydrous
- Calcined
- Delaminated
- Surface Treated
- Structured
By Application
- Paper
- Ceramics
- Paint & Coatings
- Pharmaceuticals & Medical
- Cosmetics
- Fiberglass
- Plastic
- Rubber
- Others
Growth Opportunity
Rising Demand in Emerging Economies: Catalyzing Kaolin Market Expansion
Countries like India, Brazil, and Indonesia, characterized by rapid urbanization and industrial growth, are increasingly utilizing kaolin in various applications. This demand is further bolstered by the burgeoning ceramic industry, driven by urban development and infrastructure projects. The escalating construction activities, along with the automotive sector's growth in this regional growth, are key drivers in the increased consumption of kaolin, highlighting its integral role in supporting emerging economies' industrial evolution.
Increasing Use in Agriculture: Fertilizing Growth Opportunities for Kaolin
Kaolin's application in agriculture presents a burgeoning opportunity for market growth. Its ability to enhance soil quality, coupled with the reduction of pesticide usage, positions kaolin as a critical component in sustainable organic farming practices. As global food demand escalates, the agriculture sector is increasingly recognizing the benefits of kaolin in boosting crop yields. This growing adoption is catalyzed by the need for more efficient and environmentally friendly agricultural methods.
Latest Trends
Sustainable Sourcing
With increasing environmental awareness, major companies are prioritizing sustainable sourcing practices for kaolin, emphasizing ethical extraction methods and minimizing environmental impact. This trend reflects a shift towards eco-conscious consumer demands and regulatory pressures, driving market major players to adopt responsible supply chain strategies.
Advanced Applications in Nanotechnology
Kaolin's unique properties, including fine particle size and high surface area, are increasingly leveraged in nanotechnology applications. From catalysis to drug delivery systems, kaolin nanoparticles are unlocking new frontiers in various industries, showcasing the market's evolution toward cutting-edge technological advancements. This trend highlights kaolin's versatility and adaptability to meet emerging market needs.
Regional Analysis
North America Dominates with 46% Market Share in the Kaolin Industry
North America's dominance in the market for kaolin, with a share of 46 of the market, is rooted in its large clay deposits of kaolin, particularly in the southeast United States. This geographical advantage, combined with advanced processing technologies, positions the region as a leading producer. The high demand for kaolin in paper, ceramics, and paint industries within the region also fuels this market dominance. Additionally, the presence of major kaolin mining and processing companies in the U.S. contributes to the region's leading role in the global market.
The kaolin market in North America is characterized by a well-established infrastructure and a strong focus on research and development, leading to innovative product applications. Environmental regulations and sustainability initiatives are shaping mining practices, pushing towards more eco-friendly methods. However, challenges such as fluctuating raw material costs and international trade dynamics influence market stability. The evolving needs of end-use industries like paper, ceramics, and pharmaceuticals also play a crucial role in driving market trends.
Europe’s Presence in the Kaolin Market
Europe holds a significant market share in the kaolin industry, bolstered by its robust ceramics and paper sectors. The key actors in this region concentrate on sustainable mining methods as well as creative applications of kaolin to diverse industries.
Asia Pacific’s Stake in the Kaolin Market
Asia Pacific is a notable player in the kaolin market, with its growing industrial sector driving demand. Countries like China and India are pivotal, both as producers and consumers, supported by the expanding manufacturing and construction industries in the region.
Key Regions and Countries
North America
- The US
- Canada
- Rest of North America
Europe
- Germany
- France
- The UK
- Spain
- Netherlands
- Russia
- Italy
- Rest of Europe
Asia-Pacific
- China
- Japan
- Singapore
- Thailand
- South Korea
- Vietnam
- India
- New Zealand
- Rest of Asia Pacific
Latin America
- Mexico
- Brazil
- Rest of Latin America
Middle East & Africa
- Saudi Arabia
- South Africa
- UAE
- Rest of Middle East & Africa
Key Players Analysis
The market for kaolin in the world is distinguished by a wide assortment in players BASF SE is a prominent entity, leveraging its broad chemical expertise to deliver high-quality kaolin products for various industrial applications. The company's strong R&D focus and global distribution network significantly impact market dynamics.
Quartz Works GmbH, EICL, and Imerys are key figures known for their specialized production techniques and tailored solutions catering to specific industry needs. Their strategic positioning in the market is marked by a strong emphasis on quality and innovation.
Sibelco and KaMin LLC stand out for their extensive reserves and mining capabilities, ensuring a steady supply of kaolin to various sectors, including paper, ceramics, and paints. Their operational efficiency and sustainability practices are crucial in maintaining industry standards.
Market Key Players
- BASF SE
- Quartz Works GmbH
- EICL
- Imerys
- Sibelco
- KaMin LLC
- Koalin AD
- KERAMOST AS
- LB Minerals Ltd.
- Lasselsberger GmbH
- Thiele Kaolin Company
- R.T. Vanderbilt Holding Company, Inc
- Active Minerals International
- W. R. Grace & Co.
- SCR-Sibelco
Recent Development
- In October 2023, WA Kaolin announced a 113% increase in the ore reserve at its Wickepin kaolin project in WA, with an estimated 64.9 million tonnes, making it the world's largest known primary kaolin deposit.
- In August 2023, The Raw Materials Research and Development Council (RMRDC) in Nigeria initiated various programs to promote local processing and utilization of kaolin. They have established kaolin processing plants and promoted value addition to boost indigenous capacity and reduce the importation of processed kaolin.
- In March 2023, Andromeda Metals received regulatory approval for its Great White Halloysite-kaolin project in South Australia, allowing it to proceed with construction. This marks a significant milestone for Australia's first halloysite-kaolin mine.
Report Scope
Report Features Description Market Value (2023) USD 3.5 Billion Forecast Revenue (2033) USD 5.5 Billion CAGR (2024-2032) 4.8% Base Year for Estimation 2023 Historic Period 2016-2023 Forecast Period 2024-2033 Report Coverage Revenue Forecast, Market Dynamics, COVID-19 Impact, Competitive Landscape, Recent Developments Segments Covered By Grade(Hydrous, Calcined, Delaminated, Surface Treated, Structured), By Application(Paper, Ceramics, Paint & Coatings, Pharmaceuticals & Medical, Cosmetics, Fiberglass, Plastic, Rubber, Others) Regional Analysis North America - The US, Canada, Rest of North America, Europe - Germany, France, The UK, Spain, Italy, Russia, Netherlands, Rest of Europe, Asia-Pacific - China, Japan, South Korea, India, New Zealand, Singapore, Thailand, Vietnam, Rest of Asia Pacific, Latin America - Brazil, Mexico, Rest of Latin America, Middle East & Africa - South Africa, Saudi Arabia, UAE, Rest of Middle East & Africa Competitive Landscape BASF SE, Quartz Works GmbH, EICL, Imerys, Sibelco, KaMin LLC, Koalin AD, KERAMOST AS, LB Minerals Ltd., Lasselsberger GmbH, Thiele Kaolin Company, R.T. Vanderbilt Holding Company, Inc, Active Minerals International, W. R. Grace & Co., SCR-Sibelco Customization Scope Customization for segments, region/country-level will be provided. Moreover, additional customization can be done based on the requirements. Purchase Options We have three licenses to opt for Single User License, Multi-User License (Up to 5 Users), Corporate Use License (Unlimited User and Printable PDF) -
- 1. Executive Summary
- 1.1. Definition
- 1.2. Taxonomy
- 1.3. Research Scope
- 1.4. Key Analysis
- 1.5. Key Findings by Major Segments
- 1.6. Top strategies by Major Players
- 2. Global Kaolin Market Overview
- 2.1. Kaolin Market Dynamics
- 2.1.1. Drivers
- 2.1.2. Opportunities
- 2.1.3. Restraints
- 2.1.4. Challenges
- 2.2. Macro-economic Factors
- 2.3. Regulatory Framework
- 2.4. Market Investment Feasibility Index
- 2.5. PEST Analysis
- 2.6. PORTER’S Five Force Analysis
- 2.7. Drivers & Restraints Impact Analysis
- 2.8. Industry Chain Analysis
- 2.9. Cost Structure Analysis
- 2.10. Marketing Strategy
- 2.11. Russia-Ukraine War Impact Analysis
- 2.12. Opportunity Map Analysis
- 2.13. Market Competition Scenario Analysis
- 2.14. Product Life Cycle Analysis
- 2.15. Opportunity Orbits
- 2.16. Manufacturer Intensity Map
- 2.17. Major Companies sales by Value & Volume
- 2.1. Kaolin Market Dynamics
- 3. Global Kaolin Market Analysis, Opportunity and Forecast, 2016-2032
- 3.1. Global Kaolin Market Analysis, 2016-2021
- 3.2. Global Kaolin Market Opportunity and Forecast, 2023-2032
- 3.3. Global Kaolin Market Analysis, Opportunity and Forecast, By By Grade , 2016-2032
- 3.3.1. Global Kaolin Market Analysis by By Grade : Introduction
- 3.3.2. Market Size Absolute $ Opportunity Analysis and Forecast, By By Grade , 2016-2032
- 3.3.3. Hydrous
- 3.3.4. Calcined
- 3.3.5. Delaminated
- 3.3.6. Surface Treated
- 3.3.7. Structured
- 3.4. Global Kaolin Market Analysis, Opportunity and Forecast, By By Application, 2016-2032
- 3.4.1. Global Kaolin Market Analysis by By Application: Introduction
- 3.4.2. Market Size Absolute $ Opportunity Analysis and Forecast, By By Application, 2016-2032
- 3.4.3. Paper
- 3.4.4. Ceramics
- 3.4.5. Paint & Coatings
- 3.4.6. Pharmaceuticals & Medical
- 3.4.7. Cosmetics
- 3.4.8. Fiberglass
- 3.4.9. Plastic
- 3.4.10. Rubber
- 3.4.11. Others
- 4. North America Kaolin Market Analysis, Opportunity and Forecast, 2016-2032
- 4.1. North America Kaolin Market Analysis, 2016-2021
- 4.2. North America Kaolin Market Opportunity and Forecast, 2023-2032
- 4.3. North America Kaolin Market Analysis, Opportunity and Forecast, By By Grade , 2016-2032
- 4.3.1. North America Kaolin Market Analysis by By Grade : Introduction
- 4.3.2. Market Size Absolute $ Opportunity Analysis and Forecast, By By Grade , 2016-2032
- 4.3.3. Hydrous
- 4.3.4. Calcined
- 4.3.5. Delaminated
- 4.3.6. Surface Treated
- 4.3.7. Structured
- 4.4. North America Kaolin Market Analysis, Opportunity and Forecast, By By Application, 2016-2032
- 4.4.1. North America Kaolin Market Analysis by By Application: Introduction
- 4.4.2. Market Size Absolute $ Opportunity Analysis and Forecast, By By Application, 2016-2032
- 4.4.3. Paper
- 4.4.4. Ceramics
- 4.4.5. Paint & Coatings
- 4.4.6. Pharmaceuticals & Medical
- 4.4.7. Cosmetics
- 4.4.8. Fiberglass
- 4.4.9. Plastic
- 4.4.10. Rubber
- 4.4.11. Others
- 4.5. North America Kaolin Market Analysis, Opportunity and Forecast, By Country , 2016-2032
- 4.5.1. North America Kaolin Market Analysis by Country : Introduction
- 4.5.2. Market Size Absolute $ Opportunity Analysis and Forecast, Country , 2016-2032
- 4.5.2.1. The US
- 4.5.2.2. Canada
- 4.5.2.3. Mexico
- 5. Western Europe Kaolin Market Analysis, Opportunity and Forecast, 2016-2032
- 5.1. Western Europe Kaolin Market Analysis, 2016-2021
- 5.2. Western Europe Kaolin Market Opportunity and Forecast, 2023-2032
- 5.3. Western Europe Kaolin Market Analysis, Opportunity and Forecast, By By Grade , 2016-2032
- 5.3.1. Western Europe Kaolin Market Analysis by By Grade : Introduction
- 5.3.2. Market Size Absolute $ Opportunity Analysis and Forecast, By By Grade , 2016-2032
- 5.3.3. Hydrous
- 5.3.4. Calcined
- 5.3.5. Delaminated
- 5.3.6. Surface Treated
- 5.3.7. Structured
- 5.4. Western Europe Kaolin Market Analysis, Opportunity and Forecast, By By Application, 2016-2032
- 5.4.1. Western Europe Kaolin Market Analysis by By Application: Introduction
- 5.4.2. Market Size Absolute $ Opportunity Analysis and Forecast, By By Application, 2016-2032
- 5.4.3. Paper
- 5.4.4. Ceramics
- 5.4.5. Paint & Coatings
- 5.4.6. Pharmaceuticals & Medical
- 5.4.7. Cosmetics
- 5.4.8. Fiberglass
- 5.4.9. Plastic
- 5.4.10. Rubber
- 5.4.11. Others
- 5.5. Western Europe Kaolin Market Analysis, Opportunity and Forecast, By Country , 2016-2032
- 5.5.1. Western Europe Kaolin Market Analysis by Country : Introduction
- 5.5.2. Market Size Absolute $ Opportunity Analysis and Forecast, Country , 2016-2032
- 5.5.2.1. Germany
- 5.5.2.2. France
- 5.5.2.3. The UK
- 5.5.2.4. Spain
- 5.5.2.5. Italy
- 5.5.2.6. Portugal
- 5.5.2.7. Ireland
- 5.5.2.8. Austria
- 5.5.2.9. Switzerland
- 5.5.2.10. Benelux
- 5.5.2.11. Nordic
- 5.5.2.12. Rest of Western Europe
- 6. Eastern Europe Kaolin Market Analysis, Opportunity and Forecast, 2016-2032
- 6.1. Eastern Europe Kaolin Market Analysis, 2016-2021
- 6.2. Eastern Europe Kaolin Market Opportunity and Forecast, 2023-2032
- 6.3. Eastern Europe Kaolin Market Analysis, Opportunity and Forecast, By By Grade , 2016-2032
- 6.3.1. Eastern Europe Kaolin Market Analysis by By Grade : Introduction
- 6.3.2. Market Size Absolute $ Opportunity Analysis and Forecast, By By Grade , 2016-2032
- 6.3.3. Hydrous
- 6.3.4. Calcined
- 6.3.5. Delaminated
- 6.3.6. Surface Treated
- 6.3.7. Structured
- 6.4. Eastern Europe Kaolin Market Analysis, Opportunity and Forecast, By By Application, 2016-2032
- 6.4.1. Eastern Europe Kaolin Market Analysis by By Application: Introduction
- 6.4.2. Market Size Absolute $ Opportunity Analysis and Forecast, By By Application, 2016-2032
- 6.4.3. Paper
- 6.4.4. Ceramics
- 6.4.5. Paint & Coatings
- 6.4.6. Pharmaceuticals & Medical
- 6.4.7. Cosmetics
- 6.4.8. Fiberglass
- 6.4.9. Plastic
- 6.4.10. Rubber
- 6.4.11. Others
- 6.5. Eastern Europe Kaolin Market Analysis, Opportunity and Forecast, By Country , 2016-2032
- 6.5.1. Eastern Europe Kaolin Market Analysis by Country : Introduction
- 6.5.2. Market Size Absolute $ Opportunity Analysis and Forecast, Country , 2016-2032
- 6.5.2.1. Russia
- 6.5.2.2. Poland
- 6.5.2.3. The Czech Republic
- 6.5.2.4. Greece
- 6.5.2.5. Rest of Eastern Europe
- 7. APAC Kaolin Market Analysis, Opportunity and Forecast, 2016-2032
- 7.1. APAC Kaolin Market Analysis, 2016-2021
- 7.2. APAC Kaolin Market Opportunity and Forecast, 2023-2032
- 7.3. APAC Kaolin Market Analysis, Opportunity and Forecast, By By Grade , 2016-2032
- 7.3.1. APAC Kaolin Market Analysis by By Grade : Introduction
- 7.3.2. Market Size Absolute $ Opportunity Analysis and Forecast, By By Grade , 2016-2032
- 7.3.3. Hydrous
- 7.3.4. Calcined
- 7.3.5. Delaminated
- 7.3.6. Surface Treated
- 7.3.7. Structured
- 7.4. APAC Kaolin Market Analysis, Opportunity and Forecast, By By Application, 2016-2032
- 7.4.1. APAC Kaolin Market Analysis by By Application: Introduction
- 7.4.2. Market Size Absolute $ Opportunity Analysis and Forecast, By By Application, 2016-2032
- 7.4.3. Paper
- 7.4.4. Ceramics
- 7.4.5. Paint & Coatings
- 7.4.6. Pharmaceuticals & Medical
- 7.4.7. Cosmetics
- 7.4.8. Fiberglass
- 7.4.9. Plastic
- 7.4.10. Rubber
- 7.4.11. Others
- 7.5. APAC Kaolin Market Analysis, Opportunity and Forecast, By Country , 2016-2032
- 7.5.1. APAC Kaolin Market Analysis by Country : Introduction
- 7.5.2. Market Size Absolute $ Opportunity Analysis and Forecast, Country , 2016-2032
- 7.5.2.1. China
- 7.5.2.2. Japan
- 7.5.2.3. South Korea
- 7.5.2.4. India
- 7.5.2.5. Australia & New Zeland
- 7.5.2.6. Indonesia
- 7.5.2.7. Malaysia
- 7.5.2.8. Philippines
- 7.5.2.9. Singapore
- 7.5.2.10. Thailand
- 7.5.2.11. Vietnam
- 7.5.2.12. Rest of APAC
- 8. Latin America Kaolin Market Analysis, Opportunity and Forecast, 2016-2032
- 8.1. Latin America Kaolin Market Analysis, 2016-2021
- 8.2. Latin America Kaolin Market Opportunity and Forecast, 2023-2032
- 8.3. Latin America Kaolin Market Analysis, Opportunity and Forecast, By By Grade , 2016-2032
- 8.3.1. Latin America Kaolin Market Analysis by By Grade : Introduction
- 8.3.2. Market Size Absolute $ Opportunity Analysis and Forecast, By By Grade , 2016-2032
- 8.3.3. Hydrous
- 8.3.4. Calcined
- 8.3.5. Delaminated
- 8.3.6. Surface Treated
- 8.3.7. Structured
- 8.4. Latin America Kaolin Market Analysis, Opportunity and Forecast, By By Application, 2016-2032
- 8.4.1. Latin America Kaolin Market Analysis by By Application: Introduction
- 8.4.2. Market Size Absolute $ Opportunity Analysis and Forecast, By By Application, 2016-2032
- 8.4.3. Paper
- 8.4.4. Ceramics
- 8.4.5. Paint & Coatings
- 8.4.6. Pharmaceuticals & Medical
- 8.4.7. Cosmetics
- 8.4.8. Fiberglass
- 8.4.9. Plastic
- 8.4.10. Rubber
- 8.4.11. Others
- 8.5. Latin America Kaolin Market Analysis, Opportunity and Forecast, By Country , 2016-2032
- 8.5.1. Latin America Kaolin Market Analysis by Country : Introduction
- 8.5.2. Market Size Absolute $ Opportunity Analysis and Forecast, Country , 2016-2032
- 8.5.2.1. Brazil
- 8.5.2.2. Colombia
- 8.5.2.3. Chile
- 8.5.2.4. Argentina
- 8.5.2.5. Costa Rica
- 8.5.2.6. Rest of Latin America
- 9. Middle East & Africa Kaolin Market Analysis, Opportunity and Forecast, 2016-2032
- 9.1. Middle East & Africa Kaolin Market Analysis, 2016-2021
- 9.2. Middle East & Africa Kaolin Market Opportunity and Forecast, 2023-2032
- 9.3. Middle East & Africa Kaolin Market Analysis, Opportunity and Forecast, By By Grade , 2016-2032
- 9.3.1. Middle East & Africa Kaolin Market Analysis by By Grade : Introduction
- 9.3.2. Market Size Absolute $ Opportunity Analysis and Forecast, By By Grade , 2016-2032
- 9.3.3. Hydrous
- 9.3.4. Calcined
- 9.3.5. Delaminated
- 9.3.6. Surface Treated
- 9.3.7. Structured
- 9.4. Middle East & Africa Kaolin Market Analysis, Opportunity and Forecast, By By Application, 2016-2032
- 9.4.1. Middle East & Africa Kaolin Market Analysis by By Application: Introduction
- 9.4.2. Market Size Absolute $ Opportunity Analysis and Forecast, By By Application, 2016-2032
- 9.4.3. Paper
- 9.4.4. Ceramics
- 9.4.5. Paint & Coatings
- 9.4.6. Pharmaceuticals & Medical
- 9.4.7. Cosmetics
- 9.4.8. Fiberglass
- 9.4.9. Plastic
- 9.4.10. Rubber
- 9.4.11. Others
- 9.5. Middle East & Africa Kaolin Market Analysis, Opportunity and Forecast, By Country , 2016-2032
- 9.5.1. Middle East & Africa Kaolin Market Analysis by Country : Introduction
- 9.5.2. Market Size Absolute $ Opportunity Analysis and Forecast, Country , 2016-2032
- 9.5.2.1. Algeria
- 9.5.2.2. Egypt
- 9.5.2.3. Israel
- 9.5.2.4. Kuwait
- 9.5.2.5. Nigeria
- 9.5.2.6. Saudi Arabia
- 9.5.2.7. South Africa
- 9.5.2.8. Turkey
- 9.5.2.9. The UAE
- 9.5.2.10. Rest of MEA
- 10. Global Kaolin Market Analysis, Opportunity and Forecast, By Region , 2016-2032
- 10.1. Global Kaolin Market Analysis by Region : Introduction
- 10.2. Market Size Absolute $ Opportunity Analysis and Forecast, By Region , 2016-2032
- 10.2.1. North America
- 10.2.2. Western Europe
- 10.2.3. Eastern Europe
- 10.2.4. APAC
- 10.2.5. Latin America
- 10.2.6. Middle East & Africa
- 11. Global Kaolin Market Competitive Landscape, Market Share Analysis, and Company Profiles
- 11.1. Market Share Analysis
- 11.2. Company Profiles
- 11.3. BASF SE
- 11.3.1. Company Overview
- 11.3.2. Financial Highlights
- 11.3.3. Product Portfolio
- 11.3.4. SWOT Analysis
- 11.3.5. Key Strategies and Developments
- 11.4. Quartz Works GmbH
- 11.4.1. Company Overview
- 11.4.2. Financial Highlights
- 11.4.3. Product Portfolio
- 11.4.4. SWOT Analysis
- 11.4.5. Key Strategies and Developments
- 11.5. EICL
- 11.5.1. Company Overview
- 11.5.2. Financial Highlights
- 11.5.3. Product Portfolio
- 11.5.4. SWOT Analysis
- 11.5.5. Key Strategies and Developments
- 11.6. Imerys
- 11.6.1. Company Overview
- 11.6.2. Financial Highlights
- 11.6.3. Product Portfolio
- 11.6.4. SWOT Analysis
- 11.6.5. Key Strategies and Developments
- 11.7. Sibelco
- 11.7.1. Company Overview
- 11.7.2. Financial Highlights
- 11.7.3. Product Portfolio
- 11.7.4. SWOT Analysis
- 11.7.5. Key Strategies and Developments
- 11.8. KaMin LLC
- 11.8.1. Company Overview
- 11.8.2. Financial Highlights
- 11.8.3. Product Portfolio
- 11.8.4. SWOT Analysis
- 11.8.5. Key Strategies and Developments
- 11.9. Koalin AD
- 11.9.1. Company Overview
- 11.9.2. Financial Highlights
- 11.9.3. Product Portfolio
- 11.9.4. SWOT Analysis
- 11.9.5. Key Strategies and Developments
- 11.10. KERAMOST AS
- 11.10.1. Company Overview
- 11.10.2. Financial Highlights
- 11.10.3. Product Portfolio
- 11.10.4. SWOT Analysis
- 11.10.5. Key Strategies and Developments
- 11.11. LB Minerals Ltd.
- 11.11.1. Company Overview
- 11.11.2. Financial Highlights
- 11.11.3. Product Portfolio
- 11.11.4. SWOT Analysis
- 11.11.5. Key Strategies and Developments
- 11.12. Lasselsberger GmbH
- 11.12.1. Company Overview
- 11.12.2. Financial Highlights
- 11.12.3. Product Portfolio
- 11.12.4. SWOT Analysis
- 11.12.5. Key Strategies and Developments
- 11.13.1. Company Overview
- 11.13.2. Financial Highlights
- 11.13.3. Product Portfolio
- 11.13.4. SWOT Analysis
- 11.13.5. Key Strategies and Developments
- 11.14. Thiele Kaolin Company
- 11.14.1. Company Overview
- 11.14.2. Financial Highlights
- 11.14.3. Product Portfolio
- 11.14.4. SWOT Analysis
- 11.14.5. Key Strategies and Developments
- 11.15. Active Minerals International
- 11.15.1. Company Overview
- 11.15.2. Financial Highlights
- 11.15.3. Product Portfolio
- 11.15.4. SWOT Analysis
- 11.15.5. Key Strategies and Developments
- 11.16. W. R. Grace & Co.
- 11.16.1. Company Overview
- 11.16.2. Financial Highlights
- 11.16.3. Product Portfolio
- 11.16.4. SWOT Analysis
- 11.16.5. Key Strategies and Developments
- 11.17. SCR-Sibelco
- 11.17.1. Company Overview
- 11.17.2. Financial Highlights
- 11.17.3. Product Portfolio
- 11.17.4. SWOT Analysis
- 11.17.5. Key Strategies and Developments
- 12. Assumptions and Acronyms
- 13. Research Methodology
- 14. Contact
"
- List of Figures
- "
- Figure 1: Global Kaolin Market Revenue (US$ Mn) Market Share by By Grade in 2022
- Figure 2: Global Kaolin Market Market Attractiveness Analysis by By Grade , 2016-2032
- Figure 3: Global Kaolin Market Revenue (US$ Mn) Market Share by By Applicationin 2022
- Figure 4: Global Kaolin Market Market Attractiveness Analysis by By Application, 2016-2032
- Figure 5: Global Kaolin Market Revenue (US$ Mn) Market Share by Region in 2022
- Figure 6: Global Kaolin Market Market Attractiveness Analysis by Region, 2016-2032
- Figure 7: Global Kaolin Market Market Revenue (US$ Mn) (2016-2032)
- Figure 8: Global Kaolin Market Market Revenue (US$ Mn) Comparison by Region (2016-2032)
- Figure 9: Global Kaolin Market Market Revenue (US$ Mn) Comparison by By Grade (2016-2032)
- Figure 10: Global Kaolin Market Market Revenue (US$ Mn) Comparison by By Application (2016-2032)
- Figure 11: Global Kaolin Market Market Y-o-Y Growth Rate Comparison by Region (2016-2032)
- Figure 12: Global Kaolin Market Market Y-o-Y Growth Rate Comparison by By Grade (2016-2032)
- Figure 13: Global Kaolin Market Market Y-o-Y Growth Rate Comparison by By Application (2016-2032)
- Figure 14: Global Kaolin Market Market Share Comparison by Region (2016-2032)
- Figure 15: Global Kaolin Market Market Share Comparison by By Grade (2016-2032)
- Figure 16: Global Kaolin Market Market Share Comparison by By Application (2016-2032)
- Figure 17: North America Kaolin Market Revenue (US$ Mn) Market Share by By Grade in 2022
- Figure 18: North America Kaolin Market Market Attractiveness Analysis by By Grade , 2016-2032
- Figure 19: North America Kaolin Market Revenue (US$ Mn) Market Share by By Applicationin 2022
- Figure 20: North America Kaolin Market Market Attractiveness Analysis by By Application, 2016-2032
- Figure 21: North America Kaolin Market Revenue (US$ Mn) Market Share by Country in 2022
- Figure 22: North America Kaolin Market Market Attractiveness Analysis by Country, 2016-2032
- Figure 23: North America Kaolin Market Market Revenue (US$ Mn) (2016-2032)
- Figure 24: North America Kaolin Market Market Revenue (US$ Mn) Comparison by Country (2016-2032)
- Figure 25: North America Kaolin Market Market Revenue (US$ Mn) Comparison by By Grade (2016-2032)
- Figure 26: North America Kaolin Market Market Revenue (US$ Mn) Comparison by By Application (2016-2032)
- Figure 27: North America Kaolin Market Market Y-o-Y Growth Rate Comparison by Country (2016-2032)
- Figure 28: North America Kaolin Market Market Y-o-Y Growth Rate Comparison by By Grade (2016-2032)
- Figure 29: North America Kaolin Market Market Y-o-Y Growth Rate Comparison by By Application (2016-2032)
- Figure 30: North America Kaolin Market Market Share Comparison by Country (2016-2032)
- Figure 31: North America Kaolin Market Market Share Comparison by By Grade (2016-2032)
- Figure 32: North America Kaolin Market Market Share Comparison by By Application (2016-2032)
- Figure 33: Western Europe Kaolin Market Revenue (US$ Mn) Market Share by By Grade in 2022
- Figure 34: Western Europe Kaolin Market Market Attractiveness Analysis by By Grade , 2016-2032
- Figure 35: Western Europe Kaolin Market Revenue (US$ Mn) Market Share by By Applicationin 2022
- Figure 36: Western Europe Kaolin Market Market Attractiveness Analysis by By Application, 2016-2032
- Figure 37: Western Europe Kaolin Market Revenue (US$ Mn) Market Share by Country in 2022
- Figure 38: Western Europe Kaolin Market Market Attractiveness Analysis by Country, 2016-2032
- Figure 39: Western Europe Kaolin Market Market Revenue (US$ Mn) (2016-2032)
- Figure 40: Western Europe Kaolin Market Market Revenue (US$ Mn) Comparison by Country (2016-2032)
- Figure 41: Western Europe Kaolin Market Market Revenue (US$ Mn) Comparison by By Grade (2016-2032)
- Figure 42: Western Europe Kaolin Market Market Revenue (US$ Mn) Comparison by By Application (2016-2032)
- Figure 43: Western Europe Kaolin Market Market Y-o-Y Growth Rate Comparison by Country (2016-2032)
- Figure 44: Western Europe Kaolin Market Market Y-o-Y Growth Rate Comparison by By Grade (2016-2032)
- Figure 45: Western Europe Kaolin Market Market Y-o-Y Growth Rate Comparison by By Application (2016-2032)
- Figure 46: Western Europe Kaolin Market Market Share Comparison by Country (2016-2032)
- Figure 47: Western Europe Kaolin Market Market Share Comparison by By Grade (2016-2032)
- Figure 48: Western Europe Kaolin Market Market Share Comparison by By Application (2016-2032)
- Figure 49: Eastern Europe Kaolin Market Revenue (US$ Mn) Market Share by By Grade in 2022
- Figure 50: Eastern Europe Kaolin Market Market Attractiveness Analysis by By Grade , 2016-2032
- Figure 51: Eastern Europe Kaolin Market Revenue (US$ Mn) Market Share by By Applicationin 2022
- Figure 52: Eastern Europe Kaolin Market Market Attractiveness Analysis by By Application, 2016-2032
- Figure 53: Eastern Europe Kaolin Market Revenue (US$ Mn) Market Share by Country in 2022
- Figure 54: Eastern Europe Kaolin Market Market Attractiveness Analysis by Country, 2016-2032
- Figure 55: Eastern Europe Kaolin Market Market Revenue (US$ Mn) (2016-2032)
- Figure 56: Eastern Europe Kaolin Market Market Revenue (US$ Mn) Comparison by Country (2016-2032)
- Figure 57: Eastern Europe Kaolin Market Market Revenue (US$ Mn) Comparison by By Grade (2016-2032)
- Figure 58: Eastern Europe Kaolin Market Market Revenue (US$ Mn) Comparison by By Application (2016-2032)
- Figure 59: Eastern Europe Kaolin Market Market Y-o-Y Growth Rate Comparison by Country (2016-2032)
- Figure 60: Eastern Europe Kaolin Market Market Y-o-Y Growth Rate Comparison by By Grade (2016-2032)
- Figure 61: Eastern Europe Kaolin Market Market Y-o-Y Growth Rate Comparison by By Application (2016-2032)
- Figure 62: Eastern Europe Kaolin Market Market Share Comparison by Country (2016-2032)
- Figure 63: Eastern Europe Kaolin Market Market Share Comparison by By Grade (2016-2032)
- Figure 64: Eastern Europe Kaolin Market Market Share Comparison by By Application (2016-2032)
- Figure 65: APAC Kaolin Market Revenue (US$ Mn) Market Share by By Grade in 2022
- Figure 66: APAC Kaolin Market Market Attractiveness Analysis by By Grade , 2016-2032
- Figure 67: APAC Kaolin Market Revenue (US$ Mn) Market Share by By Applicationin 2022
- Figure 68: APAC Kaolin Market Market Attractiveness Analysis by By Application, 2016-2032
- Figure 69: APAC Kaolin Market Revenue (US$ Mn) Market Share by Country in 2022
- Figure 70: APAC Kaolin Market Market Attractiveness Analysis by Country, 2016-2032
- Figure 71: APAC Kaolin Market Market Revenue (US$ Mn) (2016-2032)
- Figure 72: APAC Kaolin Market Market Revenue (US$ Mn) Comparison by Country (2016-2032)
- Figure 73: APAC Kaolin Market Market Revenue (US$ Mn) Comparison by By Grade (2016-2032)
- Figure 74: APAC Kaolin Market Market Revenue (US$ Mn) Comparison by By Application (2016-2032)
- Figure 75: APAC Kaolin Market Market Y-o-Y Growth Rate Comparison by Country (2016-2032)
- Figure 76: APAC Kaolin Market Market Y-o-Y Growth Rate Comparison by By Grade (2016-2032)
- Figure 77: APAC Kaolin Market Market Y-o-Y Growth Rate Comparison by By Application (2016-2032)
- Figure 78: APAC Kaolin Market Market Share Comparison by Country (2016-2032)
- Figure 79: APAC Kaolin Market Market Share Comparison by By Grade (2016-2032)
- Figure 80: APAC Kaolin Market Market Share Comparison by By Application (2016-2032)
- Figure 81: Latin America Kaolin Market Revenue (US$ Mn) Market Share by By Grade in 2022
- Figure 82: Latin America Kaolin Market Market Attractiveness Analysis by By Grade , 2016-2032
- Figure 83: Latin America Kaolin Market Revenue (US$ Mn) Market Share by By Applicationin 2022
- Figure 84: Latin America Kaolin Market Market Attractiveness Analysis by By Application, 2016-2032
- Figure 85: Latin America Kaolin Market Revenue (US$ Mn) Market Share by Country in 2022
- Figure 86: Latin America Kaolin Market Market Attractiveness Analysis by Country, 2016-2032
- Figure 87: Latin America Kaolin Market Market Revenue (US$ Mn) (2016-2032)
- Figure 88: Latin America Kaolin Market Market Revenue (US$ Mn) Comparison by Country (2016-2032)
- Figure 89: Latin America Kaolin Market Market Revenue (US$ Mn) Comparison by By Grade (2016-2032)
- Figure 90: Latin America Kaolin Market Market Revenue (US$ Mn) Comparison by By Application (2016-2032)
- Figure 91: Latin America Kaolin Market Market Y-o-Y Growth Rate Comparison by Country (2016-2032)
- Figure 92: Latin America Kaolin Market Market Y-o-Y Growth Rate Comparison by By Grade (2016-2032)
- Figure 93: Latin America Kaolin Market Market Y-o-Y Growth Rate Comparison by By Application (2016-2032)
- Figure 94: Latin America Kaolin Market Market Share Comparison by Country (2016-2032)
- Figure 95: Latin America Kaolin Market Market Share Comparison by By Grade (2016-2032)
- Figure 96: Latin America Kaolin Market Market Share Comparison by By Application (2016-2032)
- Figure 97: Middle East & Africa Kaolin Market Revenue (US$ Mn) Market Share by By Grade in 2022
- Figure 98: Middle East & Africa Kaolin Market Market Attractiveness Analysis by By Grade , 2016-2032
- Figure 99: Middle East & Africa Kaolin Market Revenue (US$ Mn) Market Share by By Applicationin 2022
- Figure 100: Middle East & Africa Kaolin Market Market Attractiveness Analysis by By Application, 2016-2032
- Figure 101: Middle East & Africa Kaolin Market Revenue (US$ Mn) Market Share by Country in 2022
- Figure 102: Middle East & Africa Kaolin Market Market Attractiveness Analysis by Country, 2016-2032
- Figure 103: Middle East & Africa Kaolin Market Market Revenue (US$ Mn) (2016-2032)
- Figure 104: Middle East & Africa Kaolin Market Market Revenue (US$ Mn) Comparison by Country (2016-2032)
- Figure 105: Middle East & Africa Kaolin Market Market Revenue (US$ Mn) Comparison by By Grade (2016-2032)
- Figure 106: Middle East & Africa Kaolin Market Market Revenue (US$ Mn) Comparison by By Application (2016-2032)
- Figure 107: Middle East & Africa Kaolin Market Market Y-o-Y Growth Rate Comparison by Country (2016-2032)
- Figure 108: Middle East & Africa Kaolin Market Market Y-o-Y Growth Rate Comparison by By Grade (2016-2032)
- Figure 109: Middle East & Africa Kaolin Market Market Y-o-Y Growth Rate Comparison by By Application (2016-2032)
- Figure 110: Middle East & Africa Kaolin Market Market Share Comparison by Country (2016-2032)
- Figure 111: Middle East & Africa Kaolin Market Market Share Comparison by By Grade (2016-2032)
- Figure 112: Middle East & Africa Kaolin Market Market Share Comparison by By Application (2016-2032)
"
- List of Tables
- "
- Table 1: Global Kaolin Market Market Comparison by By Grade (2016-2032)
- Table 2: Global Kaolin Market Market Comparison by By Application (2016-2032)
- Table 3: Global Kaolin Market Revenue (US$ Mn) Comparison by Region (2016-2032)
- Table 4: Global Kaolin Market Market Revenue (US$ Mn) (2016-2032)
- Table 5: Global Kaolin Market Market Revenue (US$ Mn) Comparison by Region (2016-2032)
- Table 6: Global Kaolin Market Market Revenue (US$ Mn) Comparison by By Grade (2016-2032)
- Table 7: Global Kaolin Market Market Revenue (US$ Mn) Comparison by By Application (2016-2032)
- Table 8: Global Kaolin Market Market Y-o-Y Growth Rate Comparison by Region (2016-2032)
- Table 9: Global Kaolin Market Market Y-o-Y Growth Rate Comparison by By Grade (2016-2032)
- Table 10: Global Kaolin Market Market Y-o-Y Growth Rate Comparison by By Application (2016-2032)
- Table 11: Global Kaolin Market Market Share Comparison by Region (2016-2032)
- Table 12: Global Kaolin Market Market Share Comparison by By Grade (2016-2032)
- Table 13: Global Kaolin Market Market Share Comparison by By Application (2016-2032)
- Table 14: North America Kaolin Market Market Comparison by By Application (2016-2032)
- Table 15: North America Kaolin Market Revenue (US$ Mn) Comparison by Country (2016-2032)
- Table 16: North America Kaolin Market Market Revenue (US$ Mn) (2016-2032)
- Table 17: North America Kaolin Market Market Revenue (US$ Mn) Comparison by Country (2016-2032)
- Table 18: North America Kaolin Market Market Revenue (US$ Mn) Comparison by By Grade (2016-2032)
- Table 19: North America Kaolin Market Market Revenue (US$ Mn) Comparison by By Application (2016-2032)
- Table 20: North America Kaolin Market Market Y-o-Y Growth Rate Comparison by Country (2016-2032)
- Table 21: North America Kaolin Market Market Y-o-Y Growth Rate Comparison by By Grade (2016-2032)
- Table 22: North America Kaolin Market Market Y-o-Y Growth Rate Comparison by By Application (2016-2032)
- Table 23: North America Kaolin Market Market Share Comparison by Country (2016-2032)
- Table 24: North America Kaolin Market Market Share Comparison by By Grade (2016-2032)
- Table 25: North America Kaolin Market Market Share Comparison by By Application (2016-2032)
- Table 26: Western Europe Kaolin Market Market Comparison by By Grade (2016-2032)
- Table 27: Western Europe Kaolin Market Market Comparison by By Application (2016-2032)
- Table 28: Western Europe Kaolin Market Revenue (US$ Mn) Comparison by Country (2016-2032)
- Table 29: Western Europe Kaolin Market Market Revenue (US$ Mn) (2016-2032)
- Table 30: Western Europe Kaolin Market Market Revenue (US$ Mn) Comparison by Country (2016-2032)
- Table 31: Western Europe Kaolin Market Market Revenue (US$ Mn) Comparison by By Grade (2016-2032)
- Table 32: Western Europe Kaolin Market Market Revenue (US$ Mn) Comparison by By Application (2016-2032)
- Table 33: Western Europe Kaolin Market Market Y-o-Y Growth Rate Comparison by Country (2016-2032)
- Table 34: Western Europe Kaolin Market Market Y-o-Y Growth Rate Comparison by By Grade (2016-2032)
- Table 35: Western Europe Kaolin Market Market Y-o-Y Growth Rate Comparison by By Application (2016-2032)
- Table 36: Western Europe Kaolin Market Market Share Comparison by Country (2016-2032)
- Table 37: Western Europe Kaolin Market Market Share Comparison by By Grade (2016-2032)
- Table 38: Western Europe Kaolin Market Market Share Comparison by By Application (2016-2032)
- Table 39: Eastern Europe Kaolin Market Market Comparison by By Grade (2016-2032)
- Table 40: Eastern Europe Kaolin Market Market Comparison by By Application (2016-2032)
- Table 41: Eastern Europe Kaolin Market Revenue (US$ Mn) Comparison by Country (2016-2032)
- Table 42: Eastern Europe Kaolin Market Market Revenue (US$ Mn) (2016-2032)
- Table 43: Eastern Europe Kaolin Market Market Revenue (US$ Mn) Comparison by Country (2016-2032)
- Table 44: Eastern Europe Kaolin Market Market Revenue (US$ Mn) Comparison by By Grade (2016-2032)
- Table 45: Eastern Europe Kaolin Market Market Revenue (US$ Mn) Comparison by By Application (2016-2032)
- Table 46: Eastern Europe Kaolin Market Market Y-o-Y Growth Rate Comparison by Country (2016-2032)
- Table 47: Eastern Europe Kaolin Market Market Y-o-Y Growth Rate Comparison by By Grade (2016-2032)
- Table 48: Eastern Europe Kaolin Market Market Y-o-Y Growth Rate Comparison by By Application (2016-2032)
- Table 49: Eastern Europe Kaolin Market Market Share Comparison by Country (2016-2032)
- Table 50: Eastern Europe Kaolin Market Market Share Comparison by By Grade (2016-2032)
- Table 51: Eastern Europe Kaolin Market Market Share Comparison by By Application (2016-2032)
- Table 52: APAC Kaolin Market Market Comparison by By Grade (2016-2032)
- Table 53: APAC Kaolin Market Market Comparison by By Application (2016-2032)
- Table 54: APAC Kaolin Market Revenue (US$ Mn) Comparison by Country (2016-2032)
- Table 55: APAC Kaolin Market Market Revenue (US$ Mn) (2016-2032)
- Table 56: APAC Kaolin Market Market Revenue (US$ Mn) Comparison by Country (2016-2032)
- Table 57: APAC Kaolin Market Market Revenue (US$ Mn) Comparison by By Grade (2016-2032)
- Table 58: APAC Kaolin Market Market Revenue (US$ Mn) Comparison by By Application (2016-2032)
- Table 59: APAC Kaolin Market Market Y-o-Y Growth Rate Comparison by Country (2016-2032)
- Table 60: APAC Kaolin Market Market Y-o-Y Growth Rate Comparison by By Grade (2016-2032)
- Table 61: APAC Kaolin Market Market Y-o-Y Growth Rate Comparison by By Application (2016-2032)
- Table 62: APAC Kaolin Market Market Share Comparison by Country (2016-2032)
- Table 63: APAC Kaolin Market Market Share Comparison by By Grade (2016-2032)
- Table 64: APAC Kaolin Market Market Share Comparison by By Application (2016-2032)
- Table 65: Latin America Kaolin Market Market Comparison by By Grade (2016-2032)
- Table 66: Latin America Kaolin Market Market Comparison by By Application (2016-2032)
- Table 67: Latin America Kaolin Market Revenue (US$ Mn) Comparison by Country (2016-2032)
- Table 68: Latin America Kaolin Market Market Revenue (US$ Mn) (2016-2032)
- Table 69: Latin America Kaolin Market Market Revenue (US$ Mn) Comparison by Country (2016-2032)
- Table 70: Latin America Kaolin Market Market Revenue (US$ Mn) Comparison by By Grade (2016-2032)
- Table 71: Latin America Kaolin Market Market Revenue (US$ Mn) Comparison by By Application (2016-2032)
- Table 72: Latin America Kaolin Market Market Y-o-Y Growth Rate Comparison by Country (2016-2032)
- Table 73: Latin America Kaolin Market Market Y-o-Y Growth Rate Comparison by By Grade (2016-2032)
- Table 74: Latin America Kaolin Market Market Y-o-Y Growth Rate Comparison by By Application (2016-2032)
- Table 75: Latin America Kaolin Market Market Share Comparison by Country (2016-2032)
- Table 76: Latin America Kaolin Market Market Share Comparison by By Grade (2016-2032)
- Table 77: Latin America Kaolin Market Market Share Comparison by By Application (2016-2032)
- Table 78: Middle East & Africa Kaolin Market Market Comparison by By Grade (2016-2032)
- Table 79: Middle East & Africa Kaolin Market Market Comparison by By Application (2016-2032)
- Table 80: Middle East & Africa Kaolin Market Revenue (US$ Mn) Comparison by Country (2016-2032)
- Table 81: Middle East & Africa Kaolin Market Market Revenue (US$ Mn) (2016-2032)
- Table 82: Middle East & Africa Kaolin Market Market Revenue (US$ Mn) Comparison by Country (2016-2032)
- Table 83: Middle East & Africa Kaolin Market Market Revenue (US$ Mn) Comparison by By Grade (2016-2032)
- Table 84: Middle East & Africa Kaolin Market Market Revenue (US$ Mn) Comparison by By Application (2016-2032)
- Table 85: Middle East & Africa Kaolin Market Market Y-o-Y Growth Rate Comparison by Country (2016-2032)
- Table 86: Middle East & Africa Kaolin Market Market Y-o-Y Growth Rate Comparison by By Grade (2016-2032)
- Table 87: Middle East & Africa Kaolin Market Market Y-o-Y Growth Rate Comparison by By Application (2016-2032)
- Table 88: Middle East & Africa Kaolin Market Market Share Comparison by Country (2016-2032)
- Table 89: Middle East & Africa Kaolin Market Market Share Comparison by By Grade (2016-2032)
- Table 90: Middle East & Africa Kaolin Market Market Share Comparison by By Application (2016-2032)
- 1. Executive Summary
-
- BASF SE
- Quartz Works GmbH
- EICL
- Imerys
- Sibelco
- KaMin LLC
- Koalin AD
- KERAMOST AS
- LB Minerals Ltd.
- Lasselsberger GmbH
- Thiele Kaolin Company
- R.T. Vanderbilt Holding Company, Inc
- Active Minerals International
- W. R. Grace & Co.
- SCR-Sibelco
Our Clients


View Our Licence Options
