
Internet of Things (IoT) in Energy Market By Component (Platform, Solutions, Services), By Network Technology (Cellular Network, Satellite Network, Radio Network, Others), By Application (Oil and Gas, Coal Mining, Smart Grid), By Region And Companies - Industry Segment Outlook, Market Assessment, Competition Scenario, Trends, And Forecast 2024-2033
-
51183
-
September 2024
-
300
-


-
This report was compiled by Vishwa Gaul Vishwa is an experienced market research and consulting professional with over 8 years of expertise in the ICT industry, contributing to over 700 reports across telecommunications, software, hardware, and digital solutions. Correspondence Team Lead- ICT Linkedin | Detailed Market research Methodology Our methodology involves a mix of primary research, including interviews with leading mental health experts, and secondary research from reputable medical journals and databases. View Detailed Methodology Page
-
Quick Navigation
Report Overview
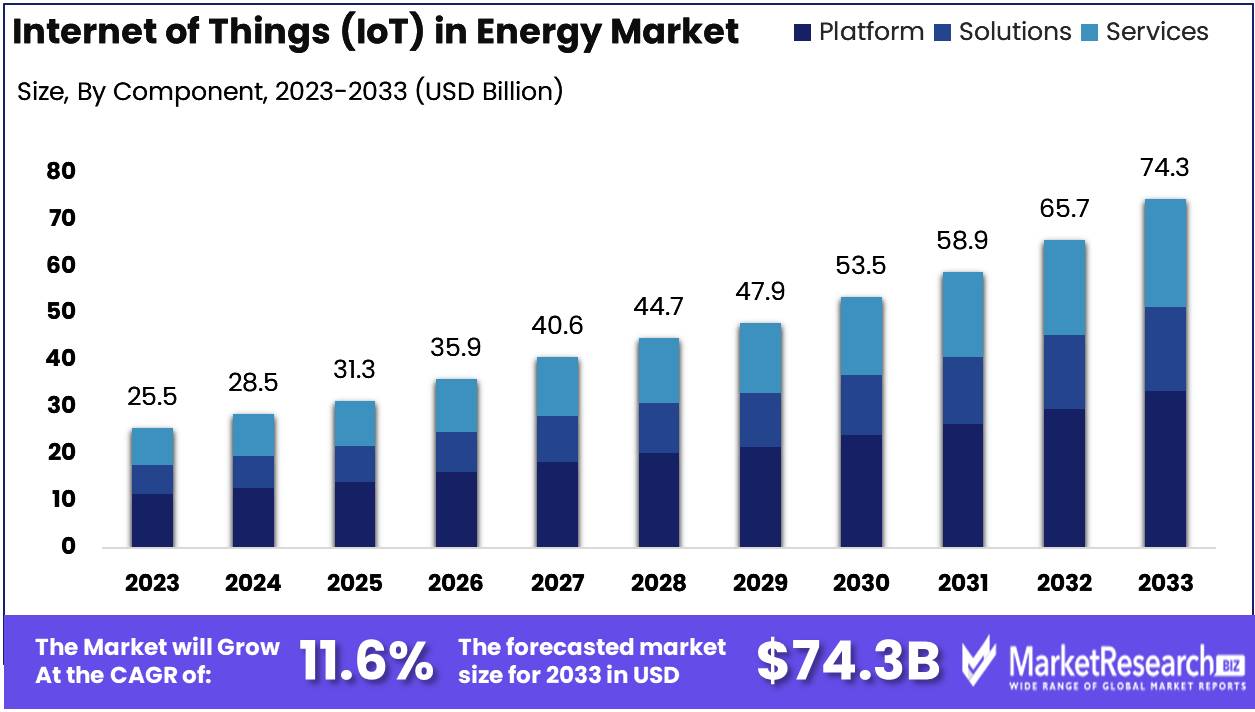
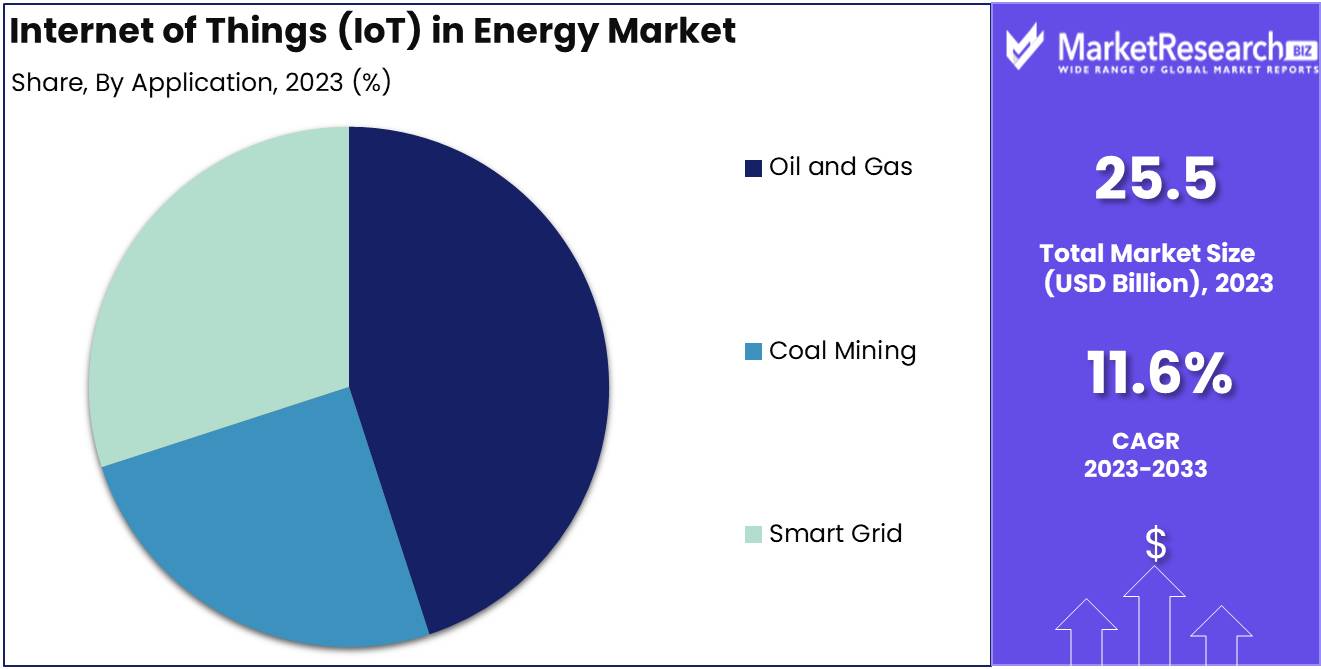
The Internet of Things (IoT) in the Energy Market was valued at USD 25.5 billion in 2023. It is expected to reach USD 74.3 billion by 2033, with a CAGR of 11.6% during the forecast period from 2024 to 2033.
The Internet of Things (IoT) in the Energy Market refers to integrating connected devices, sensors, and data analytics platforms to optimize energy generation, distribution, and consumption. IoT technology enables real-time monitoring, predictive maintenance, and enhanced efficiency across the energy supply chain, from power plants to smart grids and end-user systems.
The Internet of Things (IoT) is expected to play a pivotal role in transforming the energy sector and driving efficiency and sustainability across various segments. IoT technologies enable real-time data collection, predictive analytics, and automation, which are crucial in optimizing energy consumption and improving grid management. As global energy demand continues to rise, energy efficiency initiatives are becoming increasingly important. IoT solutions, particularly in energy-intensive industries, can lead to significant reductions in energy wastage, supporting both cost savings and environmental goals. Additionally, smart grids, powered by IoT and digital transformation, are enabling utilities to manage energy distribution more efficiently, accommodating fluctuations in demand and integrating renewable energy sources seamlessly.
However, the growing reliance on IoT also presents cybersecurity risks, especially as the number of connected devices increases exponentially. The energy sector remains a prime target for cyber-attacks, making robust cybersecurity frameworks essential for mitigating risks. Furthermore, the growth of renewable energy projects globally is accelerating the adoption of IoT technologies. These projects rely heavily on IoT for monitoring and optimizing operations, ensuring that energy generation from sources like wind and solar is efficiently captured and integrated into the grid. In conclusion, the IoT in the energy market is positioned to significantly enhance operational efficiency and sustainability, although the industry must address cybersecurity concerns to ensure secure and resilient energy systems. As renewable energy continues to grow, IoT’s role in facilitating this transition will likely become even more critical.
Key Takeaways
- Market Growth: The Internet of Things (IoT) in the Energy Market was valued at USD 25.5 billion in 2023. It is expected to reach USD 74.3 billion by 2033, with a CAGR of 11.6% during the forecast period from 2024 to 2033.
- By Component: Platforms dominated IoT energy systems with seamless integration.
- By Network Technology: Cellular Networks dominated IoT connectivity in the energy sector.
- By Application: Oil and Gas dominated IoT adoption in energy applications.
- Regional Dominance: North America dominates IoT in energy, holding a 35% larest share.
- Growth Opportunity: The global IoT in the energy market offers significant growth opportunities through predictive maintenance and renewable energy integration, driving efficiency, cost reduction, and smarter energy management solutions.
Driving factors
Smart Grid Development: Accelerating IoT Adoption in the Energy Market
The growth of smart grid infrastructure is one of the most critical factors driving the expansion of the Internet of Things (IoT) in the energy sector. A smart grid leverages IoT technologies to enable real-time communication between energy providers and consumers, improving the overall efficiency, reliability, and sustainability of energy distribution. IoT-enabled sensors and devices allow for advanced metering, predictive maintenance, and dynamic energy management, leading to a reduction in energy losses and operational costs.
By 2030, it is expected that global smart grid investments will surpass $110 billion, driven by the increasing need to modernize outdated electrical grids to handle distributed renewable energy sources and decentralized energy generation. The deployment of IoT devices in smart grids is crucial for this transformation, as it enhances grid flexibility, optimizes load balancing, and reduces downtime through predictive analytics and fault detection.
Energy Efficiency Demand: Enhancing Sustainability with IoT Solutions
The rising demand for energy efficiency is another major factor contributing to the growth of IoT in the energy market. As governments and industries increasingly prioritize sustainability and carbon reduction, IoT-based solutions are essential for monitoring and optimizing energy consumption. These technologies provide granular data on energy usage, enabling more effective energy-saving measures and reducing unnecessary waste.
For instance, IoT-based building management systems (BMS) utilize sensors and connected devices to monitor and adjust energy use in real time, helping reduce consumption by up to 30% in some cases. Furthermore, many countries have enacted stringent energy efficiency regulations, such as the European Union's Energy Efficiency Directive, which mandates energy efficiency improvements across sectors, driving higher adoption rates of IoT technologies in energy systems.
Technological Advancements: Enabling Sophisticated IoT Solutions
Technological advancements are a cornerstone in the growth of IoT in the energy market, as innovations in cloud computing, artificial intelligence (AI), and machine learning (ML) enable more sophisticated and scalable IoT applications. AI and ML algorithms analyze the massive data generated by IoT devices to provide actionable insights for optimizing energy production, distribution, and consumption. For example, predictive maintenance powered by AI helps energy providers anticipate equipment failures, thereby reducing downtime and repair costs.
Furthermore, the evolution of 5G technology is facilitating the deployment of IoT networks by providing faster data transfer speeds, lower latency, and improved connectivity, allowing for real-time energy management across larger areas. The global 5G rollout is expected to support billions of IoT devices by 2025, particularly in energy-intensive industries, leading to increased efficiency and operational automation.
Restraining Factors
Lack of Standardization: A Barrier to Interoperability and Scalability
The lack of standardization within the Internet of Things (IoT) in the energy market significantly hampers the growth of this sector. IoT solutions rely on the seamless interaction of various devices, sensors, and platforms. However, without established industry standards, companies are faced with challenges related to interoperability, as different systems may use incompatible protocols, architectures, and communication methods. This fragmentation creates operational inefficiencies and additional costs for integrating disparate systems, thus slowing the adoption of IoT technologies in the energy market.
Furthermore, the absence of global or industry-wide standards complicates the scalability of IoT solutions. Energy companies must often customize or adapt solutions for specific ecosystems, leading to higher costs and longer implementation timelines. The inability to streamline system integration and data sharing across devices constrains the full potential of IoT in optimizing energy management, smart grid technologies, and predictive maintenance.
This factor has long-term implications, as inconsistent standards across different regions or within sectors may inhibit innovation and lead to market fragmentation. For example, various national regulations or technical frameworks often conflict, making it difficult for energy companies to deploy IoT solutions globally. Therefore, the lack of standardization represents a critical restraining factor, as it limits both the scalability and the global reach of IoT applications in the energy sector.
Shortage of Skilled Workforce: Limiting Implementation and Innovation
The shortage of a skilled workforce in the IoT in the energy market represents another significant restraint, impacting both the adoption and innovation potential within this sector. IoT deployment in energy requires professionals who possess expertise in areas such as data analytics, cybersecurity, cloud computing, sensor technology, and network infrastructure. However, the industry faces a talent gap, with insufficient numbers of professionals trained in both IoT technologies and the specific requirements of the energy sector.
This shortage affects the market in several ways. First, the lack of skilled personnel delays the implementation of IoT projects, as companies struggle to find qualified workers capable of designing, installing, and maintaining these complex systems. According to industry reports, the global demand for IoT-skilled professionals is growing exponentially, yet supply is failing to keep pace, leading to project delays and cost overruns in energy firms trying to implement IoT solutions.
Secondly, the scarcity of talent stifles innovation. Energy companies are less likely to invest in cutting-edge IoT technologies if they cannot find the necessary human capital to support them. This can lead to slower advancements in key areas such as smart grid technologies, predictive maintenance systems, and energy efficiency initiatives. The ability of the IoT in the energy market to scale and evolve is intrinsically linked to the availability of skilled professionals capable of driving innovation forward.
By Component Analysis
In 2023, Platforms dominated IoT energy systems with seamless integration.
In 2023, Platform held a dominant market position in the By Component segment of the Internet of Things (IoT) in the Energy Market. Platforms, which provide the foundational architecture for IoT solutions, enable seamless integration of devices, data, and applications across energy systems. As energy companies sought to enhance operational efficiency and reduce downtime, IoT platforms became crucial for real-time monitoring and predictive maintenance. Their dominance was driven by the need for centralized control and data analytics capabilities, which streamlined energy production, distribution, and consumption processes.
Solutions, encompassing tailored applications for energy management, also played a significant role. These solutions leveraged IoT platforms to optimize asset performance, improve grid management, and enable energy-saving initiatives. The increasing focus on sustainability and regulatory compliance further fueled the demand for such solutions.
Services, including consulting, deployment, and managed services, supported the implementation and scalability of IoT initiatives within the energy sector. The growing complexity of IoT deployments necessitated professional services to ensure efficient system integration, cybersecurity, and long-term operational support, contributing to the overall growth of the IoT in the Energy Market.
By Network Technology Analysis
In 2023, Cellular Networks dominated IoT connectivity in the energy sector.
In 2023, Cellular Networks held a dominant market position in the By Network Technology segment of the Internet of Things (IoT) in the Energy Market. Cellular networks, particularly 4G and 5G, have been widely adopted due to their ability to provide high-speed, low-latency connectivity across vast energy infrastructures. Their scalability and capacity to support numerous IoT devices have made them a preferred solution for energy companies aiming to improve operational efficiency and real-time monitoring.
Satellite Network technology, although not as prevalent as cellular, plays a crucial role in remote areas where terrestrial infrastructure is limited. It is instrumental in ensuring connectivity in offshore oil rigs and distant renewable energy installations.
Radio Networks serve as a complementary technology, especially in closed or localized energy systems where a limited number of IoT devices need to communicate within a confined range, such as in smart grids.
Others, including technologies like LPWAN (Low Power Wide Area Networks), offer specialized connectivity options for energy IoT applications that require long battery life and low data transmission rates, enhancing their usage in low-power devices.
By Application Analysis
In 2023, Oil and Gas dominated IoT adoption in energy applications.
In 2023, Oil and Gas held a dominant market position in the By Application segment of the Internet of Things (IoT) in the Energy Market. The integration of IoT in this sector enabled significant improvements in monitoring, predictive maintenance, and operational efficiency. IoT solutions in oil and gas primarily focused on enhancing real-time data analytics, automating drilling processes, and ensuring equipment longevity through advanced sensors and monitoring systems. The adoption of IoT technologies allowed companies to reduce operational costs, minimize environmental risks, and optimize production output.
The Coal Mining segment also saw increased IoT adoption, driven by the need to enhance worker safety, improve asset utilization, and minimize downtimes. IoT devices were employed for real-time monitoring of mining equipment, environment, and worker conditions, helping to reduce accidents and operational inefficiencies.
In contrast, the Smart Grid application gained traction through IoT to enable intelligent monitoring, demand response, and predictive maintenance of energy distribution networks. IoT solutions allow utilities to manage energy consumption efficiently, integrate renewable energy sources, and improve grid reliability. The smart grid's digital transformation significantly contributed to overall energy efficiency and resource optimization.
Key Market Segments
By Component
- Platform
- Solutions
- Services
By Network Technology
- Cellular Network
- Satellite Network
- Radio Network
- Others
By Application
- Oil and Gas
- Coal Mining
- Smart Grid
Growth Opportunity
Predictive Maintenance: Driving Operational Efficiency and Cost Reduction
The implementation of IoT in energy systems allows for real-time monitoring and predictive maintenance, which is crucial for reducing downtime and operational costs. Advanced IoT sensors and analytics platforms enable energy companies to detect equipment failures before they occur, reducing the need for reactive repairs and prolonging the lifespan of critical infrastructure. In 2024, predictive maintenance is projected to lead to significant cost savings, particularly in the power generation and transmission sectors. Energy companies are expected to adopt predictive analytics at an accelerated pace, contributing to market expansion.
Renewable Energy Integration: Enabling Smarter Energy Management and Sustainability Goals
The integration of IoT technologies into renewable energy systems, such as solar and wind farms, is expected to revolutionize energy management. IoT-enabled platforms provide real-time data on energy production, grid stability, and consumption patterns, enhancing efficiency in managing distributed energy resources. The global shift towards sustainability and decarbonization will drive the adoption of IoT to optimize the integration of renewable energy into traditional grids. This transformation is anticipated to foster innovation and create new growth opportunities for the IoT in the energy market.
Latest Trends
Integration with Renewable Energy
The convergence of IoT and renewable energy will accelerate, driven by the rising demand for sustainable power solutions. IoT technology is expected to enhance the efficiency and reliability of renewable energy systems, particularly in solar and wind power generation. Real-time data monitoring, predictive maintenance, and automated grid management will enable utilities to optimize renewable energy integration into national grids. This trend is anticipated to reduce operational costs and improve energy storage and distribution. Moreover, smart grids, powered by IoT, will provide greater flexibility in balancing supply and demand, contributing to the decarbonization of the energy sector.
AI and Machine Learning Integration
The integration of Artificial Intelligence (AI) and Machine Learning (ML) within IoT platforms will be a pivotal trend in 2024. AI-driven analytics are expected to provide actionable insights from the vast amounts of data generated by IoT devices in energy systems. This will allow for more accurate demand forecasting, optimizing energy consumption patterns, and enabling autonomous decision-making in grid management. Machine learning algorithms will play a crucial role in enhancing predictive maintenance capabilities, reducing downtime, and improving asset lifecycles. The combined power of AI and IoT will lead to smarter, more adaptive energy systems that can respond efficiently to dynamic energy demands and external factors like weather fluctuations.
Regional Analysis
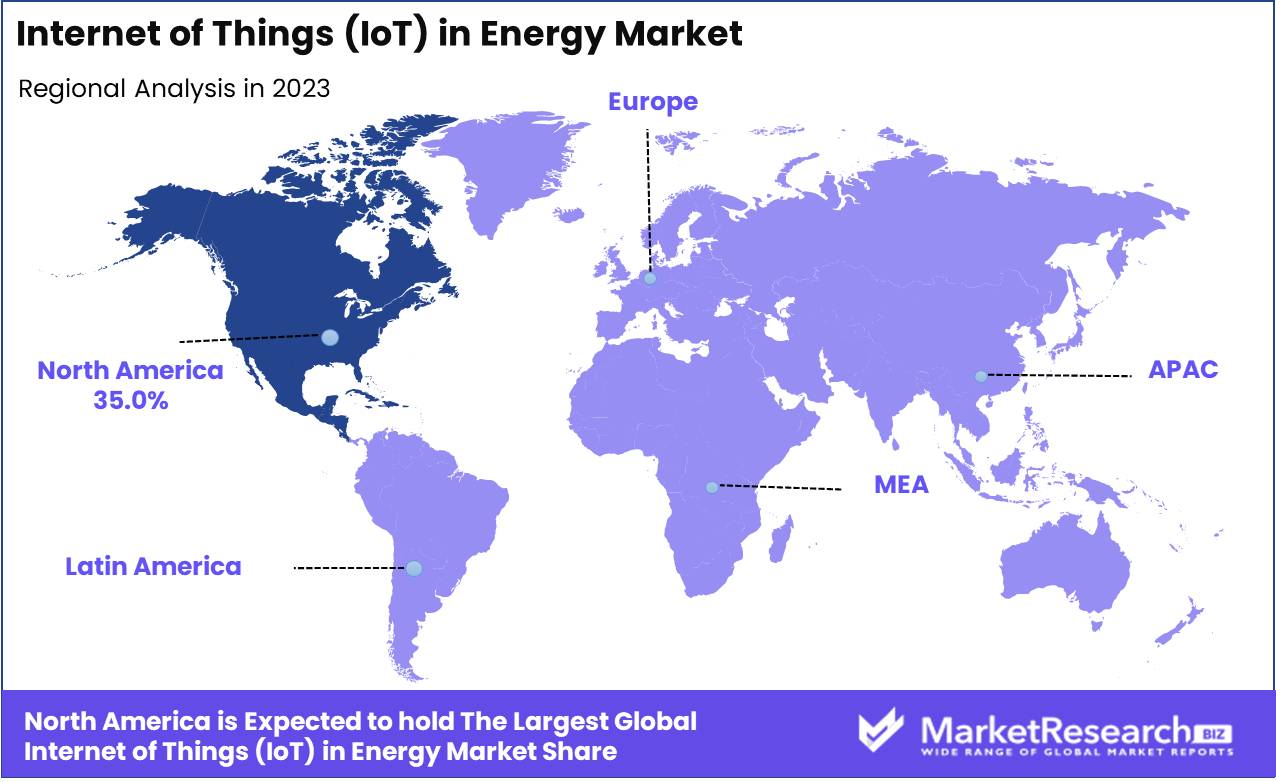
North America dominates IoT in energy, holding a 35% larest share.
The Internet of Things (IoT) in the energy market demonstrates varied growth across regions, with North America leading the market, accounting for approximately 35% of the global IoT in energy market share. The region’s dominance can be attributed to early technological adoption, robust infrastructure, and significant investments by key players in smart grid technologies. The United States and Canada are at the forefront, implementing IoT solutions to enhance energy efficiency and reduce operational costs.
Europe follows closely, holding around 30% of the market share, driven by stringent regulations promoting renewable energy and smart energy management. Countries such as Germany, the UK, and France have implemented IoT in energy systems for optimizing grid operations and enhancing renewable energy integration.
Asia Pacific is poised to experience the fastest growth, with a CAGR of over 25% from 2023 to 2030. This growth is fueled by increasing industrialization, urbanization, and government initiatives to modernize the energy infrastructure in China, Japan, and India.
The Middle East and Africa region is gradually adopting IoT in energy systems, particularly in the Gulf Cooperation Council (GCC) countries, where smart grid projects and energy efficiency measures are gaining traction. However, the region's overall market share remains modest at approximately 10%.
Latin America, particularly Brazil and Mexico, is also seeing steady growth in the IoT in energy market due to efforts to modernize the grid and enhance energy efficiency. Despite this progress, the region accounts for around 5% of the global market share.
Key Regions and Countries
North America
- The US
- Canada
- Rest of North America
Europe
- Germany
- France
- The UK
- Spain
- Netherlands
- Russia
- Italy
- Rest of Europe
Asia-Pacific
- China
- Japan
- Singapore
- Thailand
- South Korea
- Vietnam
- India
- New Zealand
- Rest of Asia Pacific
Latin America
- Mexico
- Brazil
- Rest of Latin America
Middle East & Africa
- Saudi Arabia
- South Africa
- UAE
- Rest of the Middle East & Africa
Key Players Analysis
The global Internet of Things (IoT) in the energy market is expected to witness significant growth, driven by increasing digitization, the need for efficient energy management, and the adoption of smart grids. Key players such as Cisco Systems and IBM Corporation are well-positioned to capitalize on this trend through their advanced networking solutions and AI-driven analytics platforms. Cisco’s strong market presence in networking hardware, along with its IoT security solutions, will likely be a key growth driver as energy companies seek to secure connected devices and infrastructure.
Siemens AG and Rockwell Automation, with their industrial automation capabilities, are expected to play a crucial role in facilitating the integration of IoT within energy management systems, optimizing production and reducing operational costs. Their comprehensive solutions in process control and industrial IoT align with energy companies' need for real-time monitoring and predictive maintenance.
HCL Technologies and Infosys are anticipated to contribute through their strong capabilities in IoT software development and implementation services. Their experience in digital transformation for energy companies positions them as pivotal partners for end-to-end IoT integration.
Meanwhile, Intel Corporation and Altair Engineering are likely to influence the market through their innovations in IoT hardware and analytics, enabling faster and more efficient data processing. SAP SE and Johnson Controls International PLC will likely leverage their experience in enterprise software and building automation systems, respectively, to facilitate energy optimization across sectors.
These players, equipped with robust technological portfolios, are poised to drive significant advancements in IoT adoption in the energy market.
Market Key Players
- Cisco Systems
- AGT International
- Altair Engineering
- HCL Technologies
- Rockwell Automation
- Infosys
- Davra Networks Limited
- Wind River
- IBM Corporation
- Siemens AG
- GridPoint, Inc.
- Aeris Communications, Inc.
- Johnson Controls International PLC
- Intel Corporation
- SAP SE
Recent Development
- In April 2024, Siemens Energy announced a partnership with Amazon Web Services (AWS) to develop a new IoT-based solution for real-time monitoring and predictive maintenance of energy assets. This initiative focuses on reducing operational costs for power plants by integrating IoT with cloud and machine learning technologies, enabling efficient monitoring of turbines, transformers, and other critical infrastructure. The system leverages AWS IoT Greengrass and AI for advanced diagnostics.
- In February 2024, ABB launched the ABB Ability OPTIMAX energy management platform, which uses IoT for comprehensive energy monitoring, optimization, and sustainability. This system is particularly effective in managing hydrogen production plants, offering real-time visualization and operational insights. It supports carbon emissions tracking and aids in the design and optimization of renewable energy projects.
- In January 2024, Morse Micro partnered with Zetifi to develop advanced IoT connectivity solutions for remote farming applications. The technology enhances coverage in distant areas by using modernized cellular, satellite, and radio networks. This collaboration aims to integrate IoT into agricultural energy systems, providing farmers with better data on energy use for irrigation, machinery, and other equipment.
Report Scope
Report Features Description Market Value (2023) USD 25.5 Billion Forecast Revenue (2033) USD 74.3 Billion CAGR (2024-2032) 11.6% Base Year for Estimation 2023 Historic Period 2016-2023 Forecast Period 2024-2033 Report Coverage Revenue Forecast, Market Dynamics, COVID-19 Impact, Competitive Landscape, Recent Developments Segments Covered By Component (Platform, Solutions, Services), By Network Technology (Cellular Network, Satellite Network, Radio Network, Others), By Application (Oil and Gas, Coal Mining, Smart Grid) Regional Analysis North America - The US, Canada, Rest of North America, Europe - Germany, France, The UK, Spain, Italy, Russia, Netherlands, Rest of Europe, Asia-Pacific - China, Japan, South Korea, India, New Zealand, Singapore, Thailand, Vietnam, Rest of Asia Pacific, Latin America - Brazil, Mexico, Rest of Latin America, Middle East & Africa - South Africa, Saudi Arabia, UAE, Rest of Middle East & Africa Competitive Landscape Cisco Systems, AGT International, Altair Engineering, HCL Technologies, Rockwell Automation, Infosys, Davra Networks Limited, Wind River, IBM Corporation, Siemens AG, GridPoint, Inc., Aeris Communications, Inc., Johnson Controls International PLC, Intel Corporation, SAP SE Customization Scope Customization for segments at the regional/country level will be provided. Moreover, additional customization can be done based on the requirements. Purchase Options We have three licenses to opt for Single User License, Multi-User License (Up to 5 Users), Corporate Use License (Unlimited User and Printable PDF) -
- 1. Executive Summary
- 1.1. Definition
- 1.2. Taxonomy
- 1.3. Research Scope
- 1.4. Key Analysis
- 1.5. Key Findings by Major Segments
- 1.6. Top strategies by Major Players
- 2. Global Internet of Things (IoT) in Energy Market Overview
- 2.1. Internet of Things (IoT) in Energy Market Dynamics
- 2.1.1. Drivers
- 2.1.2. Opportunities
- 2.1.3. Restraints
- 2.1.4. Challenges
- 2.2. Macro-economic Factors
- 2.3. Regulatory Framework
- 2.4. Market Investment Feasibility Index
- 2.5. PEST Analysis
- 2.6. PORTER’S Five Force Analysis
- 2.7. Drivers & Restraints Impact Analysis
- 2.8. Industry Chain Analysis
- 2.9. Cost Structure Analysis
- 2.10. Marketing Strategy
- 2.11. Russia-Ukraine War Impact Analysis
- 2.12. Opportunity Map Analysis
- 2.13. Market Competition Scenario Analysis
- 2.14. Product Life Cycle Analysis
- 2.15. Opportunity Orbits
- 2.16. Manufacturer Intensity Map
- 2.17. Major Companies sales by Value & Volume
- 2.1. Internet of Things (IoT) in Energy Market Dynamics
- 3. Global Internet of Things (IoT) in Energy Market Analysis, Opportunity and Forecast, 2016-2032
- 3.1. Global Internet of Things (IoT) in Energy Market Analysis, 2016-2021
- 3.2. Global Internet of Things (IoT) in Energy Market Opportunity and Forecast, 2023-2032
- 3.3. Global Internet of Things (IoT) in Energy Market Analysis, Opportunity and Forecast, By Component, 2016-2032
- 3.3.1. Global Internet of Things (IoT) in Energy Market Analysis by Component: Introduction
- 3.3.2. Market Size Absolute $ Opportunity Analysis and Forecast, By Component, 2016-2032
- 3.3.3. Platform
- 3.3.4. Solutions
- 3.3.5. Services
- 3.4. Global Internet of Things (IoT) in Energy Market Analysis, Opportunity and Forecast, By Network Technology, 2016-2032
- 3.4.1. Global Internet of Things (IoT) in Energy Market Analysis by Network Technology: Introduction
- 3.4.2. Market Size Absolute $ Opportunity Analysis and Forecast, By Network Technology, 2016-2032
- 3.4.3. Cellular Network
- 3.4.4. Satellite Network
- 3.4.5. Radio Network
- 3.4.6. Others
- 3.5. Global Internet of Things (IoT) in Energy Market Analysis, Opportunity and Forecast, By Application, 2016-2032
- 3.5.1. Global Internet of Things (IoT) in Energy Market Analysis by Application: Introduction
- 3.5.2. Market Size Absolute $ Opportunity Analysis and Forecast, By Application, 2016-2032
- 3.5.3. Oil and Gas
- 3.5.4. Coal Mining
- 3.5.5. Smart Grid
- 4. North America Internet of Things (IoT) in Energy Market Analysis, Opportunity and Forecast, 2016-2032
- 4.1. North America Internet of Things (IoT) in Energy Market Analysis, 2016-2021
- 4.2. North America Internet of Things (IoT) in Energy Market Opportunity and Forecast, 2023-2032
- 4.3. North America Internet of Things (IoT) in Energy Market Analysis, Opportunity and Forecast, By Component, 2016-2032
- 4.3.1. North America Internet of Things (IoT) in Energy Market Analysis by Component: Introduction
- 4.3.2. Market Size Absolute $ Opportunity Analysis and Forecast, By Component, 2016-2032
- 4.3.3. Platform
- 4.3.4. Solutions
- 4.3.5. Services
- 4.4. North America Internet of Things (IoT) in Energy Market Analysis, Opportunity and Forecast, By Network Technology, 2016-2032
- 4.4.1. North America Internet of Things (IoT) in Energy Market Analysis by Network Technology: Introduction
- 4.4.2. Market Size Absolute $ Opportunity Analysis and Forecast, By Network Technology, 2016-2032
- 4.4.3. Cellular Network
- 4.4.4. Satellite Network
- 4.4.5. Radio Network
- 4.4.6. Others
- 4.5. North America Internet of Things (IoT) in Energy Market Analysis, Opportunity and Forecast, By Application, 2016-2032
- 4.5.1. North America Internet of Things (IoT) in Energy Market Analysis by Application: Introduction
- 4.5.2. Market Size Absolute $ Opportunity Analysis and Forecast, By Application, 2016-2032
- 4.5.3. Oil and Gas
- 4.5.4. Coal Mining
- 4.5.5. Smart Grid
- 4.6. North America Internet of Things (IoT) in Energy Market Analysis, Opportunity and Forecast, By Country , 2016-2032
- 4.6.1. North America Internet of Things (IoT) in Energy Market Analysis by Country : Introduction
- 4.6.2. Market Size Absolute $ Opportunity Analysis and Forecast, Country , 2016-2032
- 4.6.2.1. The US
- 4.6.2.2. Canada
- 4.6.2.3. Mexico
- 5. Western Europe Internet of Things (IoT) in Energy Market Analysis, Opportunity and Forecast, 2016-2032
- 5.1. Western Europe Internet of Things (IoT) in Energy Market Analysis, 2016-2021
- 5.2. Western Europe Internet of Things (IoT) in Energy Market Opportunity and Forecast, 2023-2032
- 5.3. Western Europe Internet of Things (IoT) in Energy Market Analysis, Opportunity and Forecast, By Component, 2016-2032
- 5.3.1. Western Europe Internet of Things (IoT) in Energy Market Analysis by Component: Introduction
- 5.3.2. Market Size Absolute $ Opportunity Analysis and Forecast, By Component, 2016-2032
- 5.3.3. Platform
- 5.3.4. Solutions
- 5.3.5. Services
- 5.4. Western Europe Internet of Things (IoT) in Energy Market Analysis, Opportunity and Forecast, By Network Technology, 2016-2032
- 5.4.1. Western Europe Internet of Things (IoT) in Energy Market Analysis by Network Technology: Introduction
- 5.4.2. Market Size Absolute $ Opportunity Analysis and Forecast, By Network Technology, 2016-2032
- 5.4.3. Cellular Network
- 5.4.4. Satellite Network
- 5.4.5. Radio Network
- 5.4.6. Others
- 5.5. Western Europe Internet of Things (IoT) in Energy Market Analysis, Opportunity and Forecast, By Application, 2016-2032
- 5.5.1. Western Europe Internet of Things (IoT) in Energy Market Analysis by Application: Introduction
- 5.5.2. Market Size Absolute $ Opportunity Analysis and Forecast, By Application, 2016-2032
- 5.5.3. Oil and Gas
- 5.5.4. Coal Mining
- 5.5.5. Smart Grid
- 5.6. Western Europe Internet of Things (IoT) in Energy Market Analysis, Opportunity and Forecast, By Country , 2016-2032
- 5.6.1. Western Europe Internet of Things (IoT) in Energy Market Analysis by Country : Introduction
- 5.6.2. Market Size Absolute $ Opportunity Analysis and Forecast, Country , 2016-2032
- 5.6.2.1. Germany
- 5.6.2.2. France
- 5.6.2.3. The UK
- 5.6.2.4. Spain
- 5.6.2.5. Italy
- 5.6.2.6. Portugal
- 5.6.2.7. Ireland
- 5.6.2.8. Austria
- 5.6.2.9. Switzerland
- 5.6.2.10. Benelux
- 5.6.2.11. Nordic
- 5.6.2.12. Rest of Western Europe
- 6. Eastern Europe Internet of Things (IoT) in Energy Market Analysis, Opportunity and Forecast, 2016-2032
- 6.1. Eastern Europe Internet of Things (IoT) in Energy Market Analysis, 2016-2021
- 6.2. Eastern Europe Internet of Things (IoT) in Energy Market Opportunity and Forecast, 2023-2032
- 6.3. Eastern Europe Internet of Things (IoT) in Energy Market Analysis, Opportunity and Forecast, By Component, 2016-2032
- 6.3.1. Eastern Europe Internet of Things (IoT) in Energy Market Analysis by Component: Introduction
- 6.3.2. Market Size Absolute $ Opportunity Analysis and Forecast, By Component, 2016-2032
- 6.3.3. Platform
- 6.3.4. Solutions
- 6.3.5. Services
- 6.4. Eastern Europe Internet of Things (IoT) in Energy Market Analysis, Opportunity and Forecast, By Network Technology, 2016-2032
- 6.4.1. Eastern Europe Internet of Things (IoT) in Energy Market Analysis by Network Technology: Introduction
- 6.4.2. Market Size Absolute $ Opportunity Analysis and Forecast, By Network Technology, 2016-2032
- 6.4.3. Cellular Network
- 6.4.4. Satellite Network
- 6.4.5. Radio Network
- 6.4.6. Others
- 6.5. Eastern Europe Internet of Things (IoT) in Energy Market Analysis, Opportunity and Forecast, By Application, 2016-2032
- 6.5.1. Eastern Europe Internet of Things (IoT) in Energy Market Analysis by Application: Introduction
- 6.5.2. Market Size Absolute $ Opportunity Analysis and Forecast, By Application, 2016-2032
- 6.5.3. Oil and Gas
- 6.5.4. Coal Mining
- 6.5.5. Smart Grid
- 6.6. Eastern Europe Internet of Things (IoT) in Energy Market Analysis, Opportunity and Forecast, By Country , 2016-2032
- 6.6.1. Eastern Europe Internet of Things (IoT) in Energy Market Analysis by Country : Introduction
- 6.6.2. Market Size Absolute $ Opportunity Analysis and Forecast, Country , 2016-2032
- 6.6.2.1. Russia
- 6.6.2.2. Poland
- 6.6.2.3. The Czech Republic
- 6.6.2.4. Greece
- 6.6.2.5. Rest of Eastern Europe
- 7. APAC Internet of Things (IoT) in Energy Market Analysis, Opportunity and Forecast, 2016-2032
- 7.1. APAC Internet of Things (IoT) in Energy Market Analysis, 2016-2021
- 7.2. APAC Internet of Things (IoT) in Energy Market Opportunity and Forecast, 2023-2032
- 7.3. APAC Internet of Things (IoT) in Energy Market Analysis, Opportunity and Forecast, By Component, 2016-2032
- 7.3.1. APAC Internet of Things (IoT) in Energy Market Analysis by Component: Introduction
- 7.3.2. Market Size Absolute $ Opportunity Analysis and Forecast, By Component, 2016-2032
- 7.3.3. Platform
- 7.3.4. Solutions
- 7.3.5. Services
- 7.4. APAC Internet of Things (IoT) in Energy Market Analysis, Opportunity and Forecast, By Network Technology, 2016-2032
- 7.4.1. APAC Internet of Things (IoT) in Energy Market Analysis by Network Technology: Introduction
- 7.4.2. Market Size Absolute $ Opportunity Analysis and Forecast, By Network Technology, 2016-2032
- 7.4.3. Cellular Network
- 7.4.4. Satellite Network
- 7.4.5. Radio Network
- 7.4.6. Others
- 7.5. APAC Internet of Things (IoT) in Energy Market Analysis, Opportunity and Forecast, By Application, 2016-2032
- 7.5.1. APAC Internet of Things (IoT) in Energy Market Analysis by Application: Introduction
- 7.5.2. Market Size Absolute $ Opportunity Analysis and Forecast, By Application, 2016-2032
- 7.5.3. Oil and Gas
- 7.5.4. Coal Mining
- 7.5.5. Smart Grid
- 7.6. APAC Internet of Things (IoT) in Energy Market Analysis, Opportunity and Forecast, By Country , 2016-2032
- 7.6.1. APAC Internet of Things (IoT) in Energy Market Analysis by Country : Introduction
- 7.6.2. Market Size Absolute $ Opportunity Analysis and Forecast, Country , 2016-2032
- 7.6.2.1. China
- 7.6.2.2. Japan
- 7.6.2.3. South Korea
- 7.6.2.4. India
- 7.6.2.5. Australia & New Zeland
- 7.6.2.6. Indonesia
- 7.6.2.7. Malaysia
- 7.6.2.8. Philippines
- 7.6.2.9. Singapore
- 7.6.2.10. Thailand
- 7.6.2.11. Vietnam
- 7.6.2.12. Rest of APAC
- 8. Latin America Internet of Things (IoT) in Energy Market Analysis, Opportunity and Forecast, 2016-2032
- 8.1. Latin America Internet of Things (IoT) in Energy Market Analysis, 2016-2021
- 8.2. Latin America Internet of Things (IoT) in Energy Market Opportunity and Forecast, 2023-2032
- 8.3. Latin America Internet of Things (IoT) in Energy Market Analysis, Opportunity and Forecast, By Component, 2016-2032
- 8.3.1. Latin America Internet of Things (IoT) in Energy Market Analysis by Component: Introduction
- 8.3.2. Market Size Absolute $ Opportunity Analysis and Forecast, By Component, 2016-2032
- 8.3.3. Platform
- 8.3.4. Solutions
- 8.3.5. Services
- 8.4. Latin America Internet of Things (IoT) in Energy Market Analysis, Opportunity and Forecast, By Network Technology, 2016-2032
- 8.4.1. Latin America Internet of Things (IoT) in Energy Market Analysis by Network Technology: Introduction
- 8.4.2. Market Size Absolute $ Opportunity Analysis and Forecast, By Network Technology, 2016-2032
- 8.4.3. Cellular Network
- 8.4.4. Satellite Network
- 8.4.5. Radio Network
- 8.4.6. Others
- 8.5. Latin America Internet of Things (IoT) in Energy Market Analysis, Opportunity and Forecast, By Application, 2016-2032
- 8.5.1. Latin America Internet of Things (IoT) in Energy Market Analysis by Application: Introduction
- 8.5.2. Market Size Absolute $ Opportunity Analysis and Forecast, By Application, 2016-2032
- 8.5.3. Oil and Gas
- 8.5.4. Coal Mining
- 8.5.5. Smart Grid
- 8.6. Latin America Internet of Things (IoT) in Energy Market Analysis, Opportunity and Forecast, By Country , 2016-2032
- 8.6.1. Latin America Internet of Things (IoT) in Energy Market Analysis by Country : Introduction
- 8.6.2. Market Size Absolute $ Opportunity Analysis and Forecast, Country , 2016-2032
- 8.6.2.1. Brazil
- 8.6.2.2. Colombia
- 8.6.2.3. Chile
- 8.6.2.4. Argentina
- 8.6.2.5. Costa Rica
- 8.6.2.6. Rest of Latin America
- 9. Middle East & Africa Internet of Things (IoT) in Energy Market Analysis, Opportunity and Forecast, 2016-2032
- 9.1. Middle East & Africa Internet of Things (IoT) in Energy Market Analysis, 2016-2021
- 9.2. Middle East & Africa Internet of Things (IoT) in Energy Market Opportunity and Forecast, 2023-2032
- 9.3. Middle East & Africa Internet of Things (IoT) in Energy Market Analysis, Opportunity and Forecast, By Component, 2016-2032
- 9.3.1. Middle East & Africa Internet of Things (IoT) in Energy Market Analysis by Component: Introduction
- 9.3.2. Market Size Absolute $ Opportunity Analysis and Forecast, By Component, 2016-2032
- 9.3.3. Platform
- 9.3.4. Solutions
- 9.3.5. Services
- 9.4. Middle East & Africa Internet of Things (IoT) in Energy Market Analysis, Opportunity and Forecast, By Network Technology, 2016-2032
- 9.4.1. Middle East & Africa Internet of Things (IoT) in Energy Market Analysis by Network Technology: Introduction
- 9.4.2. Market Size Absolute $ Opportunity Analysis and Forecast, By Network Technology, 2016-2032
- 9.4.3. Cellular Network
- 9.4.4. Satellite Network
- 9.4.5. Radio Network
- 9.4.6. Others
- 9.5. Middle East & Africa Internet of Things (IoT) in Energy Market Analysis, Opportunity and Forecast, By Application, 2016-2032
- 9.5.1. Middle East & Africa Internet of Things (IoT) in Energy Market Analysis by Application: Introduction
- 9.5.2. Market Size Absolute $ Opportunity Analysis and Forecast, By Application, 2016-2032
- 9.5.3. Oil and Gas
- 9.5.4. Coal Mining
- 9.5.5. Smart Grid
- 9.6. Middle East & Africa Internet of Things (IoT) in Energy Market Analysis, Opportunity and Forecast, By Country , 2016-2032
- 9.6.1. Middle East & Africa Internet of Things (IoT) in Energy Market Analysis by Country : Introduction
- 9.6.2. Market Size Absolute $ Opportunity Analysis and Forecast, Country , 2016-2032
- 9.6.2.1. Algeria
- 9.6.2.2. Egypt
- 9.6.2.3. Israel
- 9.6.2.4. Kuwait
- 9.6.2.5. Nigeria
- 9.6.2.6. Saudi Arabia
- 9.6.2.7. South Africa
- 9.6.2.8. Turkey
- 9.6.2.9. The UAE
- 9.6.2.10. Rest of MEA
- 10. Global Internet of Things (IoT) in Energy Market Analysis, Opportunity and Forecast, By Region , 2016-2032
- 10.1. Global Internet of Things (IoT) in Energy Market Analysis by Region : Introduction
- 10.2. Market Size Absolute $ Opportunity Analysis and Forecast, By Region , 2016-2032
- 10.2.1. North America
- 10.2.2. Western Europe
- 10.2.3. Eastern Europe
- 10.2.4. APAC
- 10.2.5. Latin America
- 10.2.6. Middle East & Africa
- 11. Global Internet of Things (IoT) in Energy Market Competitive Landscape, Market Share Analysis, and Company Profiles
- 11.1. Market Share Analysis
- 11.2. Company Profiles
- 11.3. Cisco Systems
- 11.3.1. Company Overview
- 11.3.2. Financial Highlights
- 11.3.3. Product Portfolio
- 11.3.4. SWOT Analysis
- 11.3.5. Key Strategies and Developments
- 11.4. AGT International
- 11.4.1. Company Overview
- 11.4.2. Financial Highlights
- 11.4.3. Product Portfolio
- 11.4.4. SWOT Analysis
- 11.4.5. Key Strategies and Developments
- 11.5. Altair Engineering
- 11.5.1. Company Overview
- 11.5.2. Financial Highlights
- 11.5.3. Product Portfolio
- 11.5.4. SWOT Analysis
- 11.5.5. Key Strategies and Developments
- 11.6. HCL Technologies
- 11.6.1. Company Overview
- 11.6.2. Financial Highlights
- 11.6.3. Product Portfolio
- 11.6.4. SWOT Analysis
- 11.6.5. Key Strategies and Developments
- 11.7. Rockwell Automation
- 11.7.1. Company Overview
- 11.7.2. Financial Highlights
- 11.7.3. Product Portfolio
- 11.7.4. SWOT Analysis
- 11.7.5. Key Strategies and Developments
- 11.8. Infosys
- 11.8.1. Company Overview
- 11.8.2. Financial Highlights
- 11.8.3. Product Portfolio
- 11.8.4. SWOT Analysis
- 11.8.5. Key Strategies and Developments
- 11.9. Davra Networks Limited
- 11.9.1. Company Overview
- 11.9.2. Financial Highlights
- 11.9.3. Product Portfolio
- 11.9.4. SWOT Analysis
- 11.9.5. Key Strategies and Developments
- 11.10. Wind River
- 11.10.1. Company Overview
- 11.10.2. Financial Highlights
- 11.10.3. Product Portfolio
- 11.10.4. SWOT Analysis
- 11.10.5. Key Strategies and Developments
- 11.11. IBM Corporation
- 11.11.1. Company Overview
- 11.11.2. Financial Highlights
- 11.11.3. Product Portfolio
- 11.11.4. SWOT Analysis
- 11.11.5. Key Strategies and Developments
- 11.12. Siemens AG
- 11.12.1. Company Overview
- 11.12.2. Financial Highlights
- 11.12.3. Product Portfolio
- 11.12.4. SWOT Analysis
- 11.12.5. Key Strategies and Developments
- 11.13.1. Company Overview
- 11.13.2. Financial Highlights
- 11.13.3. Product Portfolio
- 11.13.4. SWOT Analysis
- 11.13.5. Key Strategies and Developments
- 11.14. GridPoint, Inc.
- 11.14.1. Company Overview
- 11.14.2. Financial Highlights
- 11.14.3. Product Portfolio
- 11.14.4. SWOT Analysis
- 11.14.5. Key Strategies and Developments
- 11.15. Johnson Controls International PLC
- 11.15.1. Company Overview
- 11.15.2. Financial Highlights
- 11.15.3. Product Portfolio
- 11.15.4. SWOT Analysis
- 11.15.5. Key Strategies and Developments
- 11.16. Intel Corporation
- 11.16.1. Company Overview
- 11.16.2. Financial Highlights
- 11.16.3. Product Portfolio
- 11.16.4. SWOT Analysis
- 11.16.5. Key Strategies and Developments
- 11.17. SAP SE
- 11.17.1. Company Overview
- 11.17.2. Financial Highlights
- 11.17.3. Product Portfolio
- 11.17.4. SWOT Analysis
- 11.17.5. Key Strategies and Developments
- 12. Assumptions and Acronyms
- 13. Research Methodology
- 14. Contact
"
- List of Figures
- "
- Figure 1: Global Internet of Things (IoT) in Energy Market Revenue (US$ Mn) Market Share by Component in 2022
- Figure 2: Global Internet of Things (IoT) in Energy Market Market Attractiveness Analysis by Component, 2016-2032
- Figure 3: Global Internet of Things (IoT) in Energy Market Revenue (US$ Mn) Market Share by Network Technologyin 2022
- Figure 4: Global Internet of Things (IoT) in Energy Market Market Attractiveness Analysis by Network Technology, 2016-2032
- Figure 5: Global Internet of Things (IoT) in Energy Market Revenue (US$ Mn) Market Share by Applicationin 2022
- Figure 6: Global Internet of Things (IoT) in Energy Market Market Attractiveness Analysis by Application, 2016-2032
- Figure 7: Global Internet of Things (IoT) in Energy Market Revenue (US$ Mn) Market Share by Region in 2022
- Figure 8: Global Internet of Things (IoT) in Energy Market Market Attractiveness Analysis by Region, 2016-2032
- Figure 9: Global Internet of Things (IoT) in Energy Market Market Revenue (US$ Mn) (2016-2032)
- Figure 10: Global Internet of Things (IoT) in Energy Market Market Revenue (US$ Mn) Comparison by Region (2016-2032)
- Figure 11: Global Internet of Things (IoT) in Energy Market Market Revenue (US$ Mn) Comparison by Component (2016-2032)
- Figure 12: Global Internet of Things (IoT) in Energy Market Market Revenue (US$ Mn) Comparison by Network Technology (2016-2032)
- Figure 13: Global Internet of Things (IoT) in Energy Market Market Revenue (US$ Mn) Comparison by Application (2016-2032)
- Figure 14: Global Internet of Things (IoT) in Energy Market Market Y-o-Y Growth Rate Comparison by Region (2016-2032)
- Figure 15: Global Internet of Things (IoT) in Energy Market Market Y-o-Y Growth Rate Comparison by Component (2016-2032)
- Figure 16: Global Internet of Things (IoT) in Energy Market Market Y-o-Y Growth Rate Comparison by Network Technology (2016-2032)
- Figure 17: Global Internet of Things (IoT) in Energy Market Market Y-o-Y Growth Rate Comparison by Application (2016-2032)
- Figure 18: Global Internet of Things (IoT) in Energy Market Market Share Comparison by Region (2016-2032)
- Figure 19: Global Internet of Things (IoT) in Energy Market Market Share Comparison by Component (2016-2032)
- Figure 20: Global Internet of Things (IoT) in Energy Market Market Share Comparison by Network Technology (2016-2032)
- Figure 21: Global Internet of Things (IoT) in Energy Market Market Share Comparison by Application (2016-2032)
- Figure 22: North America Internet of Things (IoT) in Energy Market Revenue (US$ Mn) Market Share by Componentin 2022
- Figure 23: North America Internet of Things (IoT) in Energy Market Market Attractiveness Analysis by Component, 2016-2032
- Figure 24: North America Internet of Things (IoT) in Energy Market Revenue (US$ Mn) Market Share by Network Technologyin 2022
- Figure 25: North America Internet of Things (IoT) in Energy Market Market Attractiveness Analysis by Network Technology, 2016-2032
- Figure 26: North America Internet of Things (IoT) in Energy Market Revenue (US$ Mn) Market Share by Applicationin 2022
- Figure 27: North America Internet of Things (IoT) in Energy Market Market Attractiveness Analysis by Application, 2016-2032
- Figure 28: North America Internet of Things (IoT) in Energy Market Revenue (US$ Mn) Market Share by Country in 2022
- Figure 29: North America Internet of Things (IoT) in Energy Market Market Attractiveness Analysis by Country, 2016-2032
- Figure 30: North America Internet of Things (IoT) in Energy Market Market Revenue (US$ Mn) (2016-2032)
- Figure 31: North America Internet of Things (IoT) in Energy Market Market Revenue (US$ Mn) Comparison by Country (2016-2032)
- Figure 32: North America Internet of Things (IoT) in Energy Market Market Revenue (US$ Mn) Comparison by Component (2016-2032)
- Figure 33: North America Internet of Things (IoT) in Energy Market Market Revenue (US$ Mn) Comparison by Network Technology (2016-2032)
- Figure 34: North America Internet of Things (IoT) in Energy Market Market Revenue (US$ Mn) Comparison by Application (2016-2032)
- Figure 35: North America Internet of Things (IoT) in Energy Market Market Y-o-Y Growth Rate Comparison by Country (2016-2032)
- Figure 36: North America Internet of Things (IoT) in Energy Market Market Y-o-Y Growth Rate Comparison by Component (2016-2032)
- Figure 37: North America Internet of Things (IoT) in Energy Market Market Y-o-Y Growth Rate Comparison by Network Technology (2016-2032)
- Figure 38: North America Internet of Things (IoT) in Energy Market Market Y-o-Y Growth Rate Comparison by Application (2016-2032)
- Figure 39: North America Internet of Things (IoT) in Energy Market Market Share Comparison by Country (2016-2032)
- Figure 40: North America Internet of Things (IoT) in Energy Market Market Share Comparison by Component (2016-2032)
- Figure 41: North America Internet of Things (IoT) in Energy Market Market Share Comparison by Network Technology (2016-2032)
- Figure 42: North America Internet of Things (IoT) in Energy Market Market Share Comparison by Application (2016-2032)
- Figure 43: Western Europe Internet of Things (IoT) in Energy Market Revenue (US$ Mn) Market Share by Componentin 2022
- Figure 44: Western Europe Internet of Things (IoT) in Energy Market Market Attractiveness Analysis by Component, 2016-2032
- Figure 45: Western Europe Internet of Things (IoT) in Energy Market Revenue (US$ Mn) Market Share by Network Technologyin 2022
- Figure 46: Western Europe Internet of Things (IoT) in Energy Market Market Attractiveness Analysis by Network Technology, 2016-2032
- Figure 47: Western Europe Internet of Things (IoT) in Energy Market Revenue (US$ Mn) Market Share by Applicationin 2022
- Figure 48: Western Europe Internet of Things (IoT) in Energy Market Market Attractiveness Analysis by Application, 2016-2032
- Figure 49: Western Europe Internet of Things (IoT) in Energy Market Revenue (US$ Mn) Market Share by Country in 2022
- Figure 50: Western Europe Internet of Things (IoT) in Energy Market Market Attractiveness Analysis by Country, 2016-2032
- Figure 51: Western Europe Internet of Things (IoT) in Energy Market Market Revenue (US$ Mn) (2016-2032)
- Figure 52: Western Europe Internet of Things (IoT) in Energy Market Market Revenue (US$ Mn) Comparison by Country (2016-2032)
- Figure 53: Western Europe Internet of Things (IoT) in Energy Market Market Revenue (US$ Mn) Comparison by Component (2016-2032)
- Figure 54: Western Europe Internet of Things (IoT) in Energy Market Market Revenue (US$ Mn) Comparison by Network Technology (2016-2032)
- Figure 55: Western Europe Internet of Things (IoT) in Energy Market Market Revenue (US$ Mn) Comparison by Application (2016-2032)
- Figure 56: Western Europe Internet of Things (IoT) in Energy Market Market Y-o-Y Growth Rate Comparison by Country (2016-2032)
- Figure 57: Western Europe Internet of Things (IoT) in Energy Market Market Y-o-Y Growth Rate Comparison by Component (2016-2032)
- Figure 58: Western Europe Internet of Things (IoT) in Energy Market Market Y-o-Y Growth Rate Comparison by Network Technology (2016-2032)
- Figure 59: Western Europe Internet of Things (IoT) in Energy Market Market Y-o-Y Growth Rate Comparison by Application (2016-2032)
- Figure 60: Western Europe Internet of Things (IoT) in Energy Market Market Share Comparison by Country (2016-2032)
- Figure 61: Western Europe Internet of Things (IoT) in Energy Market Market Share Comparison by Component (2016-2032)
- Figure 62: Western Europe Internet of Things (IoT) in Energy Market Market Share Comparison by Network Technology (2016-2032)
- Figure 63: Western Europe Internet of Things (IoT) in Energy Market Market Share Comparison by Application (2016-2032)
- Figure 64: Eastern Europe Internet of Things (IoT) in Energy Market Revenue (US$ Mn) Market Share by Componentin 2022
- Figure 65: Eastern Europe Internet of Things (IoT) in Energy Market Market Attractiveness Analysis by Component, 2016-2032
- Figure 66: Eastern Europe Internet of Things (IoT) in Energy Market Revenue (US$ Mn) Market Share by Network Technologyin 2022
- Figure 67: Eastern Europe Internet of Things (IoT) in Energy Market Market Attractiveness Analysis by Network Technology, 2016-2032
- Figure 68: Eastern Europe Internet of Things (IoT) in Energy Market Revenue (US$ Mn) Market Share by Applicationin 2022
- Figure 69: Eastern Europe Internet of Things (IoT) in Energy Market Market Attractiveness Analysis by Application, 2016-2032
- Figure 70: Eastern Europe Internet of Things (IoT) in Energy Market Revenue (US$ Mn) Market Share by Country in 2022
- Figure 71: Eastern Europe Internet of Things (IoT) in Energy Market Market Attractiveness Analysis by Country, 2016-2032
- Figure 72: Eastern Europe Internet of Things (IoT) in Energy Market Market Revenue (US$ Mn) (2016-2032)
- Figure 73: Eastern Europe Internet of Things (IoT) in Energy Market Market Revenue (US$ Mn) Comparison by Country (2016-2032)
- Figure 74: Eastern Europe Internet of Things (IoT) in Energy Market Market Revenue (US$ Mn) Comparison by Component (2016-2032)
- Figure 75: Eastern Europe Internet of Things (IoT) in Energy Market Market Revenue (US$ Mn) Comparison by Network Technology (2016-2032)
- Figure 76: Eastern Europe Internet of Things (IoT) in Energy Market Market Revenue (US$ Mn) Comparison by Application (2016-2032)
- Figure 77: Eastern Europe Internet of Things (IoT) in Energy Market Market Y-o-Y Growth Rate Comparison by Country (2016-2032)
- Figure 78: Eastern Europe Internet of Things (IoT) in Energy Market Market Y-o-Y Growth Rate Comparison by Component (2016-2032)
- Figure 79: Eastern Europe Internet of Things (IoT) in Energy Market Market Y-o-Y Growth Rate Comparison by Network Technology (2016-2032)
- Figure 80: Eastern Europe Internet of Things (IoT) in Energy Market Market Y-o-Y Growth Rate Comparison by Application (2016-2032)
- Figure 81: Eastern Europe Internet of Things (IoT) in Energy Market Market Share Comparison by Country (2016-2032)
- Figure 82: Eastern Europe Internet of Things (IoT) in Energy Market Market Share Comparison by Component (2016-2032)
- Figure 83: Eastern Europe Internet of Things (IoT) in Energy Market Market Share Comparison by Network Technology (2016-2032)
- Figure 84: Eastern Europe Internet of Things (IoT) in Energy Market Market Share Comparison by Application (2016-2032)
- Figure 85: APAC Internet of Things (IoT) in Energy Market Revenue (US$ Mn) Market Share by Componentin 2022
- Figure 86: APAC Internet of Things (IoT) in Energy Market Market Attractiveness Analysis by Component, 2016-2032
- Figure 87: APAC Internet of Things (IoT) in Energy Market Revenue (US$ Mn) Market Share by Network Technologyin 2022
- Figure 88: APAC Internet of Things (IoT) in Energy Market Market Attractiveness Analysis by Network Technology, 2016-2032
- Figure 89: APAC Internet of Things (IoT) in Energy Market Revenue (US$ Mn) Market Share by Applicationin 2022
- Figure 90: APAC Internet of Things (IoT) in Energy Market Market Attractiveness Analysis by Application, 2016-2032
- Figure 91: APAC Internet of Things (IoT) in Energy Market Revenue (US$ Mn) Market Share by Country in 2022
- Figure 92: APAC Internet of Things (IoT) in Energy Market Market Attractiveness Analysis by Country, 2016-2032
- Figure 93: APAC Internet of Things (IoT) in Energy Market Market Revenue (US$ Mn) (2016-2032)
- Figure 94: APAC Internet of Things (IoT) in Energy Market Market Revenue (US$ Mn) Comparison by Country (2016-2032)
- Figure 95: APAC Internet of Things (IoT) in Energy Market Market Revenue (US$ Mn) Comparison by Component (2016-2032)
- Figure 96: APAC Internet of Things (IoT) in Energy Market Market Revenue (US$ Mn) Comparison by Network Technology (2016-2032)
- Figure 97: APAC Internet of Things (IoT) in Energy Market Market Revenue (US$ Mn) Comparison by Application (2016-2032)
- Figure 98: APAC Internet of Things (IoT) in Energy Market Market Y-o-Y Growth Rate Comparison by Country (2016-2032)
- Figure 99: APAC Internet of Things (IoT) in Energy Market Market Y-o-Y Growth Rate Comparison by Component (2016-2032)
- Figure 100: APAC Internet of Things (IoT) in Energy Market Market Y-o-Y Growth Rate Comparison by Network Technology (2016-2032)
- Figure 101: APAC Internet of Things (IoT) in Energy Market Market Y-o-Y Growth Rate Comparison by Application (2016-2032)
- Figure 102: APAC Internet of Things (IoT) in Energy Market Market Share Comparison by Country (2016-2032)
- Figure 103: APAC Internet of Things (IoT) in Energy Market Market Share Comparison by Component (2016-2032)
- Figure 104: APAC Internet of Things (IoT) in Energy Market Market Share Comparison by Network Technology (2016-2032)
- Figure 105: APAC Internet of Things (IoT) in Energy Market Market Share Comparison by Application (2016-2032)
- Figure 106: Latin America Internet of Things (IoT) in Energy Market Revenue (US$ Mn) Market Share by Componentin 2022
- Figure 107: Latin America Internet of Things (IoT) in Energy Market Market Attractiveness Analysis by Component, 2016-2032
- Figure 108: Latin America Internet of Things (IoT) in Energy Market Revenue (US$ Mn) Market Share by Network Technologyin 2022
- Figure 109: Latin America Internet of Things (IoT) in Energy Market Market Attractiveness Analysis by Network Technology, 2016-2032
- Figure 110: Latin America Internet of Things (IoT) in Energy Market Revenue (US$ Mn) Market Share by Applicationin 2022
- Figure 111: Latin America Internet of Things (IoT) in Energy Market Market Attractiveness Analysis by Application, 2016-2032
- Figure 112: Latin America Internet of Things (IoT) in Energy Market Revenue (US$ Mn) Market Share by Country in 2022
- Figure 113: Latin America Internet of Things (IoT) in Energy Market Market Attractiveness Analysis by Country, 2016-2032
- Figure 114: Latin America Internet of Things (IoT) in Energy Market Market Revenue (US$ Mn) (2016-2032)
- Figure 115: Latin America Internet of Things (IoT) in Energy Market Market Revenue (US$ Mn) Comparison by Country (2016-2032)
- Figure 116: Latin America Internet of Things (IoT) in Energy Market Market Revenue (US$ Mn) Comparison by Component (2016-2032)
- Figure 117: Latin America Internet of Things (IoT) in Energy Market Market Revenue (US$ Mn) Comparison by Network Technology (2016-2032)
- Figure 118: Latin America Internet of Things (IoT) in Energy Market Market Revenue (US$ Mn) Comparison by Application (2016-2032)
- Figure 119: Latin America Internet of Things (IoT) in Energy Market Market Y-o-Y Growth Rate Comparison by Country (2016-2032)
- Figure 120: Latin America Internet of Things (IoT) in Energy Market Market Y-o-Y Growth Rate Comparison by Component (2016-2032)
- Figure 121: Latin America Internet of Things (IoT) in Energy Market Market Y-o-Y Growth Rate Comparison by Network Technology (2016-2032)
- Figure 122: Latin America Internet of Things (IoT) in Energy Market Market Y-o-Y Growth Rate Comparison by Application (2016-2032)
- Figure 123: Latin America Internet of Things (IoT) in Energy Market Market Share Comparison by Country (2016-2032)
- Figure 124: Latin America Internet of Things (IoT) in Energy Market Market Share Comparison by Component (2016-2032)
- Figure 125: Latin America Internet of Things (IoT) in Energy Market Market Share Comparison by Network Technology (2016-2032)
- Figure 126: Latin America Internet of Things (IoT) in Energy Market Market Share Comparison by Application (2016-2032)
- Figure 127: Middle East & Africa Internet of Things (IoT) in Energy Market Revenue (US$ Mn) Market Share by Componentin 2022
- Figure 128: Middle East & Africa Internet of Things (IoT) in Energy Market Market Attractiveness Analysis by Component, 2016-2032
- Figure 129: Middle East & Africa Internet of Things (IoT) in Energy Market Revenue (US$ Mn) Market Share by Network Technologyin 2022
- Figure 130: Middle East & Africa Internet of Things (IoT) in Energy Market Market Attractiveness Analysis by Network Technology, 2016-2032
- Figure 131: Middle East & Africa Internet of Things (IoT) in Energy Market Revenue (US$ Mn) Market Share by Applicationin 2022
- Figure 132: Middle East & Africa Internet of Things (IoT) in Energy Market Market Attractiveness Analysis by Application, 2016-2032
- Figure 133: Middle East & Africa Internet of Things (IoT) in Energy Market Revenue (US$ Mn) Market Share by Country in 2022
- Figure 134: Middle East & Africa Internet of Things (IoT) in Energy Market Market Attractiveness Analysis by Country, 2016-2032
- Figure 135: Middle East & Africa Internet of Things (IoT) in Energy Market Market Revenue (US$ Mn) (2016-2032)
- Figure 136: Middle East & Africa Internet of Things (IoT) in Energy Market Market Revenue (US$ Mn) Comparison by Country (2016-2032)
- Figure 137: Middle East & Africa Internet of Things (IoT) in Energy Market Market Revenue (US$ Mn) Comparison by Component (2016-2032)
- Figure 138: Middle East & Africa Internet of Things (IoT) in Energy Market Market Revenue (US$ Mn) Comparison by Network Technology (2016-2032)
- Figure 139: Middle East & Africa Internet of Things (IoT) in Energy Market Market Revenue (US$ Mn) Comparison by Application (2016-2032)
- Figure 140: Middle East & Africa Internet of Things (IoT) in Energy Market Market Y-o-Y Growth Rate Comparison by Country (2016-2032)
- Figure 141: Middle East & Africa Internet of Things (IoT) in Energy Market Market Y-o-Y Growth Rate Comparison by Component (2016-2032)
- Figure 142: Middle East & Africa Internet of Things (IoT) in Energy Market Market Y-o-Y Growth Rate Comparison by Network Technology (2016-2032)
- Figure 143: Middle East & Africa Internet of Things (IoT) in Energy Market Market Y-o-Y Growth Rate Comparison by Application (2016-2032)
- Figure 144: Middle East & Africa Internet of Things (IoT) in Energy Market Market Share Comparison by Country (2016-2032)
- Figure 145: Middle East & Africa Internet of Things (IoT) in Energy Market Market Share Comparison by Component (2016-2032)
- Figure 146: Middle East & Africa Internet of Things (IoT) in Energy Market Market Share Comparison by Network Technology (2016-2032)
- Figure 147: Middle East & Africa Internet of Things (IoT) in Energy Market Market Share Comparison by Application (2016-2032)
"
- List of Tables
- "
- Table 1: Global Internet of Things (IoT) in Energy Market Market Comparison by Component (2016-2032)
- Table 2: Global Internet of Things (IoT) in Energy Market Market Comparison by Network Technology (2016-2032)
- Table 3: Global Internet of Things (IoT) in Energy Market Market Comparison by Application (2016-2032)
- Table 4: Global Internet of Things (IoT) in Energy Market Revenue (US$ Mn) Comparison by Region (2016-2032)
- Table 5: Global Internet of Things (IoT) in Energy Market Market Revenue (US$ Mn) (2016-2032)
- Table 6: Global Internet of Things (IoT) in Energy Market Market Revenue (US$ Mn) Comparison by Region (2016-2032)
- Table 7: Global Internet of Things (IoT) in Energy Market Market Revenue (US$ Mn) Comparison by Component (2016-2032)
- Table 8: Global Internet of Things (IoT) in Energy Market Market Revenue (US$ Mn) Comparison by Network Technology (2016-2032)
- Table 9: Global Internet of Things (IoT) in Energy Market Market Revenue (US$ Mn) Comparison by Application (2016-2032)
- Table 10: Global Internet of Things (IoT) in Energy Market Market Y-o-Y Growth Rate Comparison by Region (2016-2032)
- Table 11: Global Internet of Things (IoT) in Energy Market Market Y-o-Y Growth Rate Comparison by Component (2016-2032)
- Table 12: Global Internet of Things (IoT) in Energy Market Market Y-o-Y Growth Rate Comparison by Network Technology (2016-2032)
- Table 13: Global Internet of Things (IoT) in Energy Market Market Y-o-Y Growth Rate Comparison by Application (2016-2032)
- Table 14: Global Internet of Things (IoT) in Energy Market Market Share Comparison by Region (2016-2032)
- Table 15: Global Internet of Things (IoT) in Energy Market Market Share Comparison by Component (2016-2032)
- Table 16: Global Internet of Things (IoT) in Energy Market Market Share Comparison by Network Technology (2016-2032)
- Table 17: Global Internet of Things (IoT) in Energy Market Market Share Comparison by Application (2016-2032)
- Table 18: North America Internet of Things (IoT) in Energy Market Market Comparison by Network Technology (2016-2032)
- Table 19: North America Internet of Things (IoT) in Energy Market Market Comparison by Application (2016-2032)
- Table 20: North America Internet of Things (IoT) in Energy Market Revenue (US$ Mn) Comparison by Country (2016-2032)
- Table 21: North America Internet of Things (IoT) in Energy Market Market Revenue (US$ Mn) (2016-2032)
- Table 22: North America Internet of Things (IoT) in Energy Market Market Revenue (US$ Mn) Comparison by Country (2016-2032)
- Table 23: North America Internet of Things (IoT) in Energy Market Market Revenue (US$ Mn) Comparison by Component (2016-2032)
- Table 24: North America Internet of Things (IoT) in Energy Market Market Revenue (US$ Mn) Comparison by Network Technology (2016-2032)
- Table 25: North America Internet of Things (IoT) in Energy Market Market Revenue (US$ Mn) Comparison by Application (2016-2032)
- Table 26: North America Internet of Things (IoT) in Energy Market Market Y-o-Y Growth Rate Comparison by Country (2016-2032)
- Table 27: North America Internet of Things (IoT) in Energy Market Market Y-o-Y Growth Rate Comparison by Component (2016-2032)
- Table 28: North America Internet of Things (IoT) in Energy Market Market Y-o-Y Growth Rate Comparison by Network Technology (2016-2032)
- Table 29: North America Internet of Things (IoT) in Energy Market Market Y-o-Y Growth Rate Comparison by Application (2016-2032)
- Table 30: North America Internet of Things (IoT) in Energy Market Market Share Comparison by Country (2016-2032)
- Table 31: North America Internet of Things (IoT) in Energy Market Market Share Comparison by Component (2016-2032)
- Table 32: North America Internet of Things (IoT) in Energy Market Market Share Comparison by Network Technology (2016-2032)
- Table 33: North America Internet of Things (IoT) in Energy Market Market Share Comparison by Application (2016-2032)
- Table 34: Western Europe Internet of Things (IoT) in Energy Market Market Comparison by Component (2016-2032)
- Table 35: Western Europe Internet of Things (IoT) in Energy Market Market Comparison by Network Technology (2016-2032)
- Table 36: Western Europe Internet of Things (IoT) in Energy Market Market Comparison by Application (2016-2032)
- Table 37: Western Europe Internet of Things (IoT) in Energy Market Revenue (US$ Mn) Comparison by Country (2016-2032)
- Table 38: Western Europe Internet of Things (IoT) in Energy Market Market Revenue (US$ Mn) (2016-2032)
- Table 39: Western Europe Internet of Things (IoT) in Energy Market Market Revenue (US$ Mn) Comparison by Country (2016-2032)
- Table 40: Western Europe Internet of Things (IoT) in Energy Market Market Revenue (US$ Mn) Comparison by Component (2016-2032)
- Table 41: Western Europe Internet of Things (IoT) in Energy Market Market Revenue (US$ Mn) Comparison by Network Technology (2016-2032)
- Table 42: Western Europe Internet of Things (IoT) in Energy Market Market Revenue (US$ Mn) Comparison by Application (2016-2032)
- Table 43: Western Europe Internet of Things (IoT) in Energy Market Market Y-o-Y Growth Rate Comparison by Country (2016-2032)
- Table 44: Western Europe Internet of Things (IoT) in Energy Market Market Y-o-Y Growth Rate Comparison by Component (2016-2032)
- Table 45: Western Europe Internet of Things (IoT) in Energy Market Market Y-o-Y Growth Rate Comparison by Network Technology (2016-2032)
- Table 46: Western Europe Internet of Things (IoT) in Energy Market Market Y-o-Y Growth Rate Comparison by Application (2016-2032)
- Table 47: Western Europe Internet of Things (IoT) in Energy Market Market Share Comparison by Country (2016-2032)
- Table 48: Western Europe Internet of Things (IoT) in Energy Market Market Share Comparison by Component (2016-2032)
- Table 49: Western Europe Internet of Things (IoT) in Energy Market Market Share Comparison by Network Technology (2016-2032)
- Table 50: Western Europe Internet of Things (IoT) in Energy Market Market Share Comparison by Application (2016-2032)
- Table 51: Eastern Europe Internet of Things (IoT) in Energy Market Market Comparison by Component (2016-2032)
- Table 52: Eastern Europe Internet of Things (IoT) in Energy Market Market Comparison by Network Technology (2016-2032)
- Table 53: Eastern Europe Internet of Things (IoT) in Energy Market Market Comparison by Application (2016-2032)
- Table 54: Eastern Europe Internet of Things (IoT) in Energy Market Revenue (US$ Mn) Comparison by Country (2016-2032)
- Table 55: Eastern Europe Internet of Things (IoT) in Energy Market Market Revenue (US$ Mn) (2016-2032)
- Table 56: Eastern Europe Internet of Things (IoT) in Energy Market Market Revenue (US$ Mn) Comparison by Country (2016-2032)
- Table 57: Eastern Europe Internet of Things (IoT) in Energy Market Market Revenue (US$ Mn) Comparison by Component (2016-2032)
- Table 58: Eastern Europe Internet of Things (IoT) in Energy Market Market Revenue (US$ Mn) Comparison by Network Technology (2016-2032)
- Table 59: Eastern Europe Internet of Things (IoT) in Energy Market Market Revenue (US$ Mn) Comparison by Application (2016-2032)
- Table 60: Eastern Europe Internet of Things (IoT) in Energy Market Market Y-o-Y Growth Rate Comparison by Country (2016-2032)
- Table 61: Eastern Europe Internet of Things (IoT) in Energy Market Market Y-o-Y Growth Rate Comparison by Component (2016-2032)
- Table 62: Eastern Europe Internet of Things (IoT) in Energy Market Market Y-o-Y Growth Rate Comparison by Network Technology (2016-2032)
- Table 63: Eastern Europe Internet of Things (IoT) in Energy Market Market Y-o-Y Growth Rate Comparison by Application (2016-2032)
- Table 64: Eastern Europe Internet of Things (IoT) in Energy Market Market Share Comparison by Country (2016-2032)
- Table 65: Eastern Europe Internet of Things (IoT) in Energy Market Market Share Comparison by Component (2016-2032)
- Table 66: Eastern Europe Internet of Things (IoT) in Energy Market Market Share Comparison by Network Technology (2016-2032)
- Table 67: Eastern Europe Internet of Things (IoT) in Energy Market Market Share Comparison by Application (2016-2032)
- Table 68: APAC Internet of Things (IoT) in Energy Market Market Comparison by Component (2016-2032)
- Table 69: APAC Internet of Things (IoT) in Energy Market Market Comparison by Network Technology (2016-2032)
- Table 70: APAC Internet of Things (IoT) in Energy Market Market Comparison by Application (2016-2032)
- Table 71: APAC Internet of Things (IoT) in Energy Market Revenue (US$ Mn) Comparison by Country (2016-2032)
- Table 72: APAC Internet of Things (IoT) in Energy Market Market Revenue (US$ Mn) (2016-2032)
- Table 73: APAC Internet of Things (IoT) in Energy Market Market Revenue (US$ Mn) Comparison by Country (2016-2032)
- Table 74: APAC Internet of Things (IoT) in Energy Market Market Revenue (US$ Mn) Comparison by Component (2016-2032)
- Table 75: APAC Internet of Things (IoT) in Energy Market Market Revenue (US$ Mn) Comparison by Network Technology (2016-2032)
- Table 76: APAC Internet of Things (IoT) in Energy Market Market Revenue (US$ Mn) Comparison by Application (2016-2032)
- Table 77: APAC Internet of Things (IoT) in Energy Market Market Y-o-Y Growth Rate Comparison by Country (2016-2032)
- Table 78: APAC Internet of Things (IoT) in Energy Market Market Y-o-Y Growth Rate Comparison by Component (2016-2032)
- Table 79: APAC Internet of Things (IoT) in Energy Market Market Y-o-Y Growth Rate Comparison by Network Technology (2016-2032)
- Table 80: APAC Internet of Things (IoT) in Energy Market Market Y-o-Y Growth Rate Comparison by Application (2016-2032)
- Table 81: APAC Internet of Things (IoT) in Energy Market Market Share Comparison by Country (2016-2032)
- Table 82: APAC Internet of Things (IoT) in Energy Market Market Share Comparison by Component (2016-2032)
- Table 83: APAC Internet of Things (IoT) in Energy Market Market Share Comparison by Network Technology (2016-2032)
- Table 84: APAC Internet of Things (IoT) in Energy Market Market Share Comparison by Application (2016-2032)
- Table 85: Latin America Internet of Things (IoT) in Energy Market Market Comparison by Component (2016-2032)
- Table 86: Latin America Internet of Things (IoT) in Energy Market Market Comparison by Network Technology (2016-2032)
- Table 87: Latin America Internet of Things (IoT) in Energy Market Market Comparison by Application (2016-2032)
- Table 88: Latin America Internet of Things (IoT) in Energy Market Revenue (US$ Mn) Comparison by Country (2016-2032)
- Table 89: Latin America Internet of Things (IoT) in Energy Market Market Revenue (US$ Mn) (2016-2032)
- Table 90: Latin America Internet of Things (IoT) in Energy Market Market Revenue (US$ Mn) Comparison by Country (2016-2032)
- Table 91: Latin America Internet of Things (IoT) in Energy Market Market Revenue (US$ Mn) Comparison by Component (2016-2032)
- Table 92: Latin America Internet of Things (IoT) in Energy Market Market Revenue (US$ Mn) Comparison by Network Technology (2016-2032)
- Table 93: Latin America Internet of Things (IoT) in Energy Market Market Revenue (US$ Mn) Comparison by Application (2016-2032)
- Table 94: Latin America Internet of Things (IoT) in Energy Market Market Y-o-Y Growth Rate Comparison by Country (2016-2032)
- Table 95: Latin America Internet of Things (IoT) in Energy Market Market Y-o-Y Growth Rate Comparison by Component (2016-2032)
- Table 96: Latin America Internet of Things (IoT) in Energy Market Market Y-o-Y Growth Rate Comparison by Network Technology (2016-2032)
- Table 97: Latin America Internet of Things (IoT) in Energy Market Market Y-o-Y Growth Rate Comparison by Application (2016-2032)
- Table 98: Latin America Internet of Things (IoT) in Energy Market Market Share Comparison by Country (2016-2032)
- Table 99: Latin America Internet of Things (IoT) in Energy Market Market Share Comparison by Component (2016-2032)
- Table 100: Latin America Internet of Things (IoT) in Energy Market Market Share Comparison by Network Technology (2016-2032)
- Table 101: Latin America Internet of Things (IoT) in Energy Market Market Share Comparison by Application (2016-2032)
- Table 102: Middle East & Africa Internet of Things (IoT) in Energy Market Market Comparison by Component (2016-2032)
- Table 103: Middle East & Africa Internet of Things (IoT) in Energy Market Market Comparison by Network Technology (2016-2032)
- Table 104: Middle East & Africa Internet of Things (IoT) in Energy Market Market Comparison by Application (2016-2032)
- Table 105: Middle East & Africa Internet of Things (IoT) in Energy Market Revenue (US$ Mn) Comparison by Country (2016-2032)
- Table 106: Middle East & Africa Internet of Things (IoT) in Energy Market Market Revenue (US$ Mn) (2016-2032)
- Table 107: Middle East & Africa Internet of Things (IoT) in Energy Market Market Revenue (US$ Mn) Comparison by Country (2016-2032)
- Table 108: Middle East & Africa Internet of Things (IoT) in Energy Market Market Revenue (US$ Mn) Comparison by Component (2016-2032)
- Table 109: Middle East & Africa Internet of Things (IoT) in Energy Market Market Revenue (US$ Mn) Comparison by Network Technology (2016-2032)
- Table 110: Middle East & Africa Internet of Things (IoT) in Energy Market Market Revenue (US$ Mn) Comparison by Application (2016-2032)
- Table 111: Middle East & Africa Internet of Things (IoT) in Energy Market Market Y-o-Y Growth Rate Comparison by Country (2016-2032)
- Table 112: Middle East & Africa Internet of Things (IoT) in Energy Market Market Y-o-Y Growth Rate Comparison by Component (2016-2032)
- Table 113: Middle East & Africa Internet of Things (IoT) in Energy Market Market Y-o-Y Growth Rate Comparison by Network Technology (2016-2032)
- Table 114: Middle East & Africa Internet of Things (IoT) in Energy Market Market Y-o-Y Growth Rate Comparison by Application (2016-2032)
- Table 115: Middle East & Africa Internet of Things (IoT) in Energy Market Market Share Comparison by Country (2016-2032)
- Table 116: Middle East & Africa Internet of Things (IoT) in Energy Market Market Share Comparison by Component (2016-2032)
- Table 117: Middle East & Africa Internet of Things (IoT) in Energy Market Market Share Comparison by Network Technology (2016-2032)
- Table 118: Middle East & Africa Internet of Things (IoT) in Energy Market Market Share Comparison by Application (2016-2032)
- 1. Executive Summary
-
- Cisco Systems
- AGT International
- Altair Engineering
- HCL Technologies
- Rockwell Automation
- Infosys
- Davra Networks Limited
- Wind River
- IBM Corporation
- Siemens AG
- GridPoint, Inc.
- Aeris Communications, Inc.
- Johnson Controls International PLC
- Intel Corporation
- SAP SE
Our Clients


View Our Licence Options
