
Influenza Vaccine Market By Vaccine Type (Quadrivalent and Trivalent), By Technology (Egg-Based and Cell-Based), By Age Group (Paediatric and Adult), By Route of Administration (Injection and Nasal Spray), and By Region, 2023- 2032
-
41810
-
Feb 2022
-
181
-


-
This report was compiled by Trishita Deb Trishita Deb is an experienced market research and consulting professional with over 7 years of expertise across healthcare, consumer goods, and materials, contributing to over 400 healthcare-related reports. Correspondence Team Lead- Healthcare Linkedin | Detailed Market research Methodology Our methodology involves a mix of primary research, including interviews with leading mental health experts, and secondary research from reputable medical journals and databases. View Detailed Methodology Page
-
Quick Navigation
Report Overview
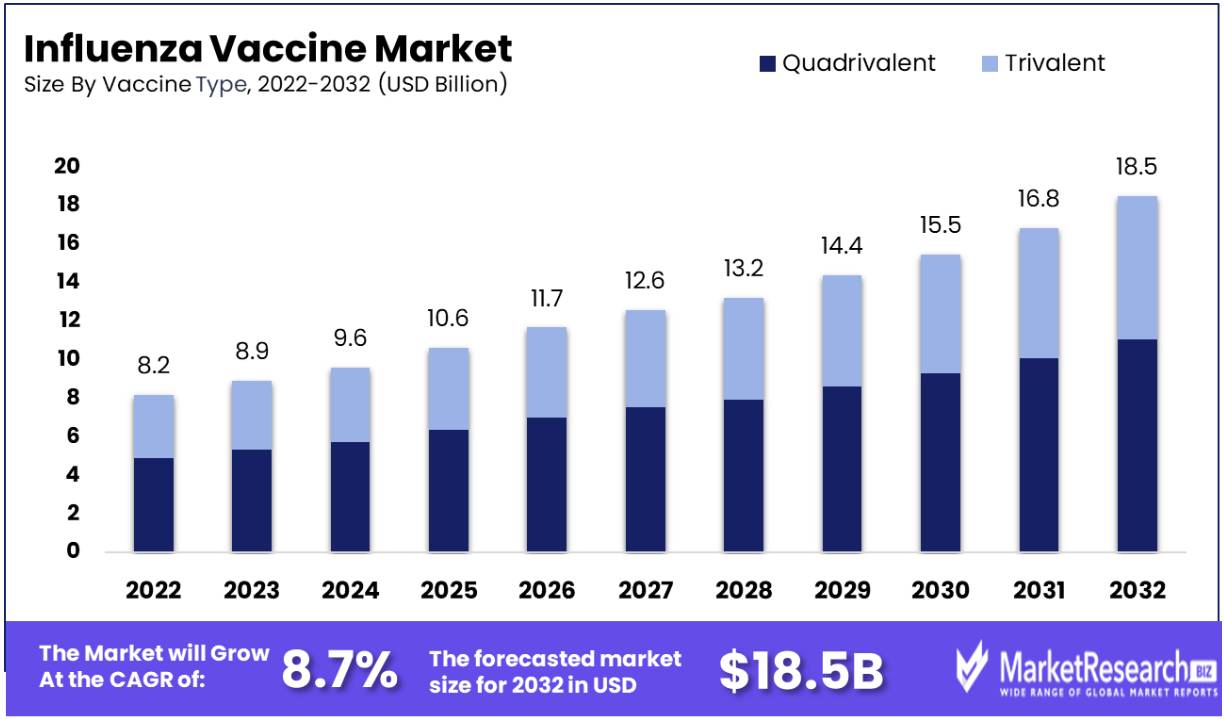
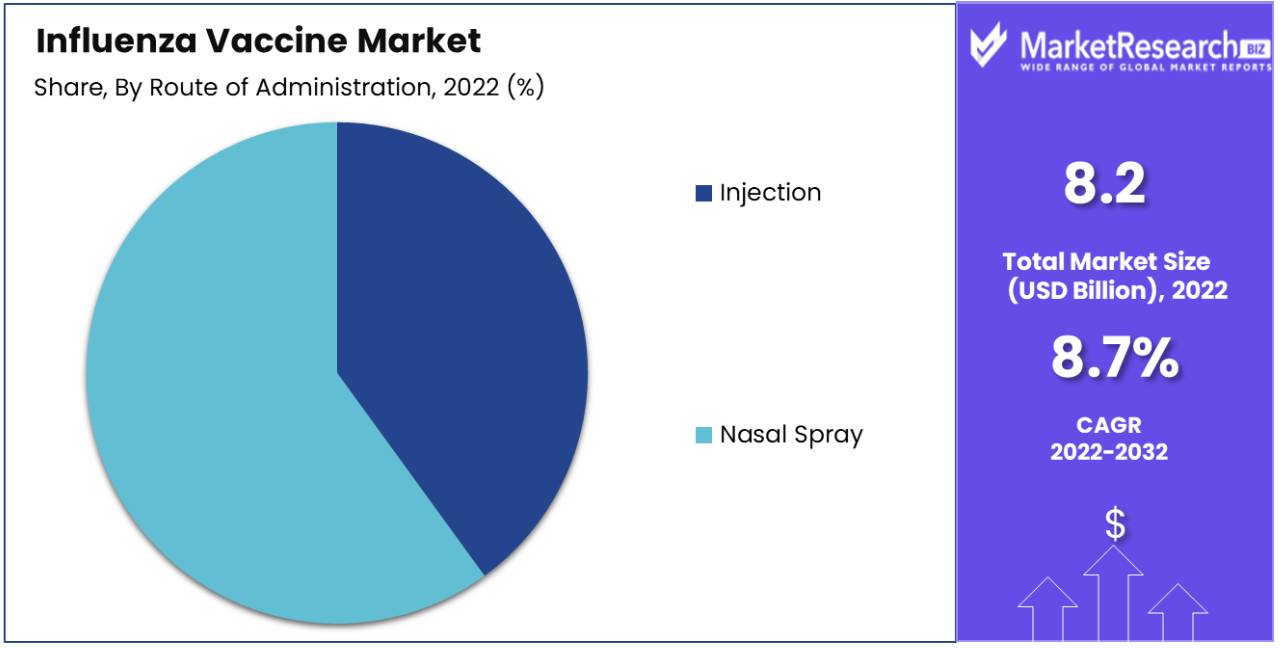
The global influenza vaccine market reached a value of US$ 8.2 Billion in 2022. It expects the market to reach US$ 18.5 Billion by 2032, exhibiting a CAGR of 8.7% during 2023-2032.
Influenza, commonly known as the flu, is a global health concern, with regional outbreaks leading to thousands of deaths annually. To mitigate this risk, influenza vaccines are administered through injection or nasal spray, containing weakened or inactivated virus strains. This prompts the immune system to produce antibodies, reducing infection likelihood and symptom severity.
Major recipients include young children, the elderly, and individuals with primary health conditions. In 2022, the WHO reported 3.0 to 5.0 million severe cases, resulting in 650,000 worldwide deaths. The anticipation of more common outbreaks and epidemics is probable to boost vaccine sales in the years ahead.
The market currently offers several licensed seasonal influenza vaccines, recommended by reputable organizations like the CDC and WHO. Early vaccination is advocated by government agencies to maximize protection during flu season. However, developing vaccines against specific strains remains an ongoing challenge for pharmaceutical companies. The escalating demand for influenza vaccines is projected to drive market growth.
These vaccines typically cover three influenza virus types: A with H3N2, A with H1N1, and B virus strains. The increasing prevalence of influenza epidemics and seasonal outbreaks is projected to bolster product sales in the foreseeable future.
Furthermore, heightened government support and vigilant surveillance at both national and global levels for influenza vaccination programs significantly contribute to market expansion. Substantial investments by leading market players worldwide, coupled with heightened government funding, have facilitated the development and launch of therapeutically effective vaccines, further stimulating growth in the influenza vaccine market.
While the coronavirus pandemic has affected immunization programs, vaccination rates for the flu reached their peak during this period. Various healthcare organizations and governments have actively promoted and provided free flu vaccinations, raising awareness among the population due to concerns about both the flu and COVID-19.
Driving Factors
Increasing Efforts and Support from The Government
Governments worldwide are taking active steps to bolster influenza vaccination efforts by implementing various support measures and initiatives. They are progressively channelling resources into vaccination campaigns to raise awareness about the significance of flu shots and earmarking budgets for the procurement and distribution of vaccines. In many countries, priority groups like children, the elderly, and healthcare professionals have access to subsidized or free vaccination programs, effectively enhancing vaccine availability.
Moreover, government-backed immunization policies enforce mandatory vaccinations in specific settings, such as schools and healthcare facilities, further contributing to the uptake of influenza vaccines. This substantial support from governmental bodies creates an environment conducive to the growth of the influenza vaccine market, ensuring a broader reach across the population. This, in turn, safeguards public health and alleviates the burden of influenza-related illnesses.
Increasing Emphasis On Preventive Healthcare
With a growing awareness of the importance of vaccinations in averting seasonal flu outbreaks, individuals are becoming more proactive in seeking immunization. Additionally, government initiatives and healthcare organizations' concerted efforts in promoting vaccination campaigns have significantly contributed to higher vaccine uptake. Furthermore, advancements in vaccine development technologies have led to the production of more effective and accessible vaccines, bolstering market growth.
Rising Prevalence of Influenza Cases Worldwide
The surge in reported cases, particularly among vulnerable populations such as the elderly and those with chronic illnesses, has prompted an escalated demand for influenza vaccines. Additionally, the threat of potential pandemics and the need for preparedness have heightened the urgency for robust vaccination programs, further propelling market expansion.
Strong Presence of Market Players and Pharmaceutical Companies
They are actively engaged in research and development activities plays a pivotal role in driving the market. Continuous efforts to improve vaccine formulations, enhance efficiency, and expand production capabilities are significant contributors to the growth of the influenza vaccine market.
Restraining Factors
Constant Need for Strain Prediction and Selection
The consistent requirement for strain prediction and selection stands as a critical aspect in the influenza vaccine market. This stems from the nature of the influenza virus, which consistently undergoes mutations. Consequently, there's a need to annually adjust vaccine formulations to effectively combat these evolving strains. However, this process entails a considerable investment of time and resources, presenting a notable challenge and limitation to the market's potential for growth.
Concerns Related to Vaccine Safety and Adverse Effects
The concerns related to vaccine safety and adverse effects may impede uptake rates. Although the benefits of vaccination far outweigh potential risks, public perception and misinformation can lead to vaccine hesitancy, limiting overall market expansion. Addressing these concerns through transparent communication and education is paramount, ensuring that the public is equipped with accurate information regarding the safety and efficacy of influenza vaccines. This concerted effort is instrumental in building trust and fostering confidence in vaccination programs.
Pricing and Accessibility
Despite efforts to increase accessibility, there are regions and demographics where vaccines may not be readily available or affordable. Economic disparities and logistical challenges in distribution can hinder widespread vaccine coverage, particularly in developing countries.
Growth Opportunities
Advancements in Vaccine Formulations and Technologies
One significant growth opportunity in the Influenza Vaccine Market lies in the continual advancements in vaccine formulations and technologies. Research and development efforts aimed at enhancing vaccine effectiveness, safety profiles, and delivery methods can revolutionize influenza prevention. Novel approaches, such as the development of universal vaccines that offer broader protection against multiple strains, hold the potential to significantly impact public health. This opportunity is crucial as it addresses the challenge of strain variability and ensures that vaccines remain effective against evolving influenza viruses.
Expanding Market Reach in Developing Regions
Another vital growth opportunity involves expanding the market's reach in developing regions. There is a substantial untapped potential for influenza vaccination programs in areas where accessibility and awareness are limited. By investing in infrastructure, education, and outreach initiatives, pharmaceutical companies and healthcare organizations can extend the benefits of influenza vaccination to a wider population. This expansion is important as it not only contributes to public health on a global scale but also creates new markets for influenza vaccines, fostering economic growth.
Preparedness for Potential Pandemics
Being prepared for potential pandemics represents a critical growth opportunity in the Influenza Vaccine Market. The COVID-19 pandemic underscored the importance of robust pandemic preparedness plans, which include rapid vaccine development, production, and distribution. Proactive investments in research, manufacturing capacity, and global cooperation can ensure a swift response to emerging influenza threats. This opportunity is of paramount importance as it safeguards public health during unforeseen health crises and underscores the pivotal role of influenza vaccines in global health security.
Latest Trends
Focus on Universal Influenza Vaccines
One prominent trend in the Influenza Vaccine Market is the increasing emphasis on universal influenza vaccines. Unlike traditional vaccines that target specific strains, universal vaccines aim to provide broader protection against a wide range of influenza viruses, including those with the potential for pandemic outbreaks. This trend is significant as it addresses the challenge of strain variability and reduces the need for annual vaccine updates. Universal vaccines have the potential to revolutionize influenza prevention by offering longer-lasting and more comprehensive immunity.
Integration of Adjuvants for Enhanced Effectiveness
Another significant trend involves incorporating adjuvants into influenza vaccine formulations. Adjuvants are compounds added to vaccines to improve the body's immune response. When vaccines contain adjuvants, they can generate a resilient and more enduring immune reaction, mostly in demographics like the elderly, who may display a less vigorous response to standard vaccinations. This trend holds paramount importance as it carries the potential to heighten vaccine effectiveness and bolster protection, particularly among vulnerable population.
Advancements in Vaccine Manufacturing and Production Techniques
A key trend in the Influenza Vaccine Market is the continuous advancement of vaccine manufacturing and production techniques. Innovations such as cell-based and recombinant technologies are becoming more prevalent, offering advantages in scalability, speed, and flexibility in vaccine production. These advancements are essential as they contribute to a more robust and responsive supply chain, enabling a quicker response to outbreaks or emerging strains. Additionally, they enhance the overall efficiency and capacity of vaccine production, ensuring a reliable and timely supply of influenza vaccines.
By Vaccine Type
The quadrivalent vaccines dominates the segment. It offers heightened protection against a wider range of influenza strains. In distinction to traditional trivalent vaccines, which aims three flu strains (two influenzas A strains and one influenza B strain), quadrivalent vaccines includes an additional influenza B strain.
This prolonged coverage holds substantial importance, particularly considering that influenza B viruses often undergo antigenic implication, giving rise to different lineages that may not be adequately covered by trivalent vaccines. By providing an eclectic shield, quadrivalent vaccines prove more effective in thwarting influenza infections and relieving the disease's impact.
Healthcare providers and individuals are displaying a preference for quadrivalent vaccines due to their inclusive coverage, which is driving up demand and consequently, segment growth. The adoption of quadrivalent vaccines has become a custom in various vaccination programs. This outpouring in popularity is prompting manufacturers to devote in their production and distribution, safeguarding they can meet the cumulative global demand for influenza vaccination that is both more effective and encircling.
By Technology Type
Egg-Based Production holds the largest market share. Its approach remains one of the most trusted and frequently employed methods of vaccine production, even amidst a sea of other technological options. It stands as a method where strains of influenza virus are unambiguously refined, separating them from within chicken eggs. This is then followed by a rigorous process of harvesting and further processing to bring about the creation of vaccines.
Despite an assortment of diverse production techniques making strides at this day and age, the egg-based method has continuously proven its worth through times—firmly establishing itself as a safe, scalable, and cost-effective solution to produce vaccines. A considerable segment of major vaccine-producing entities owns comprehensive capacities dedicated to egg-based production. Taking advantage of this infrastructure enables large-scale vaccine creation during times both regular and drastic—like the seasonal flu or unforeseen pandemics.
As demand for innovative and fast-track production of vaccines escalates, there is an increasing tendency to explore newer paradigms of technologies like the cell-based and recombinant modes slightly detached from the conventional. Regardless, the long-established reputation of the egg-based method ensures that it continues to drive segment growth noticeably, especially in demography where it comprises an indispensable production mechanism. Consequently, it also ensures a dependable and consistent worldwide supply of influenza vaccines.
By Age Group Type
Undoubtedly, Paediatric segment rules over the largest market segment. The role of the paediatric sector in driving the influenza vaccine market forward is crucial. Its primary function lies in protecting infants and young children from influenza, which ultimately reduces the virus's spread within communities. The vulnerability of children, especially those under five years old, to severe complications caused by the flu emphasizes the critical importance of vaccination in safeguarding their health and well-being. Paediatric vaccines are specially designed to elicit a strong immune response in young recipients, ensuring robust protection against the disease.
Moreover, vaccinating kids contributes extensively to the status quo of herd immunity, efficaciously curtailing the transmission of the virus to susceptible populations, which include the aged and individuals with compromised immune systems. This underscores the acknowledgment by healthcare carriers, governments, and parents of the pivotal function played through paediatric influenza vaccination.
This heightened recognition translates into an accelerated call for paediatric flu vaccines, therefore driving increase in this phase. Manufacturers are continuously at work, innovating and producing paediatric vaccines that are not most effective safe but also highly effective. This ongoing effort drastically contributes to improved public health results and a discount in the usual burden of influenza.
By Route of Administration
The provision of each injection and nasal spray alternatives plays a pivotal role in accommodating gender preference possibilities and requirements. While the injection remains the commonly applied and favoured method for vaccine delivery, the nasal spray gives a needle-free alternative mainly appealing to kids and people with a worry of needles. This twin approach notably complements typical vaccine reputation and uptake in the end contributing to higher vaccination charges throughout numerous age demographics.
Furthermore, the nasal spray affords a more convenient and green manner of vaccine transport, empowering healthcare vendors to manage vaccines greater expeditiously, mainly in the context of big-scale vaccination campaigns or community-based totally settings. Consequently, the availability of each injection and nasal spray alternatives considerably broadens accessibility and diversifies vaccination alternatives, making sure extra significant coverage for influenza vaccines. Consequently, manufacturers are making huge investments in each transport methods, spotting their critical role in advancing public health and mitigating the effect of influenza.
Key Market Segment
By Vaccine
- Quadrivalent
- Trivalent
By Technology
- Egg-based
- Cell-based
By Age Group
- Paediatric
- Adult
By Route of Administration
- Injection
- Nasal Spray
Regional Analysis
North America has taken the lead in market share, a testament to the region's robust healthcare infrastructure, substantial healthcare expenditure, and advanced research capabilities. These factors collectively create an environment conducive to the development and distribution of vaccines. Furthermore, North America faces a seasonal burden of influenza, compelling healthcare authorities to prioritize vaccination initiatives and campaigns. The proactive approach of the government, including awareness campaigns and subsidized vaccine distribution, significantly contributes to heightened vaccine uptake across the region.
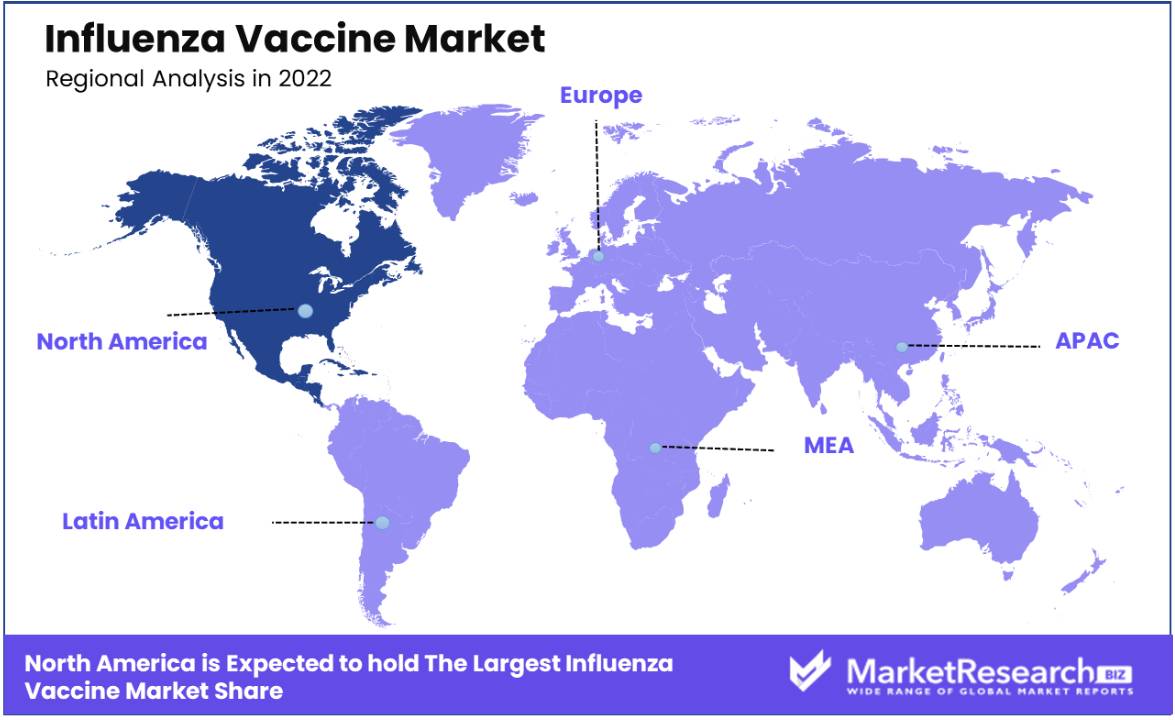
Another pivotal factor is the growing emphasis on preventive healthcare and the heightened awareness among the population regarding the advantages of influenza vaccination. Manufacturers are increasingly recognizing the potential of the North American market and are thus channelling investments into research and production facilities, aligning with the region's specific needs. This strategic approach underscores the commitment to safeguarding public health in North America through effective influenza vaccination initiatives.
Key Regions and Countries
North America
- US
- Canada
Europe
- Germany
- France
- UK
- Spain
- Italy
- Russia
- Netherland
- Rest of Europe
Asia Pacific
- China
- Japan
- South Korea
- India
- New Zealand
- Singapore
- Thailand
- Vietnam
- Rest of APAC
Latin America
- Brazil
- Mexico
- Rest of Latin America
Middle East & Africa
- South Africa
- Saudi Arabia
- UAE
- Rest of MEA
Key Player Analysis
The market is currently experiencing a consistent boom trajectory, driven with the aid of manufacturer’s proactive adoption of innovative strategies geared toward improving vaccine effectiveness, accessibility, and convenience. Notably, the development of superior broadly protective vaccines is a pivotal factor propelling market expansion. Key industry players are intensifying their studies endeavors to create vaccines that provide advanced protection towards more than one influenza lines, thereby reducing the need for common updates and improving common efficacy.
Furthermore, extremely good progress in vaccine production techniques, inclusive of cell-based totally and recombinant technology has facilitated quicker and greater scalable production. This ensures a reliable deliver at some point of seasonal spikes in demand and capacity pandemics. Additionally, concerted efforts are being made to refine vaccine shipping strategies with the introduction of needle-loose options like intradermal or nasal spray vaccines. These innovations play a sizable role in addressing vaccine hesitancy and broadening vaccination insurance ultimately fortifying the worldwide conflict towards influenza and its effect on public fitness.
Anticipated traits in the market encompass the access of latest industry players, heightened collaborations amongst key stakeholders and ongoing product innovations together fostering a weather of healthful competition inside the influenza vaccine enterprise. This dynamic landscape is predicted to similarly increase the sphere and cause stronger answers for influenza prevention.
Key Players in Influenza Vaccine Market
- Abbott Laboratories
- AstraZeneca plc
- CSL Limited
- Daiichi Sankyo Company Limited
- Emergent BioSolutions Inc.
- Hoffmann-La Roche AG
- Gamma Vaccines Pty Ltd
- GlaxoSmithKline plc
- Merck & Co. Inc.
- Novartis AG
- Pfizer Inc.
- Sanofi
- SINOVAC
Recent Developments
- In October 2023, AstraZeneca's Supplemental Biologics License Application (sBLA) for the approval of a self- or caregiver-administered option for FluMist Quadrivalent became granted attractiveness. FluMist, a needle-loose nasal spray, is especially formulated to provide safety against influenza.
- In October 2023, Mylab and Serum Institute of India introduced Nasovac S4, heralding India's inaugural needle-free nasal influenza vaccine. This innovative vaccine incorporates four distinct influenza virus strains and is tailored for individuals aged 2 and above. It endeavors to deliver heightened defense against influenza while augmenting vaccination rates through a more convenient and easily accessible alternative. Currently, the vaccine is available in the private markets of India.
- The Influenza [strain A/H2N3] vaccine, developed by Seqirus, a subsidiary of CSL Ltd, a pharmaceutical company renowned for its expertise in manufacturing and marketing influenza vaccines, antivenoms, and a range of other pharmaceutical products, is currently undergoing Phase I of clinical development. This initial stage is focused on evaluating the vaccine's safety and establishing appropriate dosage levels. The likelihood of approval for this vaccine is anticipated in October 2023.
- On March 2023, the FDA's Vaccines and Related Biological Products Advisory Committee (VRBPAC) made the vital selection concerning the choice of particular influenza virus strains for the vaccine formulation.
Report Scope
Report Features Description Market Value (2022) US$ 8.2 Bn Forecast Revenue (2032) US$ 18.5 Bn CAGR (2023-2032) 8.7% Base Year for Estimation 2022 Historic Period 2016-2022 Forecast Period 2023-2032 Report Coverage Revenue Forecast, Market Dynamics, COVID-19 Impact, Competitive Landscape, Recent Developments Segments Covered By Vaccine Type (Quadrivalent and Trivalent), By Technology (Egg-Based and Cell-Based), By Age Group (Paediatric and Adult), By Route of Administration (Injection and Nasal Spray), Regional Analysis North America – The US, Canada, Mexico, Latin America – Brazil, Colombia, Chile, Argentina, Costa Rica, & Rest of Latin America, Eastern Europe – Russia, Poland, The Czech Republic, Greece, Rest of Eastern Europe, Western Europe – Germany, France, The UK, Spain, Italy, Portugal, Ireland, Austria, Switzerland, Benelux, Nordic, Rest of Western Europe, APAC – China, Japan, South Korea, India, Australia & New Zealand, Indonesia, Malaysia, Philippines, Singapore, Thailand, Vietnam, Rest of APAC, Middle East & Africa – Algeria, Egypt, Israel, Kuwait, Nigeria, Saudi Arabia, South Africa, Turkey, United Arab Emirates, Rest of MEA Competitive Landscape Abbott Laboratories, AstraZeneca plc, CSL Limited, Daiichi Sankyo Company Limited, Emergent BioSolutions Inc., F. Hoffmann-La Roche AG, Gamma Vaccines Pty Ltd, GlaxoSmithKline plc, Merck & Co. Inc., Novartis AG, Pfizer Inc., Sanofi, SINOVAC, Customization Scope Customization for segments, region/country-level will be provided. Moreover, additional customization can be done based on the requirements. Purchase Options We have three licenses to opt for: Single User License, Multi-User License (Up to 5 Users), Corporate Use License (Unlimited User and Printable PDF) -
- 1. Executive Summary
- 1.1. Definition
- 1.2. Taxonomy
- 1.3. Research Scope
- 1.4. Key Analysis
- 1.5. Key Findings by Major Segments
- 1.6. Top strategies by Major Players
- 2. Global Influenza Vaccine Market Overview
- 2.1. Influenza Vaccine Market Dynamics
- 2.1.1. Drivers
- 2.1.2. Opportunities
- 2.1.3. Restraints
- 2.1.4. Challenges
- 2.2. Macro-economic Factors
- 2.3. Regulatory Framework
- 2.4. Market Investment Feasibility Index
- 2.5. PEST Analysis
- 2.6. PORTER’S Five Force Analysis
- 2.7. Drivers & Restraints Impact Analysis
- 2.8. Industry Chain Analysis
- 2.9. Cost Structure Analysis
- 2.10. Marketing Strategy
- 2.11. Russia-Ukraine War Impact Analysis
- 2.12. Opportunity Map Analysis
- 2.13. Market Competition Scenario Analysis
- 2.14. Product Life Cycle Analysis
- 2.15. Opportunity Orbits
- 2.16. Manufacturer Intensity Map
- 2.17. Major Companies sales by Value & Volume
- 2.1. Influenza Vaccine Market Dynamics
- 3. Global Influenza Vaccine Market Analysis, Opportunity and Forecast, 2016-2032
- 3.1. Global Influenza Vaccine Market Analysis, 2016-2021
- 3.2. Global Influenza Vaccine Market Opportunity and Forecast, 2023-2032
- 3.3. Global Influenza Vaccine Market Analysis, Opportunity and Forecast, By Vaccine, 2016-2032
- 3.3.1. Global Influenza Vaccine Market Analysis by Vaccine: Introduction
- 3.3.2. Market Size Absolute $ Opportunity Analysis and Forecast, By Vaccine, 2016-2032
- 3.3.3. Quadrivalent
- 3.3.4. Trivalent
- 3.4. Global Influenza Vaccine Market Analysis, Opportunity and Forecast, By Technology, 2016-2032
- 3.4.1. Global Influenza Vaccine Market Analysis by Technology: Introduction
- 3.4.2. Market Size Absolute $ Opportunity Analysis and Forecast, By Technology, 2016-2032
- 3.4.3. Egg-based
- 3.4.4. Cell-based
- 3.5. Global Influenza Vaccine Market Analysis, Opportunity and Forecast, By Age Group, 2016-2032
- 3.5.1. Global Influenza Vaccine Market Analysis by Age Group: Introduction
- 3.5.2. Market Size Absolute $ Opportunity Analysis and Forecast, By Age Group, 2016-2032
- 3.5.3. Paediatric
- 3.5.4. Adult
- 3.6. Global Influenza Vaccine Market Analysis, Opportunity and Forecast, By Route of Administration, 2016-2032
- 3.6.1. Global Influenza Vaccine Market Analysis by Route of Administration: Introduction
- 3.6.2. Market Size Absolute $ Opportunity Analysis and Forecast, By Route of Administration, 2016-2032
- 3.6.3. Injection
- 3.6.4. Nasal Spray
- 4. North America Influenza Vaccine Market Analysis, Opportunity and Forecast, 2016-2032
- 4.1. North America Influenza Vaccine Market Analysis, 2016-2021
- 4.2. North America Influenza Vaccine Market Opportunity and Forecast, 2023-2032
- 4.3. North America Influenza Vaccine Market Analysis, Opportunity and Forecast, By Vaccine, 2016-2032
- 4.3.1. North America Influenza Vaccine Market Analysis by Vaccine: Introduction
- 4.3.2. Market Size Absolute $ Opportunity Analysis and Forecast, By Vaccine, 2016-2032
- 4.3.3. Quadrivalent
- 4.3.4. Trivalent
- 4.4. North America Influenza Vaccine Market Analysis, Opportunity and Forecast, By Technology, 2016-2032
- 4.4.1. North America Influenza Vaccine Market Analysis by Technology: Introduction
- 4.4.2. Market Size Absolute $ Opportunity Analysis and Forecast, By Technology, 2016-2032
- 4.4.3. Egg-based
- 4.4.4. Cell-based
- 4.5. North America Influenza Vaccine Market Analysis, Opportunity and Forecast, By Age Group, 2016-2032
- 4.5.1. North America Influenza Vaccine Market Analysis by Age Group: Introduction
- 4.5.2. Market Size Absolute $ Opportunity Analysis and Forecast, By Age Group, 2016-2032
- 4.5.3. Paediatric
- 4.5.4. Adult
- 4.6. North America Influenza Vaccine Market Analysis, Opportunity and Forecast, By Route of Administration, 2016-2032
- 4.6.1. North America Influenza Vaccine Market Analysis by Route of Administration: Introduction
- 4.6.2. Market Size Absolute $ Opportunity Analysis and Forecast, By Route of Administration, 2016-2032
- 4.6.3. Injection
- 4.6.4. Nasal Spray
- 4.7. North America Influenza Vaccine Market Analysis, Opportunity and Forecast, By Country , 2016-2032
- 4.7.1. North America Influenza Vaccine Market Analysis by Country : Introduction
- 4.7.2. Market Size Absolute $ Opportunity Analysis and Forecast, Country , 2016-2032
- 4.7.2.1. The US
- 4.7.2.2. Canada
- 4.7.2.3. Mexico
- 5. Western Europe Influenza Vaccine Market Analysis, Opportunity and Forecast, 2016-2032
- 5.1. Western Europe Influenza Vaccine Market Analysis, 2016-2021
- 5.2. Western Europe Influenza Vaccine Market Opportunity and Forecast, 2023-2032
- 5.3. Western Europe Influenza Vaccine Market Analysis, Opportunity and Forecast, By Vaccine, 2016-2032
- 5.3.1. Western Europe Influenza Vaccine Market Analysis by Vaccine: Introduction
- 5.3.2. Market Size Absolute $ Opportunity Analysis and Forecast, By Vaccine, 2016-2032
- 5.3.3. Quadrivalent
- 5.3.4. Trivalent
- 5.4. Western Europe Influenza Vaccine Market Analysis, Opportunity and Forecast, By Technology, 2016-2032
- 5.4.1. Western Europe Influenza Vaccine Market Analysis by Technology: Introduction
- 5.4.2. Market Size Absolute $ Opportunity Analysis and Forecast, By Technology, 2016-2032
- 5.4.3. Egg-based
- 5.4.4. Cell-based
- 5.5. Western Europe Influenza Vaccine Market Analysis, Opportunity and Forecast, By Age Group, 2016-2032
- 5.5.1. Western Europe Influenza Vaccine Market Analysis by Age Group: Introduction
- 5.5.2. Market Size Absolute $ Opportunity Analysis and Forecast, By Age Group, 2016-2032
- 5.5.3. Paediatric
- 5.5.4. Adult
- 5.6. Western Europe Influenza Vaccine Market Analysis, Opportunity and Forecast, By Route of Administration, 2016-2032
- 5.6.1. Western Europe Influenza Vaccine Market Analysis by Route of Administration: Introduction
- 5.6.2. Market Size Absolute $ Opportunity Analysis and Forecast, By Route of Administration, 2016-2032
- 5.6.3. Injection
- 5.6.4. Nasal Spray
- 5.7. Western Europe Influenza Vaccine Market Analysis, Opportunity and Forecast, By Country , 2016-2032
- 5.7.1. Western Europe Influenza Vaccine Market Analysis by Country : Introduction
- 5.7.2. Market Size Absolute $ Opportunity Analysis and Forecast, Country , 2016-2032
- 5.7.2.1. Germany
- 5.7.2.2. France
- 5.7.2.3. The UK
- 5.7.2.4. Spain
- 5.7.2.5. Italy
- 5.7.2.6. Portugal
- 5.7.2.7. Ireland
- 5.7.2.8. Austria
- 5.7.2.9. Switzerland
- 5.7.2.10. Benelux
- 5.7.2.11. Nordic
- 5.7.2.12. Rest of Western Europe
- 6. Eastern Europe Influenza Vaccine Market Analysis, Opportunity and Forecast, 2016-2032
- 6.1. Eastern Europe Influenza Vaccine Market Analysis, 2016-2021
- 6.2. Eastern Europe Influenza Vaccine Market Opportunity and Forecast, 2023-2032
- 6.3. Eastern Europe Influenza Vaccine Market Analysis, Opportunity and Forecast, By Vaccine, 2016-2032
- 6.3.1. Eastern Europe Influenza Vaccine Market Analysis by Vaccine: Introduction
- 6.3.2. Market Size Absolute $ Opportunity Analysis and Forecast, By Vaccine, 2016-2032
- 6.3.3. Quadrivalent
- 6.3.4. Trivalent
- 6.4. Eastern Europe Influenza Vaccine Market Analysis, Opportunity and Forecast, By Technology, 2016-2032
- 6.4.1. Eastern Europe Influenza Vaccine Market Analysis by Technology: Introduction
- 6.4.2. Market Size Absolute $ Opportunity Analysis and Forecast, By Technology, 2016-2032
- 6.4.3. Egg-based
- 6.4.4. Cell-based
- 6.5. Eastern Europe Influenza Vaccine Market Analysis, Opportunity and Forecast, By Age Group, 2016-2032
- 6.5.1. Eastern Europe Influenza Vaccine Market Analysis by Age Group: Introduction
- 6.5.2. Market Size Absolute $ Opportunity Analysis and Forecast, By Age Group, 2016-2032
- 6.5.3. Paediatric
- 6.5.4. Adult
- 6.6. Eastern Europe Influenza Vaccine Market Analysis, Opportunity and Forecast, By Route of Administration, 2016-2032
- 6.6.1. Eastern Europe Influenza Vaccine Market Analysis by Route of Administration: Introduction
- 6.6.2. Market Size Absolute $ Opportunity Analysis and Forecast, By Route of Administration, 2016-2032
- 6.6.3. Injection
- 6.6.4. Nasal Spray
- 6.7. Eastern Europe Influenza Vaccine Market Analysis, Opportunity and Forecast, By Country , 2016-2032
- 6.7.1. Eastern Europe Influenza Vaccine Market Analysis by Country : Introduction
- 6.7.2. Market Size Absolute $ Opportunity Analysis and Forecast, Country , 2016-2032
- 6.7.2.1. Russia
- 6.7.2.2. Poland
- 6.7.2.3. The Czech Republic
- 6.7.2.4. Greece
- 6.7.2.5. Rest of Eastern Europe
- 7. APAC Influenza Vaccine Market Analysis, Opportunity and Forecast, 2016-2032
- 7.1. APAC Influenza Vaccine Market Analysis, 2016-2021
- 7.2. APAC Influenza Vaccine Market Opportunity and Forecast, 2023-2032
- 7.3. APAC Influenza Vaccine Market Analysis, Opportunity and Forecast, By Vaccine, 2016-2032
- 7.3.1. APAC Influenza Vaccine Market Analysis by Vaccine: Introduction
- 7.3.2. Market Size Absolute $ Opportunity Analysis and Forecast, By Vaccine, 2016-2032
- 7.3.3. Quadrivalent
- 7.3.4. Trivalent
- 7.4. APAC Influenza Vaccine Market Analysis, Opportunity and Forecast, By Technology, 2016-2032
- 7.4.1. APAC Influenza Vaccine Market Analysis by Technology: Introduction
- 7.4.2. Market Size Absolute $ Opportunity Analysis and Forecast, By Technology, 2016-2032
- 7.4.3. Egg-based
- 7.4.4. Cell-based
- 7.5. APAC Influenza Vaccine Market Analysis, Opportunity and Forecast, By Age Group, 2016-2032
- 7.5.1. APAC Influenza Vaccine Market Analysis by Age Group: Introduction
- 7.5.2. Market Size Absolute $ Opportunity Analysis and Forecast, By Age Group, 2016-2032
- 7.5.3. Paediatric
- 7.5.4. Adult
- 7.6. APAC Influenza Vaccine Market Analysis, Opportunity and Forecast, By Route of Administration, 2016-2032
- 7.6.1. APAC Influenza Vaccine Market Analysis by Route of Administration: Introduction
- 7.6.2. Market Size Absolute $ Opportunity Analysis and Forecast, By Route of Administration, 2016-2032
- 7.6.3. Injection
- 7.6.4. Nasal Spray
- 7.7. APAC Influenza Vaccine Market Analysis, Opportunity and Forecast, By Country , 2016-2032
- 7.7.1. APAC Influenza Vaccine Market Analysis by Country : Introduction
- 7.7.2. Market Size Absolute $ Opportunity Analysis and Forecast, Country , 2016-2032
- 7.7.2.1. China
- 7.7.2.2. Japan
- 7.7.2.3. South Korea
- 7.7.2.4. India
- 7.7.2.5. Australia & New Zeland
- 7.7.2.6. Indonesia
- 7.7.2.7. Malaysia
- 7.7.2.8. Philippines
- 7.7.2.9. Singapore
- 7.7.2.10. Thailand
- 7.7.2.11. Vietnam
- 7.7.2.12. Rest of APAC
- 8. Latin America Influenza Vaccine Market Analysis, Opportunity and Forecast, 2016-2032
- 8.1. Latin America Influenza Vaccine Market Analysis, 2016-2021
- 8.2. Latin America Influenza Vaccine Market Opportunity and Forecast, 2023-2032
- 8.3. Latin America Influenza Vaccine Market Analysis, Opportunity and Forecast, By Vaccine, 2016-2032
- 8.3.1. Latin America Influenza Vaccine Market Analysis by Vaccine: Introduction
- 8.3.2. Market Size Absolute $ Opportunity Analysis and Forecast, By Vaccine, 2016-2032
- 8.3.3. Quadrivalent
- 8.3.4. Trivalent
- 8.4. Latin America Influenza Vaccine Market Analysis, Opportunity and Forecast, By Technology, 2016-2032
- 8.4.1. Latin America Influenza Vaccine Market Analysis by Technology: Introduction
- 8.4.2. Market Size Absolute $ Opportunity Analysis and Forecast, By Technology, 2016-2032
- 8.4.3. Egg-based
- 8.4.4. Cell-based
- 8.5. Latin America Influenza Vaccine Market Analysis, Opportunity and Forecast, By Age Group, 2016-2032
- 8.5.1. Latin America Influenza Vaccine Market Analysis by Age Group: Introduction
- 8.5.2. Market Size Absolute $ Opportunity Analysis and Forecast, By Age Group, 2016-2032
- 8.5.3. Paediatric
- 8.5.4. Adult
- 8.6. Latin America Influenza Vaccine Market Analysis, Opportunity and Forecast, By Route of Administration, 2016-2032
- 8.6.1. Latin America Influenza Vaccine Market Analysis by Route of Administration: Introduction
- 8.6.2. Market Size Absolute $ Opportunity Analysis and Forecast, By Route of Administration, 2016-2032
- 8.6.3. Injection
- 8.6.4. Nasal Spray
- 8.7. Latin America Influenza Vaccine Market Analysis, Opportunity and Forecast, By Country , 2016-2032
- 8.7.1. Latin America Influenza Vaccine Market Analysis by Country : Introduction
- 8.7.2. Market Size Absolute $ Opportunity Analysis and Forecast, Country , 2016-2032
- 8.7.2.1. Brazil
- 8.7.2.2. Colombia
- 8.7.2.3. Chile
- 8.7.2.4. Argentina
- 8.7.2.5. Costa Rica
- 8.7.2.6. Rest of Latin America
- 9. Middle East & Africa Influenza Vaccine Market Analysis, Opportunity and Forecast, 2016-2032
- 9.1. Middle East & Africa Influenza Vaccine Market Analysis, 2016-2021
- 9.2. Middle East & Africa Influenza Vaccine Market Opportunity and Forecast, 2023-2032
- 9.3. Middle East & Africa Influenza Vaccine Market Analysis, Opportunity and Forecast, By Vaccine, 2016-2032
- 9.3.1. Middle East & Africa Influenza Vaccine Market Analysis by Vaccine: Introduction
- 9.3.2. Market Size Absolute $ Opportunity Analysis and Forecast, By Vaccine, 2016-2032
- 9.3.3. Quadrivalent
- 9.3.4. Trivalent
- 9.4. Middle East & Africa Influenza Vaccine Market Analysis, Opportunity and Forecast, By Technology, 2016-2032
- 9.4.1. Middle East & Africa Influenza Vaccine Market Analysis by Technology: Introduction
- 9.4.2. Market Size Absolute $ Opportunity Analysis and Forecast, By Technology, 2016-2032
- 9.4.3. Egg-based
- 9.4.4. Cell-based
- 9.5. Middle East & Africa Influenza Vaccine Market Analysis, Opportunity and Forecast, By Age Group, 2016-2032
- 9.5.1. Middle East & Africa Influenza Vaccine Market Analysis by Age Group: Introduction
- 9.5.2. Market Size Absolute $ Opportunity Analysis and Forecast, By Age Group, 2016-2032
- 9.5.3. Paediatric
- 9.5.4. Adult
- 9.6. Middle East & Africa Influenza Vaccine Market Analysis, Opportunity and Forecast, By Route of Administration, 2016-2032
- 9.6.1. Middle East & Africa Influenza Vaccine Market Analysis by Route of Administration: Introduction
- 9.6.2. Market Size Absolute $ Opportunity Analysis and Forecast, By Route of Administration, 2016-2032
- 9.6.3. Injection
- 9.6.4. Nasal Spray
- 9.7. Middle East & Africa Influenza Vaccine Market Analysis, Opportunity and Forecast, By Country , 2016-2032
- 9.7.1. Middle East & Africa Influenza Vaccine Market Analysis by Country : Introduction
- 9.7.2. Market Size Absolute $ Opportunity Analysis and Forecast, Country , 2016-2032
- 9.7.2.1. Algeria
- 9.7.2.2. Egypt
- 9.7.2.3. Israel
- 9.7.2.4. Kuwait
- 9.7.2.5. Nigeria
- 9.7.2.6. Saudi Arabia
- 9.7.2.7. South Africa
- 9.7.2.8. Turkey
- 9.7.2.9. The UAE
- 9.7.2.10. Rest of MEA
- 10. Global Influenza Vaccine Market Analysis, Opportunity and Forecast, By Region , 2016-2032
- 10.1. Global Influenza Vaccine Market Analysis by Region : Introduction
- 10.2. Market Size Absolute $ Opportunity Analysis and Forecast, By Region , 2016-2032
- 10.2.1. North America
- 10.2.2. Western Europe
- 10.2.3. Eastern Europe
- 10.2.4. APAC
- 10.2.5. Latin America
- 10.2.6. Middle East & Africa
- 11. Global Influenza Vaccine Market Competitive Landscape, Market Share Analysis, and Company Profiles
- 11.1. Market Share Analysis
- 11.2. Company Profiles
- 11.3. Abbott Laboratories
- 11.3.1. Company Overview
- 11.3.2. Financial Highlights
- 11.3.3. Product Portfolio
- 11.3.4. SWOT Analysis
- 11.3.5. Key Strategies and Developments
- 11.4. AstraZeneca plc
- 11.4.1. Company Overview
- 11.4.2. Financial Highlights
- 11.4.3. Product Portfolio
- 11.4.4. SWOT Analysis
- 11.4.5. Key Strategies and Developments
- 11.5. CSL Limited
- 11.5.1. Company Overview
- 11.5.2. Financial Highlights
- 11.5.3. Product Portfolio
- 11.5.4. SWOT Analysis
- 11.5.5. Key Strategies and Developments
- 11.6. Daiichi Sankyo Company Limited
- 11.6.1. Company Overview
- 11.6.2. Financial Highlights
- 11.6.3. Product Portfolio
- 11.6.4. SWOT Analysis
- 11.6.5. Key Strategies and Developments
- 11.7. Emergent BioSolutions Inc.
- 11.7.1. Company Overview
- 11.7.2. Financial Highlights
- 11.7.3. Product Portfolio
- 11.7.4. SWOT Analysis
- 11.7.5. Key Strategies and Developments
- 11.8. F. Hoffmann-La Roche AG
- 11.8.1. Company Overview
- 11.8.2. Financial Highlights
- 11.8.3. Product Portfolio
- 11.8.4. SWOT Analysis
- 11.8.5. Key Strategies and Developments
- 11.9. Gamma Vaccines Pty Ltd
- 11.9.1. Company Overview
- 11.9.2. Financial Highlights
- 11.9.3. Product Portfolio
- 11.9.4. SWOT Analysis
- 11.9.5. Key Strategies and Developments
- 11.10. GlaxoSmithKline plc
- 11.10.1. Company Overview
- 11.10.2. Financial Highlights
- 11.10.3. Product Portfolio
- 11.10.4. SWOT Analysis
- 11.10.5. Key Strategies and Developments
- 11.11. Merck & Co. Inc.
- 11.11.1. Company Overview
- 11.11.2. Financial Highlights
- 11.11.3. Product Portfolio
- 11.11.4. SWOT Analysis
- 11.11.5. Key Strategies and Developments
- 11.12. Novartis AG
- 11.12.1. Company Overview
- 11.12.2. Financial Highlights
- 11.12.3. Product Portfolio
- 11.12.4. SWOT Analysis
- 11.12.5. Key Strategies and Developments
- 11.13.1. Company Overview
- 11.13.2. Financial Highlights
- 11.13.3. Product Portfolio
- 11.13.4. SWOT Analysis
- 11.13.5. Key Strategies and Developments
- 11.14. Pfizer Inc.
- 11.14.1. Company Overview
- 11.14.2. Financial Highlights
- 11.14.3. Product Portfolio
- 11.14.4. SWOT Analysis
- 11.14.5. Key Strategies and Developments
- 11.15. SINOVAC
- 11.15.1. Company Overview
- 11.15.2. Financial Highlights
- 11.15.3. Product Portfolio
- 11.15.4. SWOT Analysis
- 11.15.5. Key Strategies and Developments
- 11.16. Other Key Players
- 11.16.1. Company Overview
- 11.16.2. Financial Highlights
- 11.16.3. Product Portfolio
- 11.16.4. SWOT Analysis
- 11.16.5. Key Strategies and Developments
- 12. Assumptions and Acronyms
- 13. Research Methodology
- 14. Contact
- List of Figures
- Figure 1: Global Influenza Vaccine Market Revenue (US$ Mn) Market Share by Vaccine in 2022
- Figure 2: Global Influenza Vaccine Markett Attractiveness Analysis by Vaccine, 2016-2032
- Figure 3: Global Influenza Vaccine Market Revenue (US$ Mn) Market Share by Technologyin 2022
- Figure 4: Global Influenza Vaccine Markett Attractiveness Analysis by Technology, 2016-2032
- Figure 5: Global Influenza Vaccine Market Revenue (US$ Mn) Market Share by Age Groupin 2022
- Figure 6: Global Influenza Vaccine Markett Attractiveness Analysis by Age Group, 2016-2032
- Figure 7: Global Influenza Vaccine Market Revenue (US$ Mn) Market Share by Route of Administrationin 2022
- Figure 8: Global Influenza Vaccine Markett Attractiveness Analysis by Route of Administration, 2016-2032
- Figure 9: Global Influenza Vaccine Market Revenue (US$ Mn) Market Share by Region in 2022
- Figure 10: Global Influenza Vaccine Markett Attractiveness Analysis by Region, 2016-2032
- Figure 11: Global Influenza Vaccine Markett Revenue (US$ Mn) (2016-2032)
- Figure 12: Global Influenza Vaccine Markett Revenue (US$ Mn) Comparison by Region (2016-2032)
- Figure 13: Global Influenza Vaccine Markett Revenue (US$ Mn) Comparison by Vaccine (2016-2032)
- Figure 14: Global Influenza Vaccine Markett Revenue (US$ Mn) Comparison by Technology (2016-2032)
- Figure 15: Global Influenza Vaccine Markett Revenue (US$ Mn) Comparison by Age Group (2016-2032)
- Figure 16: Global Influenza Vaccine Markett Revenue (US$ Mn) Comparison by Route of Administration (2016-2032)
- Figure 17: Global Influenza Vaccine Markett Y-o-Y Growth Rate Comparison by Region (2016-2032)
- Figure 18: Global Influenza Vaccine Markett Y-o-Y Growth Rate Comparison by Vaccine (2016-2032)
- Figure 19: Global Influenza Vaccine Markett Y-o-Y Growth Rate Comparison by Technology (2016-2032)
- Figure 20: Global Influenza Vaccine Markett Y-o-Y Growth Rate Comparison by Age Group (2016-2032)
- Figure 21: Global Influenza Vaccine Markett Y-o-Y Growth Rate Comparison by Route of Administration (2016-2032)
- Figure 22: Global Influenza Vaccine Markett Share Comparison by Region (2016-2032)
- Figure 23: Global Influenza Vaccine Markett Share Comparison by Vaccine (2016-2032)
- Figure 24: Global Influenza Vaccine Markett Share Comparison by Technology (2016-2032)
- Figure 25: Global Influenza Vaccine Markett Share Comparison by Age Group (2016-2032)
- Figure 26: Global Influenza Vaccine Markett Share Comparison by Route of Administration (2016-2032)
- Figure 27: North America Influenza Vaccine Market Revenue (US$ Mn) Market Share by Vaccinein 2022
- Figure 28: North America Influenza Vaccine Markett Attractiveness Analysis by Vaccine, 2016-2032
- Figure 29: North America Influenza Vaccine Market Revenue (US$ Mn) Market Share by Technologyin 2022
- Figure 30: North America Influenza Vaccine Markett Attractiveness Analysis by Technology, 2016-2032
- Figure 31: North America Influenza Vaccine Market Revenue (US$ Mn) Market Share by Age Groupin 2022
- Figure 32: North America Influenza Vaccine Markett Attractiveness Analysis by Age Group, 2016-2032
- Figure 33: North America Influenza Vaccine Market Revenue (US$ Mn) Market Share by Route of Administrationin 2022
- Figure 34: North America Influenza Vaccine Markett Attractiveness Analysis by Route of Administration, 2016-2032
- Figure 35: North America Influenza Vaccine Market Revenue (US$ Mn) Market Share by Country in 2022
- Figure 36: North America Influenza Vaccine Markett Attractiveness Analysis by Country, 2016-2032
- Figure 37: North America Influenza Vaccine Markett Revenue (US$ Mn) (2016-2032)
- Figure 38: North America Influenza Vaccine Markett Revenue (US$ Mn) Comparison by Country (2016-2032)
- Figure 39: North America Influenza Vaccine Markett Revenue (US$ Mn) Comparison by Vaccine (2016-2032)
- Figure 40: North America Influenza Vaccine Markett Revenue (US$ Mn) Comparison by Technology (2016-2032)
- Figure 41: North America Influenza Vaccine Markett Revenue (US$ Mn) Comparison by Age Group (2016-2032)
- Figure 42: North America Influenza Vaccine Markett Revenue (US$ Mn) Comparison by Route of Administration (2016-2032)
- Figure 43: North America Influenza Vaccine Markett Y-o-Y Growth Rate Comparison by Country (2016-2032)
- Figure 44: North America Influenza Vaccine Markett Y-o-Y Growth Rate Comparison by Vaccine (2016-2032)
- Figure 45: North America Influenza Vaccine Markett Y-o-Y Growth Rate Comparison by Technology (2016-2032)
- Figure 46: North America Influenza Vaccine Markett Y-o-Y Growth Rate Comparison by Age Group (2016-2032)
- Figure 47: North America Influenza Vaccine Markett Y-o-Y Growth Rate Comparison by Route of Administration (2016-2032)
- Figure 48: North America Influenza Vaccine Markett Share Comparison by Country (2016-2032)
- Figure 49: North America Influenza Vaccine Markett Share Comparison by Vaccine (2016-2032)
- Figure 50: North America Influenza Vaccine Markett Share Comparison by Technology (2016-2032)
- Figure 51: North America Influenza Vaccine Markett Share Comparison by Age Group (2016-2032)
- Figure 52: North America Influenza Vaccine Markett Share Comparison by Route of Administration (2016-2032)
- Figure 53: Western Europe Influenza Vaccine Market Revenue (US$ Mn) Market Share by Vaccinein 2022
- Figure 54: Western Europe Influenza Vaccine Markett Attractiveness Analysis by Vaccine, 2016-2032
- Figure 55: Western Europe Influenza Vaccine Market Revenue (US$ Mn) Market Share by Technologyin 2022
- Figure 56: Western Europe Influenza Vaccine Markett Attractiveness Analysis by Technology, 2016-2032
- Figure 57: Western Europe Influenza Vaccine Market Revenue (US$ Mn) Market Share by Age Groupin 2022
- Figure 58: Western Europe Influenza Vaccine Markett Attractiveness Analysis by Age Group, 2016-2032
- Figure 59: Western Europe Influenza Vaccine Market Revenue (US$ Mn) Market Share by Route of Administrationin 2022
- Figure 60: Western Europe Influenza Vaccine Markett Attractiveness Analysis by Route of Administration, 2016-2032
- Figure 61: Western Europe Influenza Vaccine Market Revenue (US$ Mn) Market Share by Country in 2022
- Figure 62: Western Europe Influenza Vaccine Markett Attractiveness Analysis by Country, 2016-2032
- Figure 63: Western Europe Influenza Vaccine Markett Revenue (US$ Mn) (2016-2032)
- Figure 64: Western Europe Influenza Vaccine Markett Revenue (US$ Mn) Comparison by Country (2016-2032)
- Figure 65: Western Europe Influenza Vaccine Markett Revenue (US$ Mn) Comparison by Vaccine (2016-2032)
- Figure 66: Western Europe Influenza Vaccine Markett Revenue (US$ Mn) Comparison by Technology (2016-2032)
- Figure 67: Western Europe Influenza Vaccine Markett Revenue (US$ Mn) Comparison by Age Group (2016-2032)
- Figure 68: Western Europe Influenza Vaccine Markett Revenue (US$ Mn) Comparison by Route of Administration (2016-2032)
- Figure 69: Western Europe Influenza Vaccine Markett Y-o-Y Growth Rate Comparison by Country (2016-2032)
- Figure 70: Western Europe Influenza Vaccine Markett Y-o-Y Growth Rate Comparison by Vaccine (2016-2032)
- Figure 71: Western Europe Influenza Vaccine Markett Y-o-Y Growth Rate Comparison by Technology (2016-2032)
- Figure 72: Western Europe Influenza Vaccine Markett Y-o-Y Growth Rate Comparison by Age Group (2016-2032)
- Figure 73: Western Europe Influenza Vaccine Markett Y-o-Y Growth Rate Comparison by Route of Administration (2016-2032)
- Figure 74: Western Europe Influenza Vaccine Markett Share Comparison by Country (2016-2032)
- Figure 75: Western Europe Influenza Vaccine Markett Share Comparison by Vaccine (2016-2032)
- Figure 76: Western Europe Influenza Vaccine Markett Share Comparison by Technology (2016-2032)
- Figure 77: Western Europe Influenza Vaccine Markett Share Comparison by Age Group (2016-2032)
- Figure 78: Western Europe Influenza Vaccine Markett Share Comparison by Route of Administration (2016-2032)
- Figure 79: Eastern Europe Influenza Vaccine Market Revenue (US$ Mn) Market Share by Vaccinein 2022
- Figure 80: Eastern Europe Influenza Vaccine Markett Attractiveness Analysis by Vaccine, 2016-2032
- Figure 81: Eastern Europe Influenza Vaccine Market Revenue (US$ Mn) Market Share by Technologyin 2022
- Figure 82: Eastern Europe Influenza Vaccine Markett Attractiveness Analysis by Technology, 2016-2032
- Figure 83: Eastern Europe Influenza Vaccine Market Revenue (US$ Mn) Market Share by Age Groupin 2022
- Figure 84: Eastern Europe Influenza Vaccine Markett Attractiveness Analysis by Age Group, 2016-2032
- Figure 85: Eastern Europe Influenza Vaccine Market Revenue (US$ Mn) Market Share by Route of Administrationin 2022
- Figure 86: Eastern Europe Influenza Vaccine Markett Attractiveness Analysis by Route of Administration, 2016-2032
- Figure 87: Eastern Europe Influenza Vaccine Market Revenue (US$ Mn) Market Share by Country in 2022
- Figure 88: Eastern Europe Influenza Vaccine Markett Attractiveness Analysis by Country, 2016-2032
- Figure 89: Eastern Europe Influenza Vaccine Markett Revenue (US$ Mn) (2016-2032)
- Figure 90: Eastern Europe Influenza Vaccine Markett Revenue (US$ Mn) Comparison by Country (2016-2032)
- Figure 91: Eastern Europe Influenza Vaccine Markett Revenue (US$ Mn) Comparison by Vaccine (2016-2032)
- Figure 92: Eastern Europe Influenza Vaccine Markett Revenue (US$ Mn) Comparison by Technology (2016-2032)
- Figure 93: Eastern Europe Influenza Vaccine Markett Revenue (US$ Mn) Comparison by Age Group (2016-2032)
- Figure 94: Eastern Europe Influenza Vaccine Markett Revenue (US$ Mn) Comparison by Route of Administration (2016-2032)
- Figure 95: Eastern Europe Influenza Vaccine Markett Y-o-Y Growth Rate Comparison by Country (2016-2032)
- Figure 96: Eastern Europe Influenza Vaccine Markett Y-o-Y Growth Rate Comparison by Vaccine (2016-2032)
- Figure 97: Eastern Europe Influenza Vaccine Markett Y-o-Y Growth Rate Comparison by Technology (2016-2032)
- Figure 98: Eastern Europe Influenza Vaccine Markett Y-o-Y Growth Rate Comparison by Age Group (2016-2032)
- Figure 99: Eastern Europe Influenza Vaccine Markett Y-o-Y Growth Rate Comparison by Route of Administration (2016-2032)
- Figure 100: Eastern Europe Influenza Vaccine Markett Share Comparison by Country (2016-2032)
- Figure 101: Eastern Europe Influenza Vaccine Markett Share Comparison by Vaccine (2016-2032)
- Figure 102: Eastern Europe Influenza Vaccine Markett Share Comparison by Technology (2016-2032)
- Figure 103: Eastern Europe Influenza Vaccine Markett Share Comparison by Age Group (2016-2032)
- Figure 104: Eastern Europe Influenza Vaccine Markett Share Comparison by Route of Administration (2016-2032)
- Figure 105: APAC Influenza Vaccine Market Revenue (US$ Mn) Market Share by Vaccinein 2022
- Figure 106: APAC Influenza Vaccine Markett Attractiveness Analysis by Vaccine, 2016-2032
- Figure 107: APAC Influenza Vaccine Market Revenue (US$ Mn) Market Share by Technologyin 2022
- Figure 108: APAC Influenza Vaccine Markett Attractiveness Analysis by Technology, 2016-2032
- Figure 109: APAC Influenza Vaccine Market Revenue (US$ Mn) Market Share by Age Groupin 2022
- Figure 110: APAC Influenza Vaccine Markett Attractiveness Analysis by Age Group, 2016-2032
- Figure 111: APAC Influenza Vaccine Market Revenue (US$ Mn) Market Share by Route of Administrationin 2022
- Figure 112: APAC Influenza Vaccine Markett Attractiveness Analysis by Route of Administration, 2016-2032
- Figure 113: APAC Influenza Vaccine Market Revenue (US$ Mn) Market Share by Country in 2022
- Figure 114: APAC Influenza Vaccine Markett Attractiveness Analysis by Country, 2016-2032
- Figure 115: APAC Influenza Vaccine Markett Revenue (US$ Mn) (2016-2032)
- Figure 116: APAC Influenza Vaccine Markett Revenue (US$ Mn) Comparison by Country (2016-2032)
- Figure 117: APAC Influenza Vaccine Markett Revenue (US$ Mn) Comparison by Vaccine (2016-2032)
- Figure 118: APAC Influenza Vaccine Markett Revenue (US$ Mn) Comparison by Technology (2016-2032)
- Figure 119: APAC Influenza Vaccine Markett Revenue (US$ Mn) Comparison by Age Group (2016-2032)
- Figure 120: APAC Influenza Vaccine Markett Revenue (US$ Mn) Comparison by Route of Administration (2016-2032)
- Figure 121: APAC Influenza Vaccine Markett Y-o-Y Growth Rate Comparison by Country (2016-2032)
- Figure 122: APAC Influenza Vaccine Markett Y-o-Y Growth Rate Comparison by Vaccine (2016-2032)
- Figure 123: APAC Influenza Vaccine Markett Y-o-Y Growth Rate Comparison by Technology (2016-2032)
- Figure 124: APAC Influenza Vaccine Markett Y-o-Y Growth Rate Comparison by Age Group (2016-2032)
- Figure 125: APAC Influenza Vaccine Markett Y-o-Y Growth Rate Comparison by Route of Administration (2016-2032)
- Figure 126: APAC Influenza Vaccine Markett Share Comparison by Country (2016-2032)
- Figure 127: APAC Influenza Vaccine Markett Share Comparison by Vaccine (2016-2032)
- Figure 128: APAC Influenza Vaccine Markett Share Comparison by Technology (2016-2032)
- Figure 129: APAC Influenza Vaccine Markett Share Comparison by Age Group (2016-2032)
- Figure 130: APAC Influenza Vaccine Markett Share Comparison by Route of Administration (2016-2032)
- Figure 131: Latin America Influenza Vaccine Market Revenue (US$ Mn) Market Share by Vaccinein 2022
- Figure 132: Latin America Influenza Vaccine Markett Attractiveness Analysis by Vaccine, 2016-2032
- Figure 133: Latin America Influenza Vaccine Market Revenue (US$ Mn) Market Share by Technologyin 2022
- Figure 134: Latin America Influenza Vaccine Markett Attractiveness Analysis by Technology, 2016-2032
- Figure 135: Latin America Influenza Vaccine Market Revenue (US$ Mn) Market Share by Age Groupin 2022
- Figure 136: Latin America Influenza Vaccine Markett Attractiveness Analysis by Age Group, 2016-2032
- Figure 137: Latin America Influenza Vaccine Market Revenue (US$ Mn) Market Share by Route of Administrationin 2022
- Figure 138: Latin America Influenza Vaccine Markett Attractiveness Analysis by Route of Administration, 2016-2032
- Figure 139: Latin America Influenza Vaccine Market Revenue (US$ Mn) Market Share by Country in 2022
- Figure 140: Latin America Influenza Vaccine Markett Attractiveness Analysis by Country, 2016-2032
- Figure 141: Latin America Influenza Vaccine Markett Revenue (US$ Mn) (2016-2032)
- Figure 142: Latin America Influenza Vaccine Markett Revenue (US$ Mn) Comparison by Country (2016-2032)
- Figure 143: Latin America Influenza Vaccine Markett Revenue (US$ Mn) Comparison by Vaccine (2016-2032)
- Figure 144: Latin America Influenza Vaccine Markett Revenue (US$ Mn) Comparison by Technology (2016-2032)
- Figure 145: Latin America Influenza Vaccine Markett Revenue (US$ Mn) Comparison by Age Group (2016-2032)
- Figure 146: Latin America Influenza Vaccine Markett Revenue (US$ Mn) Comparison by Route of Administration (2016-2032)
- Figure 147: Latin America Influenza Vaccine Markett Y-o-Y Growth Rate Comparison by Country (2016-2032)
- Figure 148: Latin America Influenza Vaccine Markett Y-o-Y Growth Rate Comparison by Vaccine (2016-2032)
- Figure 149: Latin America Influenza Vaccine Markett Y-o-Y Growth Rate Comparison by Technology (2016-2032)
- Figure 150: Latin America Influenza Vaccine Markett Y-o-Y Growth Rate Comparison by Age Group (2016-2032)
- Figure 151: Latin America Influenza Vaccine Markett Y-o-Y Growth Rate Comparison by Route of Administration (2016-2032)
- Figure 152: Latin America Influenza Vaccine Markett Share Comparison by Country (2016-2032)
- Figure 153: Latin America Influenza Vaccine Markett Share Comparison by Vaccine (2016-2032)
- Figure 154: Latin America Influenza Vaccine Markett Share Comparison by Technology (2016-2032)
- Figure 155: Latin America Influenza Vaccine Markett Share Comparison by Age Group (2016-2032)
- Figure 156: Latin America Influenza Vaccine Markett Share Comparison by Route of Administration (2016-2032)
- Figure 157: Middle East & Africa Influenza Vaccine Market Revenue (US$ Mn) Market Share by Vaccinein 2022
- Figure 158: Middle East & Africa Influenza Vaccine Markett Attractiveness Analysis by Vaccine, 2016-2032
- Figure 159: Middle East & Africa Influenza Vaccine Market Revenue (US$ Mn) Market Share by Technologyin 2022
- Figure 160: Middle East & Africa Influenza Vaccine Markett Attractiveness Analysis by Technology, 2016-2032
- Figure 161: Middle East & Africa Influenza Vaccine Market Revenue (US$ Mn) Market Share by Age Groupin 2022
- Figure 162: Middle East & Africa Influenza Vaccine Markett Attractiveness Analysis by Age Group, 2016-2032
- Figure 163: Middle East & Africa Influenza Vaccine Market Revenue (US$ Mn) Market Share by Route of Administrationin 2022
- Figure 164: Middle East & Africa Influenza Vaccine Markett Attractiveness Analysis by Route of Administration, 2016-2032
- Figure 165: Middle East & Africa Influenza Vaccine Market Revenue (US$ Mn) Market Share by Country in 2022
- Figure 166: Middle East & Africa Influenza Vaccine Markett Attractiveness Analysis by Country, 2016-2032
- Figure 167: Middle East & Africa Influenza Vaccine Markett Revenue (US$ Mn) (2016-2032)
- Figure 168: Middle East & Africa Influenza Vaccine Markett Revenue (US$ Mn) Comparison by Country (2016-2032)
- Figure 169: Middle East & Africa Influenza Vaccine Markett Revenue (US$ Mn) Comparison by Vaccine (2016-2032)
- Figure 170: Middle East & Africa Influenza Vaccine Markett Revenue (US$ Mn) Comparison by Technology (2016-2032)
- Figure 171: Middle East & Africa Influenza Vaccine Markett Revenue (US$ Mn) Comparison by Age Group (2016-2032)
- Figure 172: Middle East & Africa Influenza Vaccine Markett Revenue (US$ Mn) Comparison by Route of Administration (2016-2032)
- Figure 173: Middle East & Africa Influenza Vaccine Markett Y-o-Y Growth Rate Comparison by Country (2016-2032)
- Figure 174: Middle East & Africa Influenza Vaccine Markett Y-o-Y Growth Rate Comparison by Vaccine (2016-2032)
- Figure 175: Middle East & Africa Influenza Vaccine Markett Y-o-Y Growth Rate Comparison by Technology (2016-2032)
- Figure 176: Middle East & Africa Influenza Vaccine Markett Y-o-Y Growth Rate Comparison by Age Group (2016-2032)
- Figure 177: Middle East & Africa Influenza Vaccine Markett Y-o-Y Growth Rate Comparison by Route of Administration (2016-2032)
- Figure 178: Middle East & Africa Influenza Vaccine Markett Share Comparison by Country (2016-2032)
- Figure 179: Middle East & Africa Influenza Vaccine Markett Share Comparison by Vaccine (2016-2032)
- Figure 180: Middle East & Africa Influenza Vaccine Markett Share Comparison by Technology (2016-2032)
- Figure 181: Middle East & Africa Influenza Vaccine Markett Share Comparison by Age Group (2016-2032)
- Figure 182: Middle East & Africa Influenza Vaccine Markett Share Comparison by Route of Administration (2016-2032)
- List of Tables
- Table 1: Global Influenza Vaccine Markett Comparison by Vaccine (2016-2032)
- Table 2: Global Influenza Vaccine Markett Comparison by Technology (2016-2032)
- Table 3: Global Influenza Vaccine Markett Comparison by Age Group (2016-2032)
- Table 4: Global Influenza Vaccine Markett Comparison by Route of Administration (2016-2032)
- Table 5: Global Influenza Vaccine Market Revenue (US$ Mn) Comparison by Region (2016-2032)
- Table 6: Global Influenza Vaccine Markett Revenue (US$ Mn) (2016-2032)
- Table 7: Global Influenza Vaccine Markett Revenue (US$ Mn) Comparison by Region (2016-2032)
- Table 8: Global Influenza Vaccine Markett Revenue (US$ Mn) Comparison by Vaccine (2016-2032)
- Table 9: Global Influenza Vaccine Markett Revenue (US$ Mn) Comparison by Technology (2016-2032)
- Table 10: Global Influenza Vaccine Markett Revenue (US$ Mn) Comparison by Age Group (2016-2032)
- Table 11: Global Influenza Vaccine Markett Revenue (US$ Mn) Comparison by Route of Administration (2016-2032)
- Table 12: Global Influenza Vaccine Markett Y-o-Y Growth Rate Comparison by Region (2016-2032)
- Table 13: Global Influenza Vaccine Markett Y-o-Y Growth Rate Comparison by Vaccine (2016-2032)
- Table 14: Global Influenza Vaccine Markett Y-o-Y Growth Rate Comparison by Technology (2016-2032)
- Table 15: Global Influenza Vaccine Markett Y-o-Y Growth Rate Comparison by Age Group (2016-2032)
- Table 16: Global Influenza Vaccine Markett Y-o-Y Growth Rate Comparison by Route of Administration (2016-2032)
- Table 17: Global Influenza Vaccine Markett Share Comparison by Region (2016-2032)
- Table 18: Global Influenza Vaccine Markett Share Comparison by Vaccine (2016-2032)
- Table 19: Global Influenza Vaccine Markett Share Comparison by Technology (2016-2032)
- Table 20: Global Influenza Vaccine Markett Share Comparison by Age Group (2016-2032)
- Table 21: Global Influenza Vaccine Markett Share Comparison by Route of Administration (2016-2032)
- Table 22: North America Influenza Vaccine Markett Comparison by Technology (2016-2032)
- Table 23: North America Influenza Vaccine Markett Comparison by Age Group (2016-2032)
- Table 24: North America Influenza Vaccine Markett Comparison by Route of Administration (2016-2032)
- Table 25: North America Influenza Vaccine Market Revenue (US$ Mn) Comparison by Country (2016-2032)
- Table 26: North America Influenza Vaccine Markett Revenue (US$ Mn) (2016-2032)
- Table 27: North America Influenza Vaccine Markett Revenue (US$ Mn) Comparison by Country (2016-2032)
- Table 28: North America Influenza Vaccine Markett Revenue (US$ Mn) Comparison by Vaccine (2016-2032)
- Table 29: North America Influenza Vaccine Markett Revenue (US$ Mn) Comparison by Technology (2016-2032)
- Table 30: North America Influenza Vaccine Markett Revenue (US$ Mn) Comparison by Age Group (2016-2032)
- Table 31: North America Influenza Vaccine Markett Revenue (US$ Mn) Comparison by Route of Administration (2016-2032)
- Table 32: North America Influenza Vaccine Markett Y-o-Y Growth Rate Comparison by Country (2016-2032)
- Table 33: North America Influenza Vaccine Markett Y-o-Y Growth Rate Comparison by Vaccine (2016-2032)
- Table 34: North America Influenza Vaccine Markett Y-o-Y Growth Rate Comparison by Technology (2016-2032)
- Table 35: North America Influenza Vaccine Markett Y-o-Y Growth Rate Comparison by Age Group (2016-2032)
- Table 36: North America Influenza Vaccine Markett Y-o-Y Growth Rate Comparison by Route of Administration (2016-2032)
- Table 37: North America Influenza Vaccine Markett Share Comparison by Country (2016-2032)
- Table 38: North America Influenza Vaccine Markett Share Comparison by Vaccine (2016-2032)
- Table 39: North America Influenza Vaccine Markett Share Comparison by Technology (2016-2032)
- Table 40: North America Influenza Vaccine Markett Share Comparison by Age Group (2016-2032)
- Table 41: North America Influenza Vaccine Markett Share Comparison by Route of Administration (2016-2032)
- Table 42: Western Europe Influenza Vaccine Markett Comparison by Vaccine (2016-2032)
- Table 43: Western Europe Influenza Vaccine Markett Comparison by Technology (2016-2032)
- Table 44: Western Europe Influenza Vaccine Markett Comparison by Age Group (2016-2032)
- Table 45: Western Europe Influenza Vaccine Markett Comparison by Route of Administration (2016-2032)
- Table 46: Western Europe Influenza Vaccine Market Revenue (US$ Mn) Comparison by Country (2016-2032)
- Table 47: Western Europe Influenza Vaccine Markett Revenue (US$ Mn) (2016-2032)
- Table 48: Western Europe Influenza Vaccine Markett Revenue (US$ Mn) Comparison by Country (2016-2032)
- Table 49: Western Europe Influenza Vaccine Markett Revenue (US$ Mn) Comparison by Vaccine (2016-2032)
- Table 50: Western Europe Influenza Vaccine Markett Revenue (US$ Mn) Comparison by Technology (2016-2032)
- Table 51: Western Europe Influenza Vaccine Markett Revenue (US$ Mn) Comparison by Age Group (2016-2032)
- Table 52: Western Europe Influenza Vaccine Markett Revenue (US$ Mn) Comparison by Route of Administration (2016-2032)
- Table 53: Western Europe Influenza Vaccine Markett Y-o-Y Growth Rate Comparison by Country (2016-2032)
- Table 54: Western Europe Influenza Vaccine Markett Y-o-Y Growth Rate Comparison by Vaccine (2016-2032)
- Table 55: Western Europe Influenza Vaccine Markett Y-o-Y Growth Rate Comparison by Technology (2016-2032)
- Table 56: Western Europe Influenza Vaccine Markett Y-o-Y Growth Rate Comparison by Age Group (2016-2032)
- Table 57: Western Europe Influenza Vaccine Markett Y-o-Y Growth Rate Comparison by Route of Administration (2016-2032)
- Table 58: Western Europe Influenza Vaccine Markett Share Comparison by Country (2016-2032)
- Table 59: Western Europe Influenza Vaccine Markett Share Comparison by Vaccine (2016-2032)
- Table 60: Western Europe Influenza Vaccine Markett Share Comparison by Technology (2016-2032)
- Table 61: Western Europe Influenza Vaccine Markett Share Comparison by Age Group (2016-2032)
- Table 62: Western Europe Influenza Vaccine Markett Share Comparison by Route of Administration (2016-2032)
- Table 63: Eastern Europe Influenza Vaccine Markett Comparison by Vaccine (2016-2032)
- Table 64: Eastern Europe Influenza Vaccine Markett Comparison by Technology (2016-2032)
- Table 65: Eastern Europe Influenza Vaccine Markett Comparison by Age Group (2016-2032)
- Table 66: Eastern Europe Influenza Vaccine Markett Comparison by Route of Administration (2016-2032)
- Table 67: Eastern Europe Influenza Vaccine Market Revenue (US$ Mn) Comparison by Country (2016-2032)
- Table 68: Eastern Europe Influenza Vaccine Markett Revenue (US$ Mn) (2016-2032)
- Table 69: Eastern Europe Influenza Vaccine Markett Revenue (US$ Mn) Comparison by Country (2016-2032)
- Table 70: Eastern Europe Influenza Vaccine Markett Revenue (US$ Mn) Comparison by Vaccine (2016-2032)
- Table 71: Eastern Europe Influenza Vaccine Markett Revenue (US$ Mn) Comparison by Technology (2016-2032)
- Table 72: Eastern Europe Influenza Vaccine Markett Revenue (US$ Mn) Comparison by Age Group (2016-2032)
- Table 73: Eastern Europe Influenza Vaccine Markett Revenue (US$ Mn) Comparison by Route of Administration (2016-2032)
- Table 74: Eastern Europe Influenza Vaccine Markett Y-o-Y Growth Rate Comparison by Country (2016-2032)
- Table 75: Eastern Europe Influenza Vaccine Markett Y-o-Y Growth Rate Comparison by Vaccine (2016-2032)
- Table 76: Eastern Europe Influenza Vaccine Markett Y-o-Y Growth Rate Comparison by Technology (2016-2032)
- Table 77: Eastern Europe Influenza Vaccine Markett Y-o-Y Growth Rate Comparison by Age Group (2016-2032)
- Table 78: Eastern Europe Influenza Vaccine Markett Y-o-Y Growth Rate Comparison by Route of Administration (2016-2032)
- Table 79: Eastern Europe Influenza Vaccine Markett Share Comparison by Country (2016-2032)
- Table 80: Eastern Europe Influenza Vaccine Markett Share Comparison by Vaccine (2016-2032)
- Table 81: Eastern Europe Influenza Vaccine Markett Share Comparison by Technology (2016-2032)
- Table 82: Eastern Europe Influenza Vaccine Markett Share Comparison by Age Group (2016-2032)
- Table 83: Eastern Europe Influenza Vaccine Markett Share Comparison by Route of Administration (2016-2032)
- Table 84: APAC Influenza Vaccine Markett Comparison by Vaccine (2016-2032)
- Table 85: APAC Influenza Vaccine Markett Comparison by Technology (2016-2032)
- Table 86: APAC Influenza Vaccine Markett Comparison by Age Group (2016-2032)
- Table 87: APAC Influenza Vaccine Markett Comparison by Route of Administration (2016-2032)
- Table 88: APAC Influenza Vaccine Market Revenue (US$ Mn) Comparison by Country (2016-2032)
- Table 89: APAC Influenza Vaccine Markett Revenue (US$ Mn) (2016-2032)
- Table 90: APAC Influenza Vaccine Markett Revenue (US$ Mn) Comparison by Country (2016-2032)
- Table 91: APAC Influenza Vaccine Markett Revenue (US$ Mn) Comparison by Vaccine (2016-2032)
- Table 92: APAC Influenza Vaccine Markett Revenue (US$ Mn) Comparison by Technology (2016-2032)
- Table 93: APAC Influenza Vaccine Markett Revenue (US$ Mn) Comparison by Age Group (2016-2032)
- Table 94: APAC Influenza Vaccine Markett Revenue (US$ Mn) Comparison by Route of Administration (2016-2032)
- Table 95: APAC Influenza Vaccine Markett Y-o-Y Growth Rate Comparison by Country (2016-2032)
- Table 96: APAC Influenza Vaccine Markett Y-o-Y Growth Rate Comparison by Vaccine (2016-2032)
- Table 97: APAC Influenza Vaccine Markett Y-o-Y Growth Rate Comparison by Technology (2016-2032)
- Table 98: APAC Influenza Vaccine Markett Y-o-Y Growth Rate Comparison by Age Group (2016-2032)
- Table 99: APAC Influenza Vaccine Markett Y-o-Y Growth Rate Comparison by Route of Administration (2016-2032)
- Table 100: APAC Influenza Vaccine Markett Share Comparison by Country (2016-2032)
- Table 101: APAC Influenza Vaccine Markett Share Comparison by Vaccine (2016-2032)
- Table 102: APAC Influenza Vaccine Markett Share Comparison by Technology (2016-2032)
- Table 103: APAC Influenza Vaccine Markett Share Comparison by Age Group (2016-2032)
- Table 104: APAC Influenza Vaccine Markett Share Comparison by Route of Administration (2016-2032)
- Table 105: Latin America Influenza Vaccine Markett Comparison by Vaccine (2016-2032)
- Table 106: Latin America Influenza Vaccine Markett Comparison by Technology (2016-2032)
- Table 107: Latin America Influenza Vaccine Markett Comparison by Age Group (2016-2032)
- Table 108: Latin America Influenza Vaccine Markett Comparison by Route of Administration (2016-2032)
- Table 109: Latin America Influenza Vaccine Market Revenue (US$ Mn) Comparison by Country (2016-2032)
- Table 110: Latin America Influenza Vaccine Markett Revenue (US$ Mn) (2016-2032)
- Table 111: Latin America Influenza Vaccine Markett Revenue (US$ Mn) Comparison by Country (2016-2032)
- Table 112: Latin America Influenza Vaccine Markett Revenue (US$ Mn) Comparison by Vaccine (2016-2032)
- Table 113: Latin America Influenza Vaccine Markett Revenue (US$ Mn) Comparison by Technology (2016-2032)
- Table 114: Latin America Influenza Vaccine Markett Revenue (US$ Mn) Comparison by Age Group (2016-2032)
- Table 115: Latin America Influenza Vaccine Markett Revenue (US$ Mn) Comparison by Route of Administration (2016-2032)
- Table 116: Latin America Influenza Vaccine Markett Y-o-Y Growth Rate Comparison by Country (2016-2032)
- Table 117: Latin America Influenza Vaccine Markett Y-o-Y Growth Rate Comparison by Vaccine (2016-2032)
- Table 118: Latin America Influenza Vaccine Markett Y-o-Y Growth Rate Comparison by Technology (2016-2032)
- Table 119: Latin America Influenza Vaccine Markett Y-o-Y Growth Rate Comparison by Age Group (2016-2032)
- Table 120: Latin America Influenza Vaccine Markett Y-o-Y Growth Rate Comparison by Route of Administration (2016-2032)
- Table 121: Latin America Influenza Vaccine Markett Share Comparison by Country (2016-2032)
- Table 122: Latin America Influenza Vaccine Markett Share Comparison by Vaccine (2016-2032)
- Table 123: Latin America Influenza Vaccine Markett Share Comparison by Technology (2016-2032)
- Table 124: Latin America Influenza Vaccine Markett Share Comparison by Age Group (2016-2032)
- Table 125: Latin America Influenza Vaccine Markett Share Comparison by Route of Administration (2016-2032)
- Table 126: Middle East & Africa Influenza Vaccine Markett Comparison by Vaccine (2016-2032)
- Table 127: Middle East & Africa Influenza Vaccine Markett Comparison by Technology (2016-2032)
- Table 128: Middle East & Africa Influenza Vaccine Markett Comparison by Age Group (2016-2032)
- Table 129: Middle East & Africa Influenza Vaccine Markett Comparison by Route of Administration (2016-2032)
- Table 130: Middle East & Africa Influenza Vaccine Market Revenue (US$ Mn) Comparison by Country (2016-2032)
- Table 131: Middle East & Africa Influenza Vaccine Markett Revenue (US$ Mn) (2016-2032)
- Table 132: Middle East & Africa Influenza Vaccine Markett Revenue (US$ Mn) Comparison by Country (2016-2032)
- Table 133: Middle East & Africa Influenza Vaccine Markett Revenue (US$ Mn) Comparison by Vaccine (2016-2032)
- Table 134: Middle East & Africa Influenza Vaccine Markett Revenue (US$ Mn) Comparison by Technology (2016-2032)
- Table 135: Middle East & Africa Influenza Vaccine Markett Revenue (US$ Mn) Comparison by Age Group (2016-2032)
- Table 136: Middle East & Africa Influenza Vaccine Markett Revenue (US$ Mn) Comparison by Route of Administration (2016-2032)
- Table 137: Middle East & Africa Influenza Vaccine Markett Y-o-Y Growth Rate Comparison by Country (2016-2032)
- Table 138: Middle East & Africa Influenza Vaccine Markett Y-o-Y Growth Rate Comparison by Vaccine (2016-2032)
- Table 139: Middle East & Africa Influenza Vaccine Markett Y-o-Y Growth Rate Comparison by Technology (2016-2032)
- Table 140: Middle East & Africa Influenza Vaccine Markett Y-o-Y Growth Rate Comparison by Age Group (2016-2032)
- Table 141: Middle East & Africa Influenza Vaccine Markett Y-o-Y Growth Rate Comparison by Route of Administration (2016-2032)
- Table 142: Middle East & Africa Influenza Vaccine Markett Share Comparison by Country (2016-2032)
- Table 143: Middle East & Africa Influenza Vaccine Markett Share Comparison by Vaccine (2016-2032)
- Table 144: Middle East & Africa Influenza Vaccine Markett Share Comparison by Technology (2016-2032)
- Table 145: Middle East & Africa Influenza Vaccine Markett Share Comparison by Age Group (2016-2032)
- Table 146: Middle East & Africa Influenza Vaccine Markett Share Comparison by Route of Administration (2016-2032)
- 1. Executive Summary
-
- Abbott Laboratories
- AstraZeneca plc
- CSL Limited
- Daiichi Sankyo Company Limited
- Emergent BioSolutions Inc.
- F. Hoffmann-La Roche AG
- Gamma Vaccines Pty Ltd
- GlaxoSmithKline plc
- Merck & Co. Inc.
- Novartis AG
- Pfizer Inc.
- Sanofi
- SINOVAC
Our Clients


View Our Licence Options
