In Vitro Toxicology Market By Technology (Cell Culture Technology, High Throughput Technology, Molecular Imaging, OMICS Technology), By Application (Systemic Toxicology, Dermal Toxicity, Endocrine Disruption, Ocular Toxicity, Others), By Method (Cellular Assay, Biochemical Assay, In-silico, Ex-vivo), By End-user (Pharmaceutical Industry, Cosmetics & Household Products, Academic Institutes & Research Laboratories, Diagnostics, Chemicals Industry, Food Industry), By Region And Companies - Industry Segment Outlook, Market Assessment, Competition Scenar
-
48294
-
Feb 2025
-
300
-


-
This report was compiled by Trishita Deb Trishita Deb is an experienced market research and consulting professional with over 7 years of expertise across healthcare, consumer goods, and materials, contributing to over 400 healthcare-related reports. Correspondence Team Lead- Healthcare Linkedin | Detailed Market research Methodology Our methodology involves a mix of primary research, including interviews with leading mental health experts, and secondary research from reputable medical journals and databases. View Detailed Methodology Page
-
Quick Navigation
Report Overview
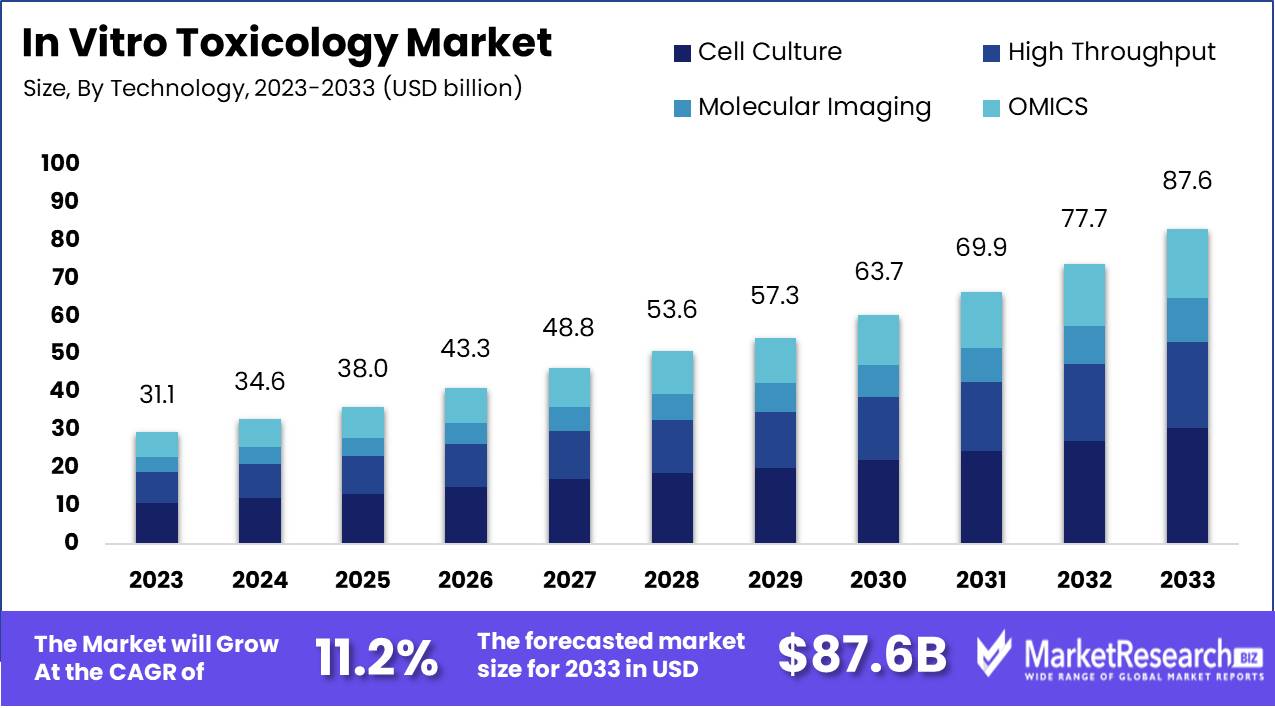
The In Vitro Toxicology Market was valued at USD 31.1 billion in 2023. It is expected to reach USD 87.6 billion by 2033, with a CAGR of 11.2% during the forecast period from 2024 to 2033.
The In Vitro Toxicology Market encompasses the analysis and assessment of the toxic effects of substances using cultured cells or tissues outside their natural biological context. This market is driven by the demand for alternatives to animal testing, regulatory pressure for safer product development, and technological advancements in cell-based assays and high-throughput screening methods. In vitro toxicology provides cost-effective, efficient, and ethically responsible approaches to evaluating chemical, pharmaceutical, and cosmetic safety.
The in vitro toxicology market is witnessing significant growth driven by a confluence of ethical, technological, and methodological factors. Ethical concerns surrounding animal testing are propelling a shift towards alternative testing methods, aligning with increasing regulatory restrictions. This paradigm shift is accelerating the adoption of in vitro toxicology, as it presents a more ethically sound and scientifically viable alternative.
Technological advancements are playing a crucial role in this transition. Innovations in cell culture, high-throughput screening (HTS), and omics technologies are significantly enhancing the accuracy and reliability of in vitro assays. These advancements are not only improving predictive capabilities but are also reducing the time and cost associated with traditional toxicological assessments.
Moreover, the rising popularity of 3D cell culture models, which offer more physiologically relevant data than traditional 2D cultures, underscores the industry's commitment to refining and enhancing testing methodologies.
However, the market is not without its challenges. Despite the progress, in vitro models often fall short of replicating the complexity of in vivo systems, which limits their predictive accuracy for certain toxicological endpoints. This gap underscores the necessity for ongoing innovation and integration of multi-dimensional data to bridge the disparity between in vitro and in vivo models.
The industry's focus must remain on addressing these limitations to fully harness the potential of in vitro toxicology. As regulatory landscapes continue to evolve and technological advancements persist, the in vitro toxicology market is poised for sustained growth, driven by a commitment to ethical practices and scientific excellence. Companies operating in this space should prioritize investment in research and development to enhance model sophistication and predictive accuracy, ensuring alignment with both ethical standards and regulatory expectations.
Key Takeaways
- Market Growth: The In Vitro Toxicology Market was valued at USD 31.1 billion in 2023. It is expected to reach USD 87.6 billion by 2033, with a CAGR of 11.2% during the forecast period from 2024 to 2033.
- By Technology: Cell Culture Technology dominated the In Vitro Toxicology Market.
- By Application: Systemic Toxicology dominated the In Vitro Toxicology market applications.
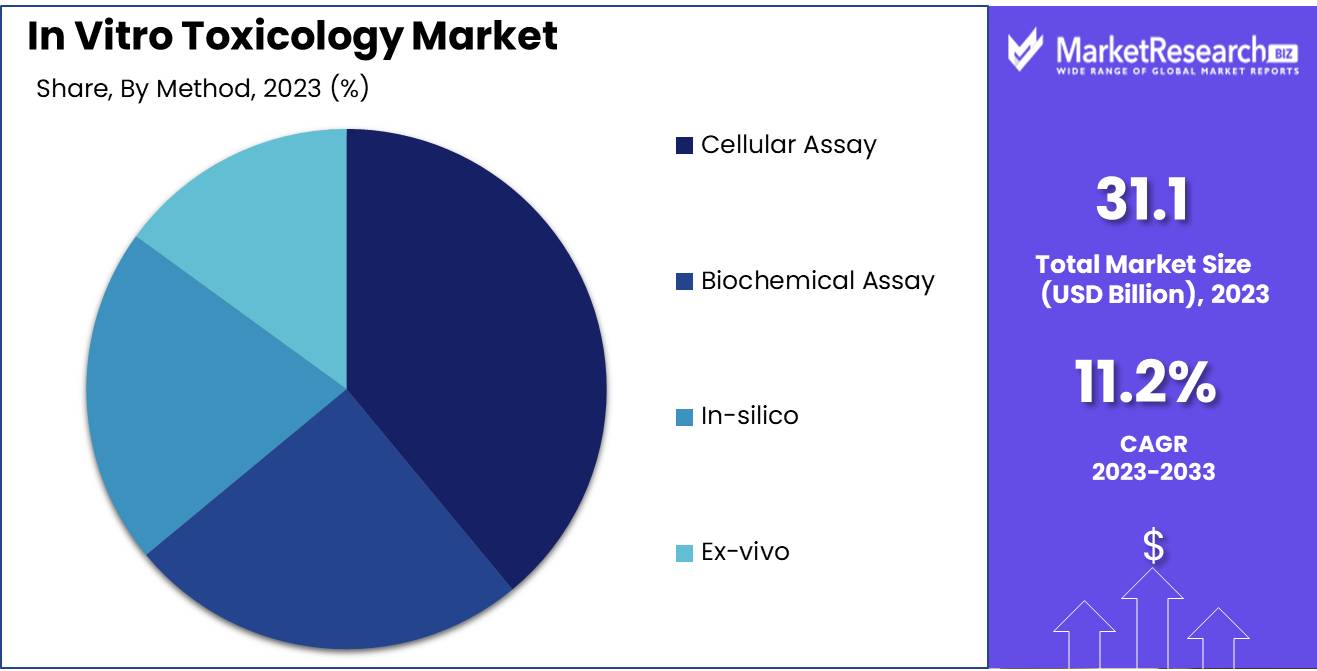
- By Method: Cellular Assays dominate in In Vitro Toxicology for detailed toxin insights.
- By End-user: The Pharmaceutical Industry dominated the In Vitro Toxicology Market.
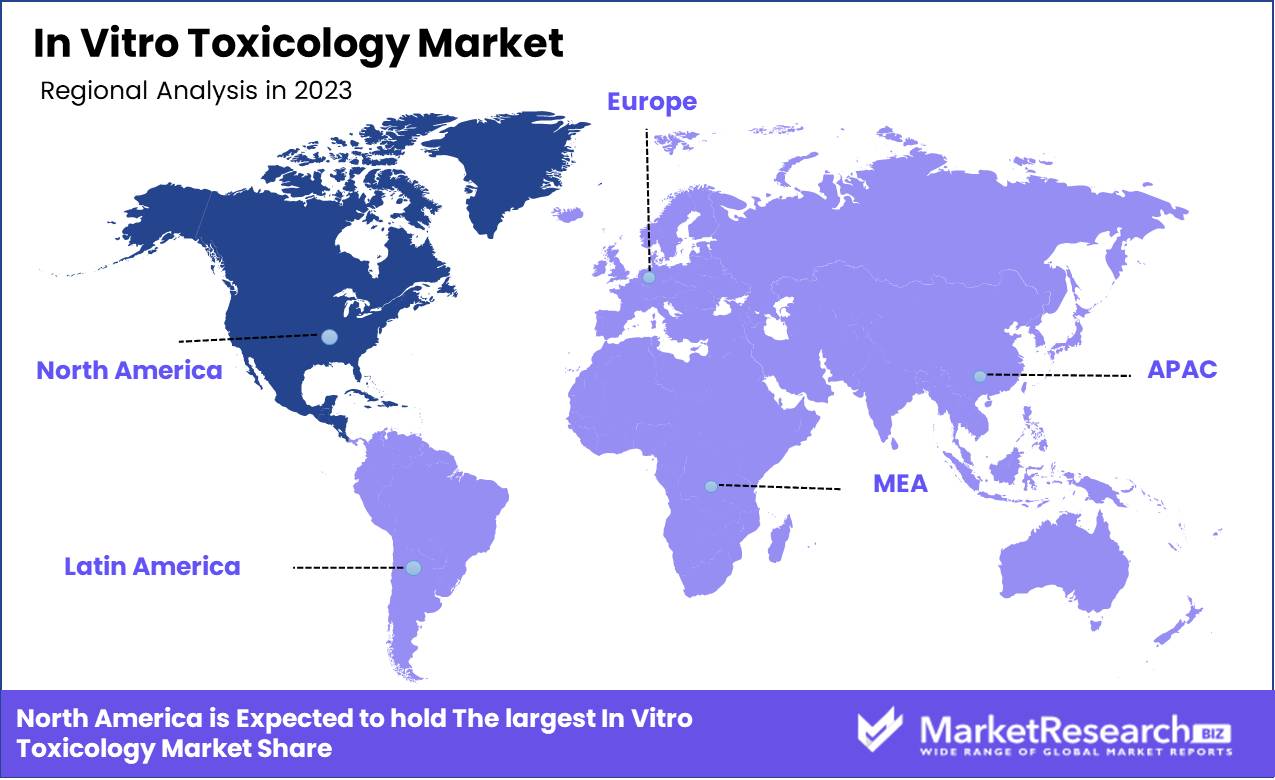
- Regional Dominance: North America leads the In Vitro Toxicology market with a 40% largest share.
- Growth Opportunity: The in vitro toxicology market is set for substantial growth, driven by alternative testing methods and pharmaceutical industry expansion.
Driving factors
Ethical Push: Opposition to the Use of Animals in Pre-Clinical Research
The growing ethical opposition to the use of animals in pre-clinical research is a significant driver for the in vitro toxicology market. Public awareness and advocacy for animal rights have led to increased regulatory pressures and a societal shift towards more humane scientific practices. According to recent statistics, the European Union has seen a consistent decline in the use of animals for scientific purposes, with a 10% reduction reported over the past five years.
This trend is reflected globally, with major pharmaceutical and biotech companies seeking alternative testing methods to align with these ethical standards. As a result, there is a substantial push towards in vitro methodologies, which offer a humane, reproducible, and often more cost-effective solution. This transition helps mitigate ethical concerns and accelerates the adoption of in vitro toxicology assays, fueling market growth.
Technological Breakthroughs: Significant Advancements in In Vitro Toxicology Assays
Significant advancements in in vitro toxicology assays have revolutionized the landscape of drug testing and safety evaluations. Innovations such as 3D cell cultures, high-throughput screening (HTS), and organ-on-a-chip technologies have enhanced the precision, efficiency, and predictive power of in vitro assays. These technologies mimic human physiological responses more accurately than traditional 2D cell cultures, providing more relevant data for safety assessments.
For instance, the global market for organ-on-a-chip technology is projected to reach USD 1.6 billion by 2027, growing at a CAGR of 39.9%. Such advancements reduce the reliance on animal models and improve the overall reliability of toxicological data, thereby driving the adoption of in vitro methods. These technological improvements streamline the drug development process and support regulatory compliance, ultimately contributing to the growth of the in vitro toxicology market.
Proactive Safety: Increasing Awareness Regarding Drug Product Safety
The increasing awareness regarding drug product safety among regulatory bodies, healthcare providers, and consumers is another crucial factor propelling the in vitro toxicology market. High-profile drug recalls and adverse drug reactions have underscored the need for rigorous safety testing. For example, the FDA reported that adverse drug reactions contribute to more than 100,000 deaths annually in the United States, highlighting a significant public health concern.
This heightened awareness has led to stricter regulatory requirements for drug safety evaluations and a preference for more reliable, human-relevant testing methods. In vitro toxicology assays provide a robust platform for early detection of potential toxic effects, reducing the risk of adverse outcomes in clinical trials and post-market phases. This proactive approach to drug safety not only safeguards public health but also enhances the credibility of pharmaceutical companies, thereby driving the market demand for in vitro toxicology solutions.
Restraining Factors
Regulatory Hurdles: A Double-Edged Sword in Market Expansion
The in vitro toxicology market operates under the close scrutiny of regulatory bodies like the FDA, EMA, and other regional authorities, which have established rigorous safety, efficacy, and reliability standards. These stringent regulatory frameworks are designed to ensure that toxicology tests accurately reflect human biological responses, minimizing the risk of adverse effects when products reach the market.
However, the complexity and cost associated with complying with these regulations can be significant. For instance, companies must invest heavily in documentation, compliance processes, and validation studies, which increases both time-to-market and overall costs. According to recent industry reports, the compliance costs for developing in vitro tests can account for up to 20-30% of the total project budget. This financial burden can deter smaller companies and startups from entering the market, limiting innovation and reducing competitive pressure that typically drives market growth.
Moreover, regulatory requirements often evolve, necessitating continuous investment in compliance and adaptation of new standards. This dynamic nature can lead to uncertainties, which further complicates strategic planning for companies in the in vitro toxicology market.
Technological Gaps: Limiting Comprehensive Analysis and Market Confidence
A significant challenge within the in vitro toxicology market is the current incapability of these tests to accurately determine autoimmunity and immunostimulation responses. Autoimmunity occurs when the immune system mistakenly attacks the body’s own cells, while immunostimulation refers to the activation of the immune system, potentially leading to inflammatory responses.
The inability to effectively measure these responses in vitro presents a substantial limitation for the market. This gap means that in vitro tests cannot fully replicate the complexities of the human immune system, leading to potential oversights in the safety profiling of new compounds. Consequently, there is a risk that products deemed safe in vitro could provoke adverse immune responses in vivo, undermining the credibility of in vitro methods.
This technological limitation can decrease the confidence of pharmaceutical companies and regulatory bodies in relying solely on in vitro methods, thereby reducing their adoption. The market’s growth is thus constrained by the need for more advanced technologies that can bridge these gaps and provide a more holistic safety assessment.
Technology Analysis
In 2023, Cell Culture Technology dominated the In Vitro Toxicology Market.
In 2023, Cell Culture Technology held a dominant market position in the By Technology segment of the In Vitro Toxicology Market. This segment's leading status can be attributed to its extensive application in drug development and toxicological research. Cell culture technology enables researchers to cultivate and manipulate cells in a controlled environment, facilitating detailed studies on cellular responses to toxic substances. This capability is crucial for developing safe pharmaceuticals and understanding toxicological mechanisms at a cellular level.
High Throughput Technology follows closely, driven by the demand for rapid and efficient testing methods. This technology allows for the simultaneous analysis of multiple samples, significantly accelerating the pace of toxicology studies and drug screening processes. Its integration with automation and data analysis tools further enhances its appeal in high-volume research settings.
Molecular Imaging technology is also gaining traction, providing non-invasive techniques to visualize and quantify biological processes in real time. This technology is essential for understanding the in vivo effects of toxic substances, offering insights that are not possible with traditional in vitro methods.
Lastly, OMICS Technology, encompassing genomics, proteomics, and metabolomics, is revolutionizing toxicology by enabling comprehensive analyses of biological molecules. This holistic approach provides a deeper understanding of how toxicants impact biological systems at a molecular level, paving the way for more targeted and effective interventions. Collectively, these technologies are propelling the in vitro toxicology market forward, each contributing unique strengths to the overall landscape.
Application Analysis
In 2023, Systemic Toxicology dominated the In Vitro Toxicology market applications.
In 2023, Systemic Toxicology held a dominant market position in the By Application segment of the In Vitro Toxicology Market. Systemic toxicology, which assesses the adverse effects of substances on the entire body, remains critical due to its broad application in pharmaceutical, chemical, and environmental testing. It is fundamental for identifying potential hazards and ensuring regulatory compliance, driving its strong market presence.
Dermal Toxicity, the evaluation of skin reactions to chemicals, follows closely. This segment gains traction from the cosmetic and dermatology sectors, emphasizing the need for safe topical products.
Endocrine Disruption focuses on substances that interfere with hormonal systems, an area of growing concern due to links with reproductive and developmental health issues. Regulatory pressures and rising awareness of endocrine disruptors in consumer products fuel demand in this segment.
Ocular Toxicity examines eye safety, crucial for ophthalmic drug development and safety testing of household and industrial chemicals. This segment benefits from advancements in predictive models and alternative testing methods.
Others encompass niche applications such as neurotoxicity and genotoxicity, addressing specific regulatory and safety needs across various industries. Collectively, these segments underline the diverse applications of in vitro toxicology, reflecting a comprehensive approach to safety assessment and regulatory adherence.
Method Analysis
Cellular Assays dominate in In Vitro Toxicology for detailed toxin insights.
In 2023, Cellular Assay held a dominant market position in the By Method segment of the In Vitro Toxicology Market. This dominance is driven by several critical factors, including its high sensitivity and specificity in detecting cellular responses to toxic substances. Cellular assays offer a comprehensive understanding of the cellular mechanisms and pathways affected by potential toxins, making them indispensable in early-stage drug development and safety assessment. The rise in demand for high-throughput screening and advancements in cell culture technologies further bolster the adoption of cellular assays.
Biochemical Assays follow closely, renowned for their utility in identifying biochemical changes in response to toxicants at the molecular level. These assays provide quantitative data on enzyme activities, receptor bindings, and metabolic transformations, crucial for elucidating toxic mechanisms and effects.
In-silico models, leveraging computational models and simulations, are gaining traction due to their cost-effectiveness and ability to predict toxicological outcomes without physical testing. These methods are particularly valuable for preliminary toxicity screenings and regulatory submissions, where rapid and extensive data analysis is required.
Ex-vivo assays, involving the use of tissues or organs maintained outside their original context, offer a middle ground between in vivo and in vitro studies. These assays provide more physiologically relevant data compared to traditional cell-based assays, enhancing the predictive accuracy of toxicological evaluations.
End-user Analysis
In 2023, The Pharmaceutical Industry dominated the In Vitro Toxicology Market.
In 2023, The Pharmaceutical Industry held a dominant market position in the By End-user segment of the In Vitro Toxicology Market. The pharmaceutical industry's leadership is attributed to its substantial investment in drug development and safety evaluation. With a stringent regulatory landscape, the demand for in vitro toxicology testing has surged as it offers a cost-effective and ethically sound alternative to traditional animal testing. Advanced in vitro models, such as organ-on-a-chip and 3D cell cultures, enable precise toxicological assessments, accelerating the drug development pipeline.
The cosmetics and household products sector is increasingly adopting in vitro toxicology to ensure consumer safety and comply with regulations like the EU's ban on animal testing for cosmetics. Academic institutes and research laboratories play a pivotal role in advancing toxicological research methodologies and providing critical data that underpin regulatory decisions.
The diagnostics segment leverages in vitro toxicology to enhance the accuracy and safety of diagnostic tools, directly impacting patient care. The chemicals industry, faced with stringent safety regulations, relies on these tests to evaluate the environmental and human health impacts of new chemicals.
Lastly, the food industry utilizes in vitro toxicology to assess food additives and contaminants, ensuring product safety and consumer health. Collectively, these end-users drive the growth and innovation within the in vitro toxicology market, reflecting a broader commitment to safety and ethical testing practices.
Key Market Segments
By Technology
- Cell Culture Technology
- High Throughput Technology
- Molecular Imaging
- OMICS Technology
By Application
- Systemic Toxicology
- Dermal Toxicity
- Endocrine Disruption
- Ocular Toxicity
- Others
By Method
- Cellular Assay
- Biochemical Assay
- In-silico
- Ex-vivo
By End-user
- Pharmaceutical Industry
- Cosmetics & Household Products
- Academic Institutes & Research Laboratories
- Diagnostics
- Chemicals Industry
- Food Industry
Growth Opportunity
Increasing Adoption of Alternative Testing Methods
The global in vitro toxicology market is poised for significant growth, driven by the increasing adoption of alternative testing methods. Traditional in vivo testing methods face growing scrutiny due to ethical concerns and regulatory pressures, particularly from regions with stringent animal welfare laws such as the European Union.
This shift is propelling the demand for in vitro methods, which offer a humane, efficient, and cost-effective alternative for toxicity testing. Advancements in cell culture technology, high-throughput screening, and organ-on-a-chip models are enhancing the accuracy and reliability of in vitro tests, making them an attractive choice for regulatory bodies and industry stakeholders. As a result, we anticipate a robust expansion in the market as these technologies gain further traction and regulatory acceptance.
Expansion of the Pharmaceutical and Biopharmaceutical Industry
Another critical driver for the in vitro toxicology market is the ongoing expansion of the pharmaceutical and biopharmaceutical industries. The continuous development of new drugs and biologics necessitates rigorous toxicity testing to ensure safety and efficacy. In vitro toxicology methods, with their ability to provide rapid and precise results, are well-positioned to meet this increasing demand.
Moreover, biopharmaceuticals, which often involve complex molecules and novel delivery mechanisms, require advanced testing methodologies that in vitro systems can provide. This industry's growth will undoubtedly catalyze the adoption of in vitro toxicology testing, presenting a significant market opportunity.
Latest Trends
Increasing Adoption of 3D Cell Culture Assays
The in vitro toxicology market is witnessing a significant shift with the increasing adoption of 3D cell culture assays. Traditional 2D cell cultures, while useful, fail to accurately replicate the complex environment of human tissues. In contrast, 3D cell cultures provide a more realistic model, enhancing the predictive accuracy of toxicological assessments.
This transition is driven by the growing demand for more reliable and ethically sound testing methods. As regulatory bodies and pharmaceutical companies strive for higher safety standards, 3D assays are becoming essential. The integration of these assays not only reduces the reliance on animal testing but also accelerates drug development processes by providing more relevant data on toxicity and efficacy.
The emergence of Artificial Intelligence and Machine Learning in Data Analysis
Artificial intelligence (AI) and machine learning (ML) are revolutionizing data analysis within the in vitro toxicology market. These technologies enable the processing of vast datasets with unprecedented speed and accuracy, identifying patterns and predicting outcomes that would be challenging for human analysts. AI-driven platforms are enhancing the interpretation of complex biological data, facilitating more precise toxicity predictions and risk assessments.
This technological advancement is crucial in managing the increasing volume of data generated by high-throughput screening methods and 3D cell culture assays. Companies leveraging AI and ML can gain a competitive edge by reducing the time and cost associated with toxicological testing while improving the reliability of their results.
Regional Analysis
North America leads the In Vitro Toxicology market with a 40% largest share.
The In Vitro Toxicology market exhibits notable regional variations driven by regulatory frameworks, technological advancements, and the presence of key industry players. North America stands as the dominant region, accounting for approximately 40% of the largest market share, propelled by stringent regulatory standards, advanced healthcare infrastructure, and significant investments in research and development. The United States, in particular, drives this dominance with robust funding for toxicology studies and the presence of major pharmaceutical and biotechnology firms.
Europe follows, contributing around 30% to the market, buoyed by supportive regulatory policies such as REACH (Registration, Evaluation, Authorisation, and Restriction of Chemicals) and the 7th Amendment to the EU Cosmetics Directive, which bolster the adoption of in vitro toxicology methods. The region’s emphasis on reducing animal testing further enhances market growth.
The Asia-Pacific region is emerging as a significant player, projected to witness the highest growth rate due to increasing R&D activities, favorable government initiatives, and rising awareness of alternative testing methods. Countries like China, India, and Japan are pivotal, with China’s expanding pharmaceutical sector and India’s burgeoning biotechnology industry leading the charge.
The Middle East & Africa and Latin America, though smaller in market share, are experiencing steady growth, driven by improving healthcare infrastructures and rising regulatory focus on ethical testing practices. Collectively, these regions represent a burgeoning opportunity for market expansion, underscored by global shifts toward sustainable and ethical scientific practices.
Key Regions and Countries
- North America
- The US
- Canada
- Rest of North America
- Europe
- Germany
- France
- The UK
- Spain
- Netherlands
- Russia
- Italy
- Rest of Europe
- Asia-Pacific
- China
- Japan
- Singapore
- Thailand
- South Korea
- Vietnam
- India
- New Zealand
- Rest of Asia Pacific
- Latin America
- Mexico
- Brazil
- Rest of Latin America
- Middle East & Africa
- Saudi Arabia
- South Africa
- UAE
- Rest of the Middle East & Africa
Key Players Analysis
In 2024, the global in vitro toxicology market is poised for substantial growth, driven by technological advancements and increasing regulatory scrutiny. Key players in this market exhibit a robust competitive landscape, marked by strategic innovations and expansions.
Charles River Laboratories International, Inc. continues to leverage its extensive preclinical service portfolio, emphasizing integrated solutions that streamline drug discovery processes. SGS S.A. maintains its market stronghold through comprehensive testing services and geographical expansion, particularly in emerging markets. Merck KGaA, with its cutting-edge biosafety testing products, remains pivotal in providing sophisticated in vitro assays.
Eurofins Scientific's strategic acquisitions and diversified service offerings bolster its market position, enhancing its capabilities in genomic and bioanalytical testing. Abbott Laboratories focuses on expanding its in vitro diagnostics segment, utilizing advanced technologies to improve toxicology testing efficiency. Laboratory Corporation of America Holdings stands out with its extensive clinical trial services and innovative toxicology solutions.
Evotec S.E. integrates artificial intelligence and high-throughput screening, driving innovation in predictive toxicology. Thermo Fisher Scientific, Inc. continues to dominate with its comprehensive laboratory equipment and consumables product portfolio. Quest Diagnostics Incorporated leverages its vast diagnostic network to offer reliable toxicology testing services.
Agilent Technologies, Inc.'s advancements in analytical instrumentation strengthen its competitive edge. Catalent, Inc. focuses on enhancing its cell and gene therapy capabilities, aligning with market trends. Danaher Corporation, Bio-Rad Laboratories, Inc., BioIVT, and Gentronix each contribute uniquely with specialized toxicology solutions, underpinning the market's dynamic and competitive nature.
Overall, these key players are instrumental in shaping the global in vitro toxicology market, driving innovation, and expanding their service offerings to meet the evolving needs of the pharmaceutical and biotechnology sectors.
Market Key Players
- Charles River Laboratories International, Inc.
- SGS S.A.
- Merck KGaA
- Eurofins Scientific
- Abbott Laboratories
- Laboratory Corporation of America Holdings
- Evotec SE
- Thermo Fisher Scientific, Inc.
- Quest Diagnostics Incorporated
- Agilent Technologies, Inc.
- Catalent, Inc.
- Danaher Corporation
- Bio-Rad Laboratories, Inc.
- BioIVT
- Gentronix
Recent Development
- In March 2023, Agilent Technologies, Inc. (US) expanded its capabilities by acquiring e-MSion (US). This acquisition aims to integrate e-MSion’s ExD cell into Agilent’s portfolio, enhancing their workflows and analytical solutions for biotherapeutic characterization and development.
- In March 2023, Dutch biotech company Toxys BV opened a sales office in New York and a production facility in Gaithersburg, Maryland. This expansion aims to support their business growth by enhancing their capacity to provide innovative in vitro toxicology solutions.
- In January 2023, Eurofins Scientific opened a new, state-of-the-art laboratory campus in Genome Valley, Hyderabad, India. This facility supports pharmaceutical and biotech companies by providing services in synthetic organic chemistry, analytical R&D, bioanalytical services, in vivo pharmacology, safety toxicology, and formulation R&D.
Report Scope
Report Features Description Market Value (2023) USD 31.1 Billion Forecast Revenue (2033) USD 87.6 Billion CAGR (2024-2032) 11.2% Base Year for Estimation 2023 Historic Period 2016-2023 Forecast Period 2024-2033 Report Coverage Revenue Forecast, Market Dynamics, COVID-19 Impact, Competitive Landscape, Recent Developments Segments Covered By Technology (Cell Culture Technology, High Throughput Technology, Molecular Imaging, OMICS Technology), By Application (Systemic Toxicology, Dermal Toxicity, Endocrine Disruption, Ocular Toxicity, Others), By Method (Cellular Assay, Biochemical Assay, In-silico, Ex-vivo), By End-user (Pharmaceutical Industry, Cosmetics & Household Products, Academic Institutes & Research Laboratories, Diagnostics, Chemicals Industry, Food Industry) Regional Analysis North America - The US, Canada, Rest of North America, Europe - Germany, France, The UK, Spain, Italy, Russia, Netherlands, Rest of Europe, Asia-Pacific - China, Japan, South Korea, India, New Zealand, Singapore, Thailand, Vietnam, Rest of Asia Pacific, Latin America - Brazil, Mexico, Rest of Latin America, Middle East & Africa - South Africa, Saudi Arabia, UAE, Rest of Middle East & Africa Competitive Landscape Charles River Laboratories International, Inc., SGS S.A., Merck KGaA, Eurofins Scientific, Abbott Laboratories, Laboratory Corporation of America Holdings, Evotec SE, Thermo Fisher Scientific, Inc., Quest Diagnostics Incorporated, Agilent Technologies, Inc., Catalent, Inc., Danaher Corporation, Bio-Rad Laboratories, Inc., BioIVT, Gentronix Customization Scope Customization for segments, region/country-level will be provided. Moreover, additional customization can be done based on the requirements. Purchase Options We have three licenses to opt for Single User License, Multi-User License (Up to 5 Users), Corporate Use License (Unlimited User and Printable PDF) -
- 1. Executive Summary
- 1.1. Definition
- 1.2. Taxonomy
- 1.3. Research Scope
- 1.4. Key Analysis
- 1.5. Key Findings by Major Segments
- 1.6. Top strategies by Major Players
- 2. Global In Vitro Toxicology Market Size, Share, Growth | CAGR of 11.2% Overview
- 2.1. In Vitro Toxicology Market Size, Share, Growth | CAGR of 11.2% Dynamics
- 2.1.1. Drivers
- 2.1.2. Opportunities
- 2.1.3. Restraints
- 2.1.4. Challenges
- 2.2. Macro-economic Factors
- 2.3. Regulatory Framework
- 2.4. Market Investment Feasibility Index
- 2.5. PEST Analysis
- 2.6. PORTER’S Five Force Analysis
- 2.7. Drivers & Restraints Impact Analysis
- 2.8. Industry Chain Analysis
- 2.9. Cost Structure Analysis
- 2.10. Marketing Strategy
- 2.11. Russia-Ukraine War Impact Analysis
- 2.12. Opportunity Map Analysis
- 2.13. Market Competition Scenario Analysis
- 2.14. Product Life Cycle Analysis
- 2.15. Opportunity Orbits
- 2.16. Manufacturer Intensity Map
- 2.17. Major Companies sales by Value & Volume
- 2.1. In Vitro Toxicology Market Size, Share, Growth | CAGR of 11.2% Dynamics
- 3. Global In Vitro Toxicology Market Size, Share, Growth | CAGR of 11.2% Analysis, Opportunity and Forecast, 2016-2032
- 3.1. Global In Vitro Toxicology Market Size, Share, Growth | CAGR of 11.2% Analysis, 2016-2021
- 3.2. Global In Vitro Toxicology Market Size, Share, Growth | CAGR of 11.2% Opportunity and Forecast, 2023-2032
- 3.3. Global In Vitro Toxicology Market Size, Share, Growth | CAGR of 11.2% Analysis, Opportunity and Forecast, By Technology, 2016-2032
- 3.3.1. Global In Vitro Toxicology Market Size, Share, Growth | CAGR of 11.2% Analysis by Technology: Introduction
- 3.3.2. Market Size Absolute $ Opportunity Analysis and Forecast, By Technology, 2016-2032
- 3.3.3. Cell Culture Technology
- 3.3.4. High Throughput Technology
- 3.3.5. Molecular Imaging
- 3.3.6. OMICS Technology
- 3.4. Global In Vitro Toxicology Market Size, Share, Growth | CAGR of 11.2% Analysis, Opportunity and Forecast, By Application, 2016-2032
- 3.4.1. Global In Vitro Toxicology Market Size, Share, Growth | CAGR of 11.2% Analysis by Application: Introduction
- 3.4.2. Market Size Absolute $ Opportunity Analysis and Forecast, By Application, 2016-2032
- 3.4.3. Systemic Toxicology
- 3.4.4. Dermal Toxicity
- 3.4.5. Endocrine Disruption
- 3.4.6. Occular Toxicity
- 3.4.7. Others
- 3.5. Global In Vitro Toxicology Market Size, Share, Growth | CAGR of 11.2% Analysis, Opportunity and Forecast, By Method, 2016-2032
- 3.5.1. Global In Vitro Toxicology Market Size, Share, Growth | CAGR of 11.2% Analysis by Method: Introduction
- 3.5.2. Market Size Absolute $ Opportunity Analysis and Forecast, By Method, 2016-2032
- 3.5.3. Cellular Assay
- 3.5.4. Biochemical Assay
- 3.5.5. In-silico
- 3.5.6. Ex-vivo
- 3.6. Global In Vitro Toxicology Market Size, Share, Growth | CAGR of 11.2% Analysis, Opportunity and Forecast, By End-user, 2016-2032
- 3.6.1. Global In Vitro Toxicology Market Size, Share, Growth | CAGR of 11.2% Analysis by End-user: Introduction
- 3.6.2. Market Size Absolute $ Opportunity Analysis and Forecast, By End-user, 2016-2032
- 3.6.3. Pharmaceutical Industry
- 3.6.4. Cosmetics & Household Products
- 3.6.5. Academic Institutes & Research Laboratories
- 3.6.6. Diagnostics
- 3.6.7. Chemicals Industry
- 3.6.8. Food Industry
- 4. North America In Vitro Toxicology Market Size, Share, Growth | CAGR of 11.2% Analysis, Opportunity and Forecast, 2016-2032
- 4.1. North America In Vitro Toxicology Market Size, Share, Growth | CAGR of 11.2% Analysis, 2016-2021
- 4.2. North America In Vitro Toxicology Market Size, Share, Growth | CAGR of 11.2% Opportunity and Forecast, 2023-2032
- 4.3. North America In Vitro Toxicology Market Size, Share, Growth | CAGR of 11.2% Analysis, Opportunity and Forecast, By Technology, 2016-2032
- 4.3.1. North America In Vitro Toxicology Market Size, Share, Growth | CAGR of 11.2% Analysis by Technology: Introduction
- 4.3.2. Market Size Absolute $ Opportunity Analysis and Forecast, By Technology, 2016-2032
- 4.3.3. Cell Culture Technology
- 4.3.4. High Throughput Technology
- 4.3.5. Molecular Imaging
- 4.3.6. OMICS Technology
- 4.4. North America In Vitro Toxicology Market Size, Share, Growth | CAGR of 11.2% Analysis, Opportunity and Forecast, By Application, 2016-2032
- 4.4.1. North America In Vitro Toxicology Market Size, Share, Growth | CAGR of 11.2% Analysis by Application: Introduction
- 4.4.2. Market Size Absolute $ Opportunity Analysis and Forecast, By Application, 2016-2032
- 4.4.3. Systemic Toxicology
- 4.4.4. Dermal Toxicity
- 4.4.5. Endocrine Disruption
- 4.4.6. Occular Toxicity
- 4.4.7. Others
- 4.5. North America In Vitro Toxicology Market Size, Share, Growth | CAGR of 11.2% Analysis, Opportunity and Forecast, By Method, 2016-2032
- 4.5.1. North America In Vitro Toxicology Market Size, Share, Growth | CAGR of 11.2% Analysis by Method: Introduction
- 4.5.2. Market Size Absolute $ Opportunity Analysis and Forecast, By Method, 2016-2032
- 4.5.3. Cellular Assay
- 4.5.4. Biochemical Assay
- 4.5.5. In-silico
- 4.5.6. Ex-vivo
- 4.6. North America In Vitro Toxicology Market Size, Share, Growth | CAGR of 11.2% Analysis, Opportunity and Forecast, By End-user, 2016-2032
- 4.6.1. North America In Vitro Toxicology Market Size, Share, Growth | CAGR of 11.2% Analysis by End-user: Introduction
- 4.6.2. Market Size Absolute $ Opportunity Analysis and Forecast, By End-user, 2016-2032
- 4.6.3. Pharmaceutical Industry
- 4.6.4. Cosmetics & Household Products
- 4.6.5. Academic Institutes & Research Laboratories
- 4.6.6. Diagnostics
- 4.6.7. Chemicals Industry
- 4.6.8. Food Industry
- 4.7. North America In Vitro Toxicology Market Size, Share, Growth | CAGR of 11.2% Analysis, Opportunity and Forecast, By Country , 2016-2032
- 4.7.1. North America In Vitro Toxicology Market Size, Share, Growth | CAGR of 11.2% Analysis by Country : Introduction
- 4.7.2. Market Size Absolute $ Opportunity Analysis and Forecast, Country , 2016-2032
- 4.7.2.1. The US
- 4.7.2.2. Canada
- 4.7.2.3. Mexico
- 5. Western Europe In Vitro Toxicology Market Size, Share, Growth | CAGR of 11.2% Analysis, Opportunity and Forecast, 2016-2032
- 5.1. Western Europe In Vitro Toxicology Market Size, Share, Growth | CAGR of 11.2% Analysis, 2016-2021
- 5.2. Western Europe In Vitro Toxicology Market Size, Share, Growth | CAGR of 11.2% Opportunity and Forecast, 2023-2032
- 5.3. Western Europe In Vitro Toxicology Market Size, Share, Growth | CAGR of 11.2% Analysis, Opportunity and Forecast, By Technology, 2016-2032
- 5.3.1. Western Europe In Vitro Toxicology Market Size, Share, Growth | CAGR of 11.2% Analysis by Technology: Introduction
- 5.3.2. Market Size Absolute $ Opportunity Analysis and Forecast, By Technology, 2016-2032
- 5.3.3. Cell Culture Technology
- 5.3.4. High Throughput Technology
- 5.3.5. Molecular Imaging
- 5.3.6. OMICS Technology
- 5.4. Western Europe In Vitro Toxicology Market Size, Share, Growth | CAGR of 11.2% Analysis, Opportunity and Forecast, By Application, 2016-2032
- 5.4.1. Western Europe In Vitro Toxicology Market Size, Share, Growth | CAGR of 11.2% Analysis by Application: Introduction
- 5.4.2. Market Size Absolute $ Opportunity Analysis and Forecast, By Application, 2016-2032
- 5.4.3. Systemic Toxicology
- 5.4.4. Dermal Toxicity
- 5.4.5. Endocrine Disruption
- 5.4.6. Occular Toxicity
- 5.4.7. Others
- 5.5. Western Europe In Vitro Toxicology Market Size, Share, Growth | CAGR of 11.2% Analysis, Opportunity and Forecast, By Method, 2016-2032
- 5.5.1. Western Europe In Vitro Toxicology Market Size, Share, Growth | CAGR of 11.2% Analysis by Method: Introduction
- 5.5.2. Market Size Absolute $ Opportunity Analysis and Forecast, By Method, 2016-2032
- 5.5.3. Cellular Assay
- 5.5.4. Biochemical Assay
- 5.5.5. In-silico
- 5.5.6. Ex-vivo
- 5.6. Western Europe In Vitro Toxicology Market Size, Share, Growth | CAGR of 11.2% Analysis, Opportunity and Forecast, By End-user, 2016-2032
- 5.6.1. Western Europe In Vitro Toxicology Market Size, Share, Growth | CAGR of 11.2% Analysis by End-user: Introduction
- 5.6.2. Market Size Absolute $ Opportunity Analysis and Forecast, By End-user, 2016-2032
- 5.6.3. Pharmaceutical Industry
- 5.6.4. Cosmetics & Household Products
- 5.6.5. Academic Institutes & Research Laboratories
- 5.6.6. Diagnostics
- 5.6.7. Chemicals Industry
- 5.6.8. Food Industry
- 5.7. Western Europe In Vitro Toxicology Market Size, Share, Growth | CAGR of 11.2% Analysis, Opportunity and Forecast, By Country , 2016-2032
- 5.7.1. Western Europe In Vitro Toxicology Market Size, Share, Growth | CAGR of 11.2% Analysis by Country : Introduction
- 5.7.2. Market Size Absolute $ Opportunity Analysis and Forecast, Country , 2016-2032
- 5.7.2.1. Germany
- 5.7.2.2. France
- 5.7.2.3. The UK
- 5.7.2.4. Spain
- 5.7.2.5. Italy
- 5.7.2.6. Portugal
- 5.7.2.7. Ireland
- 5.7.2.8. Austria
- 5.7.2.9. Switzerland
- 5.7.2.10. Benelux
- 5.7.2.11. Nordic
- 5.7.2.12. Rest of Western Europe
- 6. Eastern Europe In Vitro Toxicology Market Size, Share, Growth | CAGR of 11.2% Analysis, Opportunity and Forecast, 2016-2032
- 6.1. Eastern Europe In Vitro Toxicology Market Size, Share, Growth | CAGR of 11.2% Analysis, 2016-2021
- 6.2. Eastern Europe In Vitro Toxicology Market Size, Share, Growth | CAGR of 11.2% Opportunity and Forecast, 2023-2032
- 6.3. Eastern Europe In Vitro Toxicology Market Size, Share, Growth | CAGR of 11.2% Analysis, Opportunity and Forecast, By Technology, 2016-2032
- 6.3.1. Eastern Europe In Vitro Toxicology Market Size, Share, Growth | CAGR of 11.2% Analysis by Technology: Introduction
- 6.3.2. Market Size Absolute $ Opportunity Analysis and Forecast, By Technology, 2016-2032
- 6.3.3. Cell Culture Technology
- 6.3.4. High Throughput Technology
- 6.3.5. Molecular Imaging
- 6.3.6. OMICS Technology
- 6.4. Eastern Europe In Vitro Toxicology Market Size, Share, Growth | CAGR of 11.2% Analysis, Opportunity and Forecast, By Application, 2016-2032
- 6.4.1. Eastern Europe In Vitro Toxicology Market Size, Share, Growth | CAGR of 11.2% Analysis by Application: Introduction
- 6.4.2. Market Size Absolute $ Opportunity Analysis and Forecast, By Application, 2016-2032
- 6.4.3. Systemic Toxicology
- 6.4.4. Dermal Toxicity
- 6.4.5. Endocrine Disruption
- 6.4.6. Occular Toxicity
- 6.4.7. Others
- 6.5. Eastern Europe In Vitro Toxicology Market Size, Share, Growth | CAGR of 11.2% Analysis, Opportunity and Forecast, By Method, 2016-2032
- 6.5.1. Eastern Europe In Vitro Toxicology Market Size, Share, Growth | CAGR of 11.2% Analysis by Method: Introduction
- 6.5.2. Market Size Absolute $ Opportunity Analysis and Forecast, By Method, 2016-2032
- 6.5.3. Cellular Assay
- 6.5.4. Biochemical Assay
- 6.5.5. In-silico
- 6.5.6. Ex-vivo
- 6.6. Eastern Europe In Vitro Toxicology Market Size, Share, Growth | CAGR of 11.2% Analysis, Opportunity and Forecast, By End-user, 2016-2032
- 6.6.1. Eastern Europe In Vitro Toxicology Market Size, Share, Growth | CAGR of 11.2% Analysis by End-user: Introduction
- 6.6.2. Market Size Absolute $ Opportunity Analysis and Forecast, By End-user, 2016-2032
- 6.6.3. Pharmaceutical Industry
- 6.6.4. Cosmetics & Household Products
- 6.6.5. Academic Institutes & Research Laboratories
- 6.6.6. Diagnostics
- 6.6.7. Chemicals Industry
- 6.6.8. Food Industry
- 6.7. Eastern Europe In Vitro Toxicology Market Size, Share, Growth | CAGR of 11.2% Analysis, Opportunity and Forecast, By Country , 2016-2032
- 6.7.1. Eastern Europe In Vitro Toxicology Market Size, Share, Growth | CAGR of 11.2% Analysis by Country : Introduction
- 6.7.2. Market Size Absolute $ Opportunity Analysis and Forecast, Country , 2016-2032
- 6.7.2.1. Russia
- 6.7.2.2. Poland
- 6.7.2.3. The Czech Republic
- 6.7.2.4. Greece
- 6.7.2.5. Rest of Eastern Europe
- 7. APAC In Vitro Toxicology Market Size, Share, Growth | CAGR of 11.2% Analysis, Opportunity and Forecast, 2016-2032
- 7.1. APAC In Vitro Toxicology Market Size, Share, Growth | CAGR of 11.2% Analysis, 2016-2021
- 7.2. APAC In Vitro Toxicology Market Size, Share, Growth | CAGR of 11.2% Opportunity and Forecast, 2023-2032
- 7.3. APAC In Vitro Toxicology Market Size, Share, Growth | CAGR of 11.2% Analysis, Opportunity and Forecast, By Technology, 2016-2032
- 7.3.1. APAC In Vitro Toxicology Market Size, Share, Growth | CAGR of 11.2% Analysis by Technology: Introduction
- 7.3.2. Market Size Absolute $ Opportunity Analysis and Forecast, By Technology, 2016-2032
- 7.3.3. Cell Culture Technology
- 7.3.4. High Throughput Technology
- 7.3.5. Molecular Imaging
- 7.3.6. OMICS Technology
- 7.4. APAC In Vitro Toxicology Market Size, Share, Growth | CAGR of 11.2% Analysis, Opportunity and Forecast, By Application, 2016-2032
- 7.4.1. APAC In Vitro Toxicology Market Size, Share, Growth | CAGR of 11.2% Analysis by Application: Introduction
- 7.4.2. Market Size Absolute $ Opportunity Analysis and Forecast, By Application, 2016-2032
- 7.4.3. Systemic Toxicology
- 7.4.4. Dermal Toxicity
- 7.4.5. Endocrine Disruption
- 7.4.6. Occular Toxicity
- 7.4.7. Others
- 7.5. APAC In Vitro Toxicology Market Size, Share, Growth | CAGR of 11.2% Analysis, Opportunity and Forecast, By Method, 2016-2032
- 7.5.1. APAC In Vitro Toxicology Market Size, Share, Growth | CAGR of 11.2% Analysis by Method: Introduction
- 7.5.2. Market Size Absolute $ Opportunity Analysis and Forecast, By Method, 2016-2032
- 7.5.3. Cellular Assay
- 7.5.4. Biochemical Assay
- 7.5.5. In-silico
- 7.5.6. Ex-vivo
- 7.6. APAC In Vitro Toxicology Market Size, Share, Growth | CAGR of 11.2% Analysis, Opportunity and Forecast, By End-user, 2016-2032
- 7.6.1. APAC In Vitro Toxicology Market Size, Share, Growth | CAGR of 11.2% Analysis by End-user: Introduction
- 7.6.2. Market Size Absolute $ Opportunity Analysis and Forecast, By End-user, 2016-2032
- 7.6.3. Pharmaceutical Industry
- 7.6.4. Cosmetics & Household Products
- 7.6.5. Academic Institutes & Research Laboratories
- 7.6.6. Diagnostics
- 7.6.7. Chemicals Industry
- 7.6.8. Food Industry
- 7.7. APAC In Vitro Toxicology Market Size, Share, Growth | CAGR of 11.2% Analysis, Opportunity and Forecast, By Country , 2016-2032
- 7.7.1. APAC In Vitro Toxicology Market Size, Share, Growth | CAGR of 11.2% Analysis by Country : Introduction
- 7.7.2. Market Size Absolute $ Opportunity Analysis and Forecast, Country , 2016-2032
- 7.7.2.1. China
- 7.7.2.2. Japan
- 7.7.2.3. South Korea
- 7.7.2.4. India
- 7.7.2.5. Australia & New Zeland
- 7.7.2.6. Indonesia
- 7.7.2.7. Malaysia
- 7.7.2.8. Philippines
- 7.7.2.9. Singapore
- 7.7.2.10. Thailand
- 7.7.2.11. Vietnam
- 7.7.2.12. Rest of APAC
- 8. Latin America In Vitro Toxicology Market Size, Share, Growth | CAGR of 11.2% Analysis, Opportunity and Forecast, 2016-2032
- 8.1. Latin America In Vitro Toxicology Market Size, Share, Growth | CAGR of 11.2% Analysis, 2016-2021
- 8.2. Latin America In Vitro Toxicology Market Size, Share, Growth | CAGR of 11.2% Opportunity and Forecast, 2023-2032
- 8.3. Latin America In Vitro Toxicology Market Size, Share, Growth | CAGR of 11.2% Analysis, Opportunity and Forecast, By Technology, 2016-2032
- 8.3.1. Latin America In Vitro Toxicology Market Size, Share, Growth | CAGR of 11.2% Analysis by Technology: Introduction
- 8.3.2. Market Size Absolute $ Opportunity Analysis and Forecast, By Technology, 2016-2032
- 8.3.3. Cell Culture Technology
- 8.3.4. High Throughput Technology
- 8.3.5. Molecular Imaging
- 8.3.6. OMICS Technology
- 8.4. Latin America In Vitro Toxicology Market Size, Share, Growth | CAGR of 11.2% Analysis, Opportunity and Forecast, By Application, 2016-2032
- 8.4.1. Latin America In Vitro Toxicology Market Size, Share, Growth | CAGR of 11.2% Analysis by Application: Introduction
- 8.4.2. Market Size Absolute $ Opportunity Analysis and Forecast, By Application, 2016-2032
- 8.4.3. Systemic Toxicology
- 8.4.4. Dermal Toxicity
- 8.4.5. Endocrine Disruption
- 8.4.6. Occular Toxicity
- 8.4.7. Others
- 8.5. Latin America In Vitro Toxicology Market Size, Share, Growth | CAGR of 11.2% Analysis, Opportunity and Forecast, By Method, 2016-2032
- 8.5.1. Latin America In Vitro Toxicology Market Size, Share, Growth | CAGR of 11.2% Analysis by Method: Introduction
- 8.5.2. Market Size Absolute $ Opportunity Analysis and Forecast, By Method, 2016-2032
- 8.5.3. Cellular Assay
- 8.5.4. Biochemical Assay
- 8.5.5. In-silico
- 8.5.6. Ex-vivo
- 8.6. Latin America In Vitro Toxicology Market Size, Share, Growth | CAGR of 11.2% Analysis, Opportunity and Forecast, By End-user, 2016-2032
- 8.6.1. Latin America In Vitro Toxicology Market Size, Share, Growth | CAGR of 11.2% Analysis by End-user: Introduction
- 8.6.2. Market Size Absolute $ Opportunity Analysis and Forecast, By End-user, 2016-2032
- 8.6.3. Pharmaceutical Industry
- 8.6.4. Cosmetics & Household Products
- 8.6.5. Academic Institutes & Research Laboratories
- 8.6.6. Diagnostics
- 8.6.7. Chemicals Industry
- 8.6.8. Food Industry
- 8.7. Latin America In Vitro Toxicology Market Size, Share, Growth | CAGR of 11.2% Analysis, Opportunity and Forecast, By Country , 2016-2032
- 8.7.1. Latin America In Vitro Toxicology Market Size, Share, Growth | CAGR of 11.2% Analysis by Country : Introduction
- 8.7.2. Market Size Absolute $ Opportunity Analysis and Forecast, Country , 2016-2032
- 8.7.2.1. Brazil
- 8.7.2.2. Colombia
- 8.7.2.3. Chile
- 8.7.2.4. Argentina
- 8.7.2.5. Costa Rica
- 8.7.2.6. Rest of Latin America
- 9. Middle East & Africa In Vitro Toxicology Market Size, Share, Growth | CAGR of 11.2% Analysis, Opportunity and Forecast, 2016-2032
- 9.1. Middle East & Africa In Vitro Toxicology Market Size, Share, Growth | CAGR of 11.2% Analysis, 2016-2021
- 9.2. Middle East & Africa In Vitro Toxicology Market Size, Share, Growth | CAGR of 11.2% Opportunity and Forecast, 2023-2032
- 9.3. Middle East & Africa In Vitro Toxicology Market Size, Share, Growth | CAGR of 11.2% Analysis, Opportunity and Forecast, By Technology, 2016-2032
- 9.3.1. Middle East & Africa In Vitro Toxicology Market Size, Share, Growth | CAGR of 11.2% Analysis by Technology: Introduction
- 9.3.2. Market Size Absolute $ Opportunity Analysis and Forecast, By Technology, 2016-2032
- 9.3.3. Cell Culture Technology
- 9.3.4. High Throughput Technology
- 9.3.5. Molecular Imaging
- 9.3.6. OMICS Technology
- 9.4. Middle East & Africa In Vitro Toxicology Market Size, Share, Growth | CAGR of 11.2% Analysis, Opportunity and Forecast, By Application, 2016-2032
- 9.4.1. Middle East & Africa In Vitro Toxicology Market Size, Share, Growth | CAGR of 11.2% Analysis by Application: Introduction
- 9.4.2. Market Size Absolute $ Opportunity Analysis and Forecast, By Application, 2016-2032
- 9.4.3. Systemic Toxicology
- 9.4.4. Dermal Toxicity
- 9.4.5. Endocrine Disruption
- 9.4.6. Occular Toxicity
- 9.4.7. Others
- 9.5. Middle East & Africa In Vitro Toxicology Market Size, Share, Growth | CAGR of 11.2% Analysis, Opportunity and Forecast, By Method, 2016-2032
- 9.5.1. Middle East & Africa In Vitro Toxicology Market Size, Share, Growth | CAGR of 11.2% Analysis by Method: Introduction
- 9.5.2. Market Size Absolute $ Opportunity Analysis and Forecast, By Method, 2016-2032
- 9.5.3. Cellular Assay
- 9.5.4. Biochemical Assay
- 9.5.5. In-silico
- 9.5.6. Ex-vivo
- 9.6. Middle East & Africa In Vitro Toxicology Market Size, Share, Growth | CAGR of 11.2% Analysis, Opportunity and Forecast, By End-user, 2016-2032
- 9.6.1. Middle East & Africa In Vitro Toxicology Market Size, Share, Growth | CAGR of 11.2% Analysis by End-user: Introduction
- 9.6.2. Market Size Absolute $ Opportunity Analysis and Forecast, By End-user, 2016-2032
- 9.6.3. Pharmaceutical Industry
- 9.6.4. Cosmetics & Household Products
- 9.6.5. Academic Institutes & Research Laboratories
- 9.6.6. Diagnostics
- 9.6.7. Chemicals Industry
- 9.6.8. Food Industry
- 9.7. Middle East & Africa In Vitro Toxicology Market Size, Share, Growth | CAGR of 11.2% Analysis, Opportunity and Forecast, By Country , 2016-2032
- 9.7.1. Middle East & Africa In Vitro Toxicology Market Size, Share, Growth | CAGR of 11.2% Analysis by Country : Introduction
- 9.7.2. Market Size Absolute $ Opportunity Analysis and Forecast, Country , 2016-2032
- 9.7.2.1. Algeria
- 9.7.2.2. Egypt
- 9.7.2.3. Israel
- 9.7.2.4. Kuwait
- 9.7.2.5. Nigeria
- 9.7.2.6. Saudi Arabia
- 9.7.2.7. South Africa
- 9.7.2.8. Turkey
- 9.7.2.9. The UAE
- 9.7.2.10. Rest of MEA
- 10. Global In Vitro Toxicology Market Size, Share, Growth | CAGR of 11.2% Analysis, Opportunity and Forecast, By Region , 2016-2032
- 10.1. Global In Vitro Toxicology Market Size, Share, Growth | CAGR of 11.2% Analysis by Region : Introduction
- 10.2. Market Size Absolute $ Opportunity Analysis and Forecast, By Region , 2016-2032
- 10.2.1. North America
- 10.2.2. Western Europe
- 10.2.3. Eastern Europe
- 10.2.4. APAC
- 10.2.5. Latin America
- 10.2.6. Middle East & Africa
- 11. Global In Vitro Toxicology Market Size, Share, Growth | CAGR of 11.2% Competitive Landscape, Market Share Analysis, and Company Profiles
- 11.1. Market Share Analysis
- 11.2. Company Profiles
- 11.3. Charles River Laboratories International, Inc.
- 11.3.1. Company Overview
- 11.3.2. Financial Highlights
- 11.3.3. Product Portfolio
- 11.3.4. SWOT Analysis
- 11.3.5. Key Strategies and Developments
- 11.4. SGS S.A.
- 11.4.1. Company Overview
- 11.4.2. Financial Highlights
- 11.4.3. Product Portfolio
- 11.4.4. SWOT Analysis
- 11.4.5. Key Strategies and Developments
- 11.5. Merck KGaA
- 11.5.1. Company Overview
- 11.5.2. Financial Highlights
- 11.5.3. Product Portfolio
- 11.5.4. SWOT Analysis
- 11.5.5. Key Strategies and Developments
- 11.6. Eurofins Scientific
- 11.6.1. Company Overview
- 11.6.2. Financial Highlights
- 11.6.3. Product Portfolio
- 11.6.4. SWOT Analysis
- 11.6.5. Key Strategies and Developments
- 11.7. Abbott Laboratories
- 11.7.1. Company Overview
- 11.7.2. Financial Highlights
- 11.7.3. Product Portfolio
- 11.7.4. SWOT Analysis
- 11.7.5. Key Strategies and Developments
- 11.8. Laboratory Corporation of America Holdings
- 11.8.1. Company Overview
- 11.8.2. Financial Highlights
- 11.8.3. Product Portfolio
- 11.8.4. SWOT Analysis
- 11.8.5. Key Strategies and Developments
- 11.9. Evotec SE
- 11.9.1. Company Overview
- 11.9.2. Financial Highlights
- 11.9.3. Product Portfolio
- 11.9.4. SWOT Analysis
- 11.9.5. Key Strategies and Developments
- 11.10. Thermo Fisher Scientific, Inc.
- 11.10.1. Company Overview
- 11.10.2. Financial Highlights
- 11.10.3. Product Portfolio
- 11.10.4. SWOT Analysis
- 11.10.5. Key Strategies and Developments
- 11.11. Quest Diagnostics Incorporated
- 11.11.1. Company Overview
- 11.11.2. Financial Highlights
- 11.11.3. Product Portfolio
- 11.11.4. SWOT Analysis
- 11.11.5. Key Strategies and Developments
- 11.12. Agilent Technologies, Inc.
- 11.12.1. Company Overview
- 11.12.2. Financial Highlights
- 11.12.3. Product Portfolio
- 11.12.4. SWOT Analysis
- 11.12.5. Key Strategies and Developments
- 11.13.1. Company Overview
- 11.13.2. Financial Highlights
- 11.13.3. Product Portfolio
- 11.13.4. SWOT Analysis
- 11.13.5. Key Strategies and Developments
- 11.14. Catalent, Inc.
- 11.14.1. Company Overview
- 11.14.2. Financial Highlights
- 11.14.3. Product Portfolio
- 11.14.4. SWOT Analysis
- 11.14.5. Key Strategies and Developments
- 11.15. Bio-Rad Laboratories, Inc.
- 11.15.1. Company Overview
- 11.15.2. Financial Highlights
- 11.15.3. Product Portfolio
- 11.15.4. SWOT Analysis
- 11.15.5. Key Strategies and Developments
- 11.16. BioIVT
- 11.16.1. Company Overview
- 11.16.2. Financial Highlights
- 11.16.3. Product Portfolio
- 11.16.4. SWOT Analysis
- 11.16.5. Key Strategies and Developments
- 11.17. Gentronix
- 11.17.1. Company Overview
- 11.17.2. Financial Highlights
- 11.17.3. Product Portfolio
- 11.17.4. SWOT Analysis
- 11.17.5. Key Strategies and Developments
- 12. Assumptions and Acronyms
- 13. Research Methodology
- 14. Contact
"
- List of Figures
- "
- Figure 1: Global In Vitro Toxicology Market Size, Share, Growth | CAGR of 11.2% Revenue (US$ Mn) Market Share by Technology in 2022
- Figure 2: Global In Vitro Toxicology Market Size, Share, Growth | CAGR of 11.2% Market Attractiveness Analysis by Technology, 2016-2032
- Figure 3: Global In Vitro Toxicology Market Size, Share, Growth | CAGR of 11.2% Revenue (US$ Mn) Market Share by Applicationin 2022
- Figure 4: Global In Vitro Toxicology Market Size, Share, Growth | CAGR of 11.2% Market Attractiveness Analysis by Application, 2016-2032
- Figure 5: Global In Vitro Toxicology Market Size, Share, Growth | CAGR of 11.2% Revenue (US$ Mn) Market Share by Methodin 2022
- Figure 6: Global In Vitro Toxicology Market Size, Share, Growth | CAGR of 11.2% Market Attractiveness Analysis by Method, 2016-2032
- Figure 7: Global In Vitro Toxicology Market Size, Share, Growth | CAGR of 11.2% Revenue (US$ Mn) Market Share by End-userin 2022
- Figure 8: Global In Vitro Toxicology Market Size, Share, Growth | CAGR of 11.2% Market Attractiveness Analysis by End-user, 2016-2032
- Figure 9: Global In Vitro Toxicology Market Size, Share, Growth | CAGR of 11.2% Revenue (US$ Mn) Market Share by Region in 2022
- Figure 10: Global In Vitro Toxicology Market Size, Share, Growth | CAGR of 11.2% Market Attractiveness Analysis by Region, 2016-2032
- Figure 11: Global In Vitro Toxicology Market Size, Share, Growth | CAGR of 11.2% Market Revenue (US$ Mn) (2016-2032)
- Figure 12: Global In Vitro Toxicology Market Size, Share, Growth | CAGR of 11.2% Market Revenue (US$ Mn) Comparison by Region (2016-2032)
- Figure 13: Global In Vitro Toxicology Market Size, Share, Growth | CAGR of 11.2% Market Revenue (US$ Mn) Comparison by Technology (2016-2032)
- Figure 14: Global In Vitro Toxicology Market Size, Share, Growth | CAGR of 11.2% Market Revenue (US$ Mn) Comparison by Application (2016-2032)
- Figure 15: Global In Vitro Toxicology Market Size, Share, Growth | CAGR of 11.2% Market Revenue (US$ Mn) Comparison by Method (2016-2032)
- Figure 16: Global In Vitro Toxicology Market Size, Share, Growth | CAGR of 11.2% Market Revenue (US$ Mn) Comparison by End-user (2016-2032)
- Figure 17: Global In Vitro Toxicology Market Size, Share, Growth | CAGR of 11.2% Market Y-o-Y Growth Rate Comparison by Region (2016-2032)
- Figure 18: Global In Vitro Toxicology Market Size, Share, Growth | CAGR of 11.2% Market Y-o-Y Growth Rate Comparison by Technology (2016-2032)
- Figure 19: Global In Vitro Toxicology Market Size, Share, Growth | CAGR of 11.2% Market Y-o-Y Growth Rate Comparison by Application (2016-2032)
- Figure 20: Global In Vitro Toxicology Market Size, Share, Growth | CAGR of 11.2% Market Y-o-Y Growth Rate Comparison by Method (2016-2032)
- Figure 21: Global In Vitro Toxicology Market Size, Share, Growth | CAGR of 11.2% Market Y-o-Y Growth Rate Comparison by End-user (2016-2032)
- Figure 22: Global In Vitro Toxicology Market Size, Share, Growth | CAGR of 11.2% Market Share Comparison by Region (2016-2032)
- Figure 23: Global In Vitro Toxicology Market Size, Share, Growth | CAGR of 11.2% Market Share Comparison by Technology (2016-2032)
- Figure 24: Global In Vitro Toxicology Market Size, Share, Growth | CAGR of 11.2% Market Share Comparison by Application (2016-2032)
- Figure 25: Global In Vitro Toxicology Market Size, Share, Growth | CAGR of 11.2% Market Share Comparison by Method (2016-2032)
- Figure 26: Global In Vitro Toxicology Market Size, Share, Growth | CAGR of 11.2% Market Share Comparison by End-user (2016-2032)
- Figure 27: North America In Vitro Toxicology Market Size, Share, Growth | CAGR of 11.2% Revenue (US$ Mn) Market Share by Technologyin 2022
- Figure 28: North America In Vitro Toxicology Market Size, Share, Growth | CAGR of 11.2% Market Attractiveness Analysis by Technology, 2016-2032
- Figure 29: North America In Vitro Toxicology Market Size, Share, Growth | CAGR of 11.2% Revenue (US$ Mn) Market Share by Applicationin 2022
- Figure 30: North America In Vitro Toxicology Market Size, Share, Growth | CAGR of 11.2% Market Attractiveness Analysis by Application, 2016-2032
- Figure 31: North America In Vitro Toxicology Market Size, Share, Growth | CAGR of 11.2% Revenue (US$ Mn) Market Share by Methodin 2022
- Figure 32: North America In Vitro Toxicology Market Size, Share, Growth | CAGR of 11.2% Market Attractiveness Analysis by Method, 2016-2032
- Figure 33: North America In Vitro Toxicology Market Size, Share, Growth | CAGR of 11.2% Revenue (US$ Mn) Market Share by End-userin 2022
- Figure 34: North America In Vitro Toxicology Market Size, Share, Growth | CAGR of 11.2% Market Attractiveness Analysis by End-user, 2016-2032
- Figure 35: North America In Vitro Toxicology Market Size, Share, Growth | CAGR of 11.2% Revenue (US$ Mn) Market Share by Country in 2022
- Figure 36: North America In Vitro Toxicology Market Size, Share, Growth | CAGR of 11.2% Market Attractiveness Analysis by Country, 2016-2032
- Figure 37: North America In Vitro Toxicology Market Size, Share, Growth | CAGR of 11.2% Market Revenue (US$ Mn) (2016-2032)
- Figure 38: North America In Vitro Toxicology Market Size, Share, Growth | CAGR of 11.2% Market Revenue (US$ Mn) Comparison by Country (2016-2032)
- Figure 39: North America In Vitro Toxicology Market Size, Share, Growth | CAGR of 11.2% Market Revenue (US$ Mn) Comparison by Technology (2016-2032)
- Figure 40: North America In Vitro Toxicology Market Size, Share, Growth | CAGR of 11.2% Market Revenue (US$ Mn) Comparison by Application (2016-2032)
- Figure 41: North America In Vitro Toxicology Market Size, Share, Growth | CAGR of 11.2% Market Revenue (US$ Mn) Comparison by Method (2016-2032)
- Figure 42: North America In Vitro Toxicology Market Size, Share, Growth | CAGR of 11.2% Market Revenue (US$ Mn) Comparison by End-user (2016-2032)
- Figure 43: North America In Vitro Toxicology Market Size, Share, Growth | CAGR of 11.2% Market Y-o-Y Growth Rate Comparison by Country (2016-2032)
- Figure 44: North America In Vitro Toxicology Market Size, Share, Growth | CAGR of 11.2% Market Y-o-Y Growth Rate Comparison by Technology (2016-2032)
- Figure 45: North America In Vitro Toxicology Market Size, Share, Growth | CAGR of 11.2% Market Y-o-Y Growth Rate Comparison by Application (2016-2032)
- Figure 46: North America In Vitro Toxicology Market Size, Share, Growth | CAGR of 11.2% Market Y-o-Y Growth Rate Comparison by Method (2016-2032)
- Figure 47: North America In Vitro Toxicology Market Size, Share, Growth | CAGR of 11.2% Market Y-o-Y Growth Rate Comparison by End-user (2016-2032)
- Figure 48: North America In Vitro Toxicology Market Size, Share, Growth | CAGR of 11.2% Market Share Comparison by Country (2016-2032)
- Figure 49: North America In Vitro Toxicology Market Size, Share, Growth | CAGR of 11.2% Market Share Comparison by Technology (2016-2032)
- Figure 50: North America In Vitro Toxicology Market Size, Share, Growth | CAGR of 11.2% Market Share Comparison by Application (2016-2032)
- Figure 51: North America In Vitro Toxicology Market Size, Share, Growth | CAGR of 11.2% Market Share Comparison by Method (2016-2032)
- Figure 52: North America In Vitro Toxicology Market Size, Share, Growth | CAGR of 11.2% Market Share Comparison by End-user (2016-2032)
- Figure 53: Western Europe In Vitro Toxicology Market Size, Share, Growth | CAGR of 11.2% Revenue (US$ Mn) Market Share by Technologyin 2022
- Figure 54: Western Europe In Vitro Toxicology Market Size, Share, Growth | CAGR of 11.2% Market Attractiveness Analysis by Technology, 2016-2032
- Figure 55: Western Europe In Vitro Toxicology Market Size, Share, Growth | CAGR of 11.2% Revenue (US$ Mn) Market Share by Applicationin 2022
- Figure 56: Western Europe In Vitro Toxicology Market Size, Share, Growth | CAGR of 11.2% Market Attractiveness Analysis by Application, 2016-2032
- Figure 57: Western Europe In Vitro Toxicology Market Size, Share, Growth | CAGR of 11.2% Revenue (US$ Mn) Market Share by Methodin 2022
- Figure 58: Western Europe In Vitro Toxicology Market Size, Share, Growth | CAGR of 11.2% Market Attractiveness Analysis by Method, 2016-2032
- Figure 59: Western Europe In Vitro Toxicology Market Size, Share, Growth | CAGR of 11.2% Revenue (US$ Mn) Market Share by End-userin 2022
- Figure 60: Western Europe In Vitro Toxicology Market Size, Share, Growth | CAGR of 11.2% Market Attractiveness Analysis by End-user, 2016-2032
- Figure 61: Western Europe In Vitro Toxicology Market Size, Share, Growth | CAGR of 11.2% Revenue (US$ Mn) Market Share by Country in 2022
- Figure 62: Western Europe In Vitro Toxicology Market Size, Share, Growth | CAGR of 11.2% Market Attractiveness Analysis by Country, 2016-2032
- Figure 63: Western Europe In Vitro Toxicology Market Size, Share, Growth | CAGR of 11.2% Market Revenue (US$ Mn) (2016-2032)
- Figure 64: Western Europe In Vitro Toxicology Market Size, Share, Growth | CAGR of 11.2% Market Revenue (US$ Mn) Comparison by Country (2016-2032)
- Figure 65: Western Europe In Vitro Toxicology Market Size, Share, Growth | CAGR of 11.2% Market Revenue (US$ Mn) Comparison by Technology (2016-2032)
- Figure 66: Western Europe In Vitro Toxicology Market Size, Share, Growth | CAGR of 11.2% Market Revenue (US$ Mn) Comparison by Application (2016-2032)
- Figure 67: Western Europe In Vitro Toxicology Market Size, Share, Growth | CAGR of 11.2% Market Revenue (US$ Mn) Comparison by Method (2016-2032)
- Figure 68: Western Europe In Vitro Toxicology Market Size, Share, Growth | CAGR of 11.2% Market Revenue (US$ Mn) Comparison by End-user (2016-2032)
- Figure 69: Western Europe In Vitro Toxicology Market Size, Share, Growth | CAGR of 11.2% Market Y-o-Y Growth Rate Comparison by Country (2016-2032)
- Figure 70: Western Europe In Vitro Toxicology Market Size, Share, Growth | CAGR of 11.2% Market Y-o-Y Growth Rate Comparison by Technology (2016-2032)
- Figure 71: Western Europe In Vitro Toxicology Market Size, Share, Growth | CAGR of 11.2% Market Y-o-Y Growth Rate Comparison by Application (2016-2032)
- Figure 72: Western Europe In Vitro Toxicology Market Size, Share, Growth | CAGR of 11.2% Market Y-o-Y Growth Rate Comparison by Method (2016-2032)
- Figure 73: Western Europe In Vitro Toxicology Market Size, Share, Growth | CAGR of 11.2% Market Y-o-Y Growth Rate Comparison by End-user (2016-2032)
- Figure 74: Western Europe In Vitro Toxicology Market Size, Share, Growth | CAGR of 11.2% Market Share Comparison by Country (2016-2032)
- Figure 75: Western Europe In Vitro Toxicology Market Size, Share, Growth | CAGR of 11.2% Market Share Comparison by Technology (2016-2032)
- Figure 76: Western Europe In Vitro Toxicology Market Size, Share, Growth | CAGR of 11.2% Market Share Comparison by Application (2016-2032)
- Figure 77: Western Europe In Vitro Toxicology Market Size, Share, Growth | CAGR of 11.2% Market Share Comparison by Method (2016-2032)
- Figure 78: Western Europe In Vitro Toxicology Market Size, Share, Growth | CAGR of 11.2% Market Share Comparison by End-user (2016-2032)
- Figure 79: Eastern Europe In Vitro Toxicology Market Size, Share, Growth | CAGR of 11.2% Revenue (US$ Mn) Market Share by Technologyin 2022
- Figure 80: Eastern Europe In Vitro Toxicology Market Size, Share, Growth | CAGR of 11.2% Market Attractiveness Analysis by Technology, 2016-2032
- Figure 81: Eastern Europe In Vitro Toxicology Market Size, Share, Growth | CAGR of 11.2% Revenue (US$ Mn) Market Share by Applicationin 2022
- Figure 82: Eastern Europe In Vitro Toxicology Market Size, Share, Growth | CAGR of 11.2% Market Attractiveness Analysis by Application, 2016-2032
- Figure 83: Eastern Europe In Vitro Toxicology Market Size, Share, Growth | CAGR of 11.2% Revenue (US$ Mn) Market Share by Methodin 2022
- Figure 84: Eastern Europe In Vitro Toxicology Market Size, Share, Growth | CAGR of 11.2% Market Attractiveness Analysis by Method, 2016-2032
- Figure 85: Eastern Europe In Vitro Toxicology Market Size, Share, Growth | CAGR of 11.2% Revenue (US$ Mn) Market Share by End-userin 2022
- Figure 86: Eastern Europe In Vitro Toxicology Market Size, Share, Growth | CAGR of 11.2% Market Attractiveness Analysis by End-user, 2016-2032
- Figure 87: Eastern Europe In Vitro Toxicology Market Size, Share, Growth | CAGR of 11.2% Revenue (US$ Mn) Market Share by Country in 2022
- Figure 88: Eastern Europe In Vitro Toxicology Market Size, Share, Growth | CAGR of 11.2% Market Attractiveness Analysis by Country, 2016-2032
- Figure 89: Eastern Europe In Vitro Toxicology Market Size, Share, Growth | CAGR of 11.2% Market Revenue (US$ Mn) (2016-2032)
- Figure 90: Eastern Europe In Vitro Toxicology Market Size, Share, Growth | CAGR of 11.2% Market Revenue (US$ Mn) Comparison by Country (2016-2032)
- Figure 91: Eastern Europe In Vitro Toxicology Market Size, Share, Growth | CAGR of 11.2% Market Revenue (US$ Mn) Comparison by Technology (2016-2032)
- Figure 92: Eastern Europe In Vitro Toxicology Market Size, Share, Growth | CAGR of 11.2% Market Revenue (US$ Mn) Comparison by Application (2016-2032)
- Figure 93: Eastern Europe In Vitro Toxicology Market Size, Share, Growth | CAGR of 11.2% Market Revenue (US$ Mn) Comparison by Method (2016-2032)
- Figure 94: Eastern Europe In Vitro Toxicology Market Size, Share, Growth | CAGR of 11.2% Market Revenue (US$ Mn) Comparison by End-user (2016-2032)
- Figure 95: Eastern Europe In Vitro Toxicology Market Size, Share, Growth | CAGR of 11.2% Market Y-o-Y Growth Rate Comparison by Country (2016-2032)
- Figure 96: Eastern Europe In Vitro Toxicology Market Size, Share, Growth | CAGR of 11.2% Market Y-o-Y Growth Rate Comparison by Technology (2016-2032)
- Figure 97: Eastern Europe In Vitro Toxicology Market Size, Share, Growth | CAGR of 11.2% Market Y-o-Y Growth Rate Comparison by Application (2016-2032)
- Figure 98: Eastern Europe In Vitro Toxicology Market Size, Share, Growth | CAGR of 11.2% Market Y-o-Y Growth Rate Comparison by Method (2016-2032)
- Figure 99: Eastern Europe In Vitro Toxicology Market Size, Share, Growth | CAGR of 11.2% Market Y-o-Y Growth Rate Comparison by End-user (2016-2032)
- Figure 100: Eastern Europe In Vitro Toxicology Market Size, Share, Growth | CAGR of 11.2% Market Share Comparison by Country (2016-2032)
- Figure 101: Eastern Europe In Vitro Toxicology Market Size, Share, Growth | CAGR of 11.2% Market Share Comparison by Technology (2016-2032)
- Figure 102: Eastern Europe In Vitro Toxicology Market Size, Share, Growth | CAGR of 11.2% Market Share Comparison by Application (2016-2032)
- Figure 103: Eastern Europe In Vitro Toxicology Market Size, Share, Growth | CAGR of 11.2% Market Share Comparison by Method (2016-2032)
- Figure 104: Eastern Europe In Vitro Toxicology Market Size, Share, Growth | CAGR of 11.2% Market Share Comparison by End-user (2016-2032)
- Figure 105: APAC In Vitro Toxicology Market Size, Share, Growth | CAGR of 11.2% Revenue (US$ Mn) Market Share by Technologyin 2022
- Figure 106: APAC In Vitro Toxicology Market Size, Share, Growth | CAGR of 11.2% Market Attractiveness Analysis by Technology, 2016-2032
- Figure 107: APAC In Vitro Toxicology Market Size, Share, Growth | CAGR of 11.2% Revenue (US$ Mn) Market Share by Applicationin 2022
- Figure 108: APAC In Vitro Toxicology Market Size, Share, Growth | CAGR of 11.2% Market Attractiveness Analysis by Application, 2016-2032
- Figure 109: APAC In Vitro Toxicology Market Size, Share, Growth | CAGR of 11.2% Revenue (US$ Mn) Market Share by Methodin 2022
- Figure 110: APAC In Vitro Toxicology Market Size, Share, Growth | CAGR of 11.2% Market Attractiveness Analysis by Method, 2016-2032
- Figure 111: APAC In Vitro Toxicology Market Size, Share, Growth | CAGR of 11.2% Revenue (US$ Mn) Market Share by End-userin 2022
- Figure 112: APAC In Vitro Toxicology Market Size, Share, Growth | CAGR of 11.2% Market Attractiveness Analysis by End-user, 2016-2032
- Figure 113: APAC In Vitro Toxicology Market Size, Share, Growth | CAGR of 11.2% Revenue (US$ Mn) Market Share by Country in 2022
- Figure 114: APAC In Vitro Toxicology Market Size, Share, Growth | CAGR of 11.2% Market Attractiveness Analysis by Country, 2016-2032
- Figure 115: APAC In Vitro Toxicology Market Size, Share, Growth | CAGR of 11.2% Market Revenue (US$ Mn) (2016-2032)
- Figure 116: APAC In Vitro Toxicology Market Size, Share, Growth | CAGR of 11.2% Market Revenue (US$ Mn) Comparison by Country (2016-2032)
- Figure 117: APAC In Vitro Toxicology Market Size, Share, Growth | CAGR of 11.2% Market Revenue (US$ Mn) Comparison by Technology (2016-2032)
- Figure 118: APAC In Vitro Toxicology Market Size, Share, Growth | CAGR of 11.2% Market Revenue (US$ Mn) Comparison by Application (2016-2032)
- Figure 119: APAC In Vitro Toxicology Market Size, Share, Growth | CAGR of 11.2% Market Revenue (US$ Mn) Comparison by Method (2016-2032)
- Figure 120: APAC In Vitro Toxicology Market Size, Share, Growth | CAGR of 11.2% Market Revenue (US$ Mn) Comparison by End-user (2016-2032)
- Figure 121: APAC In Vitro Toxicology Market Size, Share, Growth | CAGR of 11.2% Market Y-o-Y Growth Rate Comparison by Country (2016-2032)
- Figure 122: APAC In Vitro Toxicology Market Size, Share, Growth | CAGR of 11.2% Market Y-o-Y Growth Rate Comparison by Technology (2016-2032)
- Figure 123: APAC In Vitro Toxicology Market Size, Share, Growth | CAGR of 11.2% Market Y-o-Y Growth Rate Comparison by Application (2016-2032)
- Figure 124: APAC In Vitro Toxicology Market Size, Share, Growth | CAGR of 11.2% Market Y-o-Y Growth Rate Comparison by Method (2016-2032)
- Figure 125: APAC In Vitro Toxicology Market Size, Share, Growth | CAGR of 11.2% Market Y-o-Y Growth Rate Comparison by End-user (2016-2032)
- Figure 126: APAC In Vitro Toxicology Market Size, Share, Growth | CAGR of 11.2% Market Share Comparison by Country (2016-2032)
- Figure 127: APAC In Vitro Toxicology Market Size, Share, Growth | CAGR of 11.2% Market Share Comparison by Technology (2016-2032)
- Figure 128: APAC In Vitro Toxicology Market Size, Share, Growth | CAGR of 11.2% Market Share Comparison by Application (2016-2032)
- Figure 129: APAC In Vitro Toxicology Market Size, Share, Growth | CAGR of 11.2% Market Share Comparison by Method (2016-2032)
- Figure 130: APAC In Vitro Toxicology Market Size, Share, Growth | CAGR of 11.2% Market Share Comparison by End-user (2016-2032)
- Figure 131: Latin America In Vitro Toxicology Market Size, Share, Growth | CAGR of 11.2% Revenue (US$ Mn) Market Share by Technologyin 2022
- Figure 132: Latin America In Vitro Toxicology Market Size, Share, Growth | CAGR of 11.2% Market Attractiveness Analysis by Technology, 2016-2032
- Figure 133: Latin America In Vitro Toxicology Market Size, Share, Growth | CAGR of 11.2% Revenue (US$ Mn) Market Share by Applicationin 2022
- Figure 134: Latin America In Vitro Toxicology Market Size, Share, Growth | CAGR of 11.2% Market Attractiveness Analysis by Application, 2016-2032
- Figure 135: Latin America In Vitro Toxicology Market Size, Share, Growth | CAGR of 11.2% Revenue (US$ Mn) Market Share by Methodin 2022
- Figure 136: Latin America In Vitro Toxicology Market Size, Share, Growth | CAGR of 11.2% Market Attractiveness Analysis by Method, 2016-2032
- Figure 137: Latin America In Vitro Toxicology Market Size, Share, Growth | CAGR of 11.2% Revenue (US$ Mn) Market Share by End-userin 2022
- Figure 138: Latin America In Vitro Toxicology Market Size, Share, Growth | CAGR of 11.2% Market Attractiveness Analysis by End-user, 2016-2032
- Figure 139: Latin America In Vitro Toxicology Market Size, Share, Growth | CAGR of 11.2% Revenue (US$ Mn) Market Share by Country in 2022
- Figure 140: Latin America In Vitro Toxicology Market Size, Share, Growth | CAGR of 11.2% Market Attractiveness Analysis by Country, 2016-2032
- Figure 141: Latin America In Vitro Toxicology Market Size, Share, Growth | CAGR of 11.2% Market Revenue (US$ Mn) (2016-2032)
- Figure 142: Latin America In Vitro Toxicology Market Size, Share, Growth | CAGR of 11.2% Market Revenue (US$ Mn) Comparison by Country (2016-2032)
- Figure 143: Latin America In Vitro Toxicology Market Size, Share, Growth | CAGR of 11.2% Market Revenue (US$ Mn) Comparison by Technology (2016-2032)
- Figure 144: Latin America In Vitro Toxicology Market Size, Share, Growth | CAGR of 11.2% Market Revenue (US$ Mn) Comparison by Application (2016-2032)
- Figure 145: Latin America In Vitro Toxicology Market Size, Share, Growth | CAGR of 11.2% Market Revenue (US$ Mn) Comparison by Method (2016-2032)
- Figure 146: Latin America In Vitro Toxicology Market Size, Share, Growth | CAGR of 11.2% Market Revenue (US$ Mn) Comparison by End-user (2016-2032)
- Figure 147: Latin America In Vitro Toxicology Market Size, Share, Growth | CAGR of 11.2% Market Y-o-Y Growth Rate Comparison by Country (2016-2032)
- Figure 148: Latin America In Vitro Toxicology Market Size, Share, Growth | CAGR of 11.2% Market Y-o-Y Growth Rate Comparison by Technology (2016-2032)
- Figure 149: Latin America In Vitro Toxicology Market Size, Share, Growth | CAGR of 11.2% Market Y-o-Y Growth Rate Comparison by Application (2016-2032)
- Figure 150: Latin America In Vitro Toxicology Market Size, Share, Growth | CAGR of 11.2% Market Y-o-Y Growth Rate Comparison by Method (2016-2032)
- Figure 151: Latin America In Vitro Toxicology Market Size, Share, Growth | CAGR of 11.2% Market Y-o-Y Growth Rate Comparison by End-user (2016-2032)
- Figure 152: Latin America In Vitro Toxicology Market Size, Share, Growth | CAGR of 11.2% Market Share Comparison by Country (2016-2032)
- Figure 153: Latin America In Vitro Toxicology Market Size, Share, Growth | CAGR of 11.2% Market Share Comparison by Technology (2016-2032)
- Figure 154: Latin America In Vitro Toxicology Market Size, Share, Growth | CAGR of 11.2% Market Share Comparison by Application (2016-2032)
- Figure 155: Latin America In Vitro Toxicology Market Size, Share, Growth | CAGR of 11.2% Market Share Comparison by Method (2016-2032)
- Figure 156: Latin America In Vitro Toxicology Market Size, Share, Growth | CAGR of 11.2% Market Share Comparison by End-user (2016-2032)
- Figure 157: Middle East & Africa In Vitro Toxicology Market Size, Share, Growth | CAGR of 11.2% Revenue (US$ Mn) Market Share by Technologyin 2022
- Figure 158: Middle East & Africa In Vitro Toxicology Market Size, Share, Growth | CAGR of 11.2% Market Attractiveness Analysis by Technology, 2016-2032
- Figure 159: Middle East & Africa In Vitro Toxicology Market Size, Share, Growth | CAGR of 11.2% Revenue (US$ Mn) Market Share by Applicationin 2022
- Figure 160: Middle East & Africa In Vitro Toxicology Market Size, Share, Growth | CAGR of 11.2% Market Attractiveness Analysis by Application, 2016-2032
- Figure 161: Middle East & Africa In Vitro Toxicology Market Size, Share, Growth | CAGR of 11.2% Revenue (US$ Mn) Market Share by Methodin 2022
- Figure 162: Middle East & Africa In Vitro Toxicology Market Size, Share, Growth | CAGR of 11.2% Market Attractiveness Analysis by Method, 2016-2032
- Figure 163: Middle East & Africa In Vitro Toxicology Market Size, Share, Growth | CAGR of 11.2% Revenue (US$ Mn) Market Share by End-userin 2022
- Figure 164: Middle East & Africa In Vitro Toxicology Market Size, Share, Growth | CAGR of 11.2% Market Attractiveness Analysis by End-user, 2016-2032
- Figure 165: Middle East & Africa In Vitro Toxicology Market Size, Share, Growth | CAGR of 11.2% Revenue (US$ Mn) Market Share by Country in 2022
- Figure 166: Middle East & Africa In Vitro Toxicology Market Size, Share, Growth | CAGR of 11.2% Market Attractiveness Analysis by Country, 2016-2032
- Figure 167: Middle East & Africa In Vitro Toxicology Market Size, Share, Growth | CAGR of 11.2% Market Revenue (US$ Mn) (2016-2032)
- Figure 168: Middle East & Africa In Vitro Toxicology Market Size, Share, Growth | CAGR of 11.2% Market Revenue (US$ Mn) Comparison by Country (2016-2032)
- Figure 169: Middle East & Africa In Vitro Toxicology Market Size, Share, Growth | CAGR of 11.2% Market Revenue (US$ Mn) Comparison by Technology (2016-2032)
- Figure 170: Middle East & Africa In Vitro Toxicology Market Size, Share, Growth | CAGR of 11.2% Market Revenue (US$ Mn) Comparison by Application (2016-2032)
- Figure 171: Middle East & Africa In Vitro Toxicology Market Size, Share, Growth | CAGR of 11.2% Market Revenue (US$ Mn) Comparison by Method (2016-2032)
- Figure 172: Middle East & Africa In Vitro Toxicology Market Size, Share, Growth | CAGR of 11.2% Market Revenue (US$ Mn) Comparison by End-user (2016-2032)
- Figure 173: Middle East & Africa In Vitro Toxicology Market Size, Share, Growth | CAGR of 11.2% Market Y-o-Y Growth Rate Comparison by Country (2016-2032)
- Figure 174: Middle East & Africa In Vitro Toxicology Market Size, Share, Growth | CAGR of 11.2% Market Y-o-Y Growth Rate Comparison by Technology (2016-2032)
- Figure 175: Middle East & Africa In Vitro Toxicology Market Size, Share, Growth | CAGR of 11.2% Market Y-o-Y Growth Rate Comparison by Application (2016-2032)
- Figure 176: Middle East & Africa In Vitro Toxicology Market Size, Share, Growth | CAGR of 11.2% Market Y-o-Y Growth Rate Comparison by Method (2016-2032)
- Figure 177: Middle East & Africa In Vitro Toxicology Market Size, Share, Growth | CAGR of 11.2% Market Y-o-Y Growth Rate Comparison by End-user (2016-2032)
- Figure 178: Middle East & Africa In Vitro Toxicology Market Size, Share, Growth | CAGR of 11.2% Market Share Comparison by Country (2016-2032)
- Figure 179: Middle East & Africa In Vitro Toxicology Market Size, Share, Growth | CAGR of 11.2% Market Share Comparison by Technology (2016-2032)
- Figure 180: Middle East & Africa In Vitro Toxicology Market Size, Share, Growth | CAGR of 11.2% Market Share Comparison by Application (2016-2032)
- Figure 181: Middle East & Africa In Vitro Toxicology Market Size, Share, Growth | CAGR of 11.2% Market Share Comparison by Method (2016-2032)
- Figure 182: Middle East & Africa In Vitro Toxicology Market Size, Share, Growth | CAGR of 11.2% Market Share Comparison by End-user (2016-2032)
"
- List of Tables
- "
- Table 1: Global In Vitro Toxicology Market Size, Share, Growth | CAGR of 11.2% Market Comparison by Technology (2016-2032)
- Table 2: Global In Vitro Toxicology Market Size, Share, Growth | CAGR of 11.2% Market Comparison by Application (2016-2032)
- Table 3: Global In Vitro Toxicology Market Size, Share, Growth | CAGR of 11.2% Market Comparison by Method (2016-2032)
- Table 4: Global In Vitro Toxicology Market Size, Share, Growth | CAGR of 11.2% Market Comparison by End-user (2016-2032)
- Table 5: Global In Vitro Toxicology Market Size, Share, Growth | CAGR of 11.2% Revenue (US$ Mn) Comparison by Region (2016-2032)
- Table 6: Global In Vitro Toxicology Market Size, Share, Growth | CAGR of 11.2% Market Revenue (US$ Mn) (2016-2032)
- Table 7: Global In Vitro Toxicology Market Size, Share, Growth | CAGR of 11.2% Market Revenue (US$ Mn) Comparison by Region (2016-2032)
- Table 8: Global In Vitro Toxicology Market Size, Share, Growth | CAGR of 11.2% Market Revenue (US$ Mn) Comparison by Technology (2016-2032)
- Table 9: Global In Vitro Toxicology Market Size, Share, Growth | CAGR of 11.2% Market Revenue (US$ Mn) Comparison by Application (2016-2032)
- Table 10: Global In Vitro Toxicology Market Size, Share, Growth | CAGR of 11.2% Market Revenue (US$ Mn) Comparison by Method (2016-2032)
- Table 11: Global In Vitro Toxicology Market Size, Share, Growth | CAGR of 11.2% Market Revenue (US$ Mn) Comparison by End-user (2016-2032)
- Table 12: Global In Vitro Toxicology Market Size, Share, Growth | CAGR of 11.2% Market Y-o-Y Growth Rate Comparison by Region (2016-2032)
- Table 13: Global In Vitro Toxicology Market Size, Share, Growth | CAGR of 11.2% Market Y-o-Y Growth Rate Comparison by Technology (2016-2032)
- Table 14: Global In Vitro Toxicology Market Size, Share, Growth | CAGR of 11.2% Market Y-o-Y Growth Rate Comparison by Application (2016-2032)
- Table 15: Global In Vitro Toxicology Market Size, Share, Growth | CAGR of 11.2% Market Y-o-Y Growth Rate Comparison by Method (2016-2032)
- Table 16: Global In Vitro Toxicology Market Size, Share, Growth | CAGR of 11.2% Market Y-o-Y Growth Rate Comparison by End-user (2016-2032)
- Table 17: Global In Vitro Toxicology Market Size, Share, Growth | CAGR of 11.2% Market Share Comparison by Region (2016-2032)
- Table 18: Global In Vitro Toxicology Market Size, Share, Growth | CAGR of 11.2% Market Share Comparison by Technology (2016-2032)
- Table 19: Global In Vitro Toxicology Market Size, Share, Growth | CAGR of 11.2% Market Share Comparison by Application (2016-2032)
- Table 20: Global In Vitro Toxicology Market Size, Share, Growth | CAGR of 11.2% Market Share Comparison by Method (2016-2032)
- Table 21: Global In Vitro Toxicology Market Size, Share, Growth | CAGR of 11.2% Market Share Comparison by End-user (2016-2032)
- Table 22: North America In Vitro Toxicology Market Size, Share, Growth | CAGR of 11.2% Market Comparison by Application (2016-2032)
- Table 23: North America In Vitro Toxicology Market Size, Share, Growth | CAGR of 11.2% Market Comparison by Method (2016-2032)
- Table 24: North America In Vitro Toxicology Market Size, Share, Growth | CAGR of 11.2% Market Comparison by End-user (2016-2032)
- Table 25: North America In Vitro Toxicology Market Size, Share, Growth | CAGR of 11.2% Revenue (US$ Mn) Comparison by Country (2016-2032)
- Table 26: North America In Vitro Toxicology Market Size, Share, Growth | CAGR of 11.2% Market Revenue (US$ Mn) (2016-2032)
- Table 27: North America In Vitro Toxicology Market Size, Share, Growth | CAGR of 11.2% Market Revenue (US$ Mn) Comparison by Country (2016-2032)
- Table 28: North America In Vitro Toxicology Market Size, Share, Growth | CAGR of 11.2% Market Revenue (US$ Mn) Comparison by Technology (2016-2032)
- Table 29: North America In Vitro Toxicology Market Size, Share, Growth | CAGR of 11.2% Market Revenue (US$ Mn) Comparison by Application (2016-2032)
- Table 30: North America In Vitro Toxicology Market Size, Share, Growth | CAGR of 11.2% Market Revenue (US$ Mn) Comparison by Method (2016-2032)
- Table 31: North America In Vitro Toxicology Market Size, Share, Growth | CAGR of 11.2% Market Revenue (US$ Mn) Comparison by End-user (2016-2032)
- Table 32: North America In Vitro Toxicology Market Size, Share, Growth | CAGR of 11.2% Market Y-o-Y Growth Rate Comparison by Country (2016-2032)
- Table 33: North America In Vitro Toxicology Market Size, Share, Growth | CAGR of 11.2% Market Y-o-Y Growth Rate Comparison by Technology (2016-2032)
- Table 34: North America In Vitro Toxicology Market Size, Share, Growth | CAGR of 11.2% Market Y-o-Y Growth Rate Comparison by Application (2016-2032)
- Table 35: North America In Vitro Toxicology Market Size, Share, Growth | CAGR of 11.2% Market Y-o-Y Growth Rate Comparison by Method (2016-2032)
- Table 36: North America In Vitro Toxicology Market Size, Share, Growth | CAGR of 11.2% Market Y-o-Y Growth Rate Comparison by End-user (2016-2032)
- Table 37: North America In Vitro Toxicology Market Size, Share, Growth | CAGR of 11.2% Market Share Comparison by Country (2016-2032)
- Table 38: North America In Vitro Toxicology Market Size, Share, Growth | CAGR of 11.2% Market Share Comparison by Technology (2016-2032)
- Table 39: North America In Vitro Toxicology Market Size, Share, Growth | CAGR of 11.2% Market Share Comparison by Application (2016-2032)
- Table 40: North America In Vitro Toxicology Market Size, Share, Growth | CAGR of 11.2% Market Share Comparison by Method (2016-2032)
- Table 41: North America In Vitro Toxicology Market Size, Share, Growth | CAGR of 11.2% Market Share Comparison by End-user (2016-2032)
- Table 42: Western Europe In Vitro Toxicology Market Size, Share, Growth | CAGR of 11.2% Market Comparison by Technology (2016-2032)
- Table 43: Western Europe In Vitro Toxicology Market Size, Share, Growth | CAGR of 11.2% Market Comparison by Application (2016-2032)
- Table 44: Western Europe In Vitro Toxicology Market Size, Share, Growth | CAGR of 11.2% Market Comparison by Method (2016-2032)
- Table 45: Western Europe In Vitro Toxicology Market Size, Share, Growth | CAGR of 11.2% Market Comparison by End-user (2016-2032)
- Table 46: Western Europe In Vitro Toxicology Market Size, Share, Growth | CAGR of 11.2% Revenue (US$ Mn) Comparison by Country (2016-2032)
- Table 47: Western Europe In Vitro Toxicology Market Size, Share, Growth | CAGR of 11.2% Market Revenue (US$ Mn) (2016-2032)
- Table 48: Western Europe In Vitro Toxicology Market Size, Share, Growth | CAGR of 11.2% Market Revenue (US$ Mn) Comparison by Country (2016-2032)
- Table 49: Western Europe In Vitro Toxicology Market Size, Share, Growth | CAGR of 11.2% Market Revenue (US$ Mn) Comparison by Technology (2016-2032)
- Table 50: Western Europe In Vitro Toxicology Market Size, Share, Growth | CAGR of 11.2% Market Revenue (US$ Mn) Comparison by Application (2016-2032)
- Table 51: Western Europe In Vitro Toxicology Market Size, Share, Growth | CAGR of 11.2% Market Revenue (US$ Mn) Comparison by Method (2016-2032)
- Table 52: Western Europe In Vitro Toxicology Market Size, Share, Growth | CAGR of 11.2% Market Revenue (US$ Mn) Comparison by End-user (2016-2032)
- Table 53: Western Europe In Vitro Toxicology Market Size, Share, Growth | CAGR of 11.2% Market Y-o-Y Growth Rate Comparison by Country (2016-2032)
- Table 54: Western Europe In Vitro Toxicology Market Size, Share, Growth | CAGR of 11.2% Market Y-o-Y Growth Rate Comparison by Technology (2016-2032)
- Table 55: Western Europe In Vitro Toxicology Market Size, Share, Growth | CAGR of 11.2% Market Y-o-Y Growth Rate Comparison by Application (2016-2032)
- Table 56: Western Europe In Vitro Toxicology Market Size, Share, Growth | CAGR of 11.2% Market Y-o-Y Growth Rate Comparison by Method (2016-2032)
- Table 57: Western Europe In Vitro Toxicology Market Size, Share, Growth | CAGR of 11.2% Market Y-o-Y Growth Rate Comparison by End-user (2016-2032)
- Table 58: Western Europe In Vitro Toxicology Market Size, Share, Growth | CAGR of 11.2% Market Share Comparison by Country (2016-2032)
- Table 59: Western Europe In Vitro Toxicology Market Size, Share, Growth | CAGR of 11.2% Market Share Comparison by Technology (2016-2032)
- Table 60: Western Europe In Vitro Toxicology Market Size, Share, Growth | CAGR of 11.2% Market Share Comparison by Application (2016-2032)
- Table 61: Western Europe In Vitro Toxicology Market Size, Share, Growth | CAGR of 11.2% Market Share Comparison by Method (2016-2032)
- Table 62: Western Europe In Vitro Toxicology Market Size, Share, Growth | CAGR of 11.2% Market Share Comparison by End-user (2016-2032)
- Table 63: Eastern Europe In Vitro Toxicology Market Size, Share, Growth | CAGR of 11.2% Market Comparison by Technology (2016-2032)
- Table 64: Eastern Europe In Vitro Toxicology Market Size, Share, Growth | CAGR of 11.2% Market Comparison by Application (2016-2032)
- Table 65: Eastern Europe In Vitro Toxicology Market Size, Share, Growth | CAGR of 11.2% Market Comparison by Method (2016-2032)
- Table 66: Eastern Europe In Vitro Toxicology Market Size, Share, Growth | CAGR of 11.2% Market Comparison by End-user (2016-2032)
- Table 67: Eastern Europe In Vitro Toxicology Market Size, Share, Growth | CAGR of 11.2% Revenue (US$ Mn) Comparison by Country (2016-2032)
- Table 68: Eastern Europe In Vitro Toxicology Market Size, Share, Growth | CAGR of 11.2% Market Revenue (US$ Mn) (2016-2032)
- Table 69: Eastern Europe In Vitro Toxicology Market Size, Share, Growth | CAGR of 11.2% Market Revenue (US$ Mn) Comparison by Country (2016-2032)
- Table 70: Eastern Europe In Vitro Toxicology Market Size, Share, Growth | CAGR of 11.2% Market Revenue (US$ Mn) Comparison by Technology (2016-2032)
- Table 71: Eastern Europe In Vitro Toxicology Market Size, Share, Growth | CAGR of 11.2% Market Revenue (US$ Mn) Comparison by Application (2016-2032)
- Table 72: Eastern Europe In Vitro Toxicology Market Size, Share, Growth | CAGR of 11.2% Market Revenue (US$ Mn) Comparison by Method (2016-2032)
- Table 73: Eastern Europe In Vitro Toxicology Market Size, Share, Growth | CAGR of 11.2% Market Revenue (US$ Mn) Comparison by End-user (2016-2032)
- Table 74: Eastern Europe In Vitro Toxicology Market Size, Share, Growth | CAGR of 11.2% Market Y-o-Y Growth Rate Comparison by Country (2016-2032)
- Table 75: Eastern Europe In Vitro Toxicology Market Size, Share, Growth | CAGR of 11.2% Market Y-o-Y Growth Rate Comparison by Technology (2016-2032)
- Table 76: Eastern Europe In Vitro Toxicology Market Size, Share, Growth | CAGR of 11.2% Market Y-o-Y Growth Rate Comparison by Application (2016-2032)
- Table 77: Eastern Europe In Vitro Toxicology Market Size, Share, Growth | CAGR of 11.2% Market Y-o-Y Growth Rate Comparison by Method (2016-2032)
- Table 78: Eastern Europe In Vitro Toxicology Market Size, Share, Growth | CAGR of 11.2% Market Y-o-Y Growth Rate Comparison by End-user (2016-2032)
- Table 79: Eastern Europe In Vitro Toxicology Market Size, Share, Growth | CAGR of 11.2% Market Share Comparison by Country (2016-2032)
- Table 80: Eastern Europe In Vitro Toxicology Market Size, Share, Growth | CAGR of 11.2% Market Share Comparison by Technology (2016-2032)
- Table 81: Eastern Europe In Vitro Toxicology Market Size, Share, Growth | CAGR of 11.2% Market Share Comparison by Application (2016-2032)
- Table 82: Eastern Europe In Vitro Toxicology Market Size, Share, Growth | CAGR of 11.2% Market Share Comparison by Method (2016-2032)
- Table 83: Eastern Europe In Vitro Toxicology Market Size, Share, Growth | CAGR of 11.2% Market Share Comparison by End-user (2016-2032)
- Table 84: APAC In Vitro Toxicology Market Size, Share, Growth | CAGR of 11.2% Market Comparison by Technology (2016-2032)
- Table 85: APAC In Vitro Toxicology Market Size, Share, Growth | CAGR of 11.2% Market Comparison by Application (2016-2032)
- Table 86: APAC In Vitro Toxicology Market Size, Share, Growth | CAGR of 11.2% Market Comparison by Method (2016-2032)
- Table 87: APAC In Vitro Toxicology Market Size, Share, Growth | CAGR of 11.2% Market Comparison by End-user (2016-2032)
- Table 88: APAC In Vitro Toxicology Market Size, Share, Growth | CAGR of 11.2% Revenue (US$ Mn) Comparison by Country (2016-2032)
- Table 89: APAC In Vitro Toxicology Market Size, Share, Growth | CAGR of 11.2% Market Revenue (US$ Mn) (2016-2032)
- Table 90: APAC In Vitro Toxicology Market Size, Share, Growth | CAGR of 11.2% Market Revenue (US$ Mn) Comparison by Country (2016-2032)
- Table 91: APAC In Vitro Toxicology Market Size, Share, Growth | CAGR of 11.2% Market Revenue (US$ Mn) Comparison by Technology (2016-2032)
- Table 92: APAC In Vitro Toxicology Market Size, Share, Growth | CAGR of 11.2% Market Revenue (US$ Mn) Comparison by Application (2016-2032)
- Table 93: APAC In Vitro Toxicology Market Size, Share, Growth | CAGR of 11.2% Market Revenue (US$ Mn) Comparison by Method (2016-2032)
- Table 94: APAC In Vitro Toxicology Market Size, Share, Growth | CAGR of 11.2% Market Revenue (US$ Mn) Comparison by End-user (2016-2032)
- Table 95: APAC In Vitro Toxicology Market Size, Share, Growth | CAGR of 11.2% Market Y-o-Y Growth Rate Comparison by Country (2016-2032)
- Table 96: APAC In Vitro Toxicology Market Size, Share, Growth | CAGR of 11.2% Market Y-o-Y Growth Rate Comparison by Technology (2016-2032)
- Table 97: APAC In Vitro Toxicology Market Size, Share, Growth | CAGR of 11.2% Market Y-o-Y Growth Rate Comparison by Application (2016-2032)
- Table 98: APAC In Vitro Toxicology Market Size, Share, Growth | CAGR of 11.2% Market Y-o-Y Growth Rate Comparison by Method (2016-2032)
- Table 99: APAC In Vitro Toxicology Market Size, Share, Growth | CAGR of 11.2% Market Y-o-Y Growth Rate Comparison by End-user (2016-2032)
- Table 100: APAC In Vitro Toxicology Market Size, Share, Growth | CAGR of 11.2% Market Share Comparison by Country (2016-2032)
- Table 101: APAC In Vitro Toxicology Market Size, Share, Growth | CAGR of 11.2% Market Share Comparison by Technology (2016-2032)
- Table 102: APAC In Vitro Toxicology Market Size, Share, Growth | CAGR of 11.2% Market Share Comparison by Application (2016-2032)
- Table 103: APAC In Vitro Toxicology Market Size, Share, Growth | CAGR of 11.2% Market Share Comparison by Method (2016-2032)
- Table 104: APAC In Vitro Toxicology Market Size, Share, Growth | CAGR of 11.2% Market Share Comparison by End-user (2016-2032)
- Table 105: Latin America In Vitro Toxicology Market Size, Share, Growth | CAGR of 11.2% Market Comparison by Technology (2016-2032)
- Table 106: Latin America In Vitro Toxicology Market Size, Share, Growth | CAGR of 11.2% Market Comparison by Application (2016-2032)
- Table 107: Latin America In Vitro Toxicology Market Size, Share, Growth | CAGR of 11.2% Market Comparison by Method (2016-2032)
- Table 108: Latin America In Vitro Toxicology Market Size, Share, Growth | CAGR of 11.2% Market Comparison by End-user (2016-2032)
- Table 109: Latin America In Vitro Toxicology Market Size, Share, Growth | CAGR of 11.2% Revenue (US$ Mn) Comparison by Country (2016-2032)
- Table 110: Latin America In Vitro Toxicology Market Size, Share, Growth | CAGR of 11.2% Market Revenue (US$ Mn) (2016-2032)
- Table 111: Latin America In Vitro Toxicology Market Size, Share, Growth | CAGR of 11.2% Market Revenue (US$ Mn) Comparison by Country (2016-2032)
- Table 112: Latin America In Vitro Toxicology Market Size, Share, Growth | CAGR of 11.2% Market Revenue (US$ Mn) Comparison by Technology (2016-2032)
- Table 113: Latin America In Vitro Toxicology Market Size, Share, Growth | CAGR of 11.2% Market Revenue (US$ Mn) Comparison by Application (2016-2032)
- Table 114: Latin America In Vitro Toxicology Market Size, Share, Growth | CAGR of 11.2% Market Revenue (US$ Mn) Comparison by Method (2016-2032)
- Table 115: Latin America In Vitro Toxicology Market Size, Share, Growth | CAGR of 11.2% Market Revenue (US$ Mn) Comparison by End-user (2016-2032)
- Table 116: Latin America In Vitro Toxicology Market Size, Share, Growth | CAGR of 11.2% Market Y-o-Y Growth Rate Comparison by Country (2016-2032)
- Table 117: Latin America In Vitro Toxicology Market Size, Share, Growth | CAGR of 11.2% Market Y-o-Y Growth Rate Comparison by Technology (2016-2032)
- Table 118: Latin America In Vitro Toxicology Market Size, Share, Growth | CAGR of 11.2% Market Y-o-Y Growth Rate Comparison by Application (2016-2032)
- Table 119: Latin America In Vitro Toxicology Market Size, Share, Growth | CAGR of 11.2% Market Y-o-Y Growth Rate Comparison by Method (2016-2032)
- Table 120: Latin America In Vitro Toxicology Market Size, Share, Growth | CAGR of 11.2% Market Y-o-Y Growth Rate Comparison by End-user (2016-2032)
- Table 121: Latin America In Vitro Toxicology Market Size, Share, Growth | CAGR of 11.2% Market Share Comparison by Country (2016-2032)
- Table 122: Latin America In Vitro Toxicology Market Size, Share, Growth | CAGR of 11.2% Market Share Comparison by Technology (2016-2032)
- Table 123: Latin America In Vitro Toxicology Market Size, Share, Growth | CAGR of 11.2% Market Share Comparison by Application (2016-2032)
- Table 124: Latin America In Vitro Toxicology Market Size, Share, Growth | CAGR of 11.2% Market Share Comparison by Method (2016-2032)
- Table 125: Latin America In Vitro Toxicology Market Size, Share, Growth | CAGR of 11.2% Market Share Comparison by End-user (2016-2032)
- Table 126: Middle East & Africa In Vitro Toxicology Market Size, Share, Growth | CAGR of 11.2% Market Comparison by Technology (2016-2032)
- Table 127: Middle East & Africa In Vitro Toxicology Market Size, Share, Growth | CAGR of 11.2% Market Comparison by Application (2016-2032)
- Table 128: Middle East & Africa In Vitro Toxicology Market Size, Share, Growth | CAGR of 11.2% Market Comparison by Method (2016-2032)
- Table 129: Middle East & Africa In Vitro Toxicology Market Size, Share, Growth | CAGR of 11.2% Market Comparison by End-user (2016-2032)
- Table 130: Middle East & Africa In Vitro Toxicology Market Size, Share, Growth | CAGR of 11.2% Revenue (US$ Mn) Comparison by Country (2016-2032)
- Table 131: Middle East & Africa In Vitro Toxicology Market Size, Share, Growth | CAGR of 11.2% Market Revenue (US$ Mn) (2016-2032)
- Table 132: Middle East & Africa In Vitro Toxicology Market Size, Share, Growth | CAGR of 11.2% Market Revenue (US$ Mn) Comparison by Country (2016-2032)
- Table 133: Middle East & Africa In Vitro Toxicology Market Size, Share, Growth | CAGR of 11.2% Market Revenue (US$ Mn) Comparison by Technology (2016-2032)
- Table 134: Middle East & Africa In Vitro Toxicology Market Size, Share, Growth | CAGR of 11.2% Market Revenue (US$ Mn) Comparison by Application (2016-2032)
- Table 135: Middle East & Africa In Vitro Toxicology Market Size, Share, Growth | CAGR of 11.2% Market Revenue (US$ Mn) Comparison by Method (2016-2032)
- Table 136: Middle East & Africa In Vitro Toxicology Market Size, Share, Growth | CAGR of 11.2% Market Revenue (US$ Mn) Comparison by End-user (2016-2032)
- Table 137: Middle East & Africa In Vitro Toxicology Market Size, Share, Growth | CAGR of 11.2% Market Y-o-Y Growth Rate Comparison by Country (2016-2032)
- Table 138: Middle East & Africa In Vitro Toxicology Market Size, Share, Growth | CAGR of 11.2% Market Y-o-Y Growth Rate Comparison by Technology (2016-2032)
- Table 139: Middle East & Africa In Vitro Toxicology Market Size, Share, Growth | CAGR of 11.2% Market Y-o-Y Growth Rate Comparison by Application (2016-2032)
- Table 140: Middle East & Africa In Vitro Toxicology Market Size, Share, Growth | CAGR of 11.2% Market Y-o-Y Growth Rate Comparison by Method (2016-2032)
- Table 141: Middle East & Africa In Vitro Toxicology Market Size, Share, Growth | CAGR of 11.2% Market Y-o-Y Growth Rate Comparison by End-user (2016-2032)
- Table 142: Middle East & Africa In Vitro Toxicology Market Size, Share, Growth | CAGR of 11.2% Market Share Comparison by Country (2016-2032)
- Table 143: Middle East & Africa In Vitro Toxicology Market Size, Share, Growth | CAGR of 11.2% Market Share Comparison by Technology (2016-2032)
- Table 144: Middle East & Africa In Vitro Toxicology Market Size, Share, Growth | CAGR of 11.2% Market Share Comparison by Application (2016-2032)
- Table 145: Middle East & Africa In Vitro Toxicology Market Size, Share, Growth | CAGR of 11.2% Market Share Comparison by Method (2016-2032)
- Table 146: Middle East & Africa In Vitro Toxicology Market Size, Share, Growth | CAGR of 11.2% Market Share Comparison by End-user (2016-2032)
- 1. Executive Summary
-
- Charles River Laboratories International, Inc.
- SGS S.A.
- Merck KGaA
- Eurofins Scientific
- Abbott Laboratories
- Laboratory Corporation of America Holdings
- Evotec SE
- Thermo Fisher Scientific, Inc.
- Quest Diagnostics Incorporated
- Agilent Technologies, Inc.
- Catalent, Inc.
- Danaher Corporation
- Bio-Rad Laboratories, Inc.
- BioIVT
- Gentronix
Our Clients


View Our Licence Options
