Growler Market By Material Type (Glass, Metal, Plastic, Ceramic), By Capacity (32 Oz, 64 Oz, 128 Oz), By Application (Alcoholic, Beer, Wines, Others, Non-Alcoholic), By Distribution Channel (Online, Offline), By Region And Companies - Industry Segment Outlook, Market Assessment, Competition Scenario, Trends, And Forecast 2023-2032
-
37505
-
Jan 2022
-
169
-


-
This report was compiled by Kalyani Khudsange Kalyani Khudsange is a Research Analyst at Prudour Pvt. Ltd. with 2.5 years of experience in market research and a strong technical background in Chemical Engineering and manufacturing. Correspondence Sr. Research Analyst Linkedin | Detailed Market research Methodology Our methodology involves a mix of primary research, including interviews with leading mental health experts, and secondary research from reputable medical journals and databases. View Detailed Methodology Page
-
Quick Navigation
Report Overview
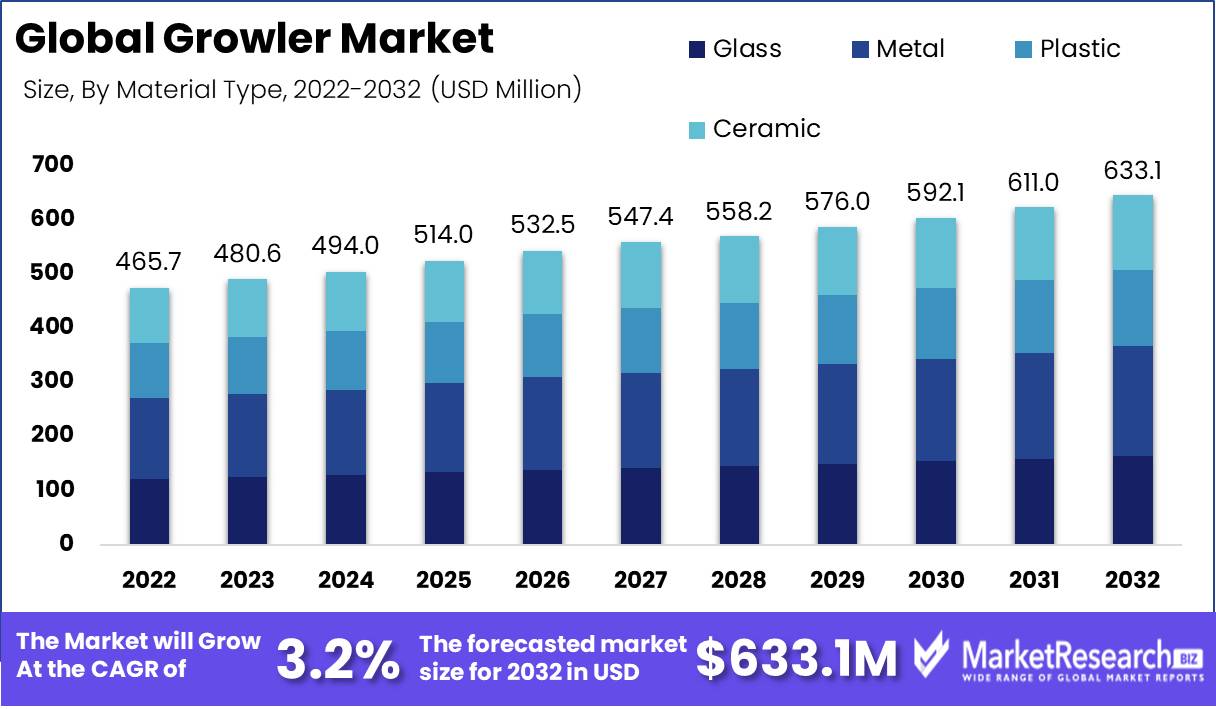
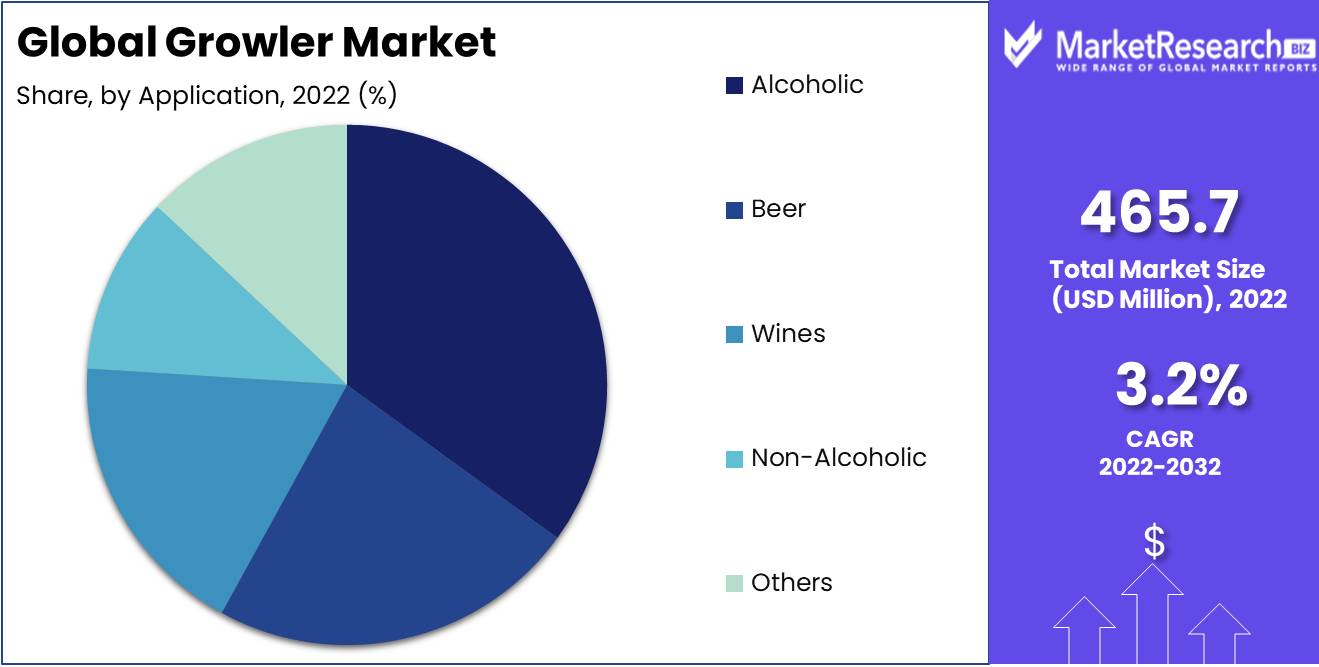
Growler Market size is expected to be worth around USD 633.1 Mn by 2032 from USD 465.7 Mn in 2022, growing at a CAGR of 3.2% during the forecast period from 2023 to 2032.
As beer consumption continues to rise, an increasing number of individuals search for environmentally responsible ways to enjoy their favored beverage. Herein lies the significance of the global growler market. In this blog post, we will discuss the industry's definition, advantages, innovations, and key influencers. Additionally, we will examine the use of growlers in various industries and discuss the ethical concerns and responsible practices associated with their use. This growth can be ascribed to the rising demand for environmentally favorable beer packaging, as consumers become more environmentally conscious. The growth of the specialty beer industry and the demand for takeaway beverages also contribute to the expansion of the growler market.
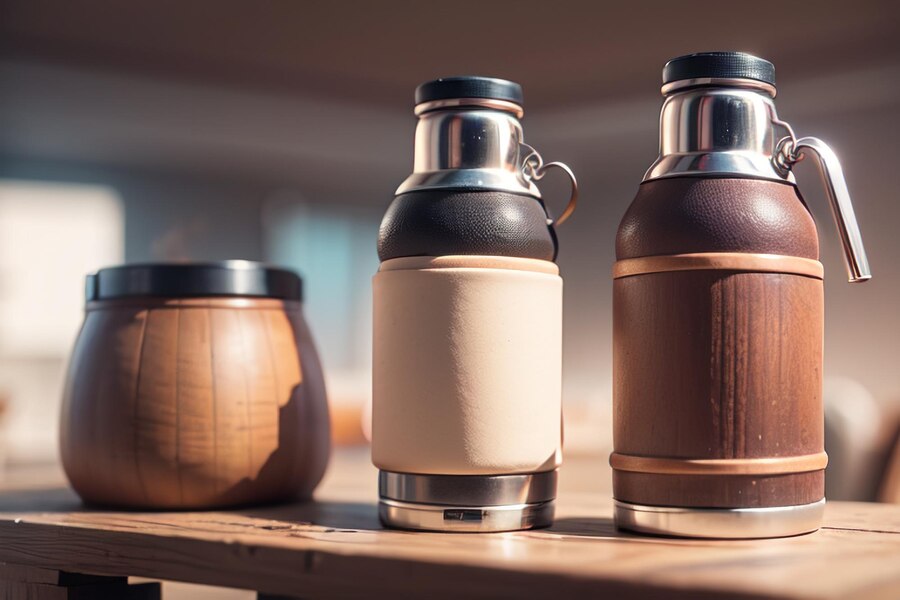
Growlers are reusable, hermetic containers that are used to transport draft beer from a brewery or taproom to a different location. They are typically made of glass, ceramic, or stainless steel and range in size from 32 to 128 ounces. Growlers are designed to offer a convenient and environmentally responsible alternative to disposable beer containers like cans and bottles. They offer advantages such as freshness, variety, and affordability, making them an ideal option for beer devotees who want to enjoy their favored beer in the comfort of their own homes or in outdoor settings.
In recent years, growler market have witnessed significant development. One innovation is the use of durable materials, such as borosilicate glass, which can withstand variations in temperature and pressure without shattering. The introduction of portable growlers with a CO2 regulator that maintains carbonation and freshness for an extended period of time is another innovation. In addition, some growlers are equipped with a temperature control system that maintains the beer's temperature for an extended period of time. These advancements have substantially enhanced the functionality and features of growler market, making them more user-friendly and convenient for consumers.
The potential for contamination, which could affect the purity and safety of the beer, is one of the ethical concerns associated with the use of growler market. To prevent this, it is essential that growlers are cleaned and sanitized properly. In addition, businesses that utilize growlers should prioritize openness, explanation, and responsibility in their operations. This includes providing information about the beer's ingredients, manufacturing process, and origin to consumers.
Driving factors
Increasing Popularity of Craft Beer
The expansion of the global Growler Market has been significantly aided by the rise in favorability of craft beer. Growlers provide a practical and affordable method to drink craft beer, which has led to a rise in consumer interest in experimenting with new and distinctive beer flavors.
Demand for Fresh and Locally Brewed Beer
The demand for growlers has risen as a result of the growing demand for fresh, locally made beer. Growlers provide breweries an ecologically beneficial way to distribute beer in a reusable container as customers place a premium on items supplied locally.
Growth of the Craft Brewery Industry
The increase of the global growler market has been driven in part by the growth of the craft brewing sector. There is a growing need cluster packaging for beer and distribution methods that are both environmentally friendly and economical as more craft brewers develop across the world.
Environmental Concerns and Reusable Packaging
The expansion of the global Growler Market has been helped along by rising awareness about the impact of single-use packaging on the environment. Growlers offer an appealing option by minimizing waste and preserving resources, which has prompted consumers to actively seek eco-friendly alternatives.
Potential Changes in Regulations
The global growler market can be affected if there are any modifications made to existing restrictions, notably in the United States. The Alcohol and Tobacco Tax and Trade Bureau (TTB) has proposed regulations that might increase the number of chances for growler sales and refilling, so opening up new doors for the expansion of the market.
Shift towards Online Ordering and Delivery Services
As a result of shifting patterns of behavior on the part of customers, there has been a discernible movement toward the use of online ordering and delivery services. This change may result in an increase in the number of growlers that are purchased online as well as the incorporation of growler refilling services into more comprehensive online delivery systems.
Restraining Factors
Regulatory Constraints on Growler Filling and Sales
Significant regulatory restrictions pose challenges for both manufacturers and consumers on the global growler market. Growlers have become increasingly popular for transporting large volumes of draft beer, with many craft breweries offering consumers the option to purchase and replenish growlers for home consumption. However, regulatory restrictions on growler filling and sales have restricted consumer participation in this market.
The challenge posed by canned and bottled beer
In recent years, competition from canned and bottled beer has become a significant restraint on the global growler market's expansion. The widespread availability of canned and bottled beer on the market has made it incredibly convenient for consumers to purchase their preferred beverages from the convenience of their own residences. Due to the variety and convenience of canned and bottled beer, this competition has presented a significant challenge for growler manufacturers.
Possibile Obstacles to Maintaining Beer's Freshness
Maintaining beer's freshness is a crucial market factor for growlers. The rapid deterioration of draft beer can result in a disagreeable consuming experience for the consumer. This presents a significant challenge for the growler market, as it necessitates the use of hermetic growler containers that effectively preserve the freshness of the beer. The difficulty lies in keeping the beer fresh until the very last drop, which requires highly specialized technology.
Lack of Consumer Understanding of Growlers
Limited consumer awareness of growlers is another significant factor restraining the global growler market's expansion. Despite the fact that growlers have been on the market for several years, many consumers are still oblivious of their capacity to provide high-quality and fresh draft beer. Due to this lack of awareness, consumers are frequently unaware of the numerous benefits of growlers, resulting in a limited market demand.
Material Type Analysis
The Material Type Analysis emphasizes the metal segment's dominance. According to industry specialists, the greatest share of the global growler market is held by the metal segment. Due to its durability, resistance to abrasion, and corrosion, metal has been favored for use in growlers. Furthermore, metal growlers are preferred over glass and plastic growlers due to their ability to maintain the beverage's temperature for a longer duration. The metal segment satisfies the growing demand for insulated growlers that can keep beverages chilled or heated for extended periods of time.
The majority of consumer trends and behaviors regarding metal growlers have been positive. Customers favor recyclable eco-friendly materials that contribute to sustainability objectives. Compared to glass, which is fragile and prone to shattering, and plastic, which is non-biodegradable and detrimental to the environment, metal growlers are more environmentally friendly. In the approaching years, the metal segment is anticipated to record the highest growth rate, primarily due to its durability and sturdiness. In addition, the rising demand for insulated metal growlers, which can maintain the temperature of beverages for an extended period of time, is anticipated to contribute to the expansion of this market segment.
Capacity Analysis
The 64 Oz growler segment dominates the global growler market, which has been segmented based on capacity. The 64 Oz Segment accommodates to the demand for larger capacity growlers, which are extremely popular among craft beer enthusiasts.
The growing roots of the craft beer culture are demonstrated by consumer trends and behavior toward 64 Oz. Growlers. As an alternative to consuming at a pub or brewery, beer enthusiasts frequently prefer to purchase a larger capacity growler for take-home consumption. The 64 Oz. Growler is also preferred by the brewing industry because it facilitates the sale of larger quantities of beer. The 64 Oz segment is projected to experience the highest growth rate in the future years. Increasing demand for larger capacity growlers in emerging economies, particularly for social gatherings and family occasions, is anticipated to further fuel the expansion of this market segment.
Application Analysis
Based on application, the global growler market has been segmented, with the alcoholic segment dominating the market. The alcoholic segment satisfies the demand for growlers used specifically for transporting, storing, and consuming alcoholic beverages. Consumer trends and behavior in regards to alcoholic growlers indicate that consumers are willing to pay a premium for premium alcoholic growlers that are more durable and retain temperature longer. In the alcoholic segment, Growlers have become an integral part of the gift-giving options for friends and family.
In the future years, the segment of alcoholic beverages is expected to record the highest growth rate. The rising prominence of craft beer and home fermentation is anticipated to significantly boost the growth of this segment.
Key Market Segments
By Material Type
- Glass
- Metal
- Plastic
- Ceramic
By Capacity
- 32 Oz
- 64 Oz
- 128 Oz
By Application
- Alcoholic
- Beer
- Wines
- Others
- Non-Alcoholic
By Distribution Channel
- Online
- Offline
By End-User
- Commercial
- Residential
Growth Opportunity
Growler Filling Station and Taproom Expansion
The expansion of growler filling stations and taprooms has been a key factor in the global growler market's expansion. Growlers are favored as a more practical and environmentally-friendly alternative to single-use cans and bottles. In response to the growing popularity of craft beer, breweries and pubs are establishing growler filling stations and taprooms with a broader selection of beers on draft. Customers can fill their growlers with their preferred beer varieties and transport them home or to a gathering from these stations.
Innovations in Growler Design and Material
The growth potential of the global growler market has been fueled by design and material innovations that have made growlers more user-friendly, durable, and adaptable. Some of the most recent growler designs include double-walled insulation that keeps beer colder for longer, airtight closures that prevent leakage and maintain carbonation, and easy-pour spouts. Growlers can be recycled and repurposed, making them a more sustainable option for beer packaging thanks to innovative materials such as stainless steel, ceramic, and glass.
Retailer and Brewery Partnerships
Increasing collaborations between breweries and retailers is an additional factor propelling the growth of the global growler market. These partnerships have increased the variety of craft beers available in growlers at retail locations, including grocery stores and convenience stores. Breweries can expand their reach and make their beverages more accessible to a larger audience by forming partnerships with retailers. This increased demand for growlers has had a positive effect on the expansion of the global growler market.
Educational Initiatives to Promote Growler Use
There are also a growing number of educational campaigns promoting growler usage, particularly among millennials and environmentally conscious consumers. These campaigns emphasize the advantages of using growlers, such as reducing pollution, encouraging recycling, and supporting local breweries. As a consequence of the rise of social media and digital marketing, these campaigns are more targeted and reach a larger audience, resulting in an increase in demand for growlers.
Latest Trends
Maintain Beer Freshness for a Longer Time
As beer devotees place a greater emphasis on the quality and freshness of their beverages, the global growler market is observing a shift toward insulated and pressurized growlers. These ingenious designs help maintain optimal beer temperature and carbonation for extended periods of time. Stainless steel or double-walled vacuum-insulated growlers have acquired popularity due to their ability to keep beer fresh for up to 24 hours, making them ideal for outdoor events and beer festivals.
Options for Personalization of Growler Design and Branding
Growlers are no longer simply vessels for transporting beer; they are now identifiers. Craft breweries now offer customization options, enabling customers to personalize growler designs with distinctive logos and custom packaging. This trend satisfies the growing demand for customized brewery experiences and adds an element of uniqueness to the growler market.
Integration of Intelligent Functions
The rise of smart home technology has impacted the beer industry, resulting in the incorporation of smart features into growlers. Smartphones and tablets can be used with smart growlers to monitor temperature, trace carbonation levels, and access beer profiles. With temperature sensors, pressure sensors, and data logging capabilities, these intelligent growlers provide beer devotees with information about their brews, thereby augmenting their overall beer experience.
Services for Growler Subscriptions
Growler subscription services offer craft beer enthusiasts a convenient and individualized way to sample a variety of beers. Instead of attending a brewery, subscribers can have their preferred beers regularly delivered to their entryway. These services offer various subscription alternatives, such as monthly or bi-monthly deliveries, enabling beer enthusiasts to explore new brands and flavors without leaving their residences. This emerging trend eliminates the inconvenience of brewery visits and makes the growler market more convenient.
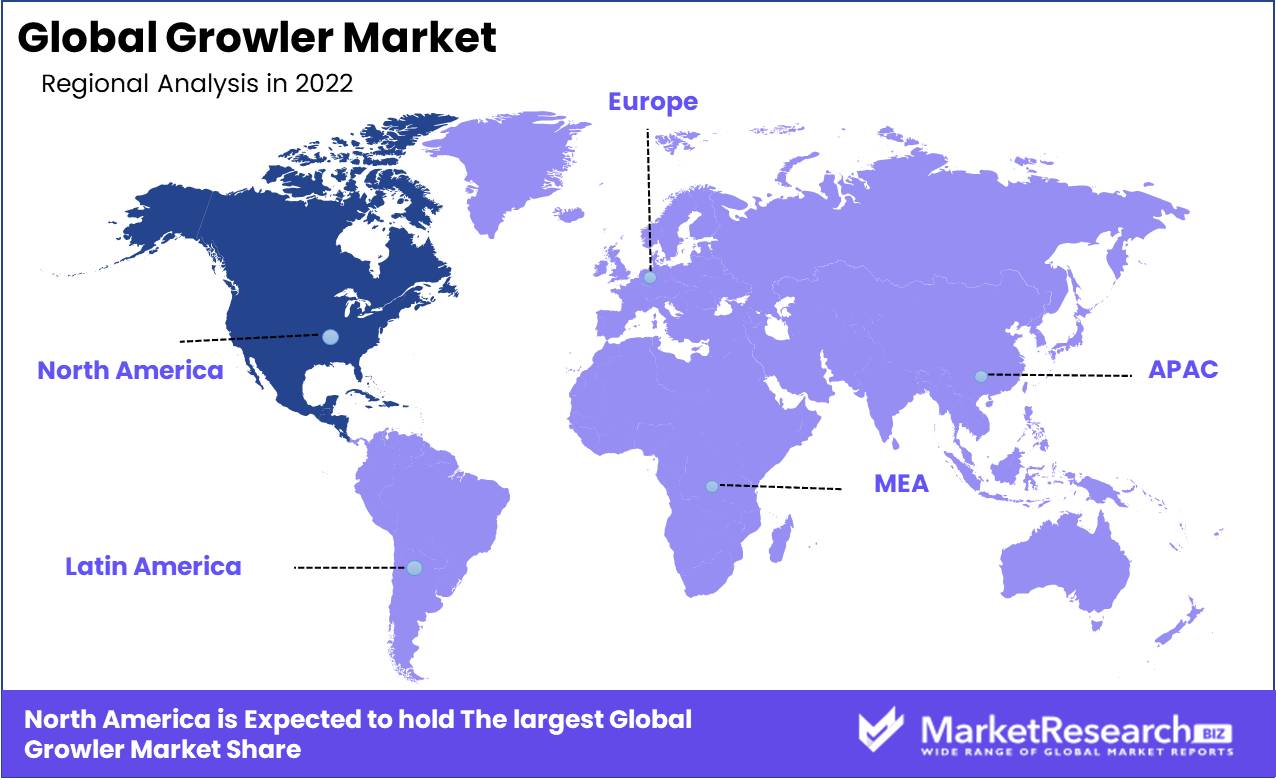
Regional Analysis
The growler market has experienced a considerable increase in demand, with North America emerging as the dominant Growler Market. Several factors, including the rise of the craft beer industry, the allure of bringing beer home from local breweries, and a growing preference for environmentally responsible packaging, have contributed to this trend. The craft beer explosion in North America has significantly contributed to the expansion of the growler market. There is an enormous demand for beer in North America, where there are over 8,000 craft breweries, and growlers are an excellent method for consumers to transport their favorite beers home after visiting a brewery.
In recent years, the number of craft breweries in North America has exploded, and many of these breweries are beginning to offer growlers as standard packaging options. This has increased the demand for growlers, thereby propelling the North American growler market. The desirability of bringing beer from local breweries home is another crucial factor in the growth of the growler market. Many beer enthusiasts enjoy consuming beer from local breweries, and growlers offer a convenient and affordable method for them to transport the beer home.
Growlers also allow beer enthusiasts to sample uncommon varieties of beer that are not readily available in stores. Growlers are an excellent method for consumers to experience seasonal and limited edition beer at home, as many breweries offer them. Growlers are also viewed as an eco-friendly packaging option, which has helped fuel the North American market. Growlers are reusable, unlike traditional bottles and cans, which reduces the amount of waste produced by the beer industry.
The increase in demand for eco-friendly packaging has also contributed to the expansion of the growler market. Many consumers are prepared to pay a premium for beer packaged in growlers due to the environmentally favorable nature of this container. North America has become the leading Growler Market for a number of reasons. The region's increase in craft breweries has increased demand for growlers. Growlers provide a cost-effective and environmentally friendly alternative for consumers who appreciate bringing beer home from local breweries.
Key Regions and Countries
North America
- US
- Canada
- Mexico
Western Europe
- Germany
- France
- The UK
- Spain
- Italy
- Portugal
- Ireland
- Austria
- Switzerland
- Benelux
- Nordic
- Rest of Western Europe
Eastern Europe
- Russia
- Poland
- The Czech Republic
- Greece
- Rest of Eastern Europe
APAC
- China
- Japan
- South Korea
- India
- Australia & New Zealand
- Indonesia
- Malaysia
- Philippines
- Singapore
- Thailand
- Vietnam
- Rest of APAC
Latin America
- Brazil
- Colombia
- Chile
- Argentina
- Costa Rica
- Rest of Latin America
Middle East & Africa
- Algeria
- Egypt
- Israel
- Kuwait
- Nigeria
- Saudi Arabia
- South Africa
- Turkey
- United Arab Emirates
- Rest of MEA
Key Players Analysis
The global growler market is experiencing significant expansion due to consumers' rising demand for premium beer. Numerous market leaders have emerged to provide consumers with high-quality and innovative growler products. DrinkTanks, Stanley, Hydro Flask, OtterBox, YETI, Miir, and Klean Kanteen are among these key participants.
DrinkTanks is a market leader, providing growlers made of stainless steel and outfitted with vacuum insulation technology. They offer a variety of products, including The Classic, The Juggernaut, and The Adventure series, among others, each uniquely designed to meet the needs of particular customers.
Since 1913, Stanley has been producing innovative growlers for outdoor enthusiasts. Their classic vacuum growlers with double-wall vacuum insulation technology are renowned for keeping beverages cool for up to 24 hours.
Another industry leader, Hydro Flask offers a variety of fashionable and durable growlers for outdoor enthusiasts. They provide a variety of growlers with insulation technology and powder-coated coatings in a range of hues.
Other notable market participants include OtterBox, YETI, Miir, and Klean Kanteen, each of which offers distinctive and innovative growlers to satisfy consumer demands. With these main actors driving innovation and competition, it is anticipated that the global growler market will continue to expand in the coming years.
Top Key Players in Growler Market
- Alpha Packaging
- William Croxsons & Sons Limited
- Ardagh Group S.A.
- Global Glass Solutions
- GrowlerWerks, Inc.
- The Boelter Companies
- DrinkTanks
- Zenan
- Orange Vessel Co.
- Berlin Packaging LLC
- Other Key Players
Recent Development
In 2023, GrowlerWerks is a manufacturer of growlers and filling systems. GrowlerWerks introduced the Crowler, a novel growler system. The Crowler is a stainless steel growler with a 32-ounce capacity. It is more durable than traditional glass growlers and can be filled with beer at a brewery or at home.
In 2023, Fillgrowler is a business that provides services for filling growlers. Fillgrowler introduced a new service named Fillgrowler Express. Fillgrowler Express is a delivery service that enables beer growlers to be ordered online and delivered within 30 minutes.
In 2023, Ubrew is a company that manufactures growlers and filling systems for growlers. Ubrew introduced the GrowlBot, a novel growler system. The GrowlBot is a stainless steel growler with a 64-ounce capacity. It is more durable than traditional glass growlers and can be filled with beer at a brewery or at home.Report Scope:
Report Features Description Market Value (2022) USD 465.7 Mn Forecast Revenue (2032) USD 633.1 Mn CAGR (2023-2032) 3.2% Base Year for Estimation 2022 Historic Period 2016-2022 Forecast Period 2023-2032 Report Coverage Revenue Forecast, Market Dynamics, COVID-19 Impact, Competitive Landscape, Recent Developments Segments Covered By Material Type (Glass, Metal, Plastic, Ceramic)
By Capacity (32 Oz, 64 Oz, 128 Oz)
By Application (Alcoholic, Beer, Wines, Others, Non-Alcoholic)
By Distribution Channel (Online, Offline)
By End-User (Commercial, Residential)Regional Analysis North America – The US, Canada, & Mexico; Western Europe – Germany, France, The UK, Spain, Italy, Portugal, Ireland, Austria, Switzerland, Benelux, Nordic, & Rest of Western Europe; Eastern Europe – Russia, Poland, The Czech Republic, Greece, & Rest of Eastern Europe; APAC – China, Japan, South Korea, India, Australia & New Zealand, Indonesia, Malaysia, Philippines, Singapore, Thailand, Vietnam, & Rest of APAC; Latin America – Brazil, Colombia, Chile, Argentina, Costa Rica, & Rest of Latin America; Middle East & Africa – Algeria, Egypt, Israel, Kuwait, Nigeria, Saudi Arabia, South Africa, Turkey, United Arab Emirates, & Rest of MEA Competitive Landscape Alpha Packaging, William Croxsons & Sons Limited, Ardagh Group S.A., Global Glass Solutions, GrowlerWerks, Inc., The Boelter Companies, DrinkTanks , Zenan , Orange Vessel Co., Berlin Packaging LLC, Other Key Players Customization Scope Customization for segments, region/country-level will be provided. Moreover, additional customization can be done based on the requirements. Purchase Options We have three licenses to opt for: Single User License, Multi-User License (Up to 5 Users), Corporate Use License (Unlimited User and Printable PDF) -
- 1. Executive Summary
- 1.1. Definition
- 1.2. Taxonomy
- 1.3. Research Scope
- 1.4. Key Analysis
- 1.5. Key Findings by Major Segments
- 1.6. Top strategies by Major Players
- 2. Global Growler Market Overview
- 2.1. Growler Market Dynamics
- 2.1.1. Drivers
- 2.1.2. Opportunities
- 2.1.3. Restraints
- 2.1.4. Challenges
- 2.2. Macro-economic Factors
- 2.3. Regulatory Framework
- 2.4. Market Investment Feasibility Index
- 2.5. PEST Analysis
- 2.6. PORTER’S Five Force Analysis
- 2.7. Drivers & Restraints Impact Analysis
- 2.8. Industry Chain Analysis
- 2.9. Cost Structure Analysis
- 2.10. Marketing Strategy
- 2.11. Russia-Ukraine War Impact Analysis
- 2.12. Opportunity Map Analysis
- 2.13. Market Competition Scenario Analysis
- 2.14. Product Life Cycle Analysis
- 2.15. Opportunity Orbits
- 2.16. Manufacturer Intensity Map
- 2.17. Major Companies sales by Value & Volume
- 2.1. Growler Market Dynamics
- 3. Global Growler Market Analysis, Opportunity and Forecast, 2016-2032
- 3.1. Global Growler Market Analysis, 2016-2021
- 3.2. Global Growler Market Opportunity and Forecast, 2023-2032
- 3.3. Global Growler Market Analysis, Opportunity and Forecast, By By Material Type, 2016-2032
- 3.3.1. Global Growler Market Analysis by By Material Type: Introduction
- 3.3.2. Market Size Absolute $ Opportunity Analysis and Forecast, By By Material Type, 2016-2032
- 3.3.3. Glass
- 3.3.4. Metal
- 3.3.5. Plastic
- 3.3.6. Ceramic
- 3.4. Global Growler Market Analysis, Opportunity and Forecast, By By Capacity, 2016-2032
- 3.4.1. Global Growler Market Analysis by By Capacity: Introduction
- 3.4.2. Market Size Absolute $ Opportunity Analysis and Forecast, By By Capacity, 2016-2032
- 3.4.3. 32 Oz
- 3.4.4. 64 Oz
- 3.4.5. 128 Oz
- 3.5. Global Growler Market Analysis, Opportunity and Forecast, By By Application, 2016-2032
- 3.5.1. Global Growler Market Analysis by By Application: Introduction
- 3.5.2. Market Size Absolute $ Opportunity Analysis and Forecast, By By Application, 2016-2032
- 3.5.3. Alcoholic
- 3.5.4. Beer
- 3.5.5. Wines
- 3.5.6. Non-Alcoholic
- 3.5.7. Others
- 3.6. Global Growler Market Analysis, Opportunity and Forecast, By By Distribution Channel, 2016-2032
- 3.6.1. Global Growler Market Analysis by By Distribution Channel: Introduction
- 3.6.2. Market Size Absolute $ Opportunity Analysis and Forecast, By By Distribution Channel, 2016-2032
- 3.6.3. Online
- 3.6.4. Offline
- 3.7. Global Growler Market Analysis, Opportunity and Forecast, By By End-User, 2016-2032
- 3.7.1. Global Growler Market Analysis by By End-User: Introduction
- 3.7.2. Market Size Absolute $ Opportunity Analysis and Forecast, By By End-User, 2016-2032
- 3.7.3. Commercial
- 3.7.4. Residential
- 4. North America Growler Market Analysis, Opportunity and Forecast, 2016-2032
- 4.1. North America Growler Market Analysis, 2016-2021
- 4.2. North America Growler Market Opportunity and Forecast, 2023-2032
- 4.3. North America Growler Market Analysis, Opportunity and Forecast, By By Material Type, 2016-2032
- 4.3.1. North America Growler Market Analysis by By Material Type: Introduction
- 4.3.2. Market Size Absolute $ Opportunity Analysis and Forecast, By By Material Type, 2016-2032
- 4.3.3. Glass
- 4.3.4. Metal
- 4.3.5. Plastic
- 4.3.6. Ceramic
- 4.4. North America Growler Market Analysis, Opportunity and Forecast, By By Capacity, 2016-2032
- 4.4.1. North America Growler Market Analysis by By Capacity: Introduction
- 4.4.2. Market Size Absolute $ Opportunity Analysis and Forecast, By By Capacity, 2016-2032
- 4.4.3. 32 Oz
- 4.4.4. 64 Oz
- 4.4.5. 128 Oz
- 4.5. North America Growler Market Analysis, Opportunity and Forecast, By By Application, 2016-2032
- 4.5.1. North America Growler Market Analysis by By Application: Introduction
- 4.5.2. Market Size Absolute $ Opportunity Analysis and Forecast, By By Application, 2016-2032
- 4.5.3. Alcoholic
- 4.5.4. Beer
- 4.5.5. Wines
- 4.5.6. Non-Alcoholic
- 4.5.7. Others
- 4.6. North America Growler Market Analysis, Opportunity and Forecast, By By Distribution Channel, 2016-2032
- 4.6.1. North America Growler Market Analysis by By Distribution Channel: Introduction
- 4.6.2. Market Size Absolute $ Opportunity Analysis and Forecast, By By Distribution Channel, 2016-2032
- 4.6.3. Online
- 4.6.4. Offline
- 4.7. North America Growler Market Analysis, Opportunity and Forecast, By By End-User, 2016-2032
- 4.7.1. North America Growler Market Analysis by By End-User: Introduction
- 4.7.2. Market Size Absolute $ Opportunity Analysis and Forecast, By By End-User, 2016-2032
- 4.7.3. Commercial
- 4.7.4. Residential
- 4.8. North America Growler Market Analysis, Opportunity and Forecast, By Country , 2016-2032
- 4.8.1. North America Growler Market Analysis by Country : Introduction
- 4.8.2. Market Size Absolute $ Opportunity Analysis and Forecast, Country , 2016-2032
- 4.8.2.1. The US
- 4.8.2.2. Canada
- 4.8.2.3. Mexico
- 5. Western Europe Growler Market Analysis, Opportunity and Forecast, 2016-2032
- 5.1. Western Europe Growler Market Analysis, 2016-2021
- 5.2. Western Europe Growler Market Opportunity and Forecast, 2023-2032
- 5.3. Western Europe Growler Market Analysis, Opportunity and Forecast, By By Material Type, 2016-2032
- 5.3.1. Western Europe Growler Market Analysis by By Material Type: Introduction
- 5.3.2. Market Size Absolute $ Opportunity Analysis and Forecast, By By Material Type, 2016-2032
- 5.3.3. Glass
- 5.3.4. Metal
- 5.3.5. Plastic
- 5.3.6. Ceramic
- 5.4. Western Europe Growler Market Analysis, Opportunity and Forecast, By By Capacity, 2016-2032
- 5.4.1. Western Europe Growler Market Analysis by By Capacity: Introduction
- 5.4.2. Market Size Absolute $ Opportunity Analysis and Forecast, By By Capacity, 2016-2032
- 5.4.3. 32 Oz
- 5.4.4. 64 Oz
- 5.4.5. 128 Oz
- 5.5. Western Europe Growler Market Analysis, Opportunity and Forecast, By By Application, 2016-2032
- 5.5.1. Western Europe Growler Market Analysis by By Application: Introduction
- 5.5.2. Market Size Absolute $ Opportunity Analysis and Forecast, By By Application, 2016-2032
- 5.5.3. Alcoholic
- 5.5.4. Beer
- 5.5.5. Wines
- 5.5.6. Non-Alcoholic
- 5.5.7. Others
- 5.6. Western Europe Growler Market Analysis, Opportunity and Forecast, By By Distribution Channel, 2016-2032
- 5.6.1. Western Europe Growler Market Analysis by By Distribution Channel: Introduction
- 5.6.2. Market Size Absolute $ Opportunity Analysis and Forecast, By By Distribution Channel, 2016-2032
- 5.6.3. Online
- 5.6.4. Offline
- 5.7. Western Europe Growler Market Analysis, Opportunity and Forecast, By By End-User, 2016-2032
- 5.7.1. Western Europe Growler Market Analysis by By End-User: Introduction
- 5.7.2. Market Size Absolute $ Opportunity Analysis and Forecast, By By End-User, 2016-2032
- 5.7.3. Commercial
- 5.7.4. Residential
- 5.8. Western Europe Growler Market Analysis, Opportunity and Forecast, By Country , 2016-2032
- 5.8.1. Western Europe Growler Market Analysis by Country : Introduction
- 5.8.2. Market Size Absolute $ Opportunity Analysis and Forecast, Country , 2016-2032
- 5.8.2.1. Germany
- 5.8.2.2. France
- 5.8.2.3. The UK
- 5.8.2.4. Spain
- 5.8.2.5. Italy
- 5.8.2.6. Portugal
- 5.8.2.7. Ireland
- 5.8.2.8. Austria
- 5.8.2.9. Switzerland
- 5.8.2.10. Benelux
- 5.8.2.11. Nordic
- 5.8.2.12. Rest of Western Europe
- 6. Eastern Europe Growler Market Analysis, Opportunity and Forecast, 2016-2032
- 6.1. Eastern Europe Growler Market Analysis, 2016-2021
- 6.2. Eastern Europe Growler Market Opportunity and Forecast, 2023-2032
- 6.3. Eastern Europe Growler Market Analysis, Opportunity and Forecast, By By Material Type, 2016-2032
- 6.3.1. Eastern Europe Growler Market Analysis by By Material Type: Introduction
- 6.3.2. Market Size Absolute $ Opportunity Analysis and Forecast, By By Material Type, 2016-2032
- 6.3.3. Glass
- 6.3.4. Metal
- 6.3.5. Plastic
- 6.3.6. Ceramic
- 6.4. Eastern Europe Growler Market Analysis, Opportunity and Forecast, By By Capacity, 2016-2032
- 6.4.1. Eastern Europe Growler Market Analysis by By Capacity: Introduction
- 6.4.2. Market Size Absolute $ Opportunity Analysis and Forecast, By By Capacity, 2016-2032
- 6.4.3. 32 Oz
- 6.4.4. 64 Oz
- 6.4.5. 128 Oz
- 6.5. Eastern Europe Growler Market Analysis, Opportunity and Forecast, By By Application, 2016-2032
- 6.5.1. Eastern Europe Growler Market Analysis by By Application: Introduction
- 6.5.2. Market Size Absolute $ Opportunity Analysis and Forecast, By By Application, 2016-2032
- 6.5.3. Alcoholic
- 6.5.4. Beer
- 6.5.5. Wines
- 6.5.6. Non-Alcoholic
- 6.5.7. Others
- 6.6. Eastern Europe Growler Market Analysis, Opportunity and Forecast, By By Distribution Channel, 2016-2032
- 6.6.1. Eastern Europe Growler Market Analysis by By Distribution Channel: Introduction
- 6.6.2. Market Size Absolute $ Opportunity Analysis and Forecast, By By Distribution Channel, 2016-2032
- 6.6.3. Online
- 6.6.4. Offline
- 6.7. Eastern Europe Growler Market Analysis, Opportunity and Forecast, By By End-User, 2016-2032
- 6.7.1. Eastern Europe Growler Market Analysis by By End-User: Introduction
- 6.7.2. Market Size Absolute $ Opportunity Analysis and Forecast, By By End-User, 2016-2032
- 6.7.3. Commercial
- 6.7.4. Residential
- 6.8. Eastern Europe Growler Market Analysis, Opportunity and Forecast, By Country , 2016-2032
- 6.8.1. Eastern Europe Growler Market Analysis by Country : Introduction
- 6.8.2. Market Size Absolute $ Opportunity Analysis and Forecast, Country , 2016-2032
- 6.8.2.1. Russia
- 6.8.2.2. Poland
- 6.8.2.3. The Czech Republic
- 6.8.2.4. Greece
- 6.8.2.5. Rest of Eastern Europe
- 7. APAC Growler Market Analysis, Opportunity and Forecast, 2016-2032
- 7.1. APAC Growler Market Analysis, 2016-2021
- 7.2. APAC Growler Market Opportunity and Forecast, 2023-2032
- 7.3. APAC Growler Market Analysis, Opportunity and Forecast, By By Material Type, 2016-2032
- 7.3.1. APAC Growler Market Analysis by By Material Type: Introduction
- 7.3.2. Market Size Absolute $ Opportunity Analysis and Forecast, By By Material Type, 2016-2032
- 7.3.3. Glass
- 7.3.4. Metal
- 7.3.5. Plastic
- 7.3.6. Ceramic
- 7.4. APAC Growler Market Analysis, Opportunity and Forecast, By By Capacity, 2016-2032
- 7.4.1. APAC Growler Market Analysis by By Capacity: Introduction
- 7.4.2. Market Size Absolute $ Opportunity Analysis and Forecast, By By Capacity, 2016-2032
- 7.4.3. 32 Oz
- 7.4.4. 64 Oz
- 7.4.5. 128 Oz
- 7.5. APAC Growler Market Analysis, Opportunity and Forecast, By By Application, 2016-2032
- 7.5.1. APAC Growler Market Analysis by By Application: Introduction
- 7.5.2. Market Size Absolute $ Opportunity Analysis and Forecast, By By Application, 2016-2032
- 7.5.3. Alcoholic
- 7.5.4. Beer
- 7.5.5. Wines
- 7.5.6. Non-Alcoholic
- 7.5.7. Others
- 7.6. APAC Growler Market Analysis, Opportunity and Forecast, By By Distribution Channel, 2016-2032
- 7.6.1. APAC Growler Market Analysis by By Distribution Channel: Introduction
- 7.6.2. Market Size Absolute $ Opportunity Analysis and Forecast, By By Distribution Channel, 2016-2032
- 7.6.3. Online
- 7.6.4. Offline
- 7.7. APAC Growler Market Analysis, Opportunity and Forecast, By By End-User, 2016-2032
- 7.7.1. APAC Growler Market Analysis by By End-User: Introduction
- 7.7.2. Market Size Absolute $ Opportunity Analysis and Forecast, By By End-User, 2016-2032
- 7.7.3. Commercial
- 7.7.4. Residential
- 7.8. APAC Growler Market Analysis, Opportunity and Forecast, By Country , 2016-2032
- 7.8.1. APAC Growler Market Analysis by Country : Introduction
- 7.8.2. Market Size Absolute $ Opportunity Analysis and Forecast, Country , 2016-2032
- 7.8.2.1. China
- 7.8.2.2. Japan
- 7.8.2.3. South Korea
- 7.8.2.4. India
- 7.8.2.5. Australia & New Zeland
- 7.8.2.6. Indonesia
- 7.8.2.7. Malaysia
- 7.8.2.8. Philippines
- 7.8.2.9. Singapore
- 7.8.2.10. Thailand
- 7.8.2.11. Vietnam
- 7.8.2.12. Rest of APAC
- 8. Latin America Growler Market Analysis, Opportunity and Forecast, 2016-2032
- 8.1. Latin America Growler Market Analysis, 2016-2021
- 8.2. Latin America Growler Market Opportunity and Forecast, 2023-2032
- 8.3. Latin America Growler Market Analysis, Opportunity and Forecast, By By Material Type, 2016-2032
- 8.3.1. Latin America Growler Market Analysis by By Material Type: Introduction
- 8.3.2. Market Size Absolute $ Opportunity Analysis and Forecast, By By Material Type, 2016-2032
- 8.3.3. Glass
- 8.3.4. Metal
- 8.3.5. Plastic
- 8.3.6. Ceramic
- 8.4. Latin America Growler Market Analysis, Opportunity and Forecast, By By Capacity, 2016-2032
- 8.4.1. Latin America Growler Market Analysis by By Capacity: Introduction
- 8.4.2. Market Size Absolute $ Opportunity Analysis and Forecast, By By Capacity, 2016-2032
- 8.4.3. 32 Oz
- 8.4.4. 64 Oz
- 8.4.5. 128 Oz
- 8.5. Latin America Growler Market Analysis, Opportunity and Forecast, By By Application, 2016-2032
- 8.5.1. Latin America Growler Market Analysis by By Application: Introduction
- 8.5.2. Market Size Absolute $ Opportunity Analysis and Forecast, By By Application, 2016-2032
- 8.5.3. Alcoholic
- 8.5.4. Beer
- 8.5.5. Wines
- 8.5.6. Non-Alcoholic
- 8.5.7. Others
- 8.6. Latin America Growler Market Analysis, Opportunity and Forecast, By By Distribution Channel, 2016-2032
- 8.6.1. Latin America Growler Market Analysis by By Distribution Channel: Introduction
- 8.6.2. Market Size Absolute $ Opportunity Analysis and Forecast, By By Distribution Channel, 2016-2032
- 8.6.3. Online
- 8.6.4. Offline
- 8.7. Latin America Growler Market Analysis, Opportunity and Forecast, By By End-User, 2016-2032
- 8.7.1. Latin America Growler Market Analysis by By End-User: Introduction
- 8.7.2. Market Size Absolute $ Opportunity Analysis and Forecast, By By End-User, 2016-2032
- 8.7.3. Commercial
- 8.7.4. Residential
- 8.8. Latin America Growler Market Analysis, Opportunity and Forecast, By Country , 2016-2032
- 8.8.1. Latin America Growler Market Analysis by Country : Introduction
- 8.8.2. Market Size Absolute $ Opportunity Analysis and Forecast, Country , 2016-2032
- 8.8.2.1. Brazil
- 8.8.2.2. Colombia
- 8.8.2.3. Chile
- 8.8.2.4. Argentina
- 8.8.2.5. Costa Rica
- 8.8.2.6. Rest of Latin America
- 9. Middle East & Africa Growler Market Analysis, Opportunity and Forecast, 2016-2032
- 9.1. Middle East & Africa Growler Market Analysis, 2016-2021
- 9.2. Middle East & Africa Growler Market Opportunity and Forecast, 2023-2032
- 9.3. Middle East & Africa Growler Market Analysis, Opportunity and Forecast, By By Material Type, 2016-2032
- 9.3.1. Middle East & Africa Growler Market Analysis by By Material Type: Introduction
- 9.3.2. Market Size Absolute $ Opportunity Analysis and Forecast, By By Material Type, 2016-2032
- 9.3.3. Glass
- 9.3.4. Metal
- 9.3.5. Plastic
- 9.3.6. Ceramic
- 9.4. Middle East & Africa Growler Market Analysis, Opportunity and Forecast, By By Capacity, 2016-2032
- 9.4.1. Middle East & Africa Growler Market Analysis by By Capacity: Introduction
- 9.4.2. Market Size Absolute $ Opportunity Analysis and Forecast, By By Capacity, 2016-2032
- 9.4.3. 32 Oz
- 9.4.4. 64 Oz
- 9.4.5. 128 Oz
- 9.5. Middle East & Africa Growler Market Analysis, Opportunity and Forecast, By By Application, 2016-2032
- 9.5.1. Middle East & Africa Growler Market Analysis by By Application: Introduction
- 9.5.2. Market Size Absolute $ Opportunity Analysis and Forecast, By By Application, 2016-2032
- 9.5.3. Alcoholic
- 9.5.4. Beer
- 9.5.5. Wines
- 9.5.6. Non-Alcoholic
- 9.5.7. Others
- 9.6. Middle East & Africa Growler Market Analysis, Opportunity and Forecast, By By Distribution Channel, 2016-2032
- 9.6.1. Middle East & Africa Growler Market Analysis by By Distribution Channel: Introduction
- 9.6.2. Market Size Absolute $ Opportunity Analysis and Forecast, By By Distribution Channel, 2016-2032
- 9.6.3. Online
- 9.6.4. Offline
- 9.7. Middle East & Africa Growler Market Analysis, Opportunity and Forecast, By By End-User, 2016-2032
- 9.7.1. Middle East & Africa Growler Market Analysis by By End-User: Introduction
- 9.7.2. Market Size Absolute $ Opportunity Analysis and Forecast, By By End-User, 2016-2032
- 9.7.3. Commercial
- 9.7.4. Residential
- 9.8. Middle East & Africa Growler Market Analysis, Opportunity and Forecast, By Country , 2016-2032
- 9.8.1. Middle East & Africa Growler Market Analysis by Country : Introduction
- 9.8.2. Market Size Absolute $ Opportunity Analysis and Forecast, Country , 2016-2032
- 9.8.2.1. Algeria
- 9.8.2.2. Egypt
- 9.8.2.3. Israel
- 9.8.2.4. Kuwait
- 9.8.2.5. Nigeria
- 9.8.2.6. Saudi Arabia
- 9.8.2.7. South Africa
- 9.8.2.8. Turkey
- 9.8.2.9. The UAE
- 9.8.2.10. Rest of MEA
- 10. Global Growler Market Analysis, Opportunity and Forecast, By Region , 2016-2032
- 10.1. Global Growler Market Analysis by Region : Introduction
- 10.2. Market Size Absolute $ Opportunity Analysis and Forecast, By Region , 2016-2032
- 10.2.1. North America
- 10.2.2. Western Europe
- 10.2.3. Eastern Europe
- 10.2.4. APAC
- 10.2.5. Latin America
- 10.2.6. Middle East & Africa
- 11. Global Growler Market Competitive Landscape, Market Share Analysis, and Company Profiles
- 11.1. Market Share Analysis
- 11.2. Company Profiles
- 11.3. Alpha Packaging
- 11.3.1. Company Overview
- 11.3.2. Financial Highlights
- 11.3.3. Product Portfolio
- 11.3.4. SWOT Analysis
- 11.3.5. Key Strategies and Developments
- 11.4. William Croxsons & Sons Limited
- 11.4.1. Company Overview
- 11.4.2. Financial Highlights
- 11.4.3. Product Portfolio
- 11.4.4. SWOT Analysis
- 11.4.5. Key Strategies and Developments
- 11.5. Ardagh Group S.A.
- 11.5.1. Company Overview
- 11.5.2. Financial Highlights
- 11.5.3. Product Portfolio
- 11.5.4. SWOT Analysis
- 11.5.5. Key Strategies and Developments
- 11.6. Global Glass Solutions
- 11.6.1. Company Overview
- 11.6.2. Financial Highlights
- 11.6.3. Product Portfolio
- 11.6.4. SWOT Analysis
- 11.6.5. Key Strategies and Developments
- 11.7. GrowlerWerks
- 11.7.1. Company Overview
- 11.7.2. Financial Highlights
- 11.7.3. Product Portfolio
- 11.7.4. SWOT Analysis
- 11.7.5. Key Strategies and Developments
- 11.8. Inc.
- 11.8.1. Company Overview
- 11.8.2. Financial Highlights
- 11.8.3. Product Portfolio
- 11.8.4. SWOT Analysis
- 11.8.5. Key Strategies and Developments
- 11.9. The Boelter Companies
- 11.9.1. Company Overview
- 11.9.2. Financial Highlights
- 11.9.3. Product Portfolio
- 11.9.4. SWOT Analysis
- 11.9.5. Key Strategies and Developments
- 11.10. DrinkTanks
- 11.10.1. Company Overview
- 11.10.2. Financial Highlights
- 11.10.3. Product Portfolio
- 11.10.4. SWOT Analysis
- 11.10.5. Key Strategies and Developments
- 11.11. Zenan
- 11.11.1. Company Overview
- 11.11.2. Financial Highlights
- 11.11.3. Product Portfolio
- 11.11.4. SWOT Analysis
- 11.11.5. Key Strategies and Developments
- 11.12. Orange Vessel Co.
- 11.12.1. Company Overview
- 11.12.2. Financial Highlights
- 11.12.3. Product Portfolio
- 11.12.4. SWOT Analysis
- 11.12.5. Key Strategies and Developments
- 11.13. Berlin Packaging LLC
- 11.13.1. Company Overview
- 11.13.2. Financial Highlights
- 11.13.3. Product Portfolio
- 11.13.4. SWOT Analysis
- 11.13.5. Key Strategies and Developments
- 11.14. Other Key Players
- 11.14.1. Company Overview
- 11.14.2. Financial Highlights
- 11.14.3. Product Portfolio
- 11.14.4. SWOT Analysis
- 11.14.5. Key Strategies and Developments
- 12. Assumptions and Acronyms
- 13. Research Methodology
- 14. Contact
- List of Figures
- Figure 1: Global Growler Market Revenue (US$ Mn) Market Share by By Material Type in 2022
- Figure 2: Global Growler Market Attractiveness Analysis by By Material Type, 2016-2032
- Figure 3: Global Growler Market Revenue (US$ Mn) Market Share by By Capacityin 2022
- Figure 4: Global Growler Market Attractiveness Analysis by By Capacity, 2016-2032
- Figure 5: Global Growler Market Revenue (US$ Mn) Market Share by By Applicationin 2022
- Figure 6: Global Growler Market Attractiveness Analysis by By Application, 2016-2032
- Figure 7: Global Growler Market Revenue (US$ Mn) Market Share by By Distribution Channelin 2022
- Figure 8: Global Growler Market Attractiveness Analysis by By Distribution Channel, 2016-2032
- Figure 9: Global Growler Market Revenue (US$ Mn) Market Share by By End-Userin 2022
- Figure 10: Global Growler Market Attractiveness Analysis by By End-User, 2016-2032
- Figure 11: Global Growler Market Revenue (US$ Mn) Market Share by Region in 2022
- Figure 12: Global Growler Market Attractiveness Analysis by Region, 2016-2032
- Figure 13: Global Growler Market Revenue (US$ Mn) (2016-2032)
- Figure 14: Global Growler Market Revenue (US$ Mn) Comparison by Region (2016-2032)
- Figure 15: Global Growler Market Revenue (US$ Mn) Comparison by By Material Type (2016-2032)
- Figure 16: Global Growler Market Revenue (US$ Mn) Comparison by By Capacity (2016-2032)
- Figure 17: Global Growler Market Revenue (US$ Mn) Comparison by By Application (2016-2032)
- Figure 18: Global Growler Market Revenue (US$ Mn) Comparison by By Distribution Channel (2016-2032)
- Figure 19: Global Growler Market Revenue (US$ Mn) Comparison by By End-User (2016-2032)
- Figure 20: Global Growler Market Y-o-Y Growth Rate Comparison by Region (2016-2032)
- Figure 21: Global Growler Market Y-o-Y Growth Rate Comparison by By Material Type (2016-2032)
- Figure 22: Global Growler Market Y-o-Y Growth Rate Comparison by By Capacity (2016-2032)
- Figure 23: Global Growler Market Y-o-Y Growth Rate Comparison by By Application (2016-2032)
- Figure 24: Global Growler Market Y-o-Y Growth Rate Comparison by By Distribution Channel (2016-2032)
- Figure 25: Global Growler Market Y-o-Y Growth Rate Comparison by By End-User (2016-2032)
- Figure 26: Global Growler Market Share Comparison by Region (2016-2032)
- Figure 27: Global Growler Market Share Comparison by By Material Type (2016-2032)
- Figure 28: Global Growler Market Share Comparison by By Capacity (2016-2032)
- Figure 29: Global Growler Market Share Comparison by By Application (2016-2032)
- Figure 30: Global Growler Market Share Comparison by By Distribution Channel (2016-2032)
- Figure 31: Global Growler Market Share Comparison by By End-User (2016-2032)
- Figure 32: North America Growler Market Revenue (US$ Mn) Market Share by By Material Typein 2022
- Figure 33: North America Growler Market Attractiveness Analysis by By Material Type, 2016-2032
- Figure 34: North America Growler Market Revenue (US$ Mn) Market Share by By Capacityin 2022
- Figure 35: North America Growler Market Attractiveness Analysis by By Capacity, 2016-2032
- Figure 36: North America Growler Market Revenue (US$ Mn) Market Share by By Applicationin 2022
- Figure 37: North America Growler Market Attractiveness Analysis by By Application, 2016-2032
- Figure 38: North America Growler Market Revenue (US$ Mn) Market Share by By Distribution Channelin 2022
- Figure 39: North America Growler Market Attractiveness Analysis by By Distribution Channel, 2016-2032
- Figure 40: North America Growler Market Revenue (US$ Mn) Market Share by By End-Userin 2022
- Figure 41: North America Growler Market Attractiveness Analysis by By End-User, 2016-2032
- Figure 42: North America Growler Market Revenue (US$ Mn) Market Share by Country in 2022
- Figure 43: North America Growler Market Attractiveness Analysis by Country, 2016-2032
- Figure 44: North America Growler Market Revenue (US$ Mn) (2016-2032)
- Figure 45: North America Growler Market Revenue (US$ Mn) Comparison by Country (2016-2032)
- Figure 46: North America Growler Market Revenue (US$ Mn) Comparison by By Material Type (2016-2032)
- Figure 47: North America Growler Market Revenue (US$ Mn) Comparison by By Capacity (2016-2032)
- Figure 48: North America Growler Market Revenue (US$ Mn) Comparison by By Application (2016-2032)
- Figure 49: North America Growler Market Revenue (US$ Mn) Comparison by By Distribution Channel (2016-2032)
- Figure 50: North America Growler Market Revenue (US$ Mn) Comparison by By End-User (2016-2032)
- Figure 51: North America Growler Market Y-o-Y Growth Rate Comparison by Country (2016-2032)
- Figure 52: North America Growler Market Y-o-Y Growth Rate Comparison by By Material Type (2016-2032)
- Figure 53: North America Growler Market Y-o-Y Growth Rate Comparison by By Capacity (2016-2032)
- Figure 54: North America Growler Market Y-o-Y Growth Rate Comparison by By Application (2016-2032)
- Figure 55: North America Growler Market Y-o-Y Growth Rate Comparison by By Distribution Channel (2016-2032)
- Figure 56: North America Growler Market Y-o-Y Growth Rate Comparison by By End-User (2016-2032)
- Figure 57: North America Growler Market Share Comparison by Country (2016-2032)
- Figure 58: North America Growler Market Share Comparison by By Material Type (2016-2032)
- Figure 59: North America Growler Market Share Comparison by By Capacity (2016-2032)
- Figure 60: North America Growler Market Share Comparison by By Application (2016-2032)
- Figure 61: North America Growler Market Share Comparison by By Distribution Channel (2016-2032)
- Figure 62: North America Growler Market Share Comparison by By End-User (2016-2032)
- Figure 63: Western Europe Growler Market Revenue (US$ Mn) Market Share by By Material Typein 2022
- Figure 64: Western Europe Growler Market Attractiveness Analysis by By Material Type, 2016-2032
- Figure 65: Western Europe Growler Market Revenue (US$ Mn) Market Share by By Capacityin 2022
- Figure 66: Western Europe Growler Market Attractiveness Analysis by By Capacity, 2016-2032
- Figure 67: Western Europe Growler Market Revenue (US$ Mn) Market Share by By Applicationin 2022
- Figure 68: Western Europe Growler Market Attractiveness Analysis by By Application, 2016-2032
- Figure 69: Western Europe Growler Market Revenue (US$ Mn) Market Share by By Distribution Channelin 2022
- Figure 70: Western Europe Growler Market Attractiveness Analysis by By Distribution Channel, 2016-2032
- Figure 71: Western Europe Growler Market Revenue (US$ Mn) Market Share by By End-Userin 2022
- Figure 72: Western Europe Growler Market Attractiveness Analysis by By End-User, 2016-2032
- Figure 73: Western Europe Growler Market Revenue (US$ Mn) Market Share by Country in 2022
- Figure 74: Western Europe Growler Market Attractiveness Analysis by Country, 2016-2032
- Figure 75: Western Europe Growler Market Revenue (US$ Mn) (2016-2032)
- Figure 76: Western Europe Growler Market Revenue (US$ Mn) Comparison by Country (2016-2032)
- Figure 77: Western Europe Growler Market Revenue (US$ Mn) Comparison by By Material Type (2016-2032)
- Figure 78: Western Europe Growler Market Revenue (US$ Mn) Comparison by By Capacity (2016-2032)
- Figure 79: Western Europe Growler Market Revenue (US$ Mn) Comparison by By Application (2016-2032)
- Figure 80: Western Europe Growler Market Revenue (US$ Mn) Comparison by By Distribution Channel (2016-2032)
- Figure 81: Western Europe Growler Market Revenue (US$ Mn) Comparison by By End-User (2016-2032)
- Figure 82: Western Europe Growler Market Y-o-Y Growth Rate Comparison by Country (2016-2032)
- Figure 83: Western Europe Growler Market Y-o-Y Growth Rate Comparison by By Material Type (2016-2032)
- Figure 84: Western Europe Growler Market Y-o-Y Growth Rate Comparison by By Capacity (2016-2032)
- Figure 85: Western Europe Growler Market Y-o-Y Growth Rate Comparison by By Application (2016-2032)
- Figure 86: Western Europe Growler Market Y-o-Y Growth Rate Comparison by By Distribution Channel (2016-2032)
- Figure 87: Western Europe Growler Market Y-o-Y Growth Rate Comparison by By End-User (2016-2032)
- Figure 88: Western Europe Growler Market Share Comparison by Country (2016-2032)
- Figure 89: Western Europe Growler Market Share Comparison by By Material Type (2016-2032)
- Figure 90: Western Europe Growler Market Share Comparison by By Capacity (2016-2032)
- Figure 91: Western Europe Growler Market Share Comparison by By Application (2016-2032)
- Figure 92: Western Europe Growler Market Share Comparison by By Distribution Channel (2016-2032)
- Figure 93: Western Europe Growler Market Share Comparison by By End-User (2016-2032)
- Figure 94: Eastern Europe Growler Market Revenue (US$ Mn) Market Share by By Material Typein 2022
- Figure 95: Eastern Europe Growler Market Attractiveness Analysis by By Material Type, 2016-2032
- Figure 96: Eastern Europe Growler Market Revenue (US$ Mn) Market Share by By Capacityin 2022
- Figure 97: Eastern Europe Growler Market Attractiveness Analysis by By Capacity, 2016-2032
- Figure 98: Eastern Europe Growler Market Revenue (US$ Mn) Market Share by By Applicationin 2022
- Figure 99: Eastern Europe Growler Market Attractiveness Analysis by By Application, 2016-2032
- Figure 100: Eastern Europe Growler Market Revenue (US$ Mn) Market Share by By Distribution Channelin 2022
- Figure 101: Eastern Europe Growler Market Attractiveness Analysis by By Distribution Channel, 2016-2032
- Figure 102: Eastern Europe Growler Market Revenue (US$ Mn) Market Share by By End-Userin 2022
- Figure 103: Eastern Europe Growler Market Attractiveness Analysis by By End-User, 2016-2032
- Figure 104: Eastern Europe Growler Market Revenue (US$ Mn) Market Share by Country in 2022
- Figure 105: Eastern Europe Growler Market Attractiveness Analysis by Country, 2016-2032
- Figure 106: Eastern Europe Growler Market Revenue (US$ Mn) (2016-2032)
- Figure 107: Eastern Europe Growler Market Revenue (US$ Mn) Comparison by Country (2016-2032)
- Figure 108: Eastern Europe Growler Market Revenue (US$ Mn) Comparison by By Material Type (2016-2032)
- Figure 109: Eastern Europe Growler Market Revenue (US$ Mn) Comparison by By Capacity (2016-2032)
- Figure 110: Eastern Europe Growler Market Revenue (US$ Mn) Comparison by By Application (2016-2032)
- Figure 111: Eastern Europe Growler Market Revenue (US$ Mn) Comparison by By Distribution Channel (2016-2032)
- Figure 112: Eastern Europe Growler Market Revenue (US$ Mn) Comparison by By End-User (2016-2032)
- Figure 113: Eastern Europe Growler Market Y-o-Y Growth Rate Comparison by Country (2016-2032)
- Figure 114: Eastern Europe Growler Market Y-o-Y Growth Rate Comparison by By Material Type (2016-2032)
- Figure 115: Eastern Europe Growler Market Y-o-Y Growth Rate Comparison by By Capacity (2016-2032)
- Figure 116: Eastern Europe Growler Market Y-o-Y Growth Rate Comparison by By Application (2016-2032)
- Figure 117: Eastern Europe Growler Market Y-o-Y Growth Rate Comparison by By Distribution Channel (2016-2032)
- Figure 118: Eastern Europe Growler Market Y-o-Y Growth Rate Comparison by By End-User (2016-2032)
- Figure 119: Eastern Europe Growler Market Share Comparison by Country (2016-2032)
- Figure 120: Eastern Europe Growler Market Share Comparison by By Material Type (2016-2032)
- Figure 121: Eastern Europe Growler Market Share Comparison by By Capacity (2016-2032)
- Figure 122: Eastern Europe Growler Market Share Comparison by By Application (2016-2032)
- Figure 123: Eastern Europe Growler Market Share Comparison by By Distribution Channel (2016-2032)
- Figure 124: Eastern Europe Growler Market Share Comparison by By End-User (2016-2032)
- Figure 125: APAC Growler Market Revenue (US$ Mn) Market Share by By Material Typein 2022
- Figure 126: APAC Growler Market Attractiveness Analysis by By Material Type, 2016-2032
- Figure 127: APAC Growler Market Revenue (US$ Mn) Market Share by By Capacityin 2022
- Figure 128: APAC Growler Market Attractiveness Analysis by By Capacity, 2016-2032
- Figure 129: APAC Growler Market Revenue (US$ Mn) Market Share by By Applicationin 2022
- Figure 130: APAC Growler Market Attractiveness Analysis by By Application, 2016-2032
- Figure 131: APAC Growler Market Revenue (US$ Mn) Market Share by By Distribution Channelin 2022
- Figure 132: APAC Growler Market Attractiveness Analysis by By Distribution Channel, 2016-2032
- Figure 133: APAC Growler Market Revenue (US$ Mn) Market Share by By End-Userin 2022
- Figure 134: APAC Growler Market Attractiveness Analysis by By End-User, 2016-2032
- Figure 135: APAC Growler Market Revenue (US$ Mn) Market Share by Country in 2022
- Figure 136: APAC Growler Market Attractiveness Analysis by Country, 2016-2032
- Figure 137: APAC Growler Market Revenue (US$ Mn) (2016-2032)
- Figure 138: APAC Growler Market Revenue (US$ Mn) Comparison by Country (2016-2032)
- Figure 139: APAC Growler Market Revenue (US$ Mn) Comparison by By Material Type (2016-2032)
- Figure 140: APAC Growler Market Revenue (US$ Mn) Comparison by By Capacity (2016-2032)
- Figure 141: APAC Growler Market Revenue (US$ Mn) Comparison by By Application (2016-2032)
- Figure 142: APAC Growler Market Revenue (US$ Mn) Comparison by By Distribution Channel (2016-2032)
- Figure 143: APAC Growler Market Revenue (US$ Mn) Comparison by By End-User (2016-2032)
- Figure 144: APAC Growler Market Y-o-Y Growth Rate Comparison by Country (2016-2032)
- Figure 145: APAC Growler Market Y-o-Y Growth Rate Comparison by By Material Type (2016-2032)
- Figure 146: APAC Growler Market Y-o-Y Growth Rate Comparison by By Capacity (2016-2032)
- Figure 147: APAC Growler Market Y-o-Y Growth Rate Comparison by By Application (2016-2032)
- Figure 148: APAC Growler Market Y-o-Y Growth Rate Comparison by By Distribution Channel (2016-2032)
- Figure 149: APAC Growler Market Y-o-Y Growth Rate Comparison by By End-User (2016-2032)
- Figure 150: APAC Growler Market Share Comparison by Country (2016-2032)
- Figure 151: APAC Growler Market Share Comparison by By Material Type (2016-2032)
- Figure 152: APAC Growler Market Share Comparison by By Capacity (2016-2032)
- Figure 153: APAC Growler Market Share Comparison by By Application (2016-2032)
- Figure 154: APAC Growler Market Share Comparison by By Distribution Channel (2016-2032)
- Figure 155: APAC Growler Market Share Comparison by By End-User (2016-2032)
- Figure 156: Latin America Growler Market Revenue (US$ Mn) Market Share by By Material Typein 2022
- Figure 157: Latin America Growler Market Attractiveness Analysis by By Material Type, 2016-2032
- Figure 158: Latin America Growler Market Revenue (US$ Mn) Market Share by By Capacityin 2022
- Figure 159: Latin America Growler Market Attractiveness Analysis by By Capacity, 2016-2032
- Figure 160: Latin America Growler Market Revenue (US$ Mn) Market Share by By Applicationin 2022
- Figure 161: Latin America Growler Market Attractiveness Analysis by By Application, 2016-2032
- Figure 162: Latin America Growler Market Revenue (US$ Mn) Market Share by By Distribution Channelin 2022
- Figure 163: Latin America Growler Market Attractiveness Analysis by By Distribution Channel, 2016-2032
- Figure 164: Latin America Growler Market Revenue (US$ Mn) Market Share by By End-Userin 2022
- Figure 165: Latin America Growler Market Attractiveness Analysis by By End-User, 2016-2032
- Figure 166: Latin America Growler Market Revenue (US$ Mn) Market Share by Country in 2022
- Figure 167: Latin America Growler Market Attractiveness Analysis by Country, 2016-2032
- Figure 168: Latin America Growler Market Revenue (US$ Mn) (2016-2032)
- Figure 169: Latin America Growler Market Revenue (US$ Mn) Comparison by Country (2016-2032)
- Figure 170: Latin America Growler Market Revenue (US$ Mn) Comparison by By Material Type (2016-2032)
- Figure 171: Latin America Growler Market Revenue (US$ Mn) Comparison by By Capacity (2016-2032)
- Figure 172: Latin America Growler Market Revenue (US$ Mn) Comparison by By Application (2016-2032)
- Figure 173: Latin America Growler Market Revenue (US$ Mn) Comparison by By Distribution Channel (2016-2032)
- Figure 174: Latin America Growler Market Revenue (US$ Mn) Comparison by By End-User (2016-2032)
- Figure 175: Latin America Growler Market Y-o-Y Growth Rate Comparison by Country (2016-2032)
- Figure 176: Latin America Growler Market Y-o-Y Growth Rate Comparison by By Material Type (2016-2032)
- Figure 177: Latin America Growler Market Y-o-Y Growth Rate Comparison by By Capacity (2016-2032)
- Figure 178: Latin America Growler Market Y-o-Y Growth Rate Comparison by By Application (2016-2032)
- Figure 179: Latin America Growler Market Y-o-Y Growth Rate Comparison by By Distribution Channel (2016-2032)
- Figure 180: Latin America Growler Market Y-o-Y Growth Rate Comparison by By End-User (2016-2032)
- Figure 181: Latin America Growler Market Share Comparison by Country (2016-2032)
- Figure 182: Latin America Growler Market Share Comparison by By Material Type (2016-2032)
- Figure 183: Latin America Growler Market Share Comparison by By Capacity (2016-2032)
- Figure 184: Latin America Growler Market Share Comparison by By Application (2016-2032)
- Figure 185: Latin America Growler Market Share Comparison by By Distribution Channel (2016-2032)
- Figure 186: Latin America Growler Market Share Comparison by By End-User (2016-2032)
- Figure 187: Middle East & Africa Growler Market Revenue (US$ Mn) Market Share by By Material Typein 2022
- Figure 188: Middle East & Africa Growler Market Attractiveness Analysis by By Material Type, 2016-2032
- Figure 189: Middle East & Africa Growler Market Revenue (US$ Mn) Market Share by By Capacityin 2022
- Figure 190: Middle East & Africa Growler Market Attractiveness Analysis by By Capacity, 2016-2032
- Figure 191: Middle East & Africa Growler Market Revenue (US$ Mn) Market Share by By Applicationin 2022
- Figure 192: Middle East & Africa Growler Market Attractiveness Analysis by By Application, 2016-2032
- Figure 193: Middle East & Africa Growler Market Revenue (US$ Mn) Market Share by By Distribution Channelin 2022
- Figure 194: Middle East & Africa Growler Market Attractiveness Analysis by By Distribution Channel, 2016-2032
- Figure 195: Middle East & Africa Growler Market Revenue (US$ Mn) Market Share by By End-Userin 2022
- Figure 196: Middle East & Africa Growler Market Attractiveness Analysis by By End-User, 2016-2032
- Figure 197: Middle East & Africa Growler Market Revenue (US$ Mn) Market Share by Country in 2022
- Figure 198: Middle East & Africa Growler Market Attractiveness Analysis by Country, 2016-2032
- Figure 199: Middle East & Africa Growler Market Revenue (US$ Mn) (2016-2032)
- Figure 200: Middle East & Africa Growler Market Revenue (US$ Mn) Comparison by Country (2016-2032)
- Figure 201: Middle East & Africa Growler Market Revenue (US$ Mn) Comparison by By Material Type (2016-2032)
- Figure 202: Middle East & Africa Growler Market Revenue (US$ Mn) Comparison by By Capacity (2016-2032)
- Figure 203: Middle East & Africa Growler Market Revenue (US$ Mn) Comparison by By Application (2016-2032)
- Figure 204: Middle East & Africa Growler Market Revenue (US$ Mn) Comparison by By Distribution Channel (2016-2032)
- Figure 205: Middle East & Africa Growler Market Revenue (US$ Mn) Comparison by By End-User (2016-2032)
- Figure 206: Middle East & Africa Growler Market Y-o-Y Growth Rate Comparison by Country (2016-2032)
- Figure 207: Middle East & Africa Growler Market Y-o-Y Growth Rate Comparison by By Material Type (2016-2032)
- Figure 208: Middle East & Africa Growler Market Y-o-Y Growth Rate Comparison by By Capacity (2016-2032)
- Figure 209: Middle East & Africa Growler Market Y-o-Y Growth Rate Comparison by By Application (2016-2032)
- Figure 210: Middle East & Africa Growler Market Y-o-Y Growth Rate Comparison by By Distribution Channel (2016-2032)
- Figure 211: Middle East & Africa Growler Market Y-o-Y Growth Rate Comparison by By End-User (2016-2032)
- Figure 212: Middle East & Africa Growler Market Share Comparison by Country (2016-2032)
- Figure 213: Middle East & Africa Growler Market Share Comparison by By Material Type (2016-2032)
- Figure 214: Middle East & Africa Growler Market Share Comparison by By Capacity (2016-2032)
- Figure 215: Middle East & Africa Growler Market Share Comparison by By Application (2016-2032)
- Figure 216: Middle East & Africa Growler Market Share Comparison by By Distribution Channel (2016-2032)
- Figure 217: Middle East & Africa Growler Market Share Comparison by By End-User (2016-2032)
- List of Tables
- Table 1: Global Growler Market Comparison by By Material Type (2016-2032)
- Table 2: Global Growler Market Comparison by By Capacity (2016-2032)
- Table 3: Global Growler Market Comparison by By Application (2016-2032)
- Table 4: Global Growler Market Comparison by By Distribution Channel (2016-2032)
- Table 5: Global Growler Market Comparison by By End-User (2016-2032)
- Table 6: Global Growler Market Revenue (US$ Mn) Comparison by Region (2016-2032)
- Table 7: Global Growler Market Revenue (US$ Mn) (2016-2032)
- Table 8: Global Growler Market Revenue (US$ Mn) Comparison by Region (2016-2032)
- Table 9: Global Growler Market Revenue (US$ Mn) Comparison by By Material Type (2016-2032)
- Table 10: Global Growler Market Revenue (US$ Mn) Comparison by By Capacity (2016-2032)
- Table 11: Global Growler Market Revenue (US$ Mn) Comparison by By Application (2016-2032)
- Table 12: Global Growler Market Revenue (US$ Mn) Comparison by By Distribution Channel (2016-2032)
- Table 13: Global Growler Market Revenue (US$ Mn) Comparison by By End-User (2016-2032)
- Table 14: Global Growler Market Y-o-Y Growth Rate Comparison by Region (2016-2032)
- Table 15: Global Growler Market Y-o-Y Growth Rate Comparison by By Material Type (2016-2032)
- Table 16: Global Growler Market Y-o-Y Growth Rate Comparison by By Capacity (2016-2032)
- Table 17: Global Growler Market Y-o-Y Growth Rate Comparison by By Application (2016-2032)
- Table 18: Global Growler Market Y-o-Y Growth Rate Comparison by By Distribution Channel (2016-2032)
- Table 19: Global Growler Market Y-o-Y Growth Rate Comparison by By End-User (2016-2032)
- Table 20: Global Growler Market Share Comparison by Region (2016-2032)
- Table 21: Global Growler Market Share Comparison by By Material Type (2016-2032)
- Table 22: Global Growler Market Share Comparison by By Capacity (2016-2032)
- Table 23: Global Growler Market Share Comparison by By Application (2016-2032)
- Table 24: Global Growler Market Share Comparison by By Distribution Channel (2016-2032)
- Table 25: Global Growler Market Share Comparison by By End-User (2016-2032)
- Table 26: North America Growler Market Comparison by By Capacity (2016-2032)
- Table 27: North America Growler Market Comparison by By Application (2016-2032)
- Table 28: North America Growler Market Comparison by By Distribution Channel (2016-2032)
- Table 29: North America Growler Market Comparison by By End-User (2016-2032)
- Table 30: North America Growler Market Revenue (US$ Mn) Comparison by Country (2016-2032)
- Table 31: North America Growler Market Revenue (US$ Mn) (2016-2032)
- Table 32: North America Growler Market Revenue (US$ Mn) Comparison by Country (2016-2032)
- Table 33: North America Growler Market Revenue (US$ Mn) Comparison by By Material Type (2016-2032)
- Table 34: North America Growler Market Revenue (US$ Mn) Comparison by By Capacity (2016-2032)
- Table 35: North America Growler Market Revenue (US$ Mn) Comparison by By Application (2016-2032)
- Table 36: North America Growler Market Revenue (US$ Mn) Comparison by By Distribution Channel (2016-2032)
- Table 37: North America Growler Market Revenue (US$ Mn) Comparison by By End-User (2016-2032)
- Table 38: North America Growler Market Y-o-Y Growth Rate Comparison by Country (2016-2032)
- Table 39: North America Growler Market Y-o-Y Growth Rate Comparison by By Material Type (2016-2032)
- Table 40: North America Growler Market Y-o-Y Growth Rate Comparison by By Capacity (2016-2032)
- Table 41: North America Growler Market Y-o-Y Growth Rate Comparison by By Application (2016-2032)
- Table 42: North America Growler Market Y-o-Y Growth Rate Comparison by By Distribution Channel (2016-2032)
- Table 43: North America Growler Market Y-o-Y Growth Rate Comparison by By End-User (2016-2032)
- Table 44: North America Growler Market Share Comparison by Country (2016-2032)
- Table 45: North America Growler Market Share Comparison by By Material Type (2016-2032)
- Table 46: North America Growler Market Share Comparison by By Capacity (2016-2032)
- Table 47: North America Growler Market Share Comparison by By Application (2016-2032)
- Table 48: North America Growler Market Share Comparison by By Distribution Channel (2016-2032)
- Table 49: North America Growler Market Share Comparison by By End-User (2016-2032)
- Table 50: Western Europe Growler Market Comparison by By Material Type (2016-2032)
- Table 51: Western Europe Growler Market Comparison by By Capacity (2016-2032)
- Table 52: Western Europe Growler Market Comparison by By Application (2016-2032)
- Table 53: Western Europe Growler Market Comparison by By Distribution Channel (2016-2032)
- Table 54: Western Europe Growler Market Comparison by By End-User (2016-2032)
- Table 55: Western Europe Growler Market Revenue (US$ Mn) Comparison by Country (2016-2032)
- Table 56: Western Europe Growler Market Revenue (US$ Mn) (2016-2032)
- Table 57: Western Europe Growler Market Revenue (US$ Mn) Comparison by Country (2016-2032)
- Table 58: Western Europe Growler Market Revenue (US$ Mn) Comparison by By Material Type (2016-2032)
- Table 59: Western Europe Growler Market Revenue (US$ Mn) Comparison by By Capacity (2016-2032)
- Table 60: Western Europe Growler Market Revenue (US$ Mn) Comparison by By Application (2016-2032)
- Table 61: Western Europe Growler Market Revenue (US$ Mn) Comparison by By Distribution Channel (2016-2032)
- Table 62: Western Europe Growler Market Revenue (US$ Mn) Comparison by By End-User (2016-2032)
- Table 63: Western Europe Growler Market Y-o-Y Growth Rate Comparison by Country (2016-2032)
- Table 64: Western Europe Growler Market Y-o-Y Growth Rate Comparison by By Material Type (2016-2032)
- Table 65: Western Europe Growler Market Y-o-Y Growth Rate Comparison by By Capacity (2016-2032)
- Table 66: Western Europe Growler Market Y-o-Y Growth Rate Comparison by By Application (2016-2032)
- Table 67: Western Europe Growler Market Y-o-Y Growth Rate Comparison by By Distribution Channel (2016-2032)
- Table 68: Western Europe Growler Market Y-o-Y Growth Rate Comparison by By End-User (2016-2032)
- Table 69: Western Europe Growler Market Share Comparison by Country (2016-2032)
- Table 70: Western Europe Growler Market Share Comparison by By Material Type (2016-2032)
- Table 71: Western Europe Growler Market Share Comparison by By Capacity (2016-2032)
- Table 72: Western Europe Growler Market Share Comparison by By Application (2016-2032)
- Table 73: Western Europe Growler Market Share Comparison by By Distribution Channel (2016-2032)
- Table 74: Western Europe Growler Market Share Comparison by By End-User (2016-2032)
- Table 75: Eastern Europe Growler Market Comparison by By Material Type (2016-2032)
- Table 76: Eastern Europe Growler Market Comparison by By Capacity (2016-2032)
- Table 77: Eastern Europe Growler Market Comparison by By Application (2016-2032)
- Table 78: Eastern Europe Growler Market Comparison by By Distribution Channel (2016-2032)
- Table 79: Eastern Europe Growler Market Comparison by By End-User (2016-2032)
- Table 80: Eastern Europe Growler Market Revenue (US$ Mn) Comparison by Country (2016-2032)
- Table 81: Eastern Europe Growler Market Revenue (US$ Mn) (2016-2032)
- Table 82: Eastern Europe Growler Market Revenue (US$ Mn) Comparison by Country (2016-2032)
- Table 83: Eastern Europe Growler Market Revenue (US$ Mn) Comparison by By Material Type (2016-2032)
- Table 84: Eastern Europe Growler Market Revenue (US$ Mn) Comparison by By Capacity (2016-2032)
- Table 85: Eastern Europe Growler Market Revenue (US$ Mn) Comparison by By Application (2016-2032)
- Table 86: Eastern Europe Growler Market Revenue (US$ Mn) Comparison by By Distribution Channel (2016-2032)
- Table 87: Eastern Europe Growler Market Revenue (US$ Mn) Comparison by By End-User (2016-2032)
- Table 88: Eastern Europe Growler Market Y-o-Y Growth Rate Comparison by Country (2016-2032)
- Table 89: Eastern Europe Growler Market Y-o-Y Growth Rate Comparison by By Material Type (2016-2032)
- Table 90: Eastern Europe Growler Market Y-o-Y Growth Rate Comparison by By Capacity (2016-2032)
- Table 91: Eastern Europe Growler Market Y-o-Y Growth Rate Comparison by By Application (2016-2032)
- Table 92: Eastern Europe Growler Market Y-o-Y Growth Rate Comparison by By Distribution Channel (2016-2032)
- Table 93: Eastern Europe Growler Market Y-o-Y Growth Rate Comparison by By End-User (2016-2032)
- Table 94: Eastern Europe Growler Market Share Comparison by Country (2016-2032)
- Table 95: Eastern Europe Growler Market Share Comparison by By Material Type (2016-2032)
- Table 96: Eastern Europe Growler Market Share Comparison by By Capacity (2016-2032)
- Table 97: Eastern Europe Growler Market Share Comparison by By Application (2016-2032)
- Table 98: Eastern Europe Growler Market Share Comparison by By Distribution Channel (2016-2032)
- Table 99: Eastern Europe Growler Market Share Comparison by By End-User (2016-2032)
- Table 100: APAC Growler Market Comparison by By Material Type (2016-2032)
- Table 101: APAC Growler Market Comparison by By Capacity (2016-2032)
- Table 102: APAC Growler Market Comparison by By Application (2016-2032)
- Table 103: APAC Growler Market Comparison by By Distribution Channel (2016-2032)
- Table 104: APAC Growler Market Comparison by By End-User (2016-2032)
- Table 105: APAC Growler Market Revenue (US$ Mn) Comparison by Country (2016-2032)
- Table 106: APAC Growler Market Revenue (US$ Mn) (2016-2032)
- Table 107: APAC Growler Market Revenue (US$ Mn) Comparison by Country (2016-2032)
- Table 108: APAC Growler Market Revenue (US$ Mn) Comparison by By Material Type (2016-2032)
- Table 109: APAC Growler Market Revenue (US$ Mn) Comparison by By Capacity (2016-2032)
- Table 110: APAC Growler Market Revenue (US$ Mn) Comparison by By Application (2016-2032)
- Table 111: APAC Growler Market Revenue (US$ Mn) Comparison by By Distribution Channel (2016-2032)
- Table 112: APAC Growler Market Revenue (US$ Mn) Comparison by By End-User (2016-2032)
- Table 113: APAC Growler Market Y-o-Y Growth Rate Comparison by Country (2016-2032)
- Table 114: APAC Growler Market Y-o-Y Growth Rate Comparison by By Material Type (2016-2032)
- Table 115: APAC Growler Market Y-o-Y Growth Rate Comparison by By Capacity (2016-2032)
- Table 116: APAC Growler Market Y-o-Y Growth Rate Comparison by By Application (2016-2032)
- Table 117: APAC Growler Market Y-o-Y Growth Rate Comparison by By Distribution Channel (2016-2032)
- Table 118: APAC Growler Market Y-o-Y Growth Rate Comparison by By End-User (2016-2032)
- Table 119: APAC Growler Market Share Comparison by Country (2016-2032)
- Table 120: APAC Growler Market Share Comparison by By Material Type (2016-2032)
- Table 121: APAC Growler Market Share Comparison by By Capacity (2016-2032)
- Table 122: APAC Growler Market Share Comparison by By Application (2016-2032)
- Table 123: APAC Growler Market Share Comparison by By Distribution Channel (2016-2032)
- Table 124: APAC Growler Market Share Comparison by By End-User (2016-2032)
- Table 125: Latin America Growler Market Comparison by By Material Type (2016-2032)
- Table 126: Latin America Growler Market Comparison by By Capacity (2016-2032)
- Table 127: Latin America Growler Market Comparison by By Application (2016-2032)
- Table 128: Latin America Growler Market Comparison by By Distribution Channel (2016-2032)
- Table 129: Latin America Growler Market Comparison by By End-User (2016-2032)
- Table 130: Latin America Growler Market Revenue (US$ Mn) Comparison by Country (2016-2032)
- Table 131: Latin America Growler Market Revenue (US$ Mn) (2016-2032)
- Table 132: Latin America Growler Market Revenue (US$ Mn) Comparison by Country (2016-2032)
- Table 133: Latin America Growler Market Revenue (US$ Mn) Comparison by By Material Type (2016-2032)
- Table 134: Latin America Growler Market Revenue (US$ Mn) Comparison by By Capacity (2016-2032)
- Table 135: Latin America Growler Market Revenue (US$ Mn) Comparison by By Application (2016-2032)
- Table 136: Latin America Growler Market Revenue (US$ Mn) Comparison by By Distribution Channel (2016-2032)
- Table 137: Latin America Growler Market Revenue (US$ Mn) Comparison by By End-User (2016-2032)
- Table 138: Latin America Growler Market Y-o-Y Growth Rate Comparison by Country (2016-2032)
- Table 139: Latin America Growler Market Y-o-Y Growth Rate Comparison by By Material Type (2016-2032)
- Table 140: Latin America Growler Market Y-o-Y Growth Rate Comparison by By Capacity (2016-2032)
- Table 141: Latin America Growler Market Y-o-Y Growth Rate Comparison by By Application (2016-2032)
- Table 142: Latin America Growler Market Y-o-Y Growth Rate Comparison by By Distribution Channel (2016-2032)
- Table 143: Latin America Growler Market Y-o-Y Growth Rate Comparison by By End-User (2016-2032)
- Table 144: Latin America Growler Market Share Comparison by Country (2016-2032)
- Table 145: Latin America Growler Market Share Comparison by By Material Type (2016-2032)
- Table 146: Latin America Growler Market Share Comparison by By Capacity (2016-2032)
- Table 147: Latin America Growler Market Share Comparison by By Application (2016-2032)
- Table 148: Latin America Growler Market Share Comparison by By Distribution Channel (2016-2032)
- Table 149: Latin America Growler Market Share Comparison by By End-User (2016-2032)
- Table 150: Middle East & Africa Growler Market Comparison by By Material Type (2016-2032)
- Table 151: Middle East & Africa Growler Market Comparison by By Capacity (2016-2032)
- Table 152: Middle East & Africa Growler Market Comparison by By Application (2016-2032)
- Table 153: Middle East & Africa Growler Market Comparison by By Distribution Channel (2016-2032)
- Table 154: Middle East & Africa Growler Market Comparison by By End-User (2016-2032)
- Table 155: Middle East & Africa Growler Market Revenue (US$ Mn) Comparison by Country (2016-2032)
- Table 156: Middle East & Africa Growler Market Revenue (US$ Mn) (2016-2032)
- Table 157: Middle East & Africa Growler Market Revenue (US$ Mn) Comparison by Country (2016-2032)
- Table 158: Middle East & Africa Growler Market Revenue (US$ Mn) Comparison by By Material Type (2016-2032)
- Table 159: Middle East & Africa Growler Market Revenue (US$ Mn) Comparison by By Capacity (2016-2032)
- Table 160: Middle East & Africa Growler Market Revenue (US$ Mn) Comparison by By Application (2016-2032)
- Table 161: Middle East & Africa Growler Market Revenue (US$ Mn) Comparison by By Distribution Channel (2016-2032)
- Table 162: Middle East & Africa Growler Market Revenue (US$ Mn) Comparison by By End-User (2016-2032)
- Table 163: Middle East & Africa Growler Market Y-o-Y Growth Rate Comparison by Country (2016-2032)
- Table 164: Middle East & Africa Growler Market Y-o-Y Growth Rate Comparison by By Material Type (2016-2032)
- Table 165: Middle East & Africa Growler Market Y-o-Y Growth Rate Comparison by By Capacity (2016-2032)
- Table 166: Middle East & Africa Growler Market Y-o-Y Growth Rate Comparison by By Application (2016-2032)
- Table 167: Middle East & Africa Growler Market Y-o-Y Growth Rate Comparison by By Distribution Channel (2016-2032)
- Table 168: Middle East & Africa Growler Market Y-o-Y Growth Rate Comparison by By End-User (2016-2032)
- Table 169: Middle East & Africa Growler Market Share Comparison by Country (2016-2032)
- Table 170: Middle East & Africa Growler Market Share Comparison by By Material Type (2016-2032)
- Table 171: Middle East & Africa Growler Market Share Comparison by By Capacity (2016-2032)
- Table 172: Middle East & Africa Growler Market Share Comparison by By Application (2016-2032)
- Table 173: Middle East & Africa Growler Market Share Comparison by By Distribution Channel (2016-2032)
- Table 174: Middle East & Africa Growler Market Share Comparison by By End-User (2016-2032)
- 1. Executive Summary
-
- Alpha Packaging
- William Croxsons & Sons Limited
- Ardagh Group S.A.
- Global Glass Solutions
- GrowlerWerks, Inc.
- The Boelter Companies
- DrinkTanks
- Zenan
- Orange Vessel Co.
- Berlin Packaging LLC
- Other Key Players
Our Clients


View Our Licence Options
