Granola Market Product Type Analysis (Cereal, Bar, Baked Goods, Other), Flavor Analysis (Classic Vanilla , Exotic Chocolate, Strawberry, Other), Distribution Channel (Supermarkets and Hypermarkets, Convenient Stores, Other), By Region And Companies - Industry Segment Outlook, Market Assessment, Competition Scenario, Trends, And Forecast 2023-2032
-
6001
-
May 2023
-
183
-


-
This report was compiled by Shreyas Rokade Shreyas Rokade is a seasoned Research Analyst with CMFE, bringing extensive expertise in market research and consulting, with a strong background in Chemical Engineering. Correspondence Team Lead-CMFE Linkedin | Detailed Market research Methodology Our methodology involves a mix of primary research, including interviews with leading mental health experts, and secondary research from reputable medical journals and databases. View Detailed Methodology Page
-
Quick Navigation
Report Overview
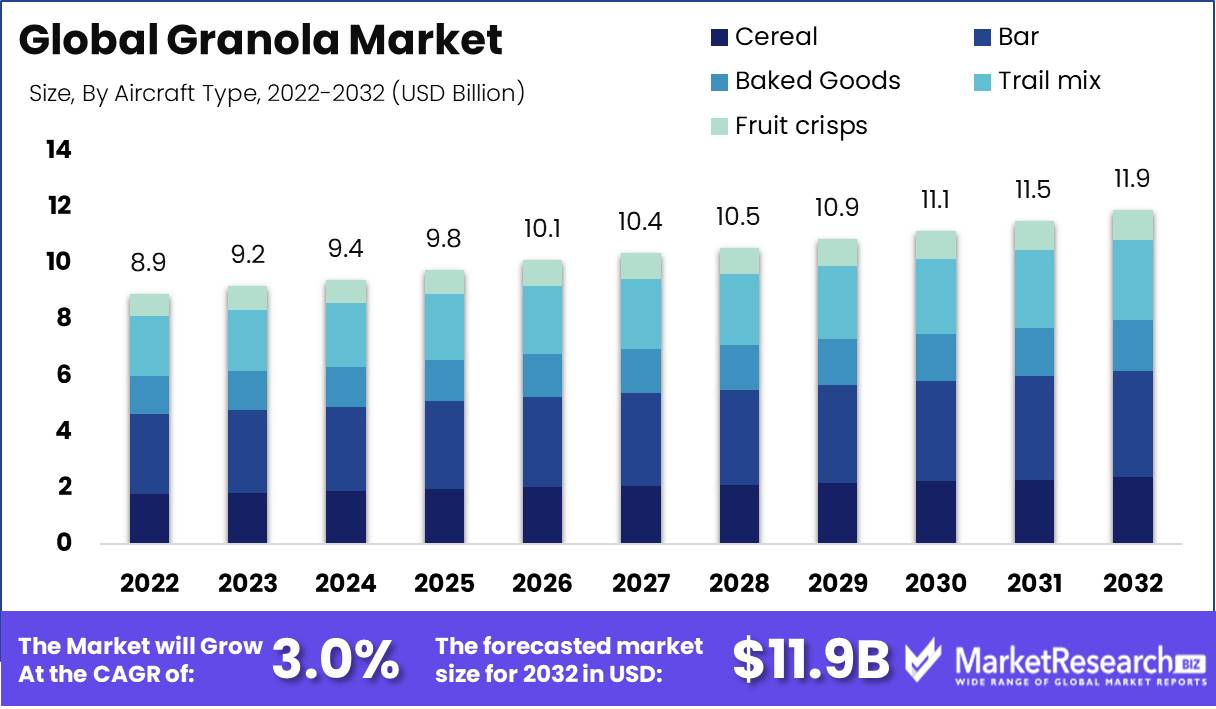
Granola Market size is expected to be worth around USD 11.9 Bn by 2032 from USD 8.9 Bn in 2022, growing at a CAGR of 3.0% during the forecast period from 2023 to 2032.
The granola market is a thriving sector within the cereal industry, characterized by its combination of whole grains, primarily oats, mixed with nuts, seeds, and dried fruits. This nutritious and versatile snack has gained popularity, particularly among health-conscious consumers, driving substantial growth in the market.
Within the granola market, various stakeholders, including suppliers, manufacturers, and consumers, actively participate in the exchange of goods. They contribute to fulfilling the demand for wholesome breakfast and snack options while also creating economic opportunities within the granola supply chain.
Granola offers several health benefits, such as cholesterol and blood sugar level control, and it is often considered a suitable option for those looking to manage their weight. Its convenience and appealing taste make it a popular choice for people with busy lifestyles. The granola market has positioned itself as a reliable source of nourishment and convenience for consumers.
Innovation has been a key driver in the granola market. Gluten-free and vegan alternatives have emerged, diversifying the range of products available. Granola bars and snack packs have gained significant popularity as quick and convenient nourishment options for people on the go.
Major Key players in the food industry have recognized the potential of the granola Industry and have introduced their own granola product lines. Granola has also found its way into various culinary domains, complementing items like smoothie bowls, yogurts, and energy bars, enhancing its appeal.
The granola business potential has attracted interest from various industries, including food production, hospitality, and recreation. These sectors are actively investing in research and development to introduce innovative granola products to meet the evolving preferences of consumers.
Driving factors
- Millennials and emerging markets significantly contribute to granola's growing demand, emphasizing healthier dietary choices. Granola's allure, especially in developing countries, presents it as a fresh, health-centric alternative.
- A surge in health awareness propels granola's market growth. As the importance of nutritious eating takes center stage, granola, laden with fiber, protein, and vital nutrients, emerges as a top choice for health-driven consumers.
- The rising preference for vegan and organic offerings fuels granola's market expansion. Heightened cognizance of environmental implications and concerns about chemicals in food production bolster the demand for organic and vegan granola variants.
- A spike in food allergies underpins the surge in granola consumption. The escalating number of individuals with food sensitivities necessitates a demand for gluten-free and nut-free granola, expanding its product range.
- The prevailing snacking trend enhances granola's market reach. The intersection of hectic lifestyles and the quest for healthful, portable sustenance options catapults granola bars and bites to the forefront of on-the-go refreshments.
Restraining Factors
- Elevated and inconsistent raw material prices, like grains, nuts, and sweeteners, are a predominant challenge for the granola market. Such variability inflates production costs, subsequently pushing up granola bar prices, diminishing demand, and intensifying competitive pressures. Market participants might contemplate in-house raw material production or strategic supplier partnerships to attain cost efficiencies.
- The granola bar sector's reliance on volatile raw material prices, influenced by factors such as climatic shifts, trade policies, and global economic trends, is undeniable. These unpredictable pricing shifts weigh heavily on operational costs, posing persistent threats to profitability.
- Global governmental regulations impose stringent standards on the granola market. Numerous food safety rules dictate the operations of granola bar producers, often presenting intricate compliance challenges. Disparate international norms further complicate this regulatory maze.
Product Type Analysis
The granola market is one of the convenience food industry's fastest-growing segments. Granola bars are the ideal solution to satisfy the growing demand for convenient, healthy on-the-go options from consumers. More than sixty percent of the granola market is dominated by the bar segment. This emphasizes the importance of the bar segment of the granola market and its development potential.
The economic growth of emerging economies is a significant factor driving the adoption of the bar segment in the granola market. There is a growing demand for quick and healthy snacks that can be consumed while on the go as more people in emerging economies progress toward urbanization and a busier lifestyle. This demand is precisely met by the bar segment of the granola market, which is growing in popularity in these regions.
Consumer trends and behaviors are changing, which can be attributed to consumers' increasing adoption of the bar segment. Consumers are seeking snacks that are low in calories, high in fiber, and provide sustained energy throughout the day. The bar segment of the granola market offers all of these advantages, making it a desirable option for health-conscious consumers.
Due to a number of factors, it is anticipated that the bar segment of the granola market will register the highest growth rate over the coming years. Firstly, the increasing adoption of an urban lifestyle and hectic work schedules is driving the demand for convenient, portable snacks. Secondly, the increasing health consciousness of consumers is leading them to choose healthier refreshment options, and the bar segment is ideally suited to meet this demand.
Flavor Analysis
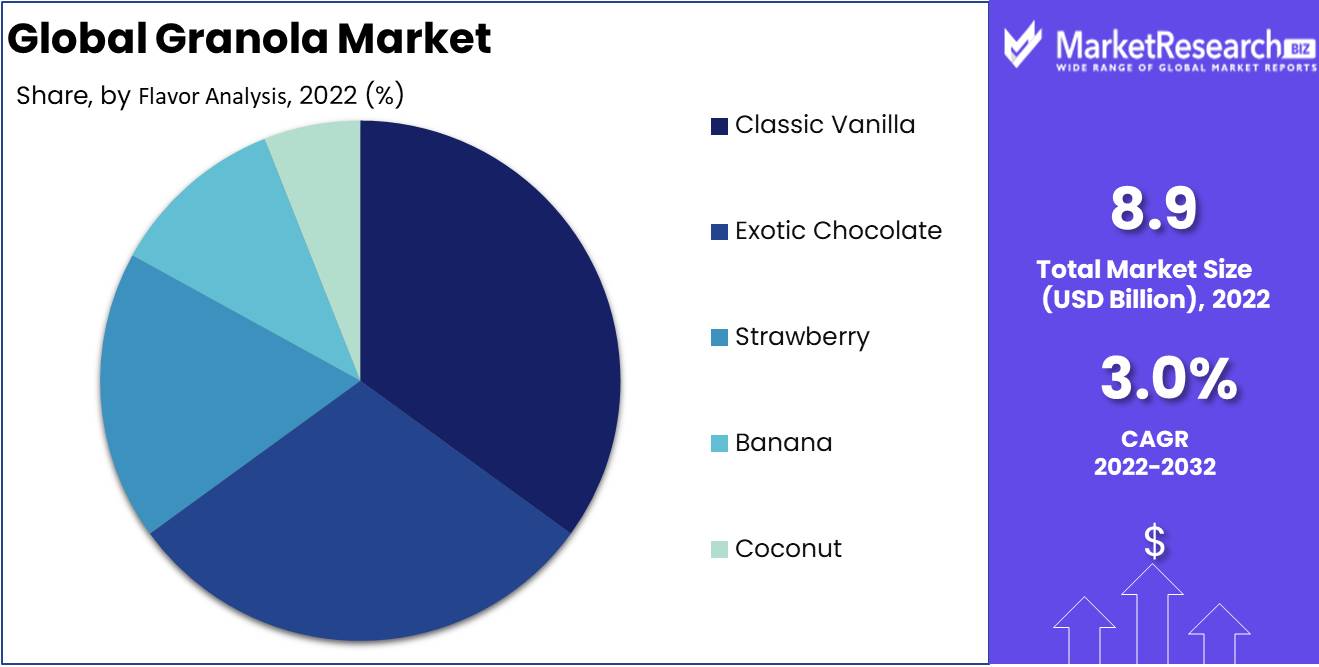
The flavor of granola bars is a crucial component of the product and has a substantial influence on consumer preferences. The classic Vanilla flavor and the more exotic Chocolate segment dominate the granola market, highlighting the importance of these flavors to consumers.
The growth of emerging economies is driving the adoption of classic Vanilla flavors over more exotic Chocolate flavors in the granola market. As consumers in emerging economies become more familiar with international flavors and preferences, they opt for exotic flavors like chocolate in their snack selections. In addition, the classic vanilla flavor is a time-honored favorite and a globally popular option among consumers.
Classic Vanilla and exotic Chocolate flavors' growing adoption in the granola market can be attributed to shifting consumer preferences and habits. Consumers seek snacks that not only provide health advantages but also cater to their evolving tastes and preferences. They are not reluctant to experiment with new flavors and ingredients. The classic Vanilla flavor and the more exotic Chocolate segment provide consumers with a variety of taste options, making them appealing choices.
Due to a number of factors, the Classic Vanilla to More Exotic Chocolate flavor segment of the granola market is anticipated to register the highest growth rate in the coming years. The increasing health consciousness of consumers is leading them to choose healthier snack options, and the granola bar market segment offers a healthy, delectable, and convenient option.
Key Market Segments
Product Type Analysis
- Cereal
- Bar
- Baked Goods
- Trail mix
- Fruit crisps
Flavor Analysis
- Classic Vanilla
- Exotic Chocolate
- Strawberry
- Banana
- Coconut
Distribution Channel
- Supermarkets and Hypermarkets
- Convenient Stores
- Online Stores
Growth Opportunity
Granola Bars a Healthy and Convenient Snack
Granola bars have become a popular on-the-go snack option for people seeking a fast and convenient source of nutrition. Granola bars have become a popular snack for health-conscious consumers due to their nuts, grains, high protein content, and fiber. The growing demand for healthy and convenient snack options has led to the expansion of the granola market, with manufacturers competing to offer a wide range of flavors and customization options to attract customers.
Granola Market Expansion Driven by Health-Conscious Customers
In recent years, the granola market has experienced significant growth, as an increasing number of people choose granola bars as a healthful snack option. Granola bars are in high demand because they contain a variety of nutrients that are necessary for a healthy diet, which is driven by consumers' attention to health and wellness. Moreover, the increasing popularity of on-the-go lifestyles has led to an increased demand for portable and convenient snack options, which has contributed to the growth of the granola market.
Granola Bars Customizable & Delicious Snack
Granola bars come in a variety of flavors, making them a top choice for people with varying palates. Companies are continually innovating in order to provide distinct flavors that appeal to various customer segments. Additionally, customizations, such as the ability to select the desired combination of nuts and seeds, have increased the desirability of granola bars among customers.
Granola Bars Emphasize Sustainability and Natural Components
The growth of the granola market has been driven not only by shifting consumer preferences but also by the adoption of sustainable and ethical business practices. Numerous manufacturers have begun to prioritize sustainable packaging and ethical procurement of ingredients. Companies have also begun removing artificial ingredients, high-fructose corn syrup, and flavorings from their products in order to appeal to consumers seeking natural and organic options.
Granola Market's Promising Future Health, Convenience, and Innovation
Experts predict that the granola market will continue to expand in the future years, which bodes well for its growth prospects. As consumers become increasingly health-conscious and continue to place a premium on wellness and convenience, the granola market will continue to experience innovation and expansion. Manufacturers are expected to introduce new flavors, customization options, and packaging innovations in order to satisfy consumer demands.
Latest Trends
Changing Trends
For many years, granola bars have been a popular snack option for people all over the globe. However, with the rise of veganism and consumer demand for plant-based options, the market trends for granola bars are shifting rapidly. Also increasing is the demand for eco-friendly packaging and ethical sourcing.
Meeting Vegan Demands
Veganism has been on the rise for a number of years, with an increasing number of people adopting this lifestyle. This trend places significant pressure on food companies to adapt and offer plant-based options. Consequently, the market for vegan granola bars is expanding rapidly.
Convenient & Nutritious
As demand for vegan options continues to rise, granola bar manufacturers are adapting to meet it. The vegan granola market now offers a wide variety of options. These bars are made with plant-based ingredients, such as nuts, seeds, and dried fruit, making them a nutritious and healthy option for a snack.
Nature Valley as well as Earnest Eats
Today's hectic circumstances have made convenience a top priority for many people. People desire convenient, healthy, and satiating snack options. Here, granola bars enter into play. They are ideal for a snack on the go and are nutrient-dense. As more consumers pursue plant-based options, the granola market offers a convenient and healthy snack option.
Growing Market
Nature Valley and Earnest Eats are two popular brands of granola bars that offer a variety of vegan options. The Nature Valley granola bars are made with natural, simple ingredients and do not contain any artificial flavors or colors. They offer a variety of vegan flavors, such as Maple Brown Sugar, Peanut Butter, and Oats & Honey. Earnest Eats offers gluten-free and Non-GMO Project-verified vegan granola bars.
Regional Analysis
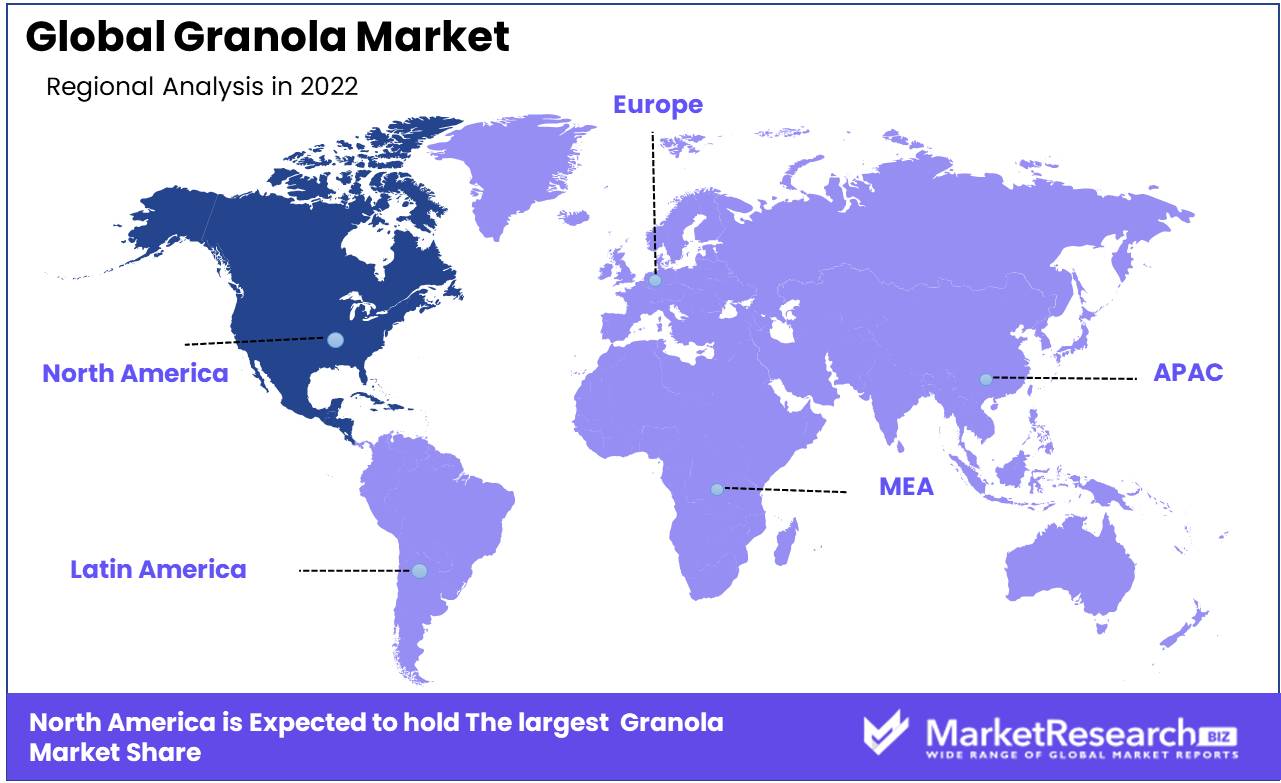
North America's consistent growth and sustained demand across multiple industries make it the top performer with a predicted revenue share increase in the next years. Its distinctive economic landscape, advanced technological uptake, and robust regulatory framework make it an attractive place for worldwide businesses.
North America's largest economy and worldwide superpower is the US. Its highly broad and sophisticated market makes it an attractive location for businesses to expand. The country's economic policies, including cheap lending rates, tax incentives, and friendly laws, make it appealing to startups and established businesses.
Canada, another North American giant, has a strong economy fueled by natural resources, skilled workers, and advanced technology. It's a diverse market with stable politics, attractive taxes, and a highly educated workforce. These qualities make it an attractive location for businesses expanding into new markets.
Due to its low labor costs and convenient location, Mexico attracts manufacturers, exporters, and service providers. The nation's membership in the North America Free Trade Agreement (NAFTA) and its strategic location between the US and Latin America make it a desirable choice for businesses looking to enter both markets.
North America's diverse industries generate its revenue share. The manufacturing industry is highly established in the area, producing consumer goods and high-tech equipment. The region's revenue comes from the service sector, including technology, healthcare, and banking.
Key Regions and Countries
North America
- US
- Canada
- Mexico
Western Europe
- Germany
- France
- The UK
- Spain
- Italy
- Portugal
- Ireland
- Austria
- Switzerland
- Benelux
- Nordic
- Rest of Western Europe
Eastern Europe
- Russia
- Poland
- The Czech Republic
- Greece
- Rest of Eastern Europe
APAC
- China
- Japan
- South Korea
- India
- Australia & New Zealand
- Indonesia
- Malaysia
- Philippines
- Singapore
- Thailand
- Vietnam
- Rest of APAC
Latin America
- Brazil
- Colombia
- Chile
- Argentina
- Costa Rica
- Rest of Latin America
Middle East & Africa
- Algeria
- Egypt
- Israel
- Kuwait
- Nigeria
- Saudi Arabia
- South Africa
- Turkey
- United Arab Emirates
- Rest of MEA
Key Players Analysis
Health-conscious people consume granola for breakfast. Whole grains, dried fruits, nuts, and other healthful components make it. The granola market has grown steadily in recent years, with several major players.
Kellogg's is one of the main granola market players. The company sells Special K and Kashi granola products under its brand name. Kellogg's leads the cereal sector after almost a century.
Nature's Path is another prominent player in the granola market. It's a Canadian company that produces organic, non-GMO granola, cereal, and oatmeal. Nature's Path has a strong environmental focus and dedicated customers for its products.
With its brand Nature Valley, General Mills is another significant player in the granola market. To satisfy the varied tastes of its customers, the company has created granola bars in three different varieties: Oat Clusters, Biscuits, and Granola Thins.
Clif Bar & Company is a well-known player in the granola market. The company uses high-quality, natural ingredients and has a strong presence in North America and Europe.
Top Key Players in Granola Market
- Sunny Crunch Foods Ltd.
- Kellogg Company
- General Mills, Inc.
- Kraft Foods Group, Inc.
- Conagra Brands, Inc.
- Nestlé S.A.
- Slim Fast Nutritional Food LLC
- Clif Bar & Company
- The Quaker Oats Company, Inc.
- Standard Functional Foods Group, Inc.
Recent Development
- In 2023, There will be a surge in the introduction of unique and exotic flavor combinations like matcha green tea, turmeric, lavender, and gingerbread.
- In 2022, A number of businesses launched online platforms or in-store options that let customers make their own unique granola mixtures by selecting ingredients, flavors, and add-ons.
- In 2021, There was a significant shift toward eco-friendly packaging materials like compostable pouches, recyclable paperboard cases, and reusable containers.
- In 2020, There will be a surge in the development of granola formulations that are functional and nutrient-dense.
- In 2019, The demand for plant-based and allergen-free food products, such as granola, has increased significantly over the past several years.
Report Scope:
Report Features Description Market Value (2022) USD 8.9 Bn Forecast Revenue (2032) USD 11.9 Bn CAGR (2023-2032) 3% Base Year for Estimation 2022 Historic Period 2016-2022 Forecast Period 2023-2032 Report Coverage Revenue Forecast, Market Dynamics, COVID-19 Impact, Competitive Landscape, Recent Developments Segments Covered Product Type Analysis (Cereal, Bar, Baked Goods, Trail mix, Fruit crisps), Flavor Analysis (Classic Vanilla , Exotic Chocolate, Strawberry, Banana, Coconut), Distribution Channel (Supermarkets and Hypermarkets, Convenient Stores, Online Stores) Regional Analysis North America – The US, Canada, & Mexico; Western Europe – Germany, France, The UK, Spain, Italy, Portugal, Ireland, Austria, Switzerland, Benelux, Nordic, & Rest of Western Europe; Eastern Europe – Russia, Poland, The Czech Republic, Greece, & Rest of Eastern Europe; APAC – China, Japan, South Korea, India, Australia & New Zealand, Indonesia, Malaysia, Philippines, Singapore, Thailand, Vietnam, & Rest of APAC; Latin America – Brazil, Colombia, Chile, Argentina, Costa Rica, & Rest of Latin America; Middle East & Africa – Algeria, Egypt, Israel, Kuwait, Nigeria, Saudi Arabia, South Africa, Turkey, United Arab Emirates, & Rest of MEA Competitive Landscape Sunny Crunch Foods Ltd., Kellogg Company, General Mills, Inc., Kraft Foods Group, Inc., Conagra Brands, Inc., Nestlé S.A., Slim Fast Nutritional Food LLC, Clif Bar & Company, The Quaker Oats Company, Inc., Standard Functional Foods Group, Inc. Customization Scope Customization for segments, region/country-level will be provided. Moreover, additional customization can be done based on the requirements. Purchase Options We have three licenses to opt for: Single User License, Multi-User License (Up to 5 Users), Corporate Use License (Unlimited User and Printable PDF) -
- 1. Executive Summary
- 1.1. Definition
- 1.2. Taxonomy
- 1.3. Research Scope
- 1.4. Key Analysis
- 1.5. Key Findings by Major Segments
- 1.6. Top strategies by Major Players
- 2. Global Granola Market Overview
- 2.1. Granola Market Dynamics
- 2.1.1. Drivers
- 2.1.2. Opportunities
- 2.1.3. Restraints
- 2.1.4. Challenges
- 2.2. Macro-economic Factors
- 2.3. Regulatory Framework
- 2.4. Market Investment Feasibility Index
- 2.5. PEST Analysis
- 2.6. PORTER’S Five Force Analysis
- 2.7. Drivers & Restraints Impact Analysis
- 2.8. Industry Chain Analysis
- 2.9. Cost Structure Analysis
- 2.10. Marketing Strategy
- 2.11. Russia-Ukraine War Impact Analysis
- 2.12. Opportunity Map Analysis
- 2.13. Market Competition Scenario Analysis
- 2.14. Product Life Cycle Analysis
- 2.15. Opportunity Orbits
- 2.16. Manufacturer Intensity Map
- 2.17. Major Companies sales by Value & Volume
- 2.1. Granola Market Dynamics
- 3. Global Granola Market Analysis, Opportunity and Forecast, 2016-2032
- 3.1. Global Granola Market Analysis, 2016-2021
- 3.2. Global Granola Market Opportunity and Forecast, 2023-2032
- 3.3. Global Granola Market Analysis, Opportunity and Forecast, By Product Type Analysis, 2016-2032
- 3.3.1. Global Granola Market Analysis by Product Type Analysis: Introduction
- 3.3.2. Market Size Absolute $ Opportunity Analysis and Forecast, By Product Type Analysis, 2016-2032
- 3.3.3. Cereal
- 3.3.4. Bar
- 3.3.5. Baked Goods
- 3.3.6. Trail mix
- 3.3.7. Fruit crisps
- 3.4. Global Granola Market Analysis, Opportunity and Forecast, By Flavor Analysis, 2016-2032
- 3.4.1. Global Granola Market Analysis by Flavor Analysis: Introduction
- 3.4.2. Market Size Absolute $ Opportunity Analysis and Forecast, By Flavor Analysis, 2016-2032
- 3.4.3. Classic Vanilla
- 3.4.4. Exotic Chocolate
- 3.4.5. Strawberry
- 3.4.6. Banana
- 3.4.7. Coconut
- 3.5. Global Granola Market Analysis, Opportunity and Forecast, By Distribution Channel, 2016-2032
- 3.5.1. Global Granola Market Analysis by Distribution Channel: Introduction
- 3.5.2. Market Size Absolute $ Opportunity Analysis and Forecast, By Distribution Channel, 2016-2032
- 3.5.3. Supermarkets and Hypermarkets
- 3.5.4. Convenient Stores
- 3.5.5. Online Stores
- 3.6. Global Granola Market Analysis, Opportunity and Forecast, By , 2016-2032
- 3.6.1. Global Granola Market Analysis by : Introduction
- 3.6.2. Market Size Absolute $ Opportunity Analysis and Forecast, By , 2016-2032
- 4. North America Granola Market Analysis, Opportunity and Forecast, 2016-2032
- 4.1. North America Granola Market Analysis, 2016-2021
- 4.2. North America Granola Market Opportunity and Forecast, 2023-2032
- 4.3. North America Granola Market Analysis, Opportunity and Forecast, By Product Type Analysis, 2016-2032
- 4.3.1. North America Granola Market Analysis by Product Type Analysis: Introduction
- 4.3.2. Market Size Absolute $ Opportunity Analysis and Forecast, By Product Type Analysis, 2016-2032
- 4.3.3. Cereal
- 4.3.4. Bar
- 4.3.5. Baked Goods
- 4.3.6. Trail mix
- 4.3.7. Fruit crisps
- 4.4. North America Granola Market Analysis, Opportunity and Forecast, By Flavor Analysis, 2016-2032
- 4.4.1. North America Granola Market Analysis by Flavor Analysis: Introduction
- 4.4.2. Market Size Absolute $ Opportunity Analysis and Forecast, By Flavor Analysis, 2016-2032
- 4.4.3. Classic Vanilla
- 4.4.4. Exotic Chocolate
- 4.4.5. Strawberry
- 4.4.6. Banana
- 4.4.7. Coconut
- 4.5. North America Granola Market Analysis, Opportunity and Forecast, By Distribution Channel, 2016-2032
- 4.5.1. North America Granola Market Analysis by Distribution Channel: Introduction
- 4.5.2. Market Size Absolute $ Opportunity Analysis and Forecast, By Distribution Channel, 2016-2032
- 4.5.3. Supermarkets and Hypermarkets
- 4.5.4. Convenient Stores
- 4.5.5. Online Stores
- 4.6. North America Granola Market Analysis, Opportunity and Forecast, By , 2016-2032
- 4.6.1. North America Granola Market Analysis by : Introduction
- 4.6.2. Market Size Absolute $ Opportunity Analysis and Forecast, By , 2016-2032
- 4.7. North America Granola Market Analysis, Opportunity and Forecast, By Country , 2016-2032
- 4.7.1. North America Granola Market Analysis by Country : Introduction
- 4.7.2. Market Size Absolute $ Opportunity Analysis and Forecast, Country , 2016-2032
- 4.7.2.1. The US
- 4.7.2.2. Canada
- 4.7.2.3. Mexico
- 5. Western Europe Granola Market Analysis, Opportunity and Forecast, 2016-2032
- 5.1. Western Europe Granola Market Analysis, 2016-2021
- 5.2. Western Europe Granola Market Opportunity and Forecast, 2023-2032
- 5.3. Western Europe Granola Market Analysis, Opportunity and Forecast, By Product Type Analysis, 2016-2032
- 5.3.1. Western Europe Granola Market Analysis by Product Type Analysis: Introduction
- 5.3.2. Market Size Absolute $ Opportunity Analysis and Forecast, By Product Type Analysis, 2016-2032
- 5.3.3. Cereal
- 5.3.4. Bar
- 5.3.5. Baked Goods
- 5.3.6. Trail mix
- 5.3.7. Fruit crisps
- 5.4. Western Europe Granola Market Analysis, Opportunity and Forecast, By Flavor Analysis, 2016-2032
- 5.4.1. Western Europe Granola Market Analysis by Flavor Analysis: Introduction
- 5.4.2. Market Size Absolute $ Opportunity Analysis and Forecast, By Flavor Analysis, 2016-2032
- 5.4.3. Classic Vanilla
- 5.4.4. Exotic Chocolate
- 5.4.5. Strawberry
- 5.4.6. Banana
- 5.4.7. Coconut
- 5.5. Western Europe Granola Market Analysis, Opportunity and Forecast, By Distribution Channel, 2016-2032
- 5.5.1. Western Europe Granola Market Analysis by Distribution Channel: Introduction
- 5.5.2. Market Size Absolute $ Opportunity Analysis and Forecast, By Distribution Channel, 2016-2032
- 5.5.3. Supermarkets and Hypermarkets
- 5.5.4. Convenient Stores
- 5.5.5. Online Stores
- 5.6. Western Europe Granola Market Analysis, Opportunity and Forecast, By , 2016-2032
- 5.6.1. Western Europe Granola Market Analysis by : Introduction
- 5.6.2. Market Size Absolute $ Opportunity Analysis and Forecast, By , 2016-2032
- 5.7. Western Europe Granola Market Analysis, Opportunity and Forecast, By Country , 2016-2032
- 5.7.1. Western Europe Granola Market Analysis by Country : Introduction
- 5.7.2. Market Size Absolute $ Opportunity Analysis and Forecast, Country , 2016-2032
- 5.7.2.1. Germany
- 5.7.2.2. France
- 5.7.2.3. The UK
- 5.7.2.4. Spain
- 5.7.2.5. Italy
- 5.7.2.6. Portugal
- 5.7.2.7. Ireland
- 5.7.2.8. Austria
- 5.7.2.9. Switzerland
- 5.7.2.10. Benelux
- 5.7.2.11. Nordic
- 5.7.2.12. Rest of Western Europe
- 6. Eastern Europe Granola Market Analysis, Opportunity and Forecast, 2016-2032
- 6.1. Eastern Europe Granola Market Analysis, 2016-2021
- 6.2. Eastern Europe Granola Market Opportunity and Forecast, 2023-2032
- 6.3. Eastern Europe Granola Market Analysis, Opportunity and Forecast, By Product Type Analysis, 2016-2032
- 6.3.1. Eastern Europe Granola Market Analysis by Product Type Analysis: Introduction
- 6.3.2. Market Size Absolute $ Opportunity Analysis and Forecast, By Product Type Analysis, 2016-2032
- 6.3.3. Cereal
- 6.3.4. Bar
- 6.3.5. Baked Goods
- 6.3.6. Trail mix
- 6.3.7. Fruit crisps
- 6.4. Eastern Europe Granola Market Analysis, Opportunity and Forecast, By Flavor Analysis, 2016-2032
- 6.4.1. Eastern Europe Granola Market Analysis by Flavor Analysis: Introduction
- 6.4.2. Market Size Absolute $ Opportunity Analysis and Forecast, By Flavor Analysis, 2016-2032
- 6.4.3. Classic Vanilla
- 6.4.4. Exotic Chocolate
- 6.4.5. Strawberry
- 6.4.6. Banana
- 6.4.7. Coconut
- 6.5. Eastern Europe Granola Market Analysis, Opportunity and Forecast, By Distribution Channel, 2016-2032
- 6.5.1. Eastern Europe Granola Market Analysis by Distribution Channel: Introduction
- 6.5.2. Market Size Absolute $ Opportunity Analysis and Forecast, By Distribution Channel, 2016-2032
- 6.5.3. Supermarkets and Hypermarkets
- 6.5.4. Convenient Stores
- 6.5.5. Online Stores
- 6.6. Eastern Europe Granola Market Analysis, Opportunity and Forecast, By , 2016-2032
- 6.6.1. Eastern Europe Granola Market Analysis by : Introduction
- 6.6.2. Market Size Absolute $ Opportunity Analysis and Forecast, By , 2016-2032
- 6.7. Eastern Europe Granola Market Analysis, Opportunity and Forecast, By Country , 2016-2032
- 6.7.1. Eastern Europe Granola Market Analysis by Country : Introduction
- 6.7.2. Market Size Absolute $ Opportunity Analysis and Forecast, Country , 2016-2032
- 6.7.2.1. Russia
- 6.7.2.2. Poland
- 6.7.2.3. The Czech Republic
- 6.7.2.4. Greece
- 6.7.2.5. Rest of Eastern Europe
- 7. APAC Granola Market Analysis, Opportunity and Forecast, 2016-2032
- 7.1. APAC Granola Market Analysis, 2016-2021
- 7.2. APAC Granola Market Opportunity and Forecast, 2023-2032
- 7.3. APAC Granola Market Analysis, Opportunity and Forecast, By Product Type Analysis, 2016-2032
- 7.3.1. APAC Granola Market Analysis by Product Type Analysis: Introduction
- 7.3.2. Market Size Absolute $ Opportunity Analysis and Forecast, By Product Type Analysis, 2016-2032
- 7.3.3. Cereal
- 7.3.4. Bar
- 7.3.5. Baked Goods
- 7.3.6. Trail mix
- 7.3.7. Fruit crisps
- 7.4. APAC Granola Market Analysis, Opportunity and Forecast, By Flavor Analysis, 2016-2032
- 7.4.1. APAC Granola Market Analysis by Flavor Analysis: Introduction
- 7.4.2. Market Size Absolute $ Opportunity Analysis and Forecast, By Flavor Analysis, 2016-2032
- 7.4.3. Classic Vanilla
- 7.4.4. Exotic Chocolate
- 7.4.5. Strawberry
- 7.4.6. Banana
- 7.4.7. Coconut
- 7.5. APAC Granola Market Analysis, Opportunity and Forecast, By Distribution Channel, 2016-2032
- 7.5.1. APAC Granola Market Analysis by Distribution Channel: Introduction
- 7.5.2. Market Size Absolute $ Opportunity Analysis and Forecast, By Distribution Channel, 2016-2032
- 7.5.3. Supermarkets and Hypermarkets
- 7.5.4. Convenient Stores
- 7.5.5. Online Stores
- 7.6. APAC Granola Market Analysis, Opportunity and Forecast, By , 2016-2032
- 7.6.1. APAC Granola Market Analysis by : Introduction
- 7.6.2. Market Size Absolute $ Opportunity Analysis and Forecast, By , 2016-2032
- 7.7. APAC Granola Market Analysis, Opportunity and Forecast, By Country , 2016-2032
- 7.7.1. APAC Granola Market Analysis by Country : Introduction
- 7.7.2. Market Size Absolute $ Opportunity Analysis and Forecast, Country , 2016-2032
- 7.7.2.1. China
- 7.7.2.2. Japan
- 7.7.2.3. South Korea
- 7.7.2.4. India
- 7.7.2.5. Australia & New Zeland
- 7.7.2.6. Indonesia
- 7.7.2.7. Malaysia
- 7.7.2.8. Philippines
- 7.7.2.9. Singapore
- 7.7.2.10. Thailand
- 7.7.2.11. Vietnam
- 7.7.2.12. Rest of APAC
- 8. Latin America Granola Market Analysis, Opportunity and Forecast, 2016-2032
- 8.1. Latin America Granola Market Analysis, 2016-2021
- 8.2. Latin America Granola Market Opportunity and Forecast, 2023-2032
- 8.3. Latin America Granola Market Analysis, Opportunity and Forecast, By Product Type Analysis, 2016-2032
- 8.3.1. Latin America Granola Market Analysis by Product Type Analysis: Introduction
- 8.3.2. Market Size Absolute $ Opportunity Analysis and Forecast, By Product Type Analysis, 2016-2032
- 8.3.3. Cereal
- 8.3.4. Bar
- 8.3.5. Baked Goods
- 8.3.6. Trail mix
- 8.3.7. Fruit crisps
- 8.4. Latin America Granola Market Analysis, Opportunity and Forecast, By Flavor Analysis, 2016-2032
- 8.4.1. Latin America Granola Market Analysis by Flavor Analysis: Introduction
- 8.4.2. Market Size Absolute $ Opportunity Analysis and Forecast, By Flavor Analysis, 2016-2032
- 8.4.3. Classic Vanilla
- 8.4.4. Exotic Chocolate
- 8.4.5. Strawberry
- 8.4.6. Banana
- 8.4.7. Coconut
- 8.5. Latin America Granola Market Analysis, Opportunity and Forecast, By Distribution Channel, 2016-2032
- 8.5.1. Latin America Granola Market Analysis by Distribution Channel: Introduction
- 8.5.2. Market Size Absolute $ Opportunity Analysis and Forecast, By Distribution Channel, 2016-2032
- 8.5.3. Supermarkets and Hypermarkets
- 8.5.4. Convenient Stores
- 8.5.5. Online Stores
- 8.6. Latin America Granola Market Analysis, Opportunity and Forecast, By , 2016-2032
- 8.6.1. Latin America Granola Market Analysis by : Introduction
- 8.6.2. Market Size Absolute $ Opportunity Analysis and Forecast, By , 2016-2032
- 8.7. Latin America Granola Market Analysis, Opportunity and Forecast, By Country , 2016-2032
- 8.7.1. Latin America Granola Market Analysis by Country : Introduction
- 8.7.2. Market Size Absolute $ Opportunity Analysis and Forecast, Country , 2016-2032
- 8.7.2.1. Brazil
- 8.7.2.2. Colombia
- 8.7.2.3. Chile
- 8.7.2.4. Argentina
- 8.7.2.5. Costa Rica
- 8.7.2.6. Rest of Latin America
- 9. Middle East & Africa Granola Market Analysis, Opportunity and Forecast, 2016-2032
- 9.1. Middle East & Africa Granola Market Analysis, 2016-2021
- 9.2. Middle East & Africa Granola Market Opportunity and Forecast, 2023-2032
- 9.3. Middle East & Africa Granola Market Analysis, Opportunity and Forecast, By Product Type Analysis, 2016-2032
- 9.3.1. Middle East & Africa Granola Market Analysis by Product Type Analysis: Introduction
- 9.3.2. Market Size Absolute $ Opportunity Analysis and Forecast, By Product Type Analysis, 2016-2032
- 9.3.3. Cereal
- 9.3.4. Bar
- 9.3.5. Baked Goods
- 9.3.6. Trail mix
- 9.3.7. Fruit crisps
- 9.4. Middle East & Africa Granola Market Analysis, Opportunity and Forecast, By Flavor Analysis, 2016-2032
- 9.4.1. Middle East & Africa Granola Market Analysis by Flavor Analysis: Introduction
- 9.4.2. Market Size Absolute $ Opportunity Analysis and Forecast, By Flavor Analysis, 2016-2032
- 9.4.3. Classic Vanilla
- 9.4.4. Exotic Chocolate
- 9.4.5. Strawberry
- 9.4.6. Banana
- 9.4.7. Coconut
- 9.5. Middle East & Africa Granola Market Analysis, Opportunity and Forecast, By Distribution Channel, 2016-2032
- 9.5.1. Middle East & Africa Granola Market Analysis by Distribution Channel: Introduction
- 9.5.2. Market Size Absolute $ Opportunity Analysis and Forecast, By Distribution Channel, 2016-2032
- 9.5.3. Supermarkets and Hypermarkets
- 9.5.4. Convenient Stores
- 9.5.5. Online Stores
- 9.6. Middle East & Africa Granola Market Analysis, Opportunity and Forecast, By , 2016-2032
- 9.6.1. Middle East & Africa Granola Market Analysis by : Introduction
- 9.6.2. Market Size Absolute $ Opportunity Analysis and Forecast, By , 2016-2032
- 9.7. Middle East & Africa Granola Market Analysis, Opportunity and Forecast, By Country , 2016-2032
- 9.7.1. Middle East & Africa Granola Market Analysis by Country : Introduction
- 9.7.2. Market Size Absolute $ Opportunity Analysis and Forecast, Country , 2016-2032
- 9.7.2.1. Algeria
- 9.7.2.2. Egypt
- 9.7.2.3. Israel
- 9.7.2.4. Kuwait
- 9.7.2.5. Nigeria
- 9.7.2.6. Saudi Arabia
- 9.7.2.7. South Africa
- 9.7.2.8. Turkey
- 9.7.2.9. The UAE
- 9.7.2.10. Rest of MEA
- 10. Global Granola Market Analysis, Opportunity and Forecast, By Region , 2016-2032
- 10.1. Global Granola Market Analysis by Region : Introduction
- 10.2. Market Size Absolute $ Opportunity Analysis and Forecast, By Region , 2016-2032
- 10.2.1. North America
- 10.2.2. Western Europe
- 10.2.3. Eastern Europe
- 10.2.4. APAC
- 10.2.5. Latin America
- 10.2.6. Middle East & Africa
- 11. Global Granola Market Competitive Landscape, Market Share Analysis, and Company Profiles
- 11.1. Market Share Analysis
- 11.2. Company Profiles
- 11.3. Sunny Crunch Foods Ltd.
- 11.3.1. Company Overview
- 11.3.2. Financial Highlights
- 11.3.3. Product Portfolio
- 11.3.4. SWOT Analysis
- 11.3.5. Key Strategies and Developments
- 11.4. Kellogg Company
- 11.4.1. Company Overview
- 11.4.2. Financial Highlights
- 11.4.3. Product Portfolio
- 11.4.4. SWOT Analysis
- 11.4.5. Key Strategies and Developments
- 11.5. General Mills, Inc.
- 11.5.1. Company Overview
- 11.5.2. Financial Highlights
- 11.5.3. Product Portfolio
- 11.5.4. SWOT Analysis
- 11.5.5. Key Strategies and Developments
- 11.6. Kraft Foods Group, Inc.
- 11.6.1. Company Overview
- 11.6.2. Financial Highlights
- 11.6.3. Product Portfolio
- 11.6.4. SWOT Analysis
- 11.6.5. Key Strategies and Developments
- 11.7. Conagra Brands, Inc.
- 11.7.1. Company Overview
- 11.7.2. Financial Highlights
- 11.7.3. Product Portfolio
- 11.7.4. SWOT Analysis
- 11.7.5. Key Strategies and Developments
- 11.8. Nestlé S.A.
- 11.8.1. Company Overview
- 11.8.2. Financial Highlights
- 11.8.3. Product Portfolio
- 11.8.4. SWOT Analysis
- 11.8.5. Key Strategies and Developments
- 11.9. Slim Fast Nutritional Food LLC
- 11.9.1. Company Overview
- 11.9.2. Financial Highlights
- 11.9.3. Product Portfolio
- 11.9.4. SWOT Analysis
- 11.9.5. Key Strategies and Developments
- 11.10. Clif Bar & Company
- 11.10.1. Company Overview
- 11.10.2. Financial Highlights
- 11.10.3. Product Portfolio
- 11.10.4. SWOT Analysis
- 11.10.5. Key Strategies and Developments
- 11.11. The Quaker Oats Company, Inc.
- 11.11.1. Company Overview
- 11.11.2. Financial Highlights
- 11.11.3. Product Portfolio
- 11.11.4. SWOT Analysis
- 11.11.5. Key Strategies and Developments
- 11.12. Standard Functional Foods Group, Inc.
- 11.12.1. Company Overview
- 11.12.2. Financial Highlights
- 11.12.3. Product Portfolio
- 11.12.4. SWOT Analysis
- 11.12.5. Key Strategies and Developments
- 12. Assumptions and Acronyms
- 13. Research Methodology
- 14. Contact
- List of Figures
- Figure 1: Global Granola Market Revenue (US$ Mn) Market Share by Product Type Analysis in 2022
- Figure 2: Global Granola Market Attractiveness Analysis by Product Type Analysis, 2016-2032
- Figure 3: Global Granola Market Revenue (US$ Mn) Market Share by Flavor Analysisin 2022
- Figure 4: Global Granola Market Attractiveness Analysis by Flavor Analysis, 2016-2032
- Figure 5: Global Granola Market Revenue (US$ Mn) Market Share by Distribution Channelin 2022
- Figure 6: Global Granola Market Attractiveness Analysis by Distribution Channel, 2016-2032
- Figure 7: Global Granola Market Revenue (US$ Mn) Market Share by in 2022
- Figure 8: Global Granola Market Attractiveness Analysis by , 2016-2032
- Figure 9: Global Granola Market Revenue (US$ Mn) Market Share by Region in 2022
- Figure 10: Global Granola Market Attractiveness Analysis by Region, 2016-2032
- Figure 11: Global Granola Market Revenue (US$ Mn) (2016-2032)
- Figure 12: Global Granola Market Revenue (US$ Mn) Comparison by Region (2016-2032)
- Figure 13: Global Granola Market Revenue (US$ Mn) Comparison by Product Type Analysis (2016-2032)
- Figure 14: Global Granola Market Revenue (US$ Mn) Comparison by Flavor Analysis (2016-2032)
- Figure 15: Global Granola Market Revenue (US$ Mn) Comparison by Distribution Channel (2016-2032)
- Figure 16: Global Granola Market Revenue (US$ Mn) Comparison by (2016-2032)
- Figure 17: Global Granola Market Y-o-Y Growth Rate Comparison by Region (2016-2032)
- Figure 18: Global Granola Market Y-o-Y Growth Rate Comparison by Product Type Analysis (2016-2032)
- Figure 19: Global Granola Market Y-o-Y Growth Rate Comparison by Flavor Analysis (2016-2032)
- Figure 20: Global Granola Market Y-o-Y Growth Rate Comparison by Distribution Channel (2016-2032)
- Figure 21: Global Granola Market Y-o-Y Growth Rate Comparison by (2016-2032)
- Figure 22: Global Granola Market Share Comparison by Region (2016-2032)
- Figure 23: Global Granola Market Share Comparison by Product Type Analysis (2016-2032)
- Figure 24: Global Granola Market Share Comparison by Flavor Analysis (2016-2032)
- Figure 25: Global Granola Market Share Comparison by Distribution Channel (2016-2032)
- Figure 26: Global Granola Market Share Comparison by (2016-2032)
- Figure 27: North America Granola Market Revenue (US$ Mn) Market Share by Product Type Analysisin 2022
- Figure 28: North America Granola Market Attractiveness Analysis by Product Type Analysis, 2016-2032
- Figure 29: North America Granola Market Revenue (US$ Mn) Market Share by Flavor Analysisin 2022
- Figure 30: North America Granola Market Attractiveness Analysis by Flavor Analysis, 2016-2032
- Figure 31: North America Granola Market Revenue (US$ Mn) Market Share by Distribution Channelin 2022
- Figure 32: North America Granola Market Attractiveness Analysis by Distribution Channel, 2016-2032
- Figure 33: North America Granola Market Revenue (US$ Mn) Market Share by in 2022
- Figure 34: North America Granola Market Attractiveness Analysis by , 2016-2032
- Figure 35: North America Granola Market Revenue (US$ Mn) Market Share by Country in 2022
- Figure 36: North America Granola Market Attractiveness Analysis by Country, 2016-2032
- Figure 37: North America Granola Market Revenue (US$ Mn) (2016-2032)
- Figure 38: North America Granola Market Revenue (US$ Mn) Comparison by Country (2016-2032)
- Figure 39: North America Granola Market Revenue (US$ Mn) Comparison by Product Type Analysis (2016-2032)
- Figure 40: North America Granola Market Revenue (US$ Mn) Comparison by Flavor Analysis (2016-2032)
- Figure 41: North America Granola Market Revenue (US$ Mn) Comparison by Distribution Channel (2016-2032)
- Figure 42: North America Granola Market Revenue (US$ Mn) Comparison by (2016-2032)
- Figure 43: North America Granola Market Y-o-Y Growth Rate Comparison by Country (2016-2032)
- Figure 44: North America Granola Market Y-o-Y Growth Rate Comparison by Product Type Analysis (2016-2032)
- Figure 45: North America Granola Market Y-o-Y Growth Rate Comparison by Flavor Analysis (2016-2032)
- Figure 46: North America Granola Market Y-o-Y Growth Rate Comparison by Distribution Channel (2016-2032)
- Figure 47: North America Granola Market Y-o-Y Growth Rate Comparison by (2016-2032)
- Figure 48: North America Granola Market Share Comparison by Country (2016-2032)
- Figure 49: North America Granola Market Share Comparison by Product Type Analysis (2016-2032)
- Figure 50: North America Granola Market Share Comparison by Flavor Analysis (2016-2032)
- Figure 51: North America Granola Market Share Comparison by Distribution Channel (2016-2032)
- Figure 52: North America Granola Market Share Comparison by (2016-2032)
- Figure 53: Western Europe Granola Market Revenue (US$ Mn) Market Share by Product Type Analysisin 2022
- Figure 54: Western Europe Granola Market Attractiveness Analysis by Product Type Analysis, 2016-2032
- Figure 55: Western Europe Granola Market Revenue (US$ Mn) Market Share by Flavor Analysisin 2022
- Figure 56: Western Europe Granola Market Attractiveness Analysis by Flavor Analysis, 2016-2032
- Figure 57: Western Europe Granola Market Revenue (US$ Mn) Market Share by Distribution Channelin 2022
- Figure 58: Western Europe Granola Market Attractiveness Analysis by Distribution Channel, 2016-2032
- Figure 59: Western Europe Granola Market Revenue (US$ Mn) Market Share by in 2022
- Figure 60: Western Europe Granola Market Attractiveness Analysis by , 2016-2032
- Figure 61: Western Europe Granola Market Revenue (US$ Mn) Market Share by Country in 2022
- Figure 62: Western Europe Granola Market Attractiveness Analysis by Country, 2016-2032
- Figure 63: Western Europe Granola Market Revenue (US$ Mn) (2016-2032)
- Figure 64: Western Europe Granola Market Revenue (US$ Mn) Comparison by Country (2016-2032)
- Figure 65: Western Europe Granola Market Revenue (US$ Mn) Comparison by Product Type Analysis (2016-2032)
- Figure 66: Western Europe Granola Market Revenue (US$ Mn) Comparison by Flavor Analysis (2016-2032)
- Figure 67: Western Europe Granola Market Revenue (US$ Mn) Comparison by Distribution Channel (2016-2032)
- Figure 68: Western Europe Granola Market Revenue (US$ Mn) Comparison by (2016-2032)
- Figure 69: Western Europe Granola Market Y-o-Y Growth Rate Comparison by Country (2016-2032)
- Figure 70: Western Europe Granola Market Y-o-Y Growth Rate Comparison by Product Type Analysis (2016-2032)
- Figure 71: Western Europe Granola Market Y-o-Y Growth Rate Comparison by Flavor Analysis (2016-2032)
- Figure 72: Western Europe Granola Market Y-o-Y Growth Rate Comparison by Distribution Channel (2016-2032)
- Figure 73: Western Europe Granola Market Y-o-Y Growth Rate Comparison by (2016-2032)
- Figure 74: Western Europe Granola Market Share Comparison by Country (2016-2032)
- Figure 75: Western Europe Granola Market Share Comparison by Product Type Analysis (2016-2032)
- Figure 76: Western Europe Granola Market Share Comparison by Flavor Analysis (2016-2032)
- Figure 77: Western Europe Granola Market Share Comparison by Distribution Channel (2016-2032)
- Figure 78: Western Europe Granola Market Share Comparison by (2016-2032)
- Figure 79: Eastern Europe Granola Market Revenue (US$ Mn) Market Share by Product Type Analysisin 2022
- Figure 80: Eastern Europe Granola Market Attractiveness Analysis by Product Type Analysis, 2016-2032
- Figure 81: Eastern Europe Granola Market Revenue (US$ Mn) Market Share by Flavor Analysisin 2022
- Figure 82: Eastern Europe Granola Market Attractiveness Analysis by Flavor Analysis, 2016-2032
- Figure 83: Eastern Europe Granola Market Revenue (US$ Mn) Market Share by Distribution Channelin 2022
- Figure 84: Eastern Europe Granola Market Attractiveness Analysis by Distribution Channel, 2016-2032
- Figure 85: Eastern Europe Granola Market Revenue (US$ Mn) Market Share by in 2022
- Figure 86: Eastern Europe Granola Market Attractiveness Analysis by , 2016-2032
- Figure 87: Eastern Europe Granola Market Revenue (US$ Mn) Market Share by Country in 2022
- Figure 88: Eastern Europe Granola Market Attractiveness Analysis by Country, 2016-2032
- Figure 89: Eastern Europe Granola Market Revenue (US$ Mn) (2016-2032)
- Figure 90: Eastern Europe Granola Market Revenue (US$ Mn) Comparison by Country (2016-2032)
- Figure 91: Eastern Europe Granola Market Revenue (US$ Mn) Comparison by Product Type Analysis (2016-2032)
- Figure 92: Eastern Europe Granola Market Revenue (US$ Mn) Comparison by Flavor Analysis (2016-2032)
- Figure 93: Eastern Europe Granola Market Revenue (US$ Mn) Comparison by Distribution Channel (2016-2032)
- Figure 94: Eastern Europe Granola Market Revenue (US$ Mn) Comparison by (2016-2032)
- Figure 95: Eastern Europe Granola Market Y-o-Y Growth Rate Comparison by Country (2016-2032)
- Figure 96: Eastern Europe Granola Market Y-o-Y Growth Rate Comparison by Product Type Analysis (2016-2032)
- Figure 97: Eastern Europe Granola Market Y-o-Y Growth Rate Comparison by Flavor Analysis (2016-2032)
- Figure 98: Eastern Europe Granola Market Y-o-Y Growth Rate Comparison by Distribution Channel (2016-2032)
- Figure 99: Eastern Europe Granola Market Y-o-Y Growth Rate Comparison by (2016-2032)
- Figure 100: Eastern Europe Granola Market Share Comparison by Country (2016-2032)
- Figure 101: Eastern Europe Granola Market Share Comparison by Product Type Analysis (2016-2032)
- Figure 102: Eastern Europe Granola Market Share Comparison by Flavor Analysis (2016-2032)
- Figure 103: Eastern Europe Granola Market Share Comparison by Distribution Channel (2016-2032)
- Figure 104: Eastern Europe Granola Market Share Comparison by (2016-2032)
- Figure 105: APAC Granola Market Revenue (US$ Mn) Market Share by Product Type Analysisin 2022
- Figure 106: APAC Granola Market Attractiveness Analysis by Product Type Analysis, 2016-2032
- Figure 107: APAC Granola Market Revenue (US$ Mn) Market Share by Flavor Analysisin 2022
- Figure 108: APAC Granola Market Attractiveness Analysis by Flavor Analysis, 2016-2032
- Figure 109: APAC Granola Market Revenue (US$ Mn) Market Share by Distribution Channelin 2022
- Figure 110: APAC Granola Market Attractiveness Analysis by Distribution Channel, 2016-2032
- Figure 111: APAC Granola Market Revenue (US$ Mn) Market Share by in 2022
- Figure 112: APAC Granola Market Attractiveness Analysis by , 2016-2032
- Figure 113: APAC Granola Market Revenue (US$ Mn) Market Share by Country in 2022
- Figure 114: APAC Granola Market Attractiveness Analysis by Country, 2016-2032
- Figure 115: APAC Granola Market Revenue (US$ Mn) (2016-2032)
- Figure 116: APAC Granola Market Revenue (US$ Mn) Comparison by Country (2016-2032)
- Figure 117: APAC Granola Market Revenue (US$ Mn) Comparison by Product Type Analysis (2016-2032)
- Figure 118: APAC Granola Market Revenue (US$ Mn) Comparison by Flavor Analysis (2016-2032)
- Figure 119: APAC Granola Market Revenue (US$ Mn) Comparison by Distribution Channel (2016-2032)
- Figure 120: APAC Granola Market Revenue (US$ Mn) Comparison by (2016-2032)
- Figure 121: APAC Granola Market Y-o-Y Growth Rate Comparison by Country (2016-2032)
- Figure 122: APAC Granola Market Y-o-Y Growth Rate Comparison by Product Type Analysis (2016-2032)
- Figure 123: APAC Granola Market Y-o-Y Growth Rate Comparison by Flavor Analysis (2016-2032)
- Figure 124: APAC Granola Market Y-o-Y Growth Rate Comparison by Distribution Channel (2016-2032)
- Figure 125: APAC Granola Market Y-o-Y Growth Rate Comparison by (2016-2032)
- Figure 126: APAC Granola Market Share Comparison by Country (2016-2032)
- Figure 127: APAC Granola Market Share Comparison by Product Type Analysis (2016-2032)
- Figure 128: APAC Granola Market Share Comparison by Flavor Analysis (2016-2032)
- Figure 129: APAC Granola Market Share Comparison by Distribution Channel (2016-2032)
- Figure 130: APAC Granola Market Share Comparison by (2016-2032)
- Figure 131: Latin America Granola Market Revenue (US$ Mn) Market Share by Product Type Analysisin 2022
- Figure 132: Latin America Granola Market Attractiveness Analysis by Product Type Analysis, 2016-2032
- Figure 133: Latin America Granola Market Revenue (US$ Mn) Market Share by Flavor Analysisin 2022
- Figure 134: Latin America Granola Market Attractiveness Analysis by Flavor Analysis, 2016-2032
- Figure 135: Latin America Granola Market Revenue (US$ Mn) Market Share by Distribution Channelin 2022
- Figure 136: Latin America Granola Market Attractiveness Analysis by Distribution Channel, 2016-2032
- Figure 137: Latin America Granola Market Revenue (US$ Mn) Market Share by in 2022
- Figure 138: Latin America Granola Market Attractiveness Analysis by , 2016-2032
- Figure 139: Latin America Granola Market Revenue (US$ Mn) Market Share by Country in 2022
- Figure 140: Latin America Granola Market Attractiveness Analysis by Country, 2016-2032
- Figure 141: Latin America Granola Market Revenue (US$ Mn) (2016-2032)
- Figure 142: Latin America Granola Market Revenue (US$ Mn) Comparison by Country (2016-2032)
- Figure 143: Latin America Granola Market Revenue (US$ Mn) Comparison by Product Type Analysis (2016-2032)
- Figure 144: Latin America Granola Market Revenue (US$ Mn) Comparison by Flavor Analysis (2016-2032)
- Figure 145: Latin America Granola Market Revenue (US$ Mn) Comparison by Distribution Channel (2016-2032)
- Figure 146: Latin America Granola Market Revenue (US$ Mn) Comparison by (2016-2032)
- Figure 147: Latin America Granola Market Y-o-Y Growth Rate Comparison by Country (2016-2032)
- Figure 148: Latin America Granola Market Y-o-Y Growth Rate Comparison by Product Type Analysis (2016-2032)
- Figure 149: Latin America Granola Market Y-o-Y Growth Rate Comparison by Flavor Analysis (2016-2032)
- Figure 150: Latin America Granola Market Y-o-Y Growth Rate Comparison by Distribution Channel (2016-2032)
- Figure 151: Latin America Granola Market Y-o-Y Growth Rate Comparison by (2016-2032)
- Figure 152: Latin America Granola Market Share Comparison by Country (2016-2032)
- Figure 153: Latin America Granola Market Share Comparison by Product Type Analysis (2016-2032)
- Figure 154: Latin America Granola Market Share Comparison by Flavor Analysis (2016-2032)
- Figure 155: Latin America Granola Market Share Comparison by Distribution Channel (2016-2032)
- Figure 156: Latin America Granola Market Share Comparison by (2016-2032)
- Figure 157: Middle East & Africa Granola Market Revenue (US$ Mn) Market Share by Product Type Analysisin 2022
- Figure 158: Middle East & Africa Granola Market Attractiveness Analysis by Product Type Analysis, 2016-2032
- Figure 159: Middle East & Africa Granola Market Revenue (US$ Mn) Market Share by Flavor Analysisin 2022
- Figure 160: Middle East & Africa Granola Market Attractiveness Analysis by Flavor Analysis, 2016-2032
- Figure 161: Middle East & Africa Granola Market Revenue (US$ Mn) Market Share by Distribution Channelin 2022
- Figure 162: Middle East & Africa Granola Market Attractiveness Analysis by Distribution Channel, 2016-2032
- Figure 163: Middle East & Africa Granola Market Revenue (US$ Mn) Market Share by in 2022
- Figure 164: Middle East & Africa Granola Market Attractiveness Analysis by , 2016-2032
- Figure 165: Middle East & Africa Granola Market Revenue (US$ Mn) Market Share by Country in 2022
- Figure 166: Middle East & Africa Granola Market Attractiveness Analysis by Country, 2016-2032
- Figure 167: Middle East & Africa Granola Market Revenue (US$ Mn) (2016-2032)
- Figure 168: Middle East & Africa Granola Market Revenue (US$ Mn) Comparison by Country (2016-2032)
- Figure 169: Middle East & Africa Granola Market Revenue (US$ Mn) Comparison by Product Type Analysis (2016-2032)
- Figure 170: Middle East & Africa Granola Market Revenue (US$ Mn) Comparison by Flavor Analysis (2016-2032)
- Figure 171: Middle East & Africa Granola Market Revenue (US$ Mn) Comparison by Distribution Channel (2016-2032)
- Figure 172: Middle East & Africa Granola Market Revenue (US$ Mn) Comparison by (2016-2032)
- Figure 173: Middle East & Africa Granola Market Y-o-Y Growth Rate Comparison by Country (2016-2032)
- Figure 174: Middle East & Africa Granola Market Y-o-Y Growth Rate Comparison by Product Type Analysis (2016-2032)
- Figure 175: Middle East & Africa Granola Market Y-o-Y Growth Rate Comparison by Flavor Analysis (2016-2032)
- Figure 176: Middle East & Africa Granola Market Y-o-Y Growth Rate Comparison by Distribution Channel (2016-2032)
- Figure 177: Middle East & Africa Granola Market Y-o-Y Growth Rate Comparison by (2016-2032)
- Figure 178: Middle East & Africa Granola Market Share Comparison by Country (2016-2032)
- Figure 179: Middle East & Africa Granola Market Share Comparison by Product Type Analysis (2016-2032)
- Figure 180: Middle East & Africa Granola Market Share Comparison by Flavor Analysis (2016-2032)
- Figure 181: Middle East & Africa Granola Market Share Comparison by Distribution Channel (2016-2032)
- Figure 182: Middle East & Africa Granola Market Share Comparison by (2016-2032)
List of Tables
- Table 1: Global Granola Market Comparison by Product Type Analysis (2016-2032)
- Table 2: Global Granola Market Comparison by Flavor Analysis (2016-2032)
- Table 3: Global Granola Market Comparison by Distribution Channel (2016-2032)
- Table 4: Global Granola Market Comparison by (2016-2032)
- Table 5: Global Granola Market Revenue (US$ Mn) Comparison by Region (2016-2032)
- Table 6: Global Granola Market Revenue (US$ Mn) (2016-2032)
- Table 7: Global Granola Market Revenue (US$ Mn) Comparison by Region (2016-2032)
- Table 8: Global Granola Market Revenue (US$ Mn) Comparison by Product Type Analysis (2016-2032)
- Table 9: Global Granola Market Revenue (US$ Mn) Comparison by Flavor Analysis (2016-2032)
- Table 10: Global Granola Market Revenue (US$ Mn) Comparison by Distribution Channel (2016-2032)
- Table 11: Global Granola Market Revenue (US$ Mn) Comparison by (2016-2032)
- Table 12: Global Granola Market Y-o-Y Growth Rate Comparison by Region (2016-2032)
- Table 13: Global Granola Market Y-o-Y Growth Rate Comparison by Product Type Analysis (2016-2032)
- Table 14: Global Granola Market Y-o-Y Growth Rate Comparison by Flavor Analysis (2016-2032)
- Table 15: Global Granola Market Y-o-Y Growth Rate Comparison by Distribution Channel (2016-2032)
- Table 16: Global Granola Market Y-o-Y Growth Rate Comparison by (2016-2032)
- Table 17: Global Granola Market Share Comparison by Region (2016-2032)
- Table 18: Global Granola Market Share Comparison by Product Type Analysis (2016-2032)
- Table 19: Global Granola Market Share Comparison by Flavor Analysis (2016-2032)
- Table 20: Global Granola Market Share Comparison by Distribution Channel (2016-2032)
- Table 21: Global Granola Market Share Comparison by (2016-2032)
- Table 22: North America Granola Market Comparison by Flavor Analysis (2016-2032)
- Table 23: North America Granola Market Comparison by Distribution Channel (2016-2032)
- Table 24: North America Granola Market Comparison by (2016-2032)
- Table 25: North America Granola Market Revenue (US$ Mn) Comparison by Country (2016-2032)
- Table 26: North America Granola Market Revenue (US$ Mn) (2016-2032)
- Table 27: North America Granola Market Revenue (US$ Mn) Comparison by Country (2016-2032)
- Table 28: North America Granola Market Revenue (US$ Mn) Comparison by Product Type Analysis (2016-2032)
- Table 29: North America Granola Market Revenue (US$ Mn) Comparison by Flavor Analysis (2016-2032)
- Table 30: North America Granola Market Revenue (US$ Mn) Comparison by Distribution Channel (2016-2032)
- Table 31: North America Granola Market Revenue (US$ Mn) Comparison by (2016-2032)
- Table 32: North America Granola Market Y-o-Y Growth Rate Comparison by Country (2016-2032)
- Table 33: North America Granola Market Y-o-Y Growth Rate Comparison by Product Type Analysis (2016-2032)
- Table 34: North America Granola Market Y-o-Y Growth Rate Comparison by Flavor Analysis (2016-2032)
- Table 35: North America Granola Market Y-o-Y Growth Rate Comparison by Distribution Channel (2016-2032)
- Table 36: North America Granola Market Y-o-Y Growth Rate Comparison by (2016-2032)
- Table 37: North America Granola Market Share Comparison by Country (2016-2032)
- Table 38: North America Granola Market Share Comparison by Product Type Analysis (2016-2032)
- Table 39: North America Granola Market Share Comparison by Flavor Analysis (2016-2032)
- Table 40: North America Granola Market Share Comparison by Distribution Channel (2016-2032)
- Table 41: North America Granola Market Share Comparison by (2016-2032)
- Table 42: Western Europe Granola Market Comparison by Product Type Analysis (2016-2032)
- Table 43: Western Europe Granola Market Comparison by Flavor Analysis (2016-2032)
- Table 44: Western Europe Granola Market Comparison by Distribution Channel (2016-2032)
- Table 45: Western Europe Granola Market Comparison by (2016-2032)
- Table 46: Western Europe Granola Market Revenue (US$ Mn) Comparison by Country (2016-2032)
- Table 47: Western Europe Granola Market Revenue (US$ Mn) (2016-2032)
- Table 48: Western Europe Granola Market Revenue (US$ Mn) Comparison by Country (2016-2032)
- Table 49: Western Europe Granola Market Revenue (US$ Mn) Comparison by Product Type Analysis (2016-2032)
- Table 50: Western Europe Granola Market Revenue (US$ Mn) Comparison by Flavor Analysis (2016-2032)
- Table 51: Western Europe Granola Market Revenue (US$ Mn) Comparison by Distribution Channel (2016-2032)
- Table 52: Western Europe Granola Market Revenue (US$ Mn) Comparison by (2016-2032)
- Table 53: Western Europe Granola Market Y-o-Y Growth Rate Comparison by Country (2016-2032)
- Table 54: Western Europe Granola Market Y-o-Y Growth Rate Comparison by Product Type Analysis (2016-2032)
- Table 55: Western Europe Granola Market Y-o-Y Growth Rate Comparison by Flavor Analysis (2016-2032)
- Table 56: Western Europe Granola Market Y-o-Y Growth Rate Comparison by Distribution Channel (2016-2032)
- Table 57: Western Europe Granola Market Y-o-Y Growth Rate Comparison by (2016-2032)
- Table 58: Western Europe Granola Market Share Comparison by Country (2016-2032)
- Table 59: Western Europe Granola Market Share Comparison by Product Type Analysis (2016-2032)
- Table 60: Western Europe Granola Market Share Comparison by Flavor Analysis (2016-2032)
- Table 61: Western Europe Granola Market Share Comparison by Distribution Channel (2016-2032)
- Table 62: Western Europe Granola Market Share Comparison by (2016-2032)
- Table 63: Eastern Europe Granola Market Comparison by Product Type Analysis (2016-2032)
- Table 64: Eastern Europe Granola Market Comparison by Flavor Analysis (2016-2032)
- Table 65: Eastern Europe Granola Market Comparison by Distribution Channel (2016-2032)
- Table 66: Eastern Europe Granola Market Comparison by (2016-2032)
- Table 67: Eastern Europe Granola Market Revenue (US$ Mn) Comparison by Country (2016-2032)
- Table 68: Eastern Europe Granola Market Revenue (US$ Mn) (2016-2032)
- Table 69: Eastern Europe Granola Market Revenue (US$ Mn) Comparison by Country (2016-2032)
- Table 70: Eastern Europe Granola Market Revenue (US$ Mn) Comparison by Product Type Analysis (2016-2032)
- Table 71: Eastern Europe Granola Market Revenue (US$ Mn) Comparison by Flavor Analysis (2016-2032)
- Table 72: Eastern Europe Granola Market Revenue (US$ Mn) Comparison by Distribution Channel (2016-2032)
- Table 73: Eastern Europe Granola Market Revenue (US$ Mn) Comparison by (2016-2032)
- Table 74: Eastern Europe Granola Market Y-o-Y Growth Rate Comparison by Country (2016-2032)
- Table 75: Eastern Europe Granola Market Y-o-Y Growth Rate Comparison by Product Type Analysis (2016-2032)
- Table 76: Eastern Europe Granola Market Y-o-Y Growth Rate Comparison by Flavor Analysis (2016-2032)
- Table 77: Eastern Europe Granola Market Y-o-Y Growth Rate Comparison by Distribution Channel (2016-2032)
- Table 78: Eastern Europe Granola Market Y-o-Y Growth Rate Comparison by (2016-2032)
- Table 79: Eastern Europe Granola Market Share Comparison by Country (2016-2032)
- Table 80: Eastern Europe Granola Market Share Comparison by Product Type Analysis (2016-2032)
- Table 81: Eastern Europe Granola Market Share Comparison by Flavor Analysis (2016-2032)
- Table 82: Eastern Europe Granola Market Share Comparison by Distribution Channel (2016-2032)
- Table 83: Eastern Europe Granola Market Share Comparison by (2016-2032)
- Table 84: APAC Granola Market Comparison by Product Type Analysis (2016-2032)
- Table 85: APAC Granola Market Comparison by Flavor Analysis (2016-2032)
- Table 86: APAC Granola Market Comparison by Distribution Channel (2016-2032)
- Table 87: APAC Granola Market Comparison by (2016-2032)
- Table 88: APAC Granola Market Revenue (US$ Mn) Comparison by Country (2016-2032)
- Table 89: APAC Granola Market Revenue (US$ Mn) (2016-2032)
- Table 90: APAC Granola Market Revenue (US$ Mn) Comparison by Country (2016-2032)
- Table 91: APAC Granola Market Revenue (US$ Mn) Comparison by Product Type Analysis (2016-2032)
- Table 92: APAC Granola Market Revenue (US$ Mn) Comparison by Flavor Analysis (2016-2032)
- Table 93: APAC Granola Market Revenue (US$ Mn) Comparison by Distribution Channel (2016-2032)
- Table 94: APAC Granola Market Revenue (US$ Mn) Comparison by (2016-2032)
- Table 95: APAC Granola Market Y-o-Y Growth Rate Comparison by Country (2016-2032)
- Table 96: APAC Granola Market Y-o-Y Growth Rate Comparison by Product Type Analysis (2016-2032)
- Table 97: APAC Granola Market Y-o-Y Growth Rate Comparison by Flavor Analysis (2016-2032)
- Table 98: APAC Granola Market Y-o-Y Growth Rate Comparison by Distribution Channel (2016-2032)
- Table 99: APAC Granola Market Y-o-Y Growth Rate Comparison by (2016-2032)
- Table 100: APAC Granola Market Share Comparison by Country (2016-2032)
- Table 101: APAC Granola Market Share Comparison by Product Type Analysis (2016-2032)
- Table 102: APAC Granola Market Share Comparison by Flavor Analysis (2016-2032)
- Table 103: APAC Granola Market Share Comparison by Distribution Channel (2016-2032)
- Table 104: APAC Granola Market Share Comparison by (2016-2032)
- Table 105: Latin America Granola Market Comparison by Product Type Analysis (2016-2032)
- Table 106: Latin America Granola Market Comparison by Flavor Analysis (2016-2032)
- Table 107: Latin America Granola Market Comparison by Distribution Channel (2016-2032)
- Table 108: Latin America Granola Market Comparison by (2016-2032)
- Table 109: Latin America Granola Market Revenue (US$ Mn) Comparison by Country (2016-2032)
- Table 110: Latin America Granola Market Revenue (US$ Mn) (2016-2032)
- Table 111: Latin America Granola Market Revenue (US$ Mn) Comparison by Country (2016-2032)
- Table 112: Latin America Granola Market Revenue (US$ Mn) Comparison by Product Type Analysis (2016-2032)
- Table 113: Latin America Granola Market Revenue (US$ Mn) Comparison by Flavor Analysis (2016-2032)
- Table 114: Latin America Granola Market Revenue (US$ Mn) Comparison by Distribution Channel (2016-2032)
- Table 115: Latin America Granola Market Revenue (US$ Mn) Comparison by (2016-2032)
- Table 116: Latin America Granola Market Y-o-Y Growth Rate Comparison by Country (2016-2032)
- Table 117: Latin America Granola Market Y-o-Y Growth Rate Comparison by Product Type Analysis (2016-2032)
- Table 118: Latin America Granola Market Y-o-Y Growth Rate Comparison by Flavor Analysis (2016-2032)
- Table 119: Latin America Granola Market Y-o-Y Growth Rate Comparison by Distribution Channel (2016-2032)
- Table 120: Latin America Granola Market Y-o-Y Growth Rate Comparison by (2016-2032)
- Table 121: Latin America Granola Market Share Comparison by Country (2016-2032)
- Table 122: Latin America Granola Market Share Comparison by Product Type Analysis (2016-2032)
- Table 123: Latin America Granola Market Share Comparison by Flavor Analysis (2016-2032)
- Table 124: Latin America Granola Market Share Comparison by Distribution Channel (2016-2032)
- Table 125: Latin America Granola Market Share Comparison by (2016-2032)
- Table 126: Middle East & Africa Granola Market Comparison by Product Type Analysis (2016-2032)
- Table 127: Middle East & Africa Granola Market Comparison by Flavor Analysis (2016-2032)
- Table 128: Middle East & Africa Granola Market Comparison by Distribution Channel (2016-2032)
- Table 129: Middle East & Africa Granola Market Comparison by (2016-2032)
- Table 130: Middle East & Africa Granola Market Revenue (US$ Mn) Comparison by Country (2016-2032)
- Table 131: Middle East & Africa Granola Market Revenue (US$ Mn) (2016-2032)
- Table 132: Middle East & Africa Granola Market Revenue (US$ Mn) Comparison by Country (2016-2032)
- Table 133: Middle East & Africa Granola Market Revenue (US$ Mn) Comparison by Product Type Analysis (2016-2032)
- Table 134: Middle East & Africa Granola Market Revenue (US$ Mn) Comparison by Flavor Analysis (2016-2032)
- Table 135: Middle East & Africa Granola Market Revenue (US$ Mn) Comparison by Distribution Channel (2016-2032)
- Table 136: Middle East & Africa Granola Market Revenue (US$ Mn) Comparison by (2016-2032)
- Table 137: Middle East & Africa Granola Market Y-o-Y Growth Rate Comparison by Country (2016-2032)
- Table 138: Middle East & Africa Granola Market Y-o-Y Growth Rate Comparison by Product Type Analysis (2016-2032)
- Table 139: Middle East & Africa Granola Market Y-o-Y Growth Rate Comparison by Flavor Analysis (2016-2032)
- Table 140: Middle East & Africa Granola Market Y-o-Y Growth Rate Comparison by Distribution Channel (2016-2032)
- Table 141: Middle East & Africa Granola Market Y-o-Y Growth Rate Comparison by (2016-2032)
- Table 142: Middle East & Africa Granola Market Share Comparison by Country (2016-2032)
- Table 143: Middle East & Africa Granola Market Share Comparison by Product Type Analysis (2016-2032)
- Table 144: Middle East & Africa Granola Market Share Comparison by Flavor Analysis (2016-2032)
- Table 145: Middle East & Africa Granola Market Share Comparison by Distribution Channel (2016-2032)
- Table 146: Middle East & Africa Granola Market Share Comparison by (2016-2032)
- 1. Executive Summary
-
- Sunny Crunch Foods Ltd.
- Kellogg Company
- General Mills, Inc.
- Kraft Foods Group, Inc.
- Conagra Brands, Inc.
- Nestlé S.A.
- Slim Fast Nutritional Food LLC
- Clif Bar & Company
- The Quaker Oats Company, Inc.
- Standard Functional Foods Group, Inc.
Our Clients


View Our Licence Options
