
Smart Lighting Market Report By Offering (Hardware, Software, Services), By Communication Technology (Wired , Wireless), By Light Source (LED Lamps, Fluorescent Lamps, Compact Fluorescent Lamps (CFL), High-Intensity Discharge (HID) Lamps), By End User (Indoor, Outdoor, Others), )By Region and Companies - Industry Segment Outlook, Market Assessment, Competition Scenario, Trends and Forecast 2024-2033
-
44000
-
March 2024
-
130
-


-
This report was compiled by Vishwa Gaul Vishwa is an experienced market research and consulting professional with over 8 years of expertise in the ICT industry, contributing to over 700 reports across telecommunications, software, hardware, and digital solutions. Correspondence Team Lead- ICT Linkedin | Detailed Market research Methodology Our methodology involves a mix of primary research, including interviews with leading mental health experts, and secondary research from reputable medical journals and databases. View Detailed Methodology Page
-
Quick Navigation
Report Overview
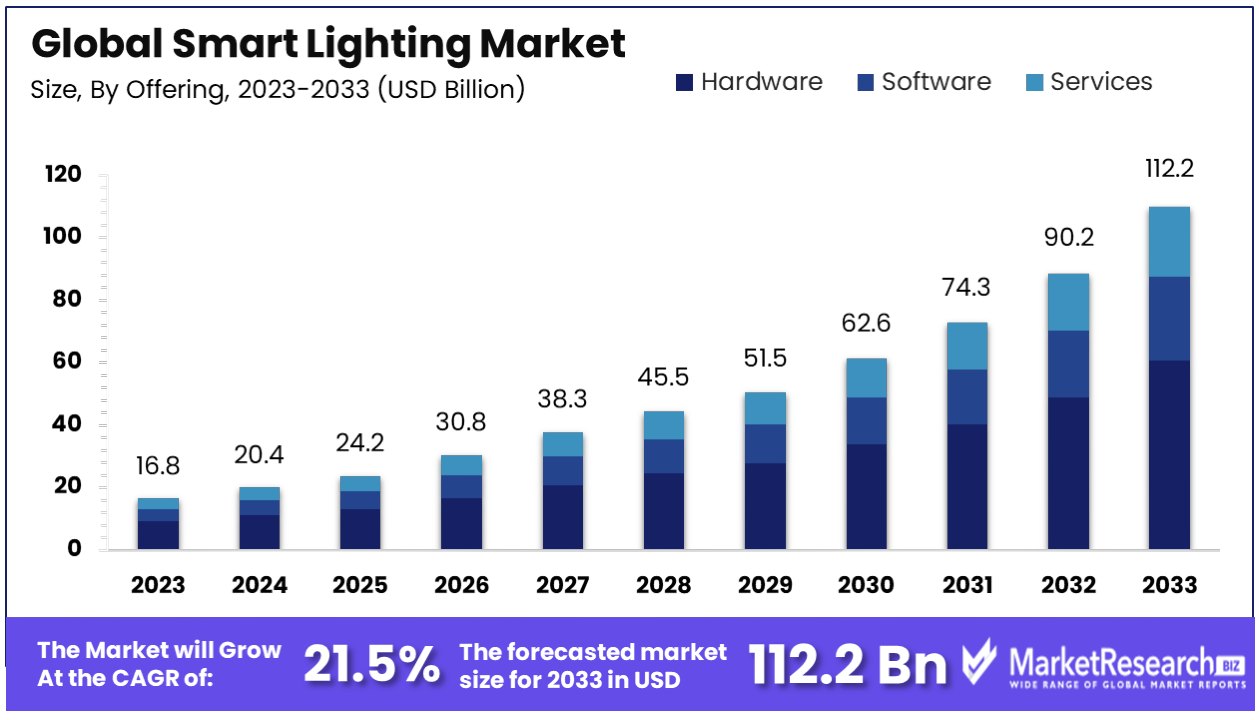
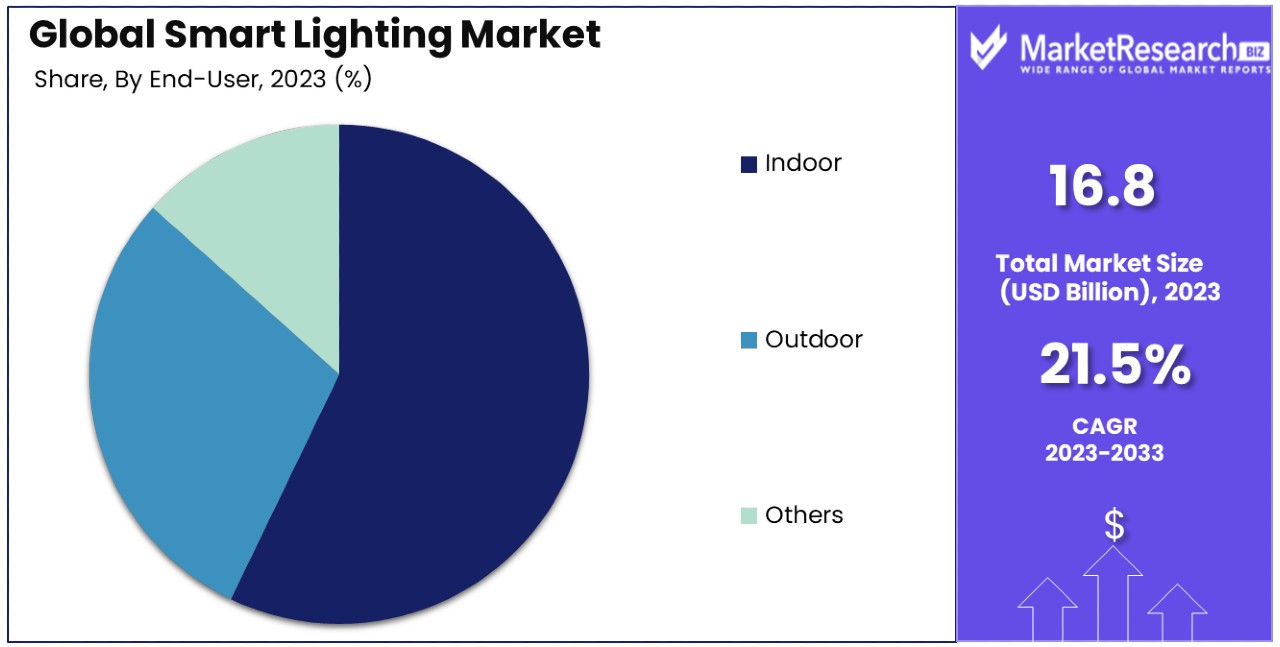
The Global Smart Lighting Market size is expected to be worth around USD 112.2 Billion by 2033, from USD 16.8 Billion in 2023, growing at a CAGR of 21.50% during the forecast period from 2024 to 2033.
The surge in demand for advanced technologies, increase in popularity for commercial and residential spaces, and individual preferences are some of the main key driving factors for the smart lighting market.
Smart lighting defines as an advanced lighting systems that uses technologies to offer improvise the control, automation and energy efficiency. Unlike old style lighting, smart lighting integrates features like sensors, connectivity to the internet and programmable settings permitting users to handle lighting remotely through smartphones and automation platforms.
Smart lighting systems often comprises LED bulbs equipped with embedded sensors to maintain brightness, ambience and color based on customer’s choices and environmental conditions.
Such systems provide personalized lighting situations, scheduling options and the potentiality to combine with other smart devices for a hassle-free connected home experience. With the potentiality to save energy, build customized lighting environments and improve convenience, smart lighting is becoming popular in homes offices and commercial spaces.
According to an article published by digital trends in October 2023, Nanoleaf discloses 4 new Matter devices comprising of 2 smart lamps. Moreover, the Cono portable lamp aids more than 16 million colors which lasts 5 hours needing a recharge and is created in such a manner that it can be angled towards the walls, ceiling or directly down at the surface its sitting on.
The Cup smart lamp is more unique as it serves as the storage bin for pens, scissors and other small items around the home. It also supports 16 million colors and can be controlled by using the Matter. Furthermore, all the 4 items are available online. The GU10 ships in early December and costs USD 50 for a 3 packs. The Downlight ships in mid- November and costs USD 35 for a single light. The Cono portable smart lamps ships in November and costs USD 95, while the cup smart lamp costs USD 130 and ships in April 2024.
Smart lighting is gaining much attention due to its energy efficiency, personalization and combination with smart home eco-systems. With features such as remote control, automation and sensor-based adjustments, it improves convenience, decrease energy consumption and contributes to a more connected and responsive living environment, bringing into line with modern eco-friendly and lifestyle trends.
Key Takeaways
- Market Value: The Global Smart Lighting Market is projected to reach approximately USD 112.2 Billion by 2033, experiencing substantial growth from USD 16.8 Billion in 2023, with a remarkable CAGR of 21.50% during the forecast period from 2024 to 2033.
- Dominant Segments:
- Offering Analysis: The 'Hardware' segment dominates with a 54.7% share, driven by smart bulbs, fixtures, and lighting controls that offer energy efficiency, user experience enhancements, and ambient customization.
- Communication Technology Analysis: 'Wired' communication technology leads with a 66.3% share, valued for its reliability and security, especially in commercial and industrial applications.
- Light Source Analysis: LED Lamps dominate the market due to their energy efficiency, longer lifespan, and adaptability, gradually replacing traditional lighting solutions like Fluorescent Lamps and Compact Fluorescent Lamps (CFL).
- End User Analysis: The 'Indoor' segment, covering Residential and Commercial applications, dominates with a 64% share, driven by the adoption of smart home technologies and energy-efficient lighting solutions.
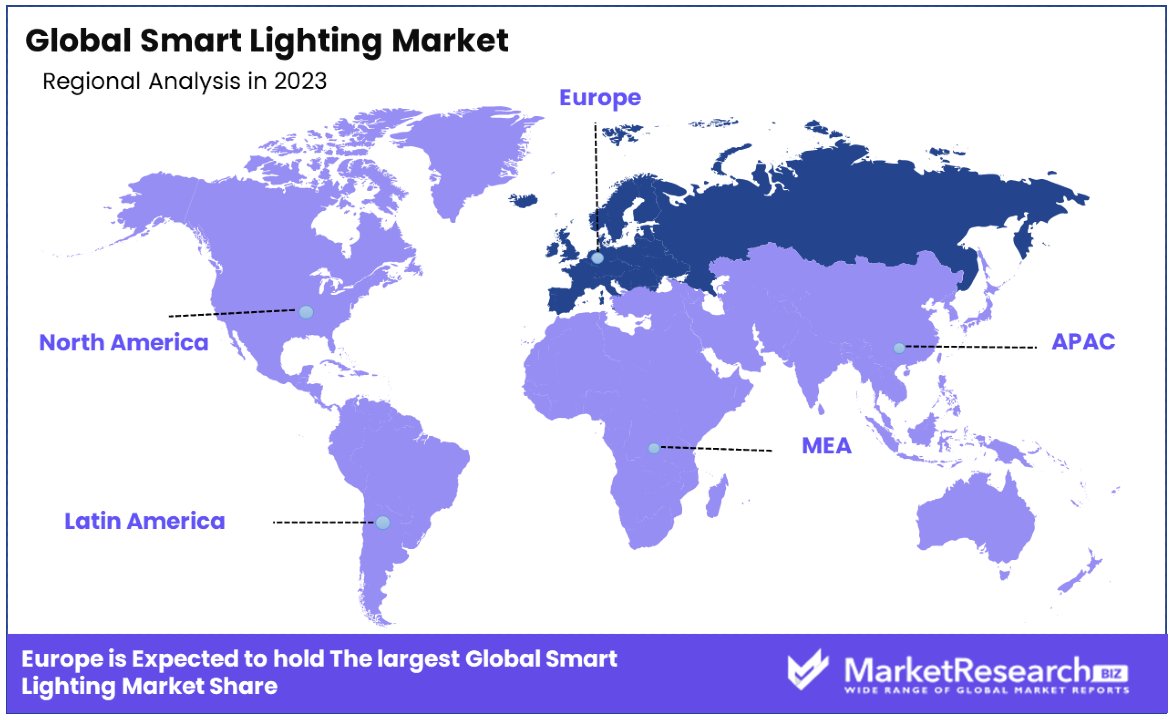
- Regional Analysis: Europe leads with a 38.6% market share, followed closely by North America with approximately 35%. Europe benefits from early adoption and significant investments in IoT infrastructure, while North America's rapid adoption of smart home technologies contributes to its market position.
- Key Players: Major players in the Smart Lighting Market include Signify (formerly Philips Lighting), Acuity Brands, Inc., General Electric Company, Osram Licht AG, and Eaton Corporation, among others.
- Analyst Viewpoint: The Smart Lighting Market's exponential growth is fueled by increasing awareness of energy efficiency, technological advancements in communication and lighting technologies, and the adoption of smart home solutions. Growth opportunities lie in further technological innovation, expanding market reach through targeted applications, and fostering interoperability and standardization within the industry.
Driving Factors
Energy Efficiency and Cost Savings Drive Smart Lighting Market Growth
Smart lighting systems are becoming increasingly popular due to their significant energy savings and reduced operational costs. These systems use advanced technologies to optimize lighting usage, adjusting brightness based on natural light availability and occupancy, leading to lower energy consumption.
The International Energy Agency (IEA) highlights the global target to double energy efficiency progress to 4% in 2023, which could reduce energy bills in advanced countries by one-third and account for 50% of CO2 reductions by 2030. This potential for substantial cost savings and environmental benefits is a major driving force behind the adoption of smart lighting in residential, commercial, and industrial sectors. As awareness of energy conservation grows and technology improves, smart lighting systems are set to become even more integral to achieving global energy efficiency goals, further propelling market growth.
Integration with Smart Home Technology Fuels Smart Lighting Market Expansion
The integration of smart lighting systems with the broader ecosystem of smart home technology is catalyzing market growth. The rise of the Internet of Things (IoT) has created a connected environment where devices communicate and operate together, enhancing the functionality and convenience of smart homes.
Smart lighting, as an integral component of this ecosystem, can be controlled and automated via smartphones, tablets, or voice-activated devices, offering seamless interaction with other smart home solutions. This interoperability not only enhances the user experience but also promotes the adoption of smart lighting systems as consumers seek more integrated, automated homes. As the smart home market continues to expand, the demand for compatible smart lighting solutions is expected to rise, contributing significantly to the sector's growth.
Improved User Experience and Convenience Enhance Smart Lighting Market Appeal
Smart lighting systems are revolutionizing the lighting industry by offering users unprecedented control and customization options. Features such as remote control, scheduling, dimming, and color-changing capabilities not only provide enhanced convenience but also allow users to personalize their lighting to suit their mood, activity, or the time of day.
This improved user experience is a key factor driving the smart lighting market's growth. Consumers are increasingly drawn to products that offer greater functionality and convenience, and smart lighting systems deliver on both fronts. As technology evolves and these systems become more sophisticated, their appeal is likely to increase further, attracting a wider audience and spurring continued market expansion.
Restraining Factors
Interoperability and Compatibility Issues Restrain Smart Lighting Market Growth
The growth of the Smart Lighting Market is hampered by interoperability and compatibility challenges among various smart lighting systems and smart home platforms. Without standardized protocols, integrating products from different manufacturers into a cohesive smart home environment becomes problematic, potentially leading to a fragmented user experience.
This lack of seamless integration can discourage consumers from adopting smart lighting solutions, fearing the complexity and inconvenience of managing incompatible devices. Addressing these interoperability issues is crucial for the market's expansion, as streamlined and user-friendly integration capabilities are essential for encouraging broader adoption of smart lighting technologies.
Security and Privacy Concerns Limit Smart Lighting Market Expansion
Security and privacy concerns present significant barriers to the growth of the Smart Lighting Market. As smart lighting systems become more interconnected with the Internet of Things (IoT), they potentially expose users to risks such as data breaches and unauthorized access. These concerns can deter consumers from incorporating smart lighting solutions into their homes, fearing for their personal information and privacy.
Building consumer trust through enhanced security measures and clear, transparent privacy policies is essential for overcoming these hurdles. Manufacturers and industry stakeholders must prioritize the development and implementation of robust security protocols to reassure users and foster a safer smart lighting ecosystem.
Offering Analysis
In the Smart Lighting Market, the 'Hardware' segment, including Smart Bulbs, Fixtures, and Lighting Controls, is dominant, holding a 54.7% share. This predominance is due to the tangible, immediate improvements these products offer in energy efficiency, user experience, and ambient enhancement.
Smart bulbs and fixtures provide users with unprecedented control over their lighting environments, allowing for adjustments in brightness, color, and scheduling, all of which contribute to energy savings and personalized spaces. Lighting controls, such as sensors and smart switches, further refine this experience by automating lighting based on occupancy or time of day, enhancing convenience and efficiency.
The 'Software' segment, though smaller, is critical for the integration and management of smart lighting systems. It includes applications and platforms that allow users to control and customize their lighting settings remotely. As smart lighting systems become more complex, the role of software in providing a seamless, user-friendly interface becomes increasingly important.
'Services' encompass installation, maintenance, and consulting services that support the deployment and optimization of smart lighting systems. As the market matures, the demand for professional services is expected to grow, particularly in commercial and industrial settings where lighting systems are more complex.
Communication Technology Analysis
The 'Wired' communication technology segment leads the Smart Lighting Market with a 66.3% share. This dominance is attributed to its reliability, security, and ability to handle high data volumes without interference, which are crucial in commercial and industrial applications where lighting systems are extensive and integral to operations. Wired systems, such as DALI (Digital Addressable Lighting Interface), are preferred in settings where a stable and secure connection is paramount.
The 'Wireless' segment, while smaller, is rapidly growing due to its flexibility, ease of installation, and scalability. Wireless technologies, including Zigbee, Bluetooth, and Wi-Fi, offer significant advantages for residential and small-scale commercial applications. They allow for easier retrofitting into existing buildings and provide users with the ability to easily expand or modify their smart lighting systems.
The growth in the 'Wireless' segment is propelled by advancements in technology that are improving the reliability and range of wireless communication. As these improvements continue, the gap between the capabilities of wired and wireless systems is narrowing, opening up new opportunities for wireless smart lighting solutions in a wider range of applications.
Light Source Analysis
The Smart Lighting Market is significantly diversified across various light sources, including LED Lamps, Fluorescent Lamps, Compact Fluorescent Lamps (CFL), and High-Intensity Discharge (HID) Lamps.
Among these, LED Lamps emerge as the dominant segment. Their ascendancy is attributed to their superior energy efficiency, longer lifespan, and decreasing cost over time compared to traditional lighting solutions. LEDs offer flexibility in terms of color temperature and brightness, making them ideal for integration into smart lighting systems that demand adaptability and energy conservation.
Fluorescent Lamps and Compact Fluorescent Lamps (CFL) have historically played significant roles in the market due to their energy efficiency over incandescent lamps. However, as technology progresses and environmental considerations become paramount, their market share is gradually being encroached upon by LED solutions.
High-Intensity Discharge (HID) Lamps, known for their high light output and efficiency, are typically used in large spaces or outdoor areas. However, the shift towards LED technology is evident in this segment as well, driven by LED's advancements and versatility.
End User Analysis
When analyzing the Smart Lighting Market by End User, the 'Indoor' segment, encompassing Residential and Commercial uses, dominates with a 64% share. This dominance is rooted in the increasing adoption of smart home technologies and energy-efficient lighting solutions within both homes and businesses. The drive for energy savings, coupled with the desire for enhanced ambiance and automated control over lighting, propels the demand for smart lighting solutions in these settings.
The 'Outdoor' segment, including Highways and Roadways, Architectural lighting, and others, while smaller, represents a significant area of growth. Smart lighting in outdoor settings is not only about energy efficiency but also plays crucial roles in safety, security, and enhancing the aesthetic appeal of public spaces. Innovations in this area, such as adaptive lighting and integration with citywide management systems, offer promising avenues for expansion.
The 'Others' category, which can include specialized applications such as horticultural lighting or lighting for healthcare settings, highlights the versatility and broad potential of smart lighting technologies. While currently a smaller part of the market, these niche applications could see growth driven by specific technological advancements and increasing recognition of the benefits of smart lighting solutions in diverse environments.
Key Market Segments
By Offering
- Hardware
- Software
- Services
By Communication Technology
- Wired
- Wireless
By Light Source
- LED Lamps
- Fluorescent Lamps
- Compact Fluorescent Lamps (CFL)
- High-Intensity Discharge (HID) Lamps
By End User
- Indoor
- Outdoor
- Others
Growth Opportunities
Integration with Smart Home Ecosystems Offers Growth Opportunity
The rising trend of smart home ecosystems is significantly enhancing the growth potential for the Smart Lighting Market. As households increasingly adopt smart devices, from voice assistants to home automation systems, the demand for smart lighting solutions that can integrate seamlessly into these ecosystems is escalating.
Consumers value the convenience and enhanced control offered by centralized smart home platforms, making smart lighting an essential component. This integration facilitates not just the convenience of voice-activated and remote-controlled lighting but also enables sophisticated scenarios and routines, such as lights that adjust based on time of day or occupancy. The ability of smart lighting systems to work harmoniously with other smart devices is a critical driver of market expansion, appealing to tech-savvy consumers and those seeking a cohesive smart home experience.
Energy-Efficient and Environmentally Conscious Solutions Offer Growth Opportunity
Amid growing environmental concerns and the global push towards sustainability, energy-efficient and environmentally friendly smart lighting solutions are set to capture significant market interest. Consumers are increasingly aware of their energy consumption's impact on both their wallets and the planet, prompting a shift towards lighting solutions that minimize energy use and carbon footprint.
Smart lighting systems, with their ability to precisely control light intensity, schedule operation, and adapt to ambient light conditions, present an attractive proposition. This shift towards eco-conscious consumption opens up avenues for manufacturers to innovate and market smart lighting products not just as a technological upgrade but as a contribution towards a more sustainable and energy-efficient lifestyle. The alignment of smart lighting with environmental sustainability principles is poised to be a key factor driving consumer adoption and market growth.
Trending Factors
Wireless Connectivity and Interoperability Are Trending Factors
The growing demand for smart lighting systems equipped with wireless connectivity is reshaping the Smart Lighting Market. Technologies like Wi-Fi, Bluetooth, and Zigbee are pivotal because they allow smart lighting solutions to connect and communicate effortlessly with a wide array of devices and platforms. This trend addresses the critical need for compatibility and seamless integration within the broader smart home ecosystem, enhancing user convenience and experience.
Wireless interoperability enables users to control their lighting systems through smartphones, voice assistants, or other smart devices, promoting a unified smart home environment. As consumers increasingly value the ease of managing their home environments through a single interface, the importance of wireless connectivity and interoperability in smart lighting systems continues to grow, driving market innovation and expansion.
Customizable and Personalized Lighting Experiences Are Trending Factors
Customizable and personalized lighting solutions are becoming a significant trend in the Smart Lighting Market. Today's consumers desire more than just illumination from their lighting systems; they seek the ability to personalize their living spaces with tunable color temperatures, dynamic lighting scenes, and scheduling features. This demand stems from the desire to have lighting that adapts to individual lifestyles, moods, and activities, moving away from the limitations of traditional, one-size-fits-all lighting solutions.
Personalized lighting experiences allow users to create ambiances that reflect their preferences and needs, significantly enhancing the appeal of smart lighting solutions. As manufacturers continue to innovate in providing more adaptable and user-centric lighting options, customizable and personalized experiences are set to drive the market forward, making smart lighting an integral part of modern, user-focused home design.
Regional Analysis
Europe Dominates with 38.6% Market Share
Europe's leadership in the Smart Lighting Market, holding a 38.6% share, is driven by several key factors. High levels of environmental awareness, advanced technological infrastructure, and strong regulatory support for energy efficiency across the EU contribute significantly. European consumers and businesses are increasingly adopting smart lighting solutions as part of broader smart home and smart city initiatives, bolstered by government policies aimed at reducing energy consumption and CO2 emissions.
Market dynamics in Europe are further influenced by the region's focus on innovation and sustainability. European manufacturers and tech companies are at the forefront of developing smart lighting technologies that integrate seamlessly with other smart home systems, offering enhanced functionality and user experiences.
Europe's market presence is expected to remain influential, with continued growth driven by sustainable urban development projects and the increasing adoption of IoT devices. The region's commitment to environmental goals and digital transformation is likely to spur further innovations in the smart lighting sector, maintaining Europe's position as a key market leader.
Regional Market Shares and Dynamics:
- North America: Following closely, North America accounts for approximately 35% of the market, driven by the rapid adoption of smart home technologies and significant investments in IoT infrastructure.
- Asia Pacific: With around 20% market share, Asia Pacific is experiencing fast growth due to expanding urbanization, smart city initiatives, and increasing awareness of energy efficiency.
- Middle East & Africa: Holding a smaller share of around 4%, the MEA region is witnessing gradual growth with the development of smart cities and increased focus on sustainable energy solutions.
- Latin America: Representing about 3% of the market, Latin America is slowly adopting smart lighting solutions, with growth hindered by economic variability but potential driven by urban modernization efforts.
Key Regions and Countries
- North America
- The US
- Canada
- Mexico
- Western Europe
- Germany
- France
- The UK
- Spain
- Italy
- Portugal
- Ireland
- Austria
- Switzerland
- Benelux
- Nordic
- Rest of Western Europe
- Eastern Europe
- Russia
- Poland
- The Czech Republic
- Greece
- Rest of Eastern Europe
- APAC
- China
- Japan
- South Korea
- India
- Australia & New Zealand
- Indonesia
- Malaysia
- Philippines
- Singapore
- Thailand
- Vietnam
- Rest of APAC
- Latin America
- Brazil
- Colombia
- Chile
- Argentina
- Costa Rica
- Rest of Latin America
- Middle East & Africa
- Algeria
- Egypt
- Israel
- Kuwait
- Nigeria
- Saudi Arabia
- South Africa
- Turkey
- United Arab Emirates
- Rest of MEA
Key Players Analysis
In the dynamic landscape of the smart lighting industry, major players are strategically positioned to capitalize on the growing adoption of intelligent lighting systems across various sectors. Honeywell International Inc., OSRAM Licht AG, and Wipro Lighting hold significant market influence, commanding the largest market share.
The smart lighting market size continues to expand, driven by increasing investments in smart city projects and the commercial sector. Companies such as Acuity Brands Inc. and Zumtobel Group AG are leveraging their expertise to cater to the evolving needs of these initiatives, securing a substantial revenue share.
Philips Hue, Lutron Electronics Co. Inc., and Schneider Electric SE are among the major companies driving innovation in smart lighting technology. Their focus on developing efficient and scalable solutions has positioned them as key players in the industry, attracting significant attention from both consumers and businesses.
One of the main challenges in the smart lighting market is the initial cost of installation, particularly for outdoor applications. However, with advancements in technology and the emergence of more cost-effective solutions, players like Hubbell Incorporated and Cree Inc. are working towards mitigating this barrier, driving broader adoption.
Legrand S.A. and Bridgelux Inc. are also making significant contributions to the smart lighting industry, aiming to capture a larger share of the market through innovative product offerings and strategic partnerships.
As the demand for smart lighting solutions continues to rise, major players are expected to play a pivotal role in shaping the future of this dynamic sector. With their strong market presence and commitment to innovation, these companies are well-positioned to capitalize on emerging opportunities and drive further growth in the smart lighting market.
Market Key Players
- Honeywell International Inc.
- OSRAM Licht AG
- Wipro Lighting
- Acuity Brands Inc.
- Zumtobel Group AG
- Legrand S.A.
- Philips Hue
- Lutron Electronics Co. Inc.
- Schneider Electric SE
- Hubbell Incorporated
- Cree Inc.
- Bridgelux Inc.
Recent Developments
- On March 2024, Nanoleaf unveiled its Smart Lamp Collection in collaboration with Umbra, introducing the Cono Portable Lamp and Cup Lamp.
- On February 2024, Lifx, a prominent smart lighting company, reemerged with a new line of outdoor lights, marking its return to the market after facing financial challenges and almost going out of business in 2022.
- On February 2024, Signify launched the Philips Smart Light Hub in New Delhi, offering customers a comprehensive destination for all their lighting needs with over 300 SKUs in an immersive and interactive environment designed to showcase the latest innovations in smart lighting technology
- On January 2024, Halonix Technologies launched India's first 'UP-DOWN GLOW' LED Bulb, catering to modern-day consumers seeking cost-effective and innovative lighting solutions.
Report Scope
Report Features Description Market Value (2023) USD 16.8 Billion Forecast Revenue (2033) USD 112.2 Billion CAGR (2024-2033) 21.50% Base Year for Estimation 2023 Historic Period 2018-2023 Forecast Period 2024-2033 Report Coverage Revenue Forecast, Market Dynamics, Competitive Landscape, Recent Developments Segments Covered By Offering (Hardware, Software, Services), By Communication Technology (Wired , Wireless), By Light Source (LED Lamps, Fluorescent Lamps, Compact Fluorescent Lamps (CFL), High-Intensity Discharge (HID) Lamps), By End User (Indoor, Outdoor, Others) Regional Analysis North America - The US, Canada, & Mexico; Western Europe - Germany, France, The UK, Spain, Italy, Portugal, Ireland, Austria, Switzerland, Benelux, Nordic, & Rest of Western Europe; Eastern Europe - Russia, Poland, The Czech Republic, Greece, & Rest of Eastern Europe; APAC - China, Japan, South Korea, India, Australia & New Zealand, Indonesia, Malaysia, Philippines, Singapore, Thailand, Vietnam, & Rest of APAC; Latin America - Brazil, Colombia, Chile, Argentina, Costa Rica, & Rest of Latin America; Middle East & Africa - Algeria, Egypt, Israel, Kuwait, Nigeria, Saudi Arabia, South Africa, Turkey, United Arab Emirates, & Rest of MEA Competitive Landscape Honeywell International Inc., OSRAM Licht AG, Wipro Lighting, Acuity Brands Inc., Zumtobel Group AG, Legrand S.A., Philips Hue, Lutron Electronics Co. Inc., Schneider Electric SE, Hubbell Incorporated, Cree Inc., Bridgelux Inc. Customization Scope Customization for segments, region/country-level will be provided. Moreover, additional customization can be done based on the requirements. Purchase Options We have three licenses to opt for: Single User License, Multi-User License (Up to 5 Users), Corporate Use License (Unlimited User and Printable PDF) -
- 1. Executive Summary
- 1.1. Definition
- 1.2. Taxonomy
- 1.3. Research Scope
- 1.4. Key Analysis
- 1.5. Key Findings by Major Segments
- 1.6. Top strategies by Major Players
- 2. Global Smart Lighting Market Overview
- 2.1. Smart Lighting Market Dynamics
- 2.1.1. Drivers
- 2.1.2. Opportunities
- 2.1.3. Restraints
- 2.1.4. Challenges
- 2.2. Macro-economic Factors
- 2.3. Regulatory Framework
- 2.4. Market Investment Feasibility Index
- 2.5. PEST Analysis
- 2.6. PORTER’S Five Force Analysis
- 2.7. Drivers & Restraints Impact Analysis
- 2.8. Industry Chain Analysis
- 2.9. Cost Structure Analysis
- 2.10. Marketing Strategy
- 2.11. Russia-Ukraine War Impact Analysis
- 2.12. Opportunity Map Analysis
- 2.13. Market Competition Scenario Analysis
- 2.14. Product Life Cycle Analysis
- 2.15. Opportunity Orbits
- 2.16. Manufacturer Intensity Map
- 2.17. Major Companies sales by Value & Volume
- 2.1. Smart Lighting Market Dynamics
- 3. Global Smart Lighting Market Analysis, Opportunity and Forecast, 2016-2032
- 3.1. Global Smart Lighting Market Analysis, 2016-2021
- 3.2. Global Smart Lighting Market Opportunity and Forecast, 2023-2032
- 3.3. Global Smart Lighting Market Analysis, Opportunity and Forecast, By Offering, 2016-2032
- 3.3.1. Global Smart Lighting Market Analysis by Offering: Introduction
- 3.3.2. Market Size Absolute $ Opportunity Analysis and Forecast, By Offering, 2016-2032
- 3.3.3. Hardware
- 3.3.4. Software
- 3.3.5. Services
- 3.4. Global Smart Lighting Market Analysis, Opportunity and Forecast, By Communication Technology, 2016-2032
- 3.4.1. Global Smart Lighting Market Analysis by Communication Technology: Introduction
- 3.4.2. Market Size Absolute $ Opportunity Analysis and Forecast, By Communication Technology, 2016-2032
- 3.4.3. Wired
- 3.4.4. Wireless
- 3.5. Global Smart Lighting Market Analysis, Opportunity and Forecast, By Light Source, 2016-2032
- 3.5.1. Global Smart Lighting Market Analysis by Light Source: Introduction
- 3.5.2. Market Size Absolute $ Opportunity Analysis and Forecast, By Light Source, 2016-2032
- 3.5.3. LED Lamps
- 3.5.4. Fluorescent Lamps
- 3.5.5. Compact Fluorescent Lamps (CFL)
- 3.5.6. High-Intensity Discharge (HID) Lamps
- 3.6. Global Smart Lighting Market Analysis, Opportunity and Forecast, By End User, 2016-2032
- 3.6.1. Global Smart Lighting Market Analysis by End User: Introduction
- 3.6.2. Market Size Absolute $ Opportunity Analysis and Forecast, By End User, 2016-2032
- 3.6.3. Indoor
- 3.6.4. Outdoor
- 3.6.5. Others
- 4. North America Smart Lighting Market Analysis, Opportunity and Forecast, 2016-2032
- 4.1. North America Smart Lighting Market Analysis, 2016-2021
- 4.2. North America Smart Lighting Market Opportunity and Forecast, 2023-2032
- 4.3. North America Smart Lighting Market Analysis, Opportunity and Forecast, By Offering, 2016-2032
- 4.3.1. North America Smart Lighting Market Analysis by Offering: Introduction
- 4.3.2. Market Size Absolute $ Opportunity Analysis and Forecast, By Offering, 2016-2032
- 4.3.3. Hardware
- 4.3.4. Software
- 4.3.5. Services
- 4.4. North America Smart Lighting Market Analysis, Opportunity and Forecast, By Communication Technology, 2016-2032
- 4.4.1. North America Smart Lighting Market Analysis by Communication Technology: Introduction
- 4.4.2. Market Size Absolute $ Opportunity Analysis and Forecast, By Communication Technology, 2016-2032
- 4.4.3. Wired
- 4.4.4. Wireless
- 4.5. North America Smart Lighting Market Analysis, Opportunity and Forecast, By Light Source, 2016-2032
- 4.5.1. North America Smart Lighting Market Analysis by Light Source: Introduction
- 4.5.2. Market Size Absolute $ Opportunity Analysis and Forecast, By Light Source, 2016-2032
- 4.5.3. LED Lamps
- 4.5.4. Fluorescent Lamps
- 4.5.5. Compact Fluorescent Lamps (CFL)
- 4.5.6. High-Intensity Discharge (HID) Lamps
- 4.6. North America Smart Lighting Market Analysis, Opportunity and Forecast, By End User, 2016-2032
- 4.6.1. North America Smart Lighting Market Analysis by End User: Introduction
- 4.6.2. Market Size Absolute $ Opportunity Analysis and Forecast, By End User, 2016-2032
- 4.6.3. Indoor
- 4.6.4. Outdoor
- 4.6.5. Others
- 4.7. North America Smart Lighting Market Analysis, Opportunity and Forecast, By Country , 2016-2032
- 4.7.1. North America Smart Lighting Market Analysis by Country : Introduction
- 4.7.2. Market Size Absolute $ Opportunity Analysis and Forecast, Country , 2016-2032
- 4.7.2.1. The US
- 4.7.2.2. Canada
- 4.7.2.3. Mexico
- 5. Western Europe Smart Lighting Market Analysis, Opportunity and Forecast, 2016-2032
- 5.1. Western Europe Smart Lighting Market Analysis, 2016-2021
- 5.2. Western Europe Smart Lighting Market Opportunity and Forecast, 2023-2032
- 5.3. Western Europe Smart Lighting Market Analysis, Opportunity and Forecast, By Offering, 2016-2032
- 5.3.1. Western Europe Smart Lighting Market Analysis by Offering: Introduction
- 5.3.2. Market Size Absolute $ Opportunity Analysis and Forecast, By Offering, 2016-2032
- 5.3.3. Hardware
- 5.3.4. Software
- 5.3.5. Services
- 5.4. Western Europe Smart Lighting Market Analysis, Opportunity and Forecast, By Communication Technology, 2016-2032
- 5.4.1. Western Europe Smart Lighting Market Analysis by Communication Technology: Introduction
- 5.4.2. Market Size Absolute $ Opportunity Analysis and Forecast, By Communication Technology, 2016-2032
- 5.4.3. Wired
- 5.4.4. Wireless
- 5.5. Western Europe Smart Lighting Market Analysis, Opportunity and Forecast, By Light Source, 2016-2032
- 5.5.1. Western Europe Smart Lighting Market Analysis by Light Source: Introduction
- 5.5.2. Market Size Absolute $ Opportunity Analysis and Forecast, By Light Source, 2016-2032
- 5.5.3. LED Lamps
- 5.5.4. Fluorescent Lamps
- 5.5.5. Compact Fluorescent Lamps (CFL)
- 5.5.6. High-Intensity Discharge (HID) Lamps
- 5.6. Western Europe Smart Lighting Market Analysis, Opportunity and Forecast, By End User, 2016-2032
- 5.6.1. Western Europe Smart Lighting Market Analysis by End User: Introduction
- 5.6.2. Market Size Absolute $ Opportunity Analysis and Forecast, By End User, 2016-2032
- 5.6.3. Indoor
- 5.6.4. Outdoor
- 5.6.5. Others
- 5.7. Western Europe Smart Lighting Market Analysis, Opportunity and Forecast, By Country , 2016-2032
- 5.7.1. Western Europe Smart Lighting Market Analysis by Country : Introduction
- 5.7.2. Market Size Absolute $ Opportunity Analysis and Forecast, Country , 2016-2032
- 5.7.2.1. Germany
- 5.7.2.2. France
- 5.7.2.3. The UK
- 5.7.2.4. Spain
- 5.7.2.5. Italy
- 5.7.2.6. Portugal
- 5.7.2.7. Ireland
- 5.7.2.8. Austria
- 5.7.2.9. Switzerland
- 5.7.2.10. Benelux
- 5.7.2.11. Nordic
- 5.7.2.12. Rest of Western Europe
- 6. Eastern Europe Smart Lighting Market Analysis, Opportunity and Forecast, 2016-2032
- 6.1. Eastern Europe Smart Lighting Market Analysis, 2016-2021
- 6.2. Eastern Europe Smart Lighting Market Opportunity and Forecast, 2023-2032
- 6.3. Eastern Europe Smart Lighting Market Analysis, Opportunity and Forecast, By Offering, 2016-2032
- 6.3.1. Eastern Europe Smart Lighting Market Analysis by Offering: Introduction
- 6.3.2. Market Size Absolute $ Opportunity Analysis and Forecast, By Offering, 2016-2032
- 6.3.3. Hardware
- 6.3.4. Software
- 6.3.5. Services
- 6.4. Eastern Europe Smart Lighting Market Analysis, Opportunity and Forecast, By Communication Technology, 2016-2032
- 6.4.1. Eastern Europe Smart Lighting Market Analysis by Communication Technology: Introduction
- 6.4.2. Market Size Absolute $ Opportunity Analysis and Forecast, By Communication Technology, 2016-2032
- 6.4.3. Wired
- 6.4.4. Wireless
- 6.5. Eastern Europe Smart Lighting Market Analysis, Opportunity and Forecast, By Light Source, 2016-2032
- 6.5.1. Eastern Europe Smart Lighting Market Analysis by Light Source: Introduction
- 6.5.2. Market Size Absolute $ Opportunity Analysis and Forecast, By Light Source, 2016-2032
- 6.5.3. LED Lamps
- 6.5.4. Fluorescent Lamps
- 6.5.5. Compact Fluorescent Lamps (CFL)
- 6.5.6. High-Intensity Discharge (HID) Lamps
- 6.6. Eastern Europe Smart Lighting Market Analysis, Opportunity and Forecast, By End User, 2016-2032
- 6.6.1. Eastern Europe Smart Lighting Market Analysis by End User: Introduction
- 6.6.2. Market Size Absolute $ Opportunity Analysis and Forecast, By End User, 2016-2032
- 6.6.3. Indoor
- 6.6.4. Outdoor
- 6.6.5. Others
- 6.7. Eastern Europe Smart Lighting Market Analysis, Opportunity and Forecast, By Country , 2016-2032
- 6.7.1. Eastern Europe Smart Lighting Market Analysis by Country : Introduction
- 6.7.2. Market Size Absolute $ Opportunity Analysis and Forecast, Country , 2016-2032
- 6.7.2.1. Russia
- 6.7.2.2. Poland
- 6.7.2.3. The Czech Republic
- 6.7.2.4. Greece
- 6.7.2.5. Rest of Eastern Europe
- 7. APAC Smart Lighting Market Analysis, Opportunity and Forecast, 2016-2032
- 7.1. APAC Smart Lighting Market Analysis, 2016-2021
- 7.2. APAC Smart Lighting Market Opportunity and Forecast, 2023-2032
- 7.3. APAC Smart Lighting Market Analysis, Opportunity and Forecast, By Offering, 2016-2032
- 7.3.1. APAC Smart Lighting Market Analysis by Offering: Introduction
- 7.3.2. Market Size Absolute $ Opportunity Analysis and Forecast, By Offering, 2016-2032
- 7.3.3. Hardware
- 7.3.4. Software
- 7.3.5. Services
- 7.4. APAC Smart Lighting Market Analysis, Opportunity and Forecast, By Communication Technology, 2016-2032
- 7.4.1. APAC Smart Lighting Market Analysis by Communication Technology: Introduction
- 7.4.2. Market Size Absolute $ Opportunity Analysis and Forecast, By Communication Technology, 2016-2032
- 7.4.3. Wired
- 7.4.4. Wireless
- 7.5. APAC Smart Lighting Market Analysis, Opportunity and Forecast, By Light Source, 2016-2032
- 7.5.1. APAC Smart Lighting Market Analysis by Light Source: Introduction
- 7.5.2. Market Size Absolute $ Opportunity Analysis and Forecast, By Light Source, 2016-2032
- 7.5.3. LED Lamps
- 7.5.4. Fluorescent Lamps
- 7.5.5. Compact Fluorescent Lamps (CFL)
- 7.5.6. High-Intensity Discharge (HID) Lamps
- 7.6. APAC Smart Lighting Market Analysis, Opportunity and Forecast, By End User, 2016-2032
- 7.6.1. APAC Smart Lighting Market Analysis by End User: Introduction
- 7.6.2. Market Size Absolute $ Opportunity Analysis and Forecast, By End User, 2016-2032
- 7.6.3. Indoor
- 7.6.4. Outdoor
- 7.6.5. Others
- 7.7. APAC Smart Lighting Market Analysis, Opportunity and Forecast, By Country , 2016-2032
- 7.7.1. APAC Smart Lighting Market Analysis by Country : Introduction
- 7.7.2. Market Size Absolute $ Opportunity Analysis and Forecast, Country , 2016-2032
- 7.7.2.1. China
- 7.7.2.2. Japan
- 7.7.2.3. South Korea
- 7.7.2.4. India
- 7.7.2.5. Australia & New Zeland
- 7.7.2.6. Indonesia
- 7.7.2.7. Malaysia
- 7.7.2.8. Philippines
- 7.7.2.9. Singapore
- 7.7.2.10. Thailand
- 7.7.2.11. Vietnam
- 7.7.2.12. Rest of APAC
- 8. Latin America Smart Lighting Market Analysis, Opportunity and Forecast, 2016-2032
- 8.1. Latin America Smart Lighting Market Analysis, 2016-2021
- 8.2. Latin America Smart Lighting Market Opportunity and Forecast, 2023-2032
- 8.3. Latin America Smart Lighting Market Analysis, Opportunity and Forecast, By Offering, 2016-2032
- 8.3.1. Latin America Smart Lighting Market Analysis by Offering: Introduction
- 8.3.2. Market Size Absolute $ Opportunity Analysis and Forecast, By Offering, 2016-2032
- 8.3.3. Hardware
- 8.3.4. Software
- 8.3.5. Services
- 8.4. Latin America Smart Lighting Market Analysis, Opportunity and Forecast, By Communication Technology, 2016-2032
- 8.4.1. Latin America Smart Lighting Market Analysis by Communication Technology: Introduction
- 8.4.2. Market Size Absolute $ Opportunity Analysis and Forecast, By Communication Technology, 2016-2032
- 8.4.3. Wired
- 8.4.4. Wireless
- 8.5. Latin America Smart Lighting Market Analysis, Opportunity and Forecast, By Light Source, 2016-2032
- 8.5.1. Latin America Smart Lighting Market Analysis by Light Source: Introduction
- 8.5.2. Market Size Absolute $ Opportunity Analysis and Forecast, By Light Source, 2016-2032
- 8.5.3. LED Lamps
- 8.5.4. Fluorescent Lamps
- 8.5.5. Compact Fluorescent Lamps (CFL)
- 8.5.6. High-Intensity Discharge (HID) Lamps
- 8.6. Latin America Smart Lighting Market Analysis, Opportunity and Forecast, By End User, 2016-2032
- 8.6.1. Latin America Smart Lighting Market Analysis by End User: Introduction
- 8.6.2. Market Size Absolute $ Opportunity Analysis and Forecast, By End User, 2016-2032
- 8.6.3. Indoor
- 8.6.4. Outdoor
- 8.6.5. Others
- 8.7. Latin America Smart Lighting Market Analysis, Opportunity and Forecast, By Country , 2016-2032
- 8.7.1. Latin America Smart Lighting Market Analysis by Country : Introduction
- 8.7.2. Market Size Absolute $ Opportunity Analysis and Forecast, Country , 2016-2032
- 8.7.2.1. Brazil
- 8.7.2.2. Colombia
- 8.7.2.3. Chile
- 8.7.2.4. Argentina
- 8.7.2.5. Costa Rica
- 8.7.2.6. Rest of Latin America
- 9. Middle East & Africa Smart Lighting Market Analysis, Opportunity and Forecast, 2016-2032
- 9.1. Middle East & Africa Smart Lighting Market Analysis, 2016-2021
- 9.2. Middle East & Africa Smart Lighting Market Opportunity and Forecast, 2023-2032
- 9.3. Middle East & Africa Smart Lighting Market Analysis, Opportunity and Forecast, By Offering, 2016-2032
- 9.3.1. Middle East & Africa Smart Lighting Market Analysis by Offering: Introduction
- 9.3.2. Market Size Absolute $ Opportunity Analysis and Forecast, By Offering, 2016-2032
- 9.3.3. Hardware
- 9.3.4. Software
- 9.3.5. Services
- 9.4. Middle East & Africa Smart Lighting Market Analysis, Opportunity and Forecast, By Communication Technology, 2016-2032
- 9.4.1. Middle East & Africa Smart Lighting Market Analysis by Communication Technology: Introduction
- 9.4.2. Market Size Absolute $ Opportunity Analysis and Forecast, By Communication Technology, 2016-2032
- 9.4.3. Wired
- 9.4.4. Wireless
- 9.5. Middle East & Africa Smart Lighting Market Analysis, Opportunity and Forecast, By Light Source, 2016-2032
- 9.5.1. Middle East & Africa Smart Lighting Market Analysis by Light Source: Introduction
- 9.5.2. Market Size Absolute $ Opportunity Analysis and Forecast, By Light Source, 2016-2032
- 9.5.3. LED Lamps
- 9.5.4. Fluorescent Lamps
- 9.5.5. Compact Fluorescent Lamps (CFL)
- 9.5.6. High-Intensity Discharge (HID) Lamps
- 9.6. Middle East & Africa Smart Lighting Market Analysis, Opportunity and Forecast, By End User, 2016-2032
- 9.6.1. Middle East & Africa Smart Lighting Market Analysis by End User: Introduction
- 9.6.2. Market Size Absolute $ Opportunity Analysis and Forecast, By End User, 2016-2032
- 9.6.3. Indoor
- 9.6.4. Outdoor
- 9.6.5. Others
- 9.7. Middle East & Africa Smart Lighting Market Analysis, Opportunity and Forecast, By Country , 2016-2032
- 9.7.1. Middle East & Africa Smart Lighting Market Analysis by Country : Introduction
- 9.7.2. Market Size Absolute $ Opportunity Analysis and Forecast, Country , 2016-2032
- 9.7.2.1. Algeria
- 9.7.2.2. Egypt
- 9.7.2.3. Israel
- 9.7.2.4. Kuwait
- 9.7.2.5. Nigeria
- 9.7.2.6. Saudi Arabia
- 9.7.2.7. South Africa
- 9.7.2.8. Turkey
- 9.7.2.9. The UAE
- 9.7.2.10. Rest of MEA
- 10. Global Smart Lighting Market Analysis, Opportunity and Forecast, By Region , 2016-2032
- 10.1. Global Smart Lighting Market Analysis by Region : Introduction
- 10.2. Market Size Absolute $ Opportunity Analysis and Forecast, By Region , 2016-2032
- 10.2.1. North America
- 10.2.2. Western Europe
- 10.2.3. Eastern Europe
- 10.2.4. APAC
- 10.2.5. Latin America
- 10.2.6. Middle East & Africa
- 11. Global Smart Lighting Market Competitive Landscape, Market Share Analysis, and Company Profiles
- 11.1. Market Share Analysis
- 11.2. Company Profiles
- 11.3. Honeywell International Inc.
- 11.3.1. Company Overview
- 11.3.2. Financial Highlights
- 11.3.3. Product Portfolio
- 11.3.4. SWOT Analysis
- 11.3.5. Key Strategies and Developments
- 11.4. OSRAM Licht AG
- 11.4.1. Company Overview
- 11.4.2. Financial Highlights
- 11.4.3. Product Portfolio
- 11.4.4. SWOT Analysis
- 11.4.5. Key Strategies and Developments
- 11.5. Wipro Lighting
- 11.5.1. Company Overview
- 11.5.2. Financial Highlights
- 11.5.3. Product Portfolio
- 11.5.4. SWOT Analysis
- 11.5.5. Key Strategies and Developments
- 11.6. Acuity Brands Inc.
- 11.6.1. Company Overview
- 11.6.2. Financial Highlights
- 11.6.3. Product Portfolio
- 11.6.4. SWOT Analysis
- 11.6.5. Key Strategies and Developments
- 11.7. Zumtobel Group AG
- 11.7.1. Company Overview
- 11.7.2. Financial Highlights
- 11.7.3. Product Portfolio
- 11.7.4. SWOT Analysis
- 11.7.5. Key Strategies and Developments
- 11.8. Legrand S.A.
- 11.8.1. Company Overview
- 11.8.2. Financial Highlights
- 11.8.3. Product Portfolio
- 11.8.4. SWOT Analysis
- 11.8.5. Key Strategies and Developments
- 11.9. Philips Hue
- 11.9.1. Company Overview
- 11.9.2. Financial Highlights
- 11.9.3. Product Portfolio
- 11.9.4. SWOT Analysis
- 11.9.5. Key Strategies and Developments
- 11.10. Lutron Electronics Co. Inc.
- 11.10.1. Company Overview
- 11.10.2. Financial Highlights
- 11.10.3. Product Portfolio
- 11.10.4. SWOT Analysis
- 11.10.5. Key Strategies and Developments
- 11.11. Schneider Electric SE
- 11.11.1. Company Overview
- 11.11.2. Financial Highlights
- 11.11.3. Product Portfolio
- 11.11.4. SWOT Analysis
- 11.11.5. Key Strategies and Developments
- 11.12. Hubbell Incorporated
- 11.12.1. Company Overview
- 11.12.2. Financial Highlights
- 11.12.3. Product Portfolio
- 11.12.4. SWOT Analysis
- 11.12.5. Key Strategies and Developments
- 11.13.1. Company Overview
- 11.13.2. Financial Highlights
- 11.13.3. Product Portfolio
- 11.13.4. SWOT Analysis
- 11.13.5. Key Strategies and Developments
- 11.14. Cree Inc.
- 11.14.1. Company Overview
- 11.14.2. Financial Highlights
- 11.14.3. Product Portfolio
- 11.14.4. SWOT Analysis
- 11.14.5. Key Strategies and Developments
- 12. Assumptions and Acronyms
- 13. Research Methodology
- 14. Contact
- List of Figures
- Figure 1: Global Smart Lighting Market Revenue (US$ Mn) Market Share by Offering in 2022
- Figure 2: Global Smart Lighting Market Attractiveness Analysis by Offering, 2016-2032
- Figure 3: Global Smart Lighting Market Revenue (US$ Mn) Market Share by Communication Technologyin 2022
- Figure 4: Global Smart Lighting Market Attractiveness Analysis by Communication Technology, 2016-2032
- Figure 5: Global Smart Lighting Market Revenue (US$ Mn) Market Share by Light Sourcein 2022
- Figure 6: Global Smart Lighting Market Attractiveness Analysis by Light Source, 2016-2032
- Figure 7: Global Smart Lighting Market Revenue (US$ Mn) Market Share by End Userin 2022
- Figure 8: Global Smart Lighting Market Attractiveness Analysis by End User, 2016-2032
- Figure 9: Global Smart Lighting Market Revenue (US$ Mn) Market Share by Region in 2022
- Figure 10: Global Smart Lighting Market Attractiveness Analysis by Region, 2016-2032
- Figure 11: Global Smart Lighting Market Revenue (US$ Mn) (2016-2032)
- Figure 12: Global Smart Lighting Market Revenue (US$ Mn) Comparison by Region (2016-2032)
- Figure 13: Global Smart Lighting Market Revenue (US$ Mn) Comparison by Offering (2016-2032)
- Figure 14: Global Smart Lighting Market Revenue (US$ Mn) Comparison by Communication Technology (2016-2032)
- Figure 15: Global Smart Lighting Market Revenue (US$ Mn) Comparison by Light Source (2016-2032)
- Figure 16: Global Smart Lighting Market Revenue (US$ Mn) Comparison by End User (2016-2032)
- Figure 17: Global Smart Lighting Market Y-o-Y Growth Rate Comparison by Region (2016-2032)
- Figure 18: Global Smart Lighting Market Y-o-Y Growth Rate Comparison by Offering (2016-2032)
- Figure 19: Global Smart Lighting Market Y-o-Y Growth Rate Comparison by Communication Technology (2016-2032)
- Figure 20: Global Smart Lighting Market Y-o-Y Growth Rate Comparison by Light Source (2016-2032)
- Figure 21: Global Smart Lighting Market Y-o-Y Growth Rate Comparison by End User (2016-2032)
- Figure 22: Global Smart Lighting Market Share Comparison by Region (2016-2032)
- Figure 23: Global Smart Lighting Market Share Comparison by Offering (2016-2032)
- Figure 24: Global Smart Lighting Market Share Comparison by Communication Technology (2016-2032)
- Figure 25: Global Smart Lighting Market Share Comparison by Light Source (2016-2032)
- Figure 26: Global Smart Lighting Market Share Comparison by End User (2016-2032)
- Figure 27: North America Smart Lighting Market Revenue (US$ Mn) Market Share by Offeringin 2022
- Figure 28: North America Smart Lighting Market Attractiveness Analysis by Offering, 2016-2032
- Figure 29: North America Smart Lighting Market Revenue (US$ Mn) Market Share by Communication Technologyin 2022
- Figure 30: North America Smart Lighting Market Attractiveness Analysis by Communication Technology, 2016-2032
- Figure 31: North America Smart Lighting Market Revenue (US$ Mn) Market Share by Light Sourcein 2022
- Figure 32: North America Smart Lighting Market Attractiveness Analysis by Light Source, 2016-2032
- Figure 33: North America Smart Lighting Market Revenue (US$ Mn) Market Share by End Userin 2022
- Figure 34: North America Smart Lighting Market Attractiveness Analysis by End User, 2016-2032
- Figure 35: North America Smart Lighting Market Revenue (US$ Mn) Market Share by Country in 2022
- Figure 36: North America Smart Lighting Market Attractiveness Analysis by Country, 2016-2032
- Figure 37: North America Smart Lighting Market Revenue (US$ Mn) (2016-2032)
- Figure 38: North America Smart Lighting Market Revenue (US$ Mn) Comparison by Country (2016-2032)
- Figure 39: North America Smart Lighting Market Revenue (US$ Mn) Comparison by Offering (2016-2032)
- Figure 40: North America Smart Lighting Market Revenue (US$ Mn) Comparison by Communication Technology (2016-2032)
- Figure 41: North America Smart Lighting Market Revenue (US$ Mn) Comparison by Light Source (2016-2032)
- Figure 42: North America Smart Lighting Market Revenue (US$ Mn) Comparison by End User (2016-2032)
- Figure 43: North America Smart Lighting Market Y-o-Y Growth Rate Comparison by Country (2016-2032)
- Figure 44: North America Smart Lighting Market Y-o-Y Growth Rate Comparison by Offering (2016-2032)
- Figure 45: North America Smart Lighting Market Y-o-Y Growth Rate Comparison by Communication Technology (2016-2032)
- Figure 46: North America Smart Lighting Market Y-o-Y Growth Rate Comparison by Light Source (2016-2032)
- Figure 47: North America Smart Lighting Market Y-o-Y Growth Rate Comparison by End User (2016-2032)
- Figure 48: North America Smart Lighting Market Share Comparison by Country (2016-2032)
- Figure 49: North America Smart Lighting Market Share Comparison by Offering (2016-2032)
- Figure 50: North America Smart Lighting Market Share Comparison by Communication Technology (2016-2032)
- Figure 51: North America Smart Lighting Market Share Comparison by Light Source (2016-2032)
- Figure 52: North America Smart Lighting Market Share Comparison by End User (2016-2032)
- Figure 53: Western Europe Smart Lighting Market Revenue (US$ Mn) Market Share by Offeringin 2022
- Figure 54: Western Europe Smart Lighting Market Attractiveness Analysis by Offering, 2016-2032
- Figure 55: Western Europe Smart Lighting Market Revenue (US$ Mn) Market Share by Communication Technologyin 2022
- Figure 56: Western Europe Smart Lighting Market Attractiveness Analysis by Communication Technology, 2016-2032
- Figure 57: Western Europe Smart Lighting Market Revenue (US$ Mn) Market Share by Light Sourcein 2022
- Figure 58: Western Europe Smart Lighting Market Attractiveness Analysis by Light Source, 2016-2032
- Figure 59: Western Europe Smart Lighting Market Revenue (US$ Mn) Market Share by End Userin 2022
- Figure 60: Western Europe Smart Lighting Market Attractiveness Analysis by End User, 2016-2032
- Figure 61: Western Europe Smart Lighting Market Revenue (US$ Mn) Market Share by Country in 2022
- Figure 62: Western Europe Smart Lighting Market Attractiveness Analysis by Country, 2016-2032
- Figure 63: Western Europe Smart Lighting Market Revenue (US$ Mn) (2016-2032)
- Figure 64: Western Europe Smart Lighting Market Revenue (US$ Mn) Comparison by Country (2016-2032)
- Figure 65: Western Europe Smart Lighting Market Revenue (US$ Mn) Comparison by Offering (2016-2032)
- Figure 66: Western Europe Smart Lighting Market Revenue (US$ Mn) Comparison by Communication Technology (2016-2032)
- Figure 67: Western Europe Smart Lighting Market Revenue (US$ Mn) Comparison by Light Source (2016-2032)
- Figure 68: Western Europe Smart Lighting Market Revenue (US$ Mn) Comparison by End User (2016-2032)
- Figure 69: Western Europe Smart Lighting Market Y-o-Y Growth Rate Comparison by Country (2016-2032)
- Figure 70: Western Europe Smart Lighting Market Y-o-Y Growth Rate Comparison by Offering (2016-2032)
- Figure 71: Western Europe Smart Lighting Market Y-o-Y Growth Rate Comparison by Communication Technology (2016-2032)
- Figure 72: Western Europe Smart Lighting Market Y-o-Y Growth Rate Comparison by Light Source (2016-2032)
- Figure 73: Western Europe Smart Lighting Market Y-o-Y Growth Rate Comparison by End User (2016-2032)
- Figure 74: Western Europe Smart Lighting Market Share Comparison by Country (2016-2032)
- Figure 75: Western Europe Smart Lighting Market Share Comparison by Offering (2016-2032)
- Figure 76: Western Europe Smart Lighting Market Share Comparison by Communication Technology (2016-2032)
- Figure 77: Western Europe Smart Lighting Market Share Comparison by Light Source (2016-2032)
- Figure 78: Western Europe Smart Lighting Market Share Comparison by End User (2016-2032)
- Figure 79: Eastern Europe Smart Lighting Market Revenue (US$ Mn) Market Share by Offeringin 2022
- Figure 80: Eastern Europe Smart Lighting Market Attractiveness Analysis by Offering, 2016-2032
- Figure 81: Eastern Europe Smart Lighting Market Revenue (US$ Mn) Market Share by Communication Technologyin 2022
- Figure 82: Eastern Europe Smart Lighting Market Attractiveness Analysis by Communication Technology, 2016-2032
- Figure 83: Eastern Europe Smart Lighting Market Revenue (US$ Mn) Market Share by Light Sourcein 2022
- Figure 84: Eastern Europe Smart Lighting Market Attractiveness Analysis by Light Source, 2016-2032
- Figure 85: Eastern Europe Smart Lighting Market Revenue (US$ Mn) Market Share by End Userin 2022
- Figure 86: Eastern Europe Smart Lighting Market Attractiveness Analysis by End User, 2016-2032
- Figure 87: Eastern Europe Smart Lighting Market Revenue (US$ Mn) Market Share by Country in 2022
- Figure 88: Eastern Europe Smart Lighting Market Attractiveness Analysis by Country, 2016-2032
- Figure 89: Eastern Europe Smart Lighting Market Revenue (US$ Mn) (2016-2032)
- Figure 90: Eastern Europe Smart Lighting Market Revenue (US$ Mn) Comparison by Country (2016-2032)
- Figure 91: Eastern Europe Smart Lighting Market Revenue (US$ Mn) Comparison by Offering (2016-2032)
- Figure 92: Eastern Europe Smart Lighting Market Revenue (US$ Mn) Comparison by Communication Technology (2016-2032)
- Figure 93: Eastern Europe Smart Lighting Market Revenue (US$ Mn) Comparison by Light Source (2016-2032)
- Figure 94: Eastern Europe Smart Lighting Market Revenue (US$ Mn) Comparison by End User (2016-2032)
- Figure 95: Eastern Europe Smart Lighting Market Y-o-Y Growth Rate Comparison by Country (2016-2032)
- Figure 96: Eastern Europe Smart Lighting Market Y-o-Y Growth Rate Comparison by Offering (2016-2032)
- Figure 97: Eastern Europe Smart Lighting Market Y-o-Y Growth Rate Comparison by Communication Technology (2016-2032)
- Figure 98: Eastern Europe Smart Lighting Market Y-o-Y Growth Rate Comparison by Light Source (2016-2032)
- Figure 99: Eastern Europe Smart Lighting Market Y-o-Y Growth Rate Comparison by End User (2016-2032)
- Figure 100: Eastern Europe Smart Lighting Market Share Comparison by Country (2016-2032)
- Figure 101: Eastern Europe Smart Lighting Market Share Comparison by Offering (2016-2032)
- Figure 102: Eastern Europe Smart Lighting Market Share Comparison by Communication Technology (2016-2032)
- Figure 103: Eastern Europe Smart Lighting Market Share Comparison by Light Source (2016-2032)
- Figure 104: Eastern Europe Smart Lighting Market Share Comparison by End User (2016-2032)
- Figure 105: APAC Smart Lighting Market Revenue (US$ Mn) Market Share by Offeringin 2022
- Figure 106: APAC Smart Lighting Market Attractiveness Analysis by Offering, 2016-2032
- Figure 107: APAC Smart Lighting Market Revenue (US$ Mn) Market Share by Communication Technologyin 2022
- Figure 108: APAC Smart Lighting Market Attractiveness Analysis by Communication Technology, 2016-2032
- Figure 109: APAC Smart Lighting Market Revenue (US$ Mn) Market Share by Light Sourcein 2022
- Figure 110: APAC Smart Lighting Market Attractiveness Analysis by Light Source, 2016-2032
- Figure 111: APAC Smart Lighting Market Revenue (US$ Mn) Market Share by End Userin 2022
- Figure 112: APAC Smart Lighting Market Attractiveness Analysis by End User, 2016-2032
- Figure 113: APAC Smart Lighting Market Revenue (US$ Mn) Market Share by Country in 2022
- Figure 114: APAC Smart Lighting Market Attractiveness Analysis by Country, 2016-2032
- Figure 115: APAC Smart Lighting Market Revenue (US$ Mn) (2016-2032)
- Figure 116: APAC Smart Lighting Market Revenue (US$ Mn) Comparison by Country (2016-2032)
- Figure 117: APAC Smart Lighting Market Revenue (US$ Mn) Comparison by Offering (2016-2032)
- Figure 118: APAC Smart Lighting Market Revenue (US$ Mn) Comparison by Communication Technology (2016-2032)
- Figure 119: APAC Smart Lighting Market Revenue (US$ Mn) Comparison by Light Source (2016-2032)
- Figure 120: APAC Smart Lighting Market Revenue (US$ Mn) Comparison by End User (2016-2032)
- Figure 121: APAC Smart Lighting Market Y-o-Y Growth Rate Comparison by Country (2016-2032)
- Figure 122: APAC Smart Lighting Market Y-o-Y Growth Rate Comparison by Offering (2016-2032)
- Figure 123: APAC Smart Lighting Market Y-o-Y Growth Rate Comparison by Communication Technology (2016-2032)
- Figure 124: APAC Smart Lighting Market Y-o-Y Growth Rate Comparison by Light Source (2016-2032)
- Figure 125: APAC Smart Lighting Market Y-o-Y Growth Rate Comparison by End User (2016-2032)
- Figure 126: APAC Smart Lighting Market Share Comparison by Country (2016-2032)
- Figure 127: APAC Smart Lighting Market Share Comparison by Offering (2016-2032)
- Figure 128: APAC Smart Lighting Market Share Comparison by Communication Technology (2016-2032)
- Figure 129: APAC Smart Lighting Market Share Comparison by Light Source (2016-2032)
- Figure 130: APAC Smart Lighting Market Share Comparison by End User (2016-2032)
- Figure 131: Latin America Smart Lighting Market Revenue (US$ Mn) Market Share by Offeringin 2022
- Figure 132: Latin America Smart Lighting Market Attractiveness Analysis by Offering, 2016-2032
- Figure 133: Latin America Smart Lighting Market Revenue (US$ Mn) Market Share by Communication Technologyin 2022
- Figure 134: Latin America Smart Lighting Market Attractiveness Analysis by Communication Technology, 2016-2032
- Figure 135: Latin America Smart Lighting Market Revenue (US$ Mn) Market Share by Light Sourcein 2022
- Figure 136: Latin America Smart Lighting Market Attractiveness Analysis by Light Source, 2016-2032
- Figure 137: Latin America Smart Lighting Market Revenue (US$ Mn) Market Share by End Userin 2022
- Figure 138: Latin America Smart Lighting Market Attractiveness Analysis by End User, 2016-2032
- Figure 139: Latin America Smart Lighting Market Revenue (US$ Mn) Market Share by Country in 2022
- Figure 140: Latin America Smart Lighting Market Attractiveness Analysis by Country, 2016-2032
- Figure 141: Latin America Smart Lighting Market Revenue (US$ Mn) (2016-2032)
- Figure 142: Latin America Smart Lighting Market Revenue (US$ Mn) Comparison by Country (2016-2032)
- Figure 143: Latin America Smart Lighting Market Revenue (US$ Mn) Comparison by Offering (2016-2032)
- Figure 144: Latin America Smart Lighting Market Revenue (US$ Mn) Comparison by Communication Technology (2016-2032)
- Figure 145: Latin America Smart Lighting Market Revenue (US$ Mn) Comparison by Light Source (2016-2032)
- Figure 146: Latin America Smart Lighting Market Revenue (US$ Mn) Comparison by End User (2016-2032)
- Figure 147: Latin America Smart Lighting Market Y-o-Y Growth Rate Comparison by Country (2016-2032)
- Figure 148: Latin America Smart Lighting Market Y-o-Y Growth Rate Comparison by Offering (2016-2032)
- Figure 149: Latin America Smart Lighting Market Y-o-Y Growth Rate Comparison by Communication Technology (2016-2032)
- Figure 150: Latin America Smart Lighting Market Y-o-Y Growth Rate Comparison by Light Source (2016-2032)
- Figure 151: Latin America Smart Lighting Market Y-o-Y Growth Rate Comparison by End User (2016-2032)
- Figure 152: Latin America Smart Lighting Market Share Comparison by Country (2016-2032)
- Figure 153: Latin America Smart Lighting Market Share Comparison by Offering (2016-2032)
- Figure 154: Latin America Smart Lighting Market Share Comparison by Communication Technology (2016-2032)
- Figure 155: Latin America Smart Lighting Market Share Comparison by Light Source (2016-2032)
- Figure 156: Latin America Smart Lighting Market Share Comparison by End User (2016-2032)
- Figure 157: Middle East & Africa Smart Lighting Market Revenue (US$ Mn) Market Share by Offeringin 2022
- Figure 158: Middle East & Africa Smart Lighting Market Attractiveness Analysis by Offering, 2016-2032
- Figure 159: Middle East & Africa Smart Lighting Market Revenue (US$ Mn) Market Share by Communication Technologyin 2022
- Figure 160: Middle East & Africa Smart Lighting Market Attractiveness Analysis by Communication Technology, 2016-2032
- Figure 161: Middle East & Africa Smart Lighting Market Revenue (US$ Mn) Market Share by Light Sourcein 2022
- Figure 162: Middle East & Africa Smart Lighting Market Attractiveness Analysis by Light Source, 2016-2032
- Figure 163: Middle East & Africa Smart Lighting Market Revenue (US$ Mn) Market Share by End Userin 2022
- Figure 164: Middle East & Africa Smart Lighting Market Attractiveness Analysis by End User, 2016-2032
- Figure 165: Middle East & Africa Smart Lighting Market Revenue (US$ Mn) Market Share by Country in 2022
- Figure 166: Middle East & Africa Smart Lighting Market Attractiveness Analysis by Country, 2016-2032
- Figure 167: Middle East & Africa Smart Lighting Market Revenue (US$ Mn) (2016-2032)
- Figure 168: Middle East & Africa Smart Lighting Market Revenue (US$ Mn) Comparison by Country (2016-2032)
- Figure 169: Middle East & Africa Smart Lighting Market Revenue (US$ Mn) Comparison by Offering (2016-2032)
- Figure 170: Middle East & Africa Smart Lighting Market Revenue (US$ Mn) Comparison by Communication Technology (2016-2032)
- Figure 171: Middle East & Africa Smart Lighting Market Revenue (US$ Mn) Comparison by Light Source (2016-2032)
- Figure 172: Middle East & Africa Smart Lighting Market Revenue (US$ Mn) Comparison by End User (2016-2032)
- Figure 173: Middle East & Africa Smart Lighting Market Y-o-Y Growth Rate Comparison by Country (2016-2032)
- Figure 174: Middle East & Africa Smart Lighting Market Y-o-Y Growth Rate Comparison by Offering (2016-2032)
- Figure 175: Middle East & Africa Smart Lighting Market Y-o-Y Growth Rate Comparison by Communication Technology (2016-2032)
- Figure 176: Middle East & Africa Smart Lighting Market Y-o-Y Growth Rate Comparison by Light Source (2016-2032)
- Figure 177: Middle East & Africa Smart Lighting Market Y-o-Y Growth Rate Comparison by End User (2016-2032)
- Figure 178: Middle East & Africa Smart Lighting Market Share Comparison by Country (2016-2032)
- Figure 179: Middle East & Africa Smart Lighting Market Share Comparison by Offering (2016-2032)
- Figure 180: Middle East & Africa Smart Lighting Market Share Comparison by Communication Technology (2016-2032)
- Figure 181: Middle East & Africa Smart Lighting Market Share Comparison by Light Source (2016-2032)
- Figure 182: Middle East & Africa Smart Lighting Market Share Comparison by End User (2016-2032)
- List of Tables
- Table 1: Global Smart Lighting Market Comparison by Offering (2016-2032)
- Table 2: Global Smart Lighting Market Comparison by Communication Technology (2016-2032)
- Table 3: Global Smart Lighting Market Comparison by Light Source (2016-2032)
- Table 4: Global Smart Lighting Market Comparison by End User (2016-2032)
- Table 5: Global Smart Lighting Market Revenue (US$ Mn) Comparison by Region (2016-2032)
- Table 6: Global Smart Lighting Market Revenue (US$ Mn) (2016-2032)
- Table 7: Global Smart Lighting Market Revenue (US$ Mn) Comparison by Region (2016-2032)
- Table 8: Global Smart Lighting Market Revenue (US$ Mn) Comparison by Offering (2016-2032)
- Table 9: Global Smart Lighting Market Revenue (US$ Mn) Comparison by Communication Technology (2016-2032)
- Table 10: Global Smart Lighting Market Revenue (US$ Mn) Comparison by Light Source (2016-2032)
- Table 11: Global Smart Lighting Market Revenue (US$ Mn) Comparison by End User (2016-2032)
- Table 12: Global Smart Lighting Market Y-o-Y Growth Rate Comparison by Region (2016-2032)
- Table 13: Global Smart Lighting Market Y-o-Y Growth Rate Comparison by Offering (2016-2032)
- Table 14: Global Smart Lighting Market Y-o-Y Growth Rate Comparison by Communication Technology (2016-2032)
- Table 15: Global Smart Lighting Market Y-o-Y Growth Rate Comparison by Light Source (2016-2032)
- Table 16: Global Smart Lighting Market Y-o-Y Growth Rate Comparison by End User (2016-2032)
- Table 17: Global Smart Lighting Market Share Comparison by Region (2016-2032)
- Table 18: Global Smart Lighting Market Share Comparison by Offering (2016-2032)
- Table 19: Global Smart Lighting Market Share Comparison by Communication Technology (2016-2032)
- Table 20: Global Smart Lighting Market Share Comparison by Light Source (2016-2032)
- Table 21: Global Smart Lighting Market Share Comparison by End User (2016-2032)
- Table 22: North America Smart Lighting Market Comparison by Communication Technology (2016-2032)
- Table 23: North America Smart Lighting Market Comparison by Light Source (2016-2032)
- Table 24: North America Smart Lighting Market Comparison by End User (2016-2032)
- Table 25: North America Smart Lighting Market Revenue (US$ Mn) Comparison by Country (2016-2032)
- Table 26: North America Smart Lighting Market Revenue (US$ Mn) (2016-2032)
- Table 27: North America Smart Lighting Market Revenue (US$ Mn) Comparison by Country (2016-2032)
- Table 28: North America Smart Lighting Market Revenue (US$ Mn) Comparison by Offering (2016-2032)
- Table 29: North America Smart Lighting Market Revenue (US$ Mn) Comparison by Communication Technology (2016-2032)
- Table 30: North America Smart Lighting Market Revenue (US$ Mn) Comparison by Light Source (2016-2032)
- Table 31: North America Smart Lighting Market Revenue (US$ Mn) Comparison by End User (2016-2032)
- Table 32: North America Smart Lighting Market Y-o-Y Growth Rate Comparison by Country (2016-2032)
- Table 33: North America Smart Lighting Market Y-o-Y Growth Rate Comparison by Offering (2016-2032)
- Table 34: North America Smart Lighting Market Y-o-Y Growth Rate Comparison by Communication Technology (2016-2032)
- Table 35: North America Smart Lighting Market Y-o-Y Growth Rate Comparison by Light Source (2016-2032)
- Table 36: North America Smart Lighting Market Y-o-Y Growth Rate Comparison by End User (2016-2032)
- Table 37: North America Smart Lighting Market Share Comparison by Country (2016-2032)
- Table 38: North America Smart Lighting Market Share Comparison by Offering (2016-2032)
- Table 39: North America Smart Lighting Market Share Comparison by Communication Technology (2016-2032)
- Table 40: North America Smart Lighting Market Share Comparison by Light Source (2016-2032)
- Table 41: North America Smart Lighting Market Share Comparison by End User (2016-2032)
- Table 42: Western Europe Smart Lighting Market Comparison by Offering (2016-2032)
- Table 43: Western Europe Smart Lighting Market Comparison by Communication Technology (2016-2032)
- Table 44: Western Europe Smart Lighting Market Comparison by Light Source (2016-2032)
- Table 45: Western Europe Smart Lighting Market Comparison by End User (2016-2032)
- Table 46: Western Europe Smart Lighting Market Revenue (US$ Mn) Comparison by Country (2016-2032)
- Table 47: Western Europe Smart Lighting Market Revenue (US$ Mn) (2016-2032)
- Table 48: Western Europe Smart Lighting Market Revenue (US$ Mn) Comparison by Country (2016-2032)
- Table 49: Western Europe Smart Lighting Market Revenue (US$ Mn) Comparison by Offering (2016-2032)
- Table 50: Western Europe Smart Lighting Market Revenue (US$ Mn) Comparison by Communication Technology (2016-2032)
- Table 51: Western Europe Smart Lighting Market Revenue (US$ Mn) Comparison by Light Source (2016-2032)
- Table 52: Western Europe Smart Lighting Market Revenue (US$ Mn) Comparison by End User (2016-2032)
- Table 53: Western Europe Smart Lighting Market Y-o-Y Growth Rate Comparison by Country (2016-2032)
- Table 54: Western Europe Smart Lighting Market Y-o-Y Growth Rate Comparison by Offering (2016-2032)
- Table 55: Western Europe Smart Lighting Market Y-o-Y Growth Rate Comparison by Communication Technology (2016-2032)
- Table 56: Western Europe Smart Lighting Market Y-o-Y Growth Rate Comparison by Light Source (2016-2032)
- Table 57: Western Europe Smart Lighting Market Y-o-Y Growth Rate Comparison by End User (2016-2032)
- Table 58: Western Europe Smart Lighting Market Share Comparison by Country (2016-2032)
- Table 59: Western Europe Smart Lighting Market Share Comparison by Offering (2016-2032)
- Table 60: Western Europe Smart Lighting Market Share Comparison by Communication Technology (2016-2032)
- Table 61: Western Europe Smart Lighting Market Share Comparison by Light Source (2016-2032)
- Table 62: Western Europe Smart Lighting Market Share Comparison by End User (2016-2032)
- Table 63: Eastern Europe Smart Lighting Market Comparison by Offering (2016-2032)
- Table 64: Eastern Europe Smart Lighting Market Comparison by Communication Technology (2016-2032)
- Table 65: Eastern Europe Smart Lighting Market Comparison by Light Source (2016-2032)
- Table 66: Eastern Europe Smart Lighting Market Comparison by End User (2016-2032)
- Table 67: Eastern Europe Smart Lighting Market Revenue (US$ Mn) Comparison by Country (2016-2032)
- Table 68: Eastern Europe Smart Lighting Market Revenue (US$ Mn) (2016-2032)
- Table 69: Eastern Europe Smart Lighting Market Revenue (US$ Mn) Comparison by Country (2016-2032)
- Table 70: Eastern Europe Smart Lighting Market Revenue (US$ Mn) Comparison by Offering (2016-2032)
- Table 71: Eastern Europe Smart Lighting Market Revenue (US$ Mn) Comparison by Communication Technology (2016-2032)
- Table 72: Eastern Europe Smart Lighting Market Revenue (US$ Mn) Comparison by Light Source (2016-2032)
- Table 73: Eastern Europe Smart Lighting Market Revenue (US$ Mn) Comparison by End User (2016-2032)
- Table 74: Eastern Europe Smart Lighting Market Y-o-Y Growth Rate Comparison by Country (2016-2032)
- Table 75: Eastern Europe Smart Lighting Market Y-o-Y Growth Rate Comparison by Offering (2016-2032)
- Table 76: Eastern Europe Smart Lighting Market Y-o-Y Growth Rate Comparison by Communication Technology (2016-2032)
- Table 77: Eastern Europe Smart Lighting Market Y-o-Y Growth Rate Comparison by Light Source (2016-2032)
- Table 78: Eastern Europe Smart Lighting Market Y-o-Y Growth Rate Comparison by End User (2016-2032)
- Table 79: Eastern Europe Smart Lighting Market Share Comparison by Country (2016-2032)
- Table 80: Eastern Europe Smart Lighting Market Share Comparison by Offering (2016-2032)
- Table 81: Eastern Europe Smart Lighting Market Share Comparison by Communication Technology (2016-2032)
- Table 82: Eastern Europe Smart Lighting Market Share Comparison by Light Source (2016-2032)
- Table 83: Eastern Europe Smart Lighting Market Share Comparison by End User (2016-2032)
- Table 84: APAC Smart Lighting Market Comparison by Offering (2016-2032)
- Table 85: APAC Smart Lighting Market Comparison by Communication Technology (2016-2032)
- Table 86: APAC Smart Lighting Market Comparison by Light Source (2016-2032)
- Table 87: APAC Smart Lighting Market Comparison by End User (2016-2032)
- Table 88: APAC Smart Lighting Market Revenue (US$ Mn) Comparison by Country (2016-2032)
- Table 89: APAC Smart Lighting Market Revenue (US$ Mn) (2016-2032)
- Table 90: APAC Smart Lighting Market Revenue (US$ Mn) Comparison by Country (2016-2032)
- Table 91: APAC Smart Lighting Market Revenue (US$ Mn) Comparison by Offering (2016-2032)
- Table 92: APAC Smart Lighting Market Revenue (US$ Mn) Comparison by Communication Technology (2016-2032)
- Table 93: APAC Smart Lighting Market Revenue (US$ Mn) Comparison by Light Source (2016-2032)
- Table 94: APAC Smart Lighting Market Revenue (US$ Mn) Comparison by End User (2016-2032)
- Table 95: APAC Smart Lighting Market Y-o-Y Growth Rate Comparison by Country (2016-2032)
- Table 96: APAC Smart Lighting Market Y-o-Y Growth Rate Comparison by Offering (2016-2032)
- Table 97: APAC Smart Lighting Market Y-o-Y Growth Rate Comparison by Communication Technology (2016-2032)
- Table 98: APAC Smart Lighting Market Y-o-Y Growth Rate Comparison by Light Source (2016-2032)
- Table 99: APAC Smart Lighting Market Y-o-Y Growth Rate Comparison by End User (2016-2032)
- Table 100: APAC Smart Lighting Market Share Comparison by Country (2016-2032)
- Table 101: APAC Smart Lighting Market Share Comparison by Offering (2016-2032)
- Table 102: APAC Smart Lighting Market Share Comparison by Communication Technology (2016-2032)
- Table 103: APAC Smart Lighting Market Share Comparison by Light Source (2016-2032)
- Table 104: APAC Smart Lighting Market Share Comparison by End User (2016-2032)
- Table 105: Latin America Smart Lighting Market Comparison by Offering (2016-2032)
- Table 106: Latin America Smart Lighting Market Comparison by Communication Technology (2016-2032)
- Table 107: Latin America Smart Lighting Market Comparison by Light Source (2016-2032)
- Table 108: Latin America Smart Lighting Market Comparison by End User (2016-2032)
- Table 109: Latin America Smart Lighting Market Revenue (US$ Mn) Comparison by Country (2016-2032)
- Table 110: Latin America Smart Lighting Market Revenue (US$ Mn) (2016-2032)
- Table 111: Latin America Smart Lighting Market Revenue (US$ Mn) Comparison by Country (2016-2032)
- Table 112: Latin America Smart Lighting Market Revenue (US$ Mn) Comparison by Offering (2016-2032)
- Table 113: Latin America Smart Lighting Market Revenue (US$ Mn) Comparison by Communication Technology (2016-2032)
- Table 114: Latin America Smart Lighting Market Revenue (US$ Mn) Comparison by Light Source (2016-2032)
- Table 115: Latin America Smart Lighting Market Revenue (US$ Mn) Comparison by End User (2016-2032)
- Table 116: Latin America Smart Lighting Market Y-o-Y Growth Rate Comparison by Country (2016-2032)
- Table 117: Latin America Smart Lighting Market Y-o-Y Growth Rate Comparison by Offering (2016-2032)
- Table 118: Latin America Smart Lighting Market Y-o-Y Growth Rate Comparison by Communication Technology (2016-2032)
- Table 119: Latin America Smart Lighting Market Y-o-Y Growth Rate Comparison by Light Source (2016-2032)
- Table 120: Latin America Smart Lighting Market Y-o-Y Growth Rate Comparison by End User (2016-2032)
- Table 121: Latin America Smart Lighting Market Share Comparison by Country (2016-2032)
- Table 122: Latin America Smart Lighting Market Share Comparison by Offering (2016-2032)
- Table 123: Latin America Smart Lighting Market Share Comparison by Communication Technology (2016-2032)
- Table 124: Latin America Smart Lighting Market Share Comparison by Light Source (2016-2032)
- Table 125: Latin America Smart Lighting Market Share Comparison by End User (2016-2032)
- Table 126: Middle East & Africa Smart Lighting Market Comparison by Offering (2016-2032)
- Table 127: Middle East & Africa Smart Lighting Market Comparison by Communication Technology (2016-2032)
- Table 128: Middle East & Africa Smart Lighting Market Comparison by Light Source (2016-2032)
- Table 129: Middle East & Africa Smart Lighting Market Comparison by End User (2016-2032)
- Table 130: Middle East & Africa Smart Lighting Market Revenue (US$ Mn) Comparison by Country (2016-2032)
- Table 131: Middle East & Africa Smart Lighting Market Revenue (US$ Mn) (2016-2032)
- Table 132: Middle East & Africa Smart Lighting Market Revenue (US$ Mn) Comparison by Country (2016-2032)
- Table 133: Middle East & Africa Smart Lighting Market Revenue (US$ Mn) Comparison by Offering (2016-2032)
- Table 134: Middle East & Africa Smart Lighting Market Revenue (US$ Mn) Comparison by Communication Technology (2016-2032)
- Table 135: Middle East & Africa Smart Lighting Market Revenue (US$ Mn) Comparison by Light Source (2016-2032)
- Table 136: Middle East & Africa Smart Lighting Market Revenue (US$ Mn) Comparison by End User (2016-2032)
- Table 137: Middle East & Africa Smart Lighting Market Y-o-Y Growth Rate Comparison by Country (2016-2032)
- Table 138: Middle East & Africa Smart Lighting Market Y-o-Y Growth Rate Comparison by Offering (2016-2032)
- Table 139: Middle East & Africa Smart Lighting Market Y-o-Y Growth Rate Comparison by Communication Technology (2016-2032)
- Table 140: Middle East & Africa Smart Lighting Market Y-o-Y Growth Rate Comparison by Light Source (2016-2032)
- Table 141: Middle East & Africa Smart Lighting Market Y-o-Y Growth Rate Comparison by End User (2016-2032)
- Table 142: Middle East & Africa Smart Lighting Market Share Comparison by Country (2016-2032)
- Table 143: Middle East & Africa Smart Lighting Market Share Comparison by Offering (2016-2032)
- Table 144: Middle East & Africa Smart Lighting Market Share Comparison by Communication Technology (2016-2032)
- Table 145: Middle East & Africa Smart Lighting Market Share Comparison by Light Source (2016-2032)
- Table 146: Middle East & Africa Smart Lighting Market Share Comparison by End User (2016-2032)
- 1. Executive Summary
-
- Honeywell International Inc.
- OSRAM Licht AG
- Wipro Lighting
- Acuity Brands Inc.
- Zumtobel Group AG
- Legrand S.A.
- Philips Hue
- Lutron Electronics Co. Inc.
- Schneider Electric SE
- Hubbell Incorporated
- Cree Inc.
- Bridgelux Inc.
Our Clients


View Our Licence Options
