
Energy Management Systems Market By System Type (Industrial energy management systems (IEMS), Building energy management systems (BEMS), Home energy management systems (HEMS)), By Vertical Component(Hardware, Software, Services), By Vertical Deployment(On-Premises, Cloud), By Vertical(Manufacturing, Residential, Energy & Power, Telecom & IT, Retail, Healthcare, Others), By Region And Companies - Industry Segment Outlook, Market Assessment, Competition Scenario, Trends, And Forecast 2024-2033
-
44120
-
March 2024
-
179
-


-
This report was compiled by Shreyas Rokade Shreyas Rokade is a seasoned Research Analyst with CMFE, bringing extensive expertise in market research and consulting, with a strong background in Chemical Engineering. Correspondence Team Lead-CMFE Linkedin | Detailed Market research Methodology Our methodology involves a mix of primary research, including interviews with leading mental health experts, and secondary research from reputable medical journals and databases. View Detailed Methodology Page
-
Quick Navigation
Report Overview
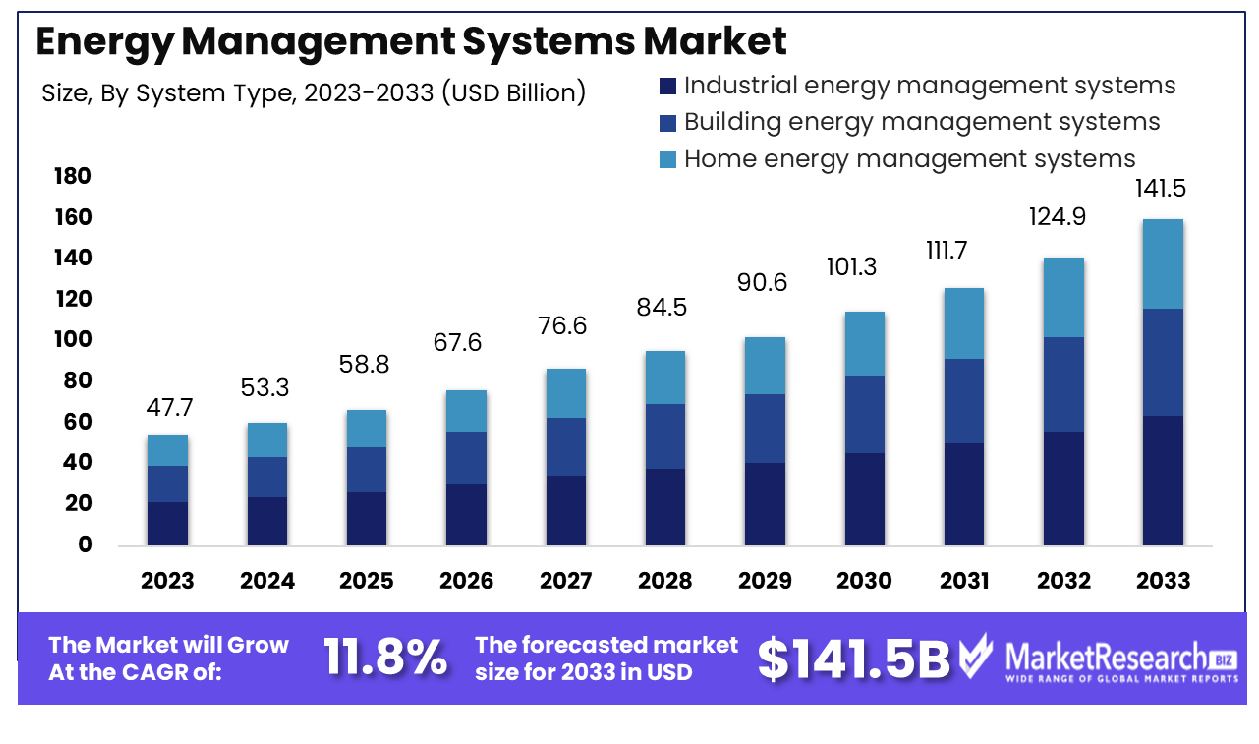
The energy management systems market was valued at USD 47.7 billion in 2023. It is expected to reach USD 141.6 billion by 2033, with a CAGR of 11.8% during the forecast period from 2024 to 2033. The surge in demand for strategic investments and the rise in adoption of smart grids and smart meters are some of the main key driving key factors for the energy management systems market.
An energy management system is defined as a sophisticated and advanced technology that is designed to supervise, regulate, and enhance energy utilization within a given surroundings. Generally applied in industrial, residential, and commercial settings, an EMS combines hardware and software elements to gather information on energy consumption that analyses patterns, and structures and automates processes for enhanced efficacy.
The system permits users to remotely supervise and handle systems like HVAC systems, appliances, and lighting. Through accurate real-time data insights, individuals can make informed decisions to decrease energy consumption, decrease expenses, and lower the environmental effect. Advanced EMS may use ML algorithms to adjust and optimize energy usage based on past information and current conditions by contributing to eco-friendly efforts and promoting intelligent resource utilization.
According to energy storage news in January 2024, highlights that LG and Fractal EMS announced a deal in 2022 that combines the former’s ESS units and the latter’s EMS software. Moreover, In January 2024, the CEO of energy storage software control provider Fractal EMS emphasized that the industry will uplift the EMS because of its economic and operational issues. Additionally, 20% of the fractal EMS deal flows are retrofitted. Additionally, a press release published by Sumitomo Electrics in March 2023, highlights that Sumitomo Electrics launched EMS that can support multiple uses for grid storage batteries.
Energy management systems have several types of advantages such as it improves the combination with renewable energy sources by enhancing the usage of solar panels and other eco-friendly solutions. Smart grid compatibility permits better grid interaction and requires response potentialities by contributing to a stronger and more effective energy infrastructure.
Moreover, some systems provide advanced predictive analytics by making proactive energy management and knowing capable issues before they occur. Such innovations further encourage individuals to make data-driven decisions by nurturing greater eco-friendly elements and cost-effectiveness in energy demand consumption. The demand for EMS will increase due to its requirement in energy sectors which will help in market expansion in the coming years.
Key Takeaways
- Market Growth: Energy Management Systems Market was valued at USD 47.7 billion in 2023. It is expected to reach USD 141.6 billion by 2033, with a CAGR of 11.8% during the forecast period from 2024 to 2033.
- By System Type: IEMS dominates with a market share of 70.4%, indicating strong industrial sector adoption.
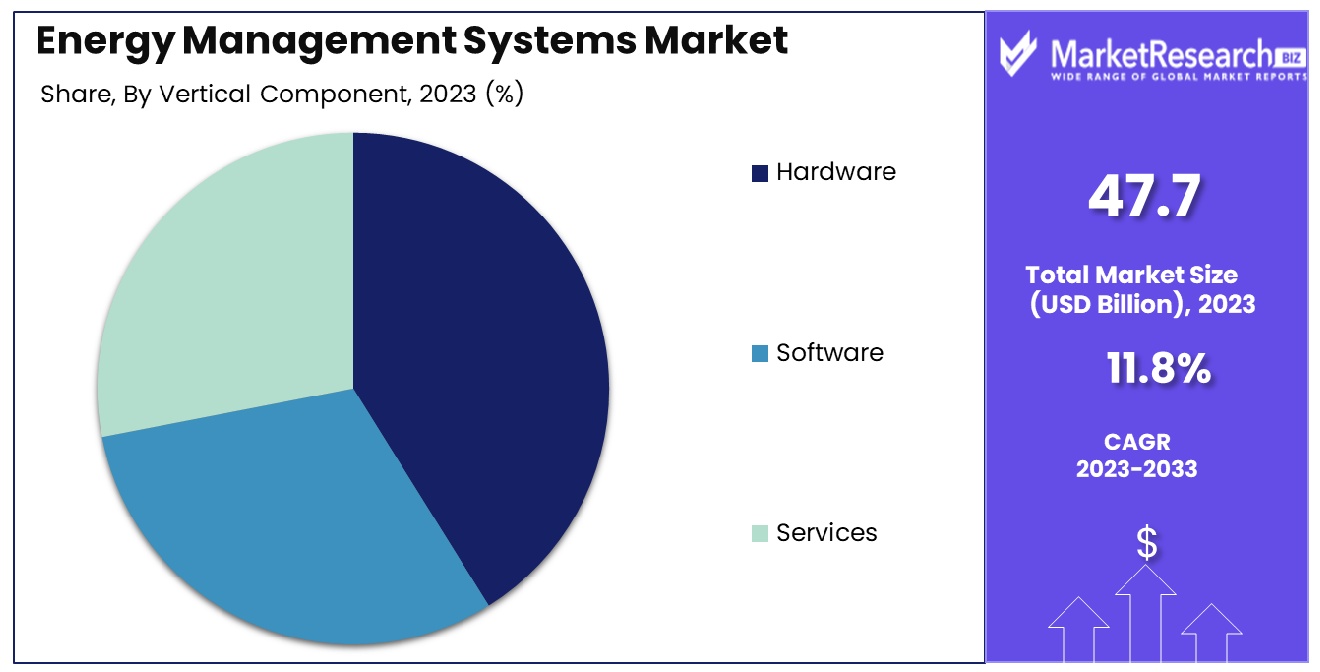
- By Vertical Component: Hardware accounts for 60.3% of the market share, reflecting the importance of tangible infrastructure.
- By Vertical Deployment: On-premises deployment leads at 80.8%, highlighting a preference for localized control and management.
- By Vertical: The Manufacturing sector holds a 20.4% market share, indicating a significant but not dominant presence.
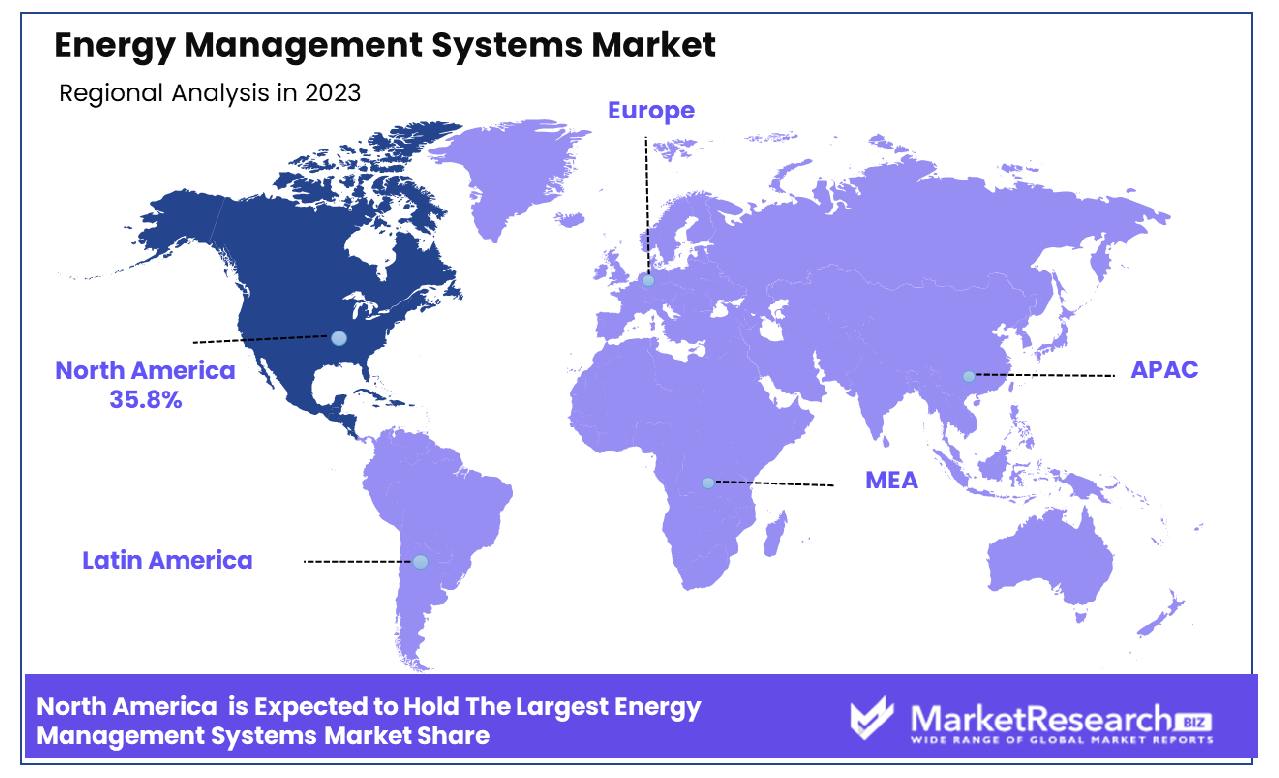
- Regional Dominance: In North America, the Energy Management Systems market accounts for a significant 35.8% share.
- Growth Opportunity: Integration with smart building technologies enhances efficiency. Demand response and peak load management reduce costs and strain on the grid. Both trends drive growth in the global energy management systems market.
Driving factors
Increasing Usage of Smart Grids and Smart Meters
The proliferation of smart grids and meters is a pivotal driver propelling the growth of the Energy Management Systems (EMS) Market. Smart grids enable real-time monitoring and control of energy consumption, enhancing efficiency and reducing wastage. With smart technology meters becoming ubiquitous, utilities and consumers gain insights into energy usage patterns, facilitating informed decision-making.
According to industry reports, the global smart grid market indicates substantial opportunities for EMS providers to integrate their solutions into these infrastructures. The synergy between smart grids, meters, and EMS fosters a dynamic ecosystem conducive to optimizing energy usage and reducing costs.
Digital Transformation of Energy Management
The digital transformation of energy management practices is revolutionizing the EMS Market. As businesses embrace digitization, there's a growing demand for advanced solutions to streamline energy monitoring, analysis, and optimization. EMS offerings leveraging cloud computing, IoT sensors, and artificial intelligence empower organizations to achieve granular control over their energy consumption. This transformative shift not only enhances operational efficiency but also enables proactive energy management strategies.
Bridging the Awareness Gap in Smaller Businesses
Despite the pervasive benefits of EMS, smaller businesses often lag in awareness and adoption. However, concerted efforts to bridge this awareness gap present an untapped growth opportunity for the market. Educational initiatives, subsidies, and regulatory incentives aimed at promoting energy efficiency and sustainability can catalyze EMS adoption among smaller enterprises.
By raising awareness and elucidating the tangible benefits, stakeholders can unlock a sizable market segment eager to optimize energy usage and reduce operational costs. Collaborative endeavors between EMS providers, industry associations, and governmental bodies are instrumental in democratizing access to energy management solutions, thereby fostering market growth factor.
Restraining Factors
Overcoming High Initial Investment
The Energy Management Systems (EMS) Market has found innovative ways to address the challenge of high initial investment. While implementing EMS requires substantial upfront costs in hardware, software, and installation, industry major players have introduced financing options and leasing arrangements to mitigate financial barriers, especially for SMEs. By offering flexible payment structures and financing packages, EMS providers enable organizations to spread out their investments over time, making the technology more accessible to a wider range of businesses.
Additionally, the potential for long-term cost savings through energy efficiency improvements serves as a compelling incentive for organizations to overcome the initial financial hurdle and invest in EMS solutions. According to industry data, the average return on investment (ROI) for energy management systems ranges from 10% to 30%, further incentivizing organizations to allocate resources toward implementation despite the upfront costs.
Addressing Data Privacy and Security Concerns
In response to heightened concerns regarding data privacy and security, the Energy Management Systems Market has prioritized robust data protection measures and compliance frameworks. EMS providers invest significantly in encryption technologies, authentication protocols, and cybersecurity infrastructure to safeguard sensitive information collected by these systems. Moreover, adherence to regulatory standards such as GDPR, CCPA, and ISO 27001 demonstrates a commitment to ensuring data privacy and regulatory compliance.
By implementing comprehensive data protection mechanisms, EMS vendors instill confidence in prospective customers, alleviating apprehensions surrounding data security risks. Furthermore, the growing awareness of the potential benefits of EMS, coupled with assurances of data privacy and security, encourages organizations to overcome their reservations and embrace these technologies. As a result, the market continues to expand, driven by the convergence of heightened data security measures and increasing demand for energy management solutions.
By System Type Analysis
Industrial Energy Management Systems (IEMS) dominate with a share of 70.4%.
In 2023, Industrial energy management systems (IEMS) held a dominant market position in the By System Type segment of the Energy Management Systems Market, capturing more than a 70.4% share. This robust performance underscores the critical role of industrial sectors in driving energy efficiency initiatives. With a growing emphasis on sustainability and operational efficiency, industries are increasingly adopting IEMS to monitor, control, and optimize energy consumption across their facilities. IEMS offers comprehensive solutions tailored to the unique needs of industrial settings, encompassing diverse applications such as manufacturing plants, refineries, and utilities.
Simultaneously, Building Energy Management Systems (BEMS) emerged as a pivotal segment, addressing the energy management needs of commercial and institutional buildings. BEMS accounted for a significant portion of the market share, demonstrating an increasing awareness among building owners and operators regarding the importance of efficient energy utilization. These systems leverage advanced technologies like IoT sensors and predictive analytics to optimize HVAC, lighting, and other building systems, thereby reducing energy waste and operational costs.
Home Energy Management Systems (HEMS) also exhibited promising economic growth potential, albeit with a smaller market share compared to industrial and commercial segments. The rising adoption of smart home solutions and the growing industry trends towards sustainable living are driving the demand for HEMS. These systems empower homeowners to monitor and manage their energy consumption in real time, promoting energy conservation and cost savings.
By Vertical Component Analysis
Hardware holds a significant portion at 60.3% in vertical components.
In 2023, Hardware held a dominant market position in the By Vertical Component segment of the Energy Management Systems Market, capturing more than a 60.3% share. This significant market share underscores the pivotal role of hardware components in facilitating the implementation and functioning of energy management systems across various industries and sectors. Hardware encompasses a wide array of physical devices and equipment such as sensors, meters, controllers, and actuators, which form the backbone of energy management infrastructure.
Simultaneously, Software emerged as a crucial component within the Energy Management Systems Market, albeit with a smaller market share compared to hardware. Software solutions play a critical role in enabling data analysis, visualization, and control functionalities essential for effective energy management. These software platforms offer advanced features such as real-time monitoring, predictive analytics, and optimization algorithms, empowering users to make informed decisions and maximize energy efficiency.
Furthermore, Services constituted a notable segment within the Energy Management Systems Market, providing essential support and expertise to organizations in implementing, integrating, and maintaining energy management solutions. Service offerings may include consulting, installation, training, maintenance, and ongoing support, catering to the diverse needs and requirements of clients across various industries.
By Vertical Deployment Analysis
On-premises deployment prevails substantially, capturing 80.8% of the market.
In 2023, On-Premises held a dominant market position in the By Vertical Deployment segment of the Energy Management Systems Market, capturing more than an 80.8% share. This substantial market share underscores the prevalent preference among organizations for on-premises deployment models, particularly in industries where data security, control, and compliance are paramount. On-premises deployment involves hosting energy management systems within the organization's infrastructure, providing direct control over data management and system customization.
Conversely, Cloud deployment emerged as a significant segment within the Energy Management Systems Market, albeit with a smaller market share compared to on-premises solutions. Cloud-based deployment models offer several advantages, including scalability, flexibility, and accessibility, making them increasingly popular among organizations seeking cost-effective and scalable energy management solutions. Cloud deployment enables remote access to energy data and analytics, facilitating centralized management and decision-making across geographically dispersed facilities.
The dominance of On-Premises deployment reflects the cautious approach adopted by many industries, particularly those with stringent data privacy regulations or legacy infrastructure dependencies. Organizations prioritize on-premises solutions to maintain control over sensitive energy data and ensure seamless integration with existing IT systems and processes.
By Vertical Analysis
The manufacturing sector contributes 20.4% to the overall market landscape.
In 2023, Manufacturing held a dominant market position in the By Vertical segment of the Energy Management Systems Market, capturing more than a 20.4% share. This commanding presence underscores the pivotal role of the manufacturing sector in driving the adoption of energy management solutions to enhance operational efficiency, reduce costs, and meet sustainability targets. Manufacturing facilities, characterized by high energy consumption levels and complex production processes, are increasingly leveraging energy management systems to optimize resource utilization and minimize environmental impact.
Simultaneously, Residential emerged as a significant segment within the Energy Management Systems Market, reflecting the growing adoption of smart home technologies and energy-efficient solutions among homeowners. Residential energy management systems offer consumers the ability to monitor and control their energy consumption, thereby promoting energy conservation and cost savings.
Furthermore, Energy & Power, Telecom & IT, Retail, Healthcare, and Other sectors also contributed to the Energy Management Systems Market, each with unique drivers and requirements. Energy & Power companies prioritize energy management to enhance grid stability, reliability, and resilience while adhering to regulatory standards. Telecom & IT organizations leverage energy management systems to minimize operational costs and enhance the efficiency of data centers and communication networks.
In the Retail sector, energy management solutions help optimize lighting, HVAC, and refrigeration systems to reduce overhead expenses and create a more comfortable shopping environment. Healthcare facilities implement energy management systems to ensure uninterrupted operations, comply with healthcare regulations, and reduce carbon footprint.
Key Market Segments
By System Type
- Industrial energy management systems (IEMS)
- Building energy management systems (BEMS)
- Home energy management systems (HEMS)
By Vertical Component
- Hardware
- Software
- Services
By Vertical Deployment
- On-Premises
- Cloud
By Vertical
- Manufacturing
- Residential
- Energy & Power
- Telecom & IT
- Retail
- Healthcare
- Others
Growth Opportunity
Integration with Smart Building Technologies
The integration of energy management systems with smart building technologies presents a pivotal opportunity for the global energy management systems market in 2023. By seamlessly integrating with building automation systems (BAS) and Internet of Things (IoT) devices, energy management systems offer enhanced building efficiency and performance.
This integration facilitates real-time monitoring and control of energy consumption, allowing for proactive adjustments to optimize energy usage. As buildings become smarter and more connected, the demand for sophisticated energy management solutions is expected to surge, driving significant growth in the market.
Demand Response and Peak Load Management
In 2023, energy management systems are poised to capitalize on the growing demand for demand response and peak load management solutions. These systems enable organizations to implement demand response strategies, curtailing energy usage during peak demand periods to mitigate costs and alleviate strain on the power grid.
By leveraging advanced analytics and predictive algorithms, energy management systems empower users to identify peak load periods and adjust energy consumption accordingly, thereby optimizing energy usage and reducing electricity expenses. As businesses increasingly prioritize sustainability and cost-efficiency, the adoption of demand response and peak load management solutions is projected to escalate, fueling the expansion of the global energy management systems market.
Latest Trends
Integration of Artificial Intelligence and Machine Learning Algorithms
The incorporation of artificial intelligence (AI) and machine learning (ML) algorithms into energy management systems marks a significant trend in the global market for 2023. By harnessing the power of AI and ML, these systems can perform predictive analytics, allowing organizations to anticipate energy consumption patterns, identify inefficiencies, and optimize energy usage proactively.
The utilization of advanced algorithms enhances the accuracy and efficiency of energy management, enabling businesses to make data-driven decisions and achieve greater energy savings. As AI and ML technologies continue to evolve, their integration into energy management systems is expected to drive innovation and foster sustainable practices across various industries.
Expansion of Demand Response Programs and Real-time Energy Optimization
Another prominent trend in the global energy management systems market for 2023 is the expansion of demand response programs and real-time energy optimization capabilities. With the increasing emphasis on energy efficiency and sustainability, organizations are seeking ways to reduce their energy consumption and costs while maintaining operational efficiency. Energy management systems equipped with real-time energy optimization features enable businesses to dynamically adjust energy usage based on demand, pricing signals, and grid conditions.
Additionally, the expansion of demand response programs allows organizations to participate in incentive-based schemes that incentivize load-shifting and energy conservation during peak demand periods. These initiatives not only help organizations reduce their electricity expenses but also contribute to the overall stability and reliability of the power grid. As the global focus on energy management intensifies, the adoption of demand response programs and real-time energy optimization is expected to continue expanding, driving growth in the market.
Regional Analysis
In North America, the Energy Management Systems market captures a significant share of 35.8%.
The Energy Management Systems (EMS) market demonstrates robust growth across various regions, with distinct trends and opportunities shaping each geographical segment. In North America, comprising the United States and Canada primarily, the market dominance is pronounced, capturing a significant share of 35.8%.
This dominance is attributed to the region's proactive approach towards sustainability initiatives and stringent regulations promoting energy efficiency. The widespread adoption of smart grid technologies and the presence of key market players further fuel the market growth. According to recent industry reports, North America's EMS market is projected to maintain its leadership position, with a compound annual growth rate (CAGR) of 12.5% during the forecast period.
In Europe, a mature market for EMS solutions, stringent government regulations aimed at reducing carbon emissions drive the adoption of energy management systems. Countries such as Germany, France, and the United Kingdom are at the forefront of embracing renewable energy sources and implementing smart infrastructure, contributing significantly to the market growth. The European EMS market is anticipated to witness steady growth, with a CAGR of 9.7% over the forecast period.
Asia Pacific emerges as a lucrative market for energy management systems, propelled by rapid industrialization, urbanization, and the escalating demand for electricity. Countries like China, Japan, and India are investing heavily in smart grid infrastructure and sustainable energy projects, fostering the adoption of EMS solutions. The Asia Pacific EMS market is forecasted to register the highest growth rate globally, with a CAGR of 14.3%, driven by the region's burgeoning population and expanding industrial sector.
In the Middle East & Africa and Latin America regions, the adoption of EMS is gradually gaining traction, driven by the increasing awareness of energy conservation and government initiatives promoting sustainable development. Despite facing challenges such as economic instability and political uncertainties, these regions present untapped opportunities for market players to capitalize on. While North America dominates the EMS market currently, the Asia Pacific region is expected to witness the highest growth rate, indicative of shifting market dynamics and emerging opportunities in the global energy management systems landscape.
Key Regions and Countries
North America
- The US
- Canada
- Rest of North America
Europe
- Germany
- France
- The UK
- Spain
- Netherlands
- Russia
- Italy
- Rest of Europe
Asia-Pacific
- China
- Japan
- Singapore
- Thailand
- South Korea
- Vietnam
- India
- New Zealand
- Rest of Asia Pacific
Latin America
- Mexico
- Brazil
- Rest of Latin America
Middle East & Africa
- Saudi Arabia
- South Africa
- UAE
- Rest of the Middle East & Africa
Key Players Analysis
In 2023, the global Energy Management Systems (EMS) market witnessed notable strides propelled by a confluence of technological advancements, increasing awareness regarding sustainability, and regulatory mandates aimed at energy efficiency. Among the key players shaping this landscape, Schneider Electric SE stands out as a prominent force driving innovation and transformative solutions within the EMS domain.
With a robust portfolio spanning smart grid solutions, automation technologies, and digital energy management platforms, Schneider Electric SE has fortified its position as a frontrunner in enabling organizations to optimize energy consumption and mitigate operational costs.
Honeywell International Inc. emerges as another formidable contender, leveraging its expertise in industrial automation and control systems to deliver comprehensive EMS offerings tailored to diverse industry verticals. Siemens AG, renowned for its proficiency in industrial manufacturing and digitalization, continues to assert its influence through cutting-edge EMS solutions designed to enhance operational efficiency and facilitate seamless integration with existing infrastructure.
Furthermore, Johnson Controls, Inc. commands attention with its holistic approach to energy optimization, leveraging advanced analytics and building management systems to empower clients in achieving their sustainability objectives. C3.ai, Inc., an emerging player in the EMS landscape, distinguishes itself through its innovative AI-driven platforms, offering predictive analytics and real-time insights to drive actionable decision-making.
Market Key Players
- Schneider Electric SE
- Honeywell International Inc.
- Siemens AG
- Johnson Controls, Inc.
- C3.ai, Inc.
- GridPoint
- General Electric
- ABB
- International Business Machines Corporation
- Cisco Systems, Inc.
Recent Development
- In March 2024, Copenhagen Airport pioneers sustainable aviation with a large battery system storing renewable energy. ALIGHT project integrates a 900 kW battery, positioning the airport as a leader in eco-friendly operations.
- In December 2023, CBI: energy's Roger Hislop advocates for sustainable solutions in commercial real estate. Intelligent load-management systems and HVAC upgrades promise energy efficiency, cost savings, and improved tenant satisfaction.
- In December 2023, Johnson Controls was recognized as a leader in Energy Management Software by Verdantix report. OpenBlue platform offers comprehensive building performance management, aiding in energy efficiency, sustainability, and regulatory compliance across various sectors.
Report Scope
Report Features Description Market Value (2023) USD 47.7 Billion Forecast Revenue (2033) USD 141.6 Billion CAGR (2024-2032) 11.8% Base Year for Estimation 2023 Historic Period 2016-2023 Forecast Period 2024-2033 Report Coverage Revenue Forecast, Market Dynamics, COVID-19 Impact, Competitive Landscape, Recent Developments Segments Covered By System Type (Industrial energy management systems (IEMS), Building energy management systems (BEMS), Home energy management systems (HEMS)), By Vertical Component(Hardware, Software, Services), By Vertical Deployment(On-Premises, Cloud), By Vertical(Manufacturing, Residential, Energy & Power, Telecom & IT, Retail, Healthcare, Others) Regional Analysis North America - The US, Canada, Rest of North America, Europe - Germany, France, The UK, Spain, Italy, Russia, Netherlands, Rest of Europe, Asia-Pacific - China, Japan, South Korea, India, New Zealand, Singapore, Thailand, Vietnam, Rest of Asia Pacific, Latin America - Brazil, Mexico, Rest of Latin America, Middle East & Africa - South Africa, Saudi Arabia, UAE, Rest of Middle East & Africa Competitive Landscape Schneider Electric SE, Honeywell International Inc., Siemens AG, Johnson Controls, Inc., C3.ai, Inc., GridPoint, General Electric, ABB, International Business Machines Corporation, Cisco Systems, Inc. Customization Scope Customization for segments, region/country-level will be provided. Moreover, additional customization can be done based on the requirements. Purchase Options We have three licenses to opt for Single User License, Multi-User License (Up to 5 Users), Corporate Use License (Unlimited User and Printable PDF) -
- 1. Executive Summary
- 1.1. Definition
- 1.2. Taxonomy
- 1.3. Research Scope
- 1.4. Key Analysis
- 1.5. Key Findings by Major Segments
- 1.6. Top strategies by Major Players
- 2. Global Energy Management Systems Market Overview
- 2.1. Energy Management Systems Market Dynamics
- 2.1.1. Drivers
- 2.1.2. Opportunities
- 2.1.3. Restraints
- 2.1.4. Challenges
- 2.2. Macro-economic Factors
- 2.3. Regulatory Framework
- 2.4. Market Investment Feasibility Index
- 2.5. PEST Analysis
- 2.6. PORTER’S Five Force Analysis
- 2.7. Drivers & Restraints Impact Analysis
- 2.8. Industry Chain Analysis
- 2.9. Cost Structure Analysis
- 2.10. Marketing Strategy
- 2.11. Russia-Ukraine War Impact Analysis
- 2.12. Opportunity Map Analysis
- 2.13. Market Competition Scenario Analysis
- 2.14. Product Life Cycle Analysis
- 2.15. Opportunity Orbits
- 2.16. Manufacturer Intensity Map
- 2.17. Major Companies sales by Value & Volume
- 2.1. Energy Management Systems Market Dynamics
- 3. Global Energy Management Systems Market Analysis, Opportunity and Forecast, 2016-2032
- 3.1. Global Energy Management Systems Market Analysis, 2016-2021
- 3.2. Global Energy Management Systems Market Opportunity and Forecast, 2023-2032
- 3.3. Global Energy Management Systems Market Analysis, Opportunity and Forecast, By By System Type, 2016-2032
- 3.3.1. Global Energy Management Systems Market Analysis by By System Type: Introduction
- 3.3.2. Market Size Absolute $ Opportunity Analysis and Forecast, By By System Type, 2016-2032
- 3.3.3. Industrial energy management systems (IEMS)
- 3.3.4. Building energy management systems (BEMS)
- 3.3.5. Home energy management systems (HEMS)
- 3.4. Global Energy Management Systems Market Analysis, Opportunity and Forecast, By By Vertical Component, 2016-2032
- 3.4.1. Global Energy Management Systems Market Analysis by By Vertical Component: Introduction
- 3.4.2. Market Size Absolute $ Opportunity Analysis and Forecast, By By Vertical Component, 2016-2032
- 3.4.3. Hardware
- 3.4.4. Software
- 3.4.5. Services
- 3.5. Global Energy Management Systems Market Analysis, Opportunity and Forecast, By By Vertical Deployment , 2016-2032
- 3.5.1. Global Energy Management Systems Market Analysis by By Vertical Deployment : Introduction
- 3.5.2. Market Size Absolute $ Opportunity Analysis and Forecast, By By Vertical Deployment , 2016-2032
- 3.5.3. On-Premises
- 3.5.4. Cloud
- 3.6. Global Energy Management Systems Market Analysis, Opportunity and Forecast, By By Vertical, 2016-2032
- 3.6.1. Global Energy Management Systems Market Analysis by By Vertical: Introduction
- 3.6.2. Market Size Absolute $ Opportunity Analysis and Forecast, By By Vertical, 2016-2032
- 3.6.3. Manufacturing
- 3.6.4. Residential
- 3.6.5. Energy & Power
- 3.6.6. Telecom & IT
- 3.6.7. Retail
- 3.6.8. Healthcare
- 3.6.9. Others
- 4. North America Energy Management Systems Market Analysis, Opportunity and Forecast, 2016-2032
- 4.1. North America Energy Management Systems Market Analysis, 2016-2021
- 4.2. North America Energy Management Systems Market Opportunity and Forecast, 2023-2032
- 4.3. North America Energy Management Systems Market Analysis, Opportunity and Forecast, By By System Type, 2016-2032
- 4.3.1. North America Energy Management Systems Market Analysis by By System Type: Introduction
- 4.3.2. Market Size Absolute $ Opportunity Analysis and Forecast, By By System Type, 2016-2032
- 4.3.3. Industrial energy management systems (IEMS)
- 4.3.4. Building energy management systems (BEMS)
- 4.3.5. Home energy management systems (HEMS)
- 4.4. North America Energy Management Systems Market Analysis, Opportunity and Forecast, By By Vertical Component, 2016-2032
- 4.4.1. North America Energy Management Systems Market Analysis by By Vertical Component: Introduction
- 4.4.2. Market Size Absolute $ Opportunity Analysis and Forecast, By By Vertical Component, 2016-2032
- 4.4.3. Hardware
- 4.4.4. Software
- 4.4.5. Services
- 4.5. North America Energy Management Systems Market Analysis, Opportunity and Forecast, By By Vertical Deployment , 2016-2032
- 4.5.1. North America Energy Management Systems Market Analysis by By Vertical Deployment : Introduction
- 4.5.2. Market Size Absolute $ Opportunity Analysis and Forecast, By By Vertical Deployment , 2016-2032
- 4.5.3. On-Premises
- 4.5.4. Cloud
- 4.6. North America Energy Management Systems Market Analysis, Opportunity and Forecast, By By Vertical, 2016-2032
- 4.6.1. North America Energy Management Systems Market Analysis by By Vertical: Introduction
- 4.6.2. Market Size Absolute $ Opportunity Analysis and Forecast, By By Vertical, 2016-2032
- 4.6.3. Manufacturing
- 4.6.4. Residential
- 4.6.5. Energy & Power
- 4.6.6. Telecom & IT
- 4.6.7. Retail
- 4.6.8. Healthcare
- 4.6.9. Others
- 4.7. North America Energy Management Systems Market Analysis, Opportunity and Forecast, By Country , 2016-2032
- 4.7.1. North America Energy Management Systems Market Analysis by Country : Introduction
- 4.7.2. Market Size Absolute $ Opportunity Analysis and Forecast, Country , 2016-2032
- 4.7.2.1. The US
- 4.7.2.2. Canada
- 4.7.2.3. Mexico
- 5. Western Europe Energy Management Systems Market Analysis, Opportunity and Forecast, 2016-2032
- 5.1. Western Europe Energy Management Systems Market Analysis, 2016-2021
- 5.2. Western Europe Energy Management Systems Market Opportunity and Forecast, 2023-2032
- 5.3. Western Europe Energy Management Systems Market Analysis, Opportunity and Forecast, By By System Type, 2016-2032
- 5.3.1. Western Europe Energy Management Systems Market Analysis by By System Type: Introduction
- 5.3.2. Market Size Absolute $ Opportunity Analysis and Forecast, By By System Type, 2016-2032
- 5.3.3. Industrial energy management systems (IEMS)
- 5.3.4. Building energy management systems (BEMS)
- 5.3.5. Home energy management systems (HEMS)
- 5.4. Western Europe Energy Management Systems Market Analysis, Opportunity and Forecast, By By Vertical Component, 2016-2032
- 5.4.1. Western Europe Energy Management Systems Market Analysis by By Vertical Component: Introduction
- 5.4.2. Market Size Absolute $ Opportunity Analysis and Forecast, By By Vertical Component, 2016-2032
- 5.4.3. Hardware
- 5.4.4. Software
- 5.4.5. Services
- 5.5. Western Europe Energy Management Systems Market Analysis, Opportunity and Forecast, By By Vertical Deployment , 2016-2032
- 5.5.1. Western Europe Energy Management Systems Market Analysis by By Vertical Deployment : Introduction
- 5.5.2. Market Size Absolute $ Opportunity Analysis and Forecast, By By Vertical Deployment , 2016-2032
- 5.5.3. On-Premises
- 5.5.4. Cloud
- 5.6. Western Europe Energy Management Systems Market Analysis, Opportunity and Forecast, By By Vertical, 2016-2032
- 5.6.1. Western Europe Energy Management Systems Market Analysis by By Vertical: Introduction
- 5.6.2. Market Size Absolute $ Opportunity Analysis and Forecast, By By Vertical, 2016-2032
- 5.6.3. Manufacturing
- 5.6.4. Residential
- 5.6.5. Energy & Power
- 5.6.6. Telecom & IT
- 5.6.7. Retail
- 5.6.8. Healthcare
- 5.6.9. Others
- 5.7. Western Europe Energy Management Systems Market Analysis, Opportunity and Forecast, By Country , 2016-2032
- 5.7.1. Western Europe Energy Management Systems Market Analysis by Country : Introduction
- 5.7.2. Market Size Absolute $ Opportunity Analysis and Forecast, Country , 2016-2032
- 5.7.2.1. Germany
- 5.7.2.2. France
- 5.7.2.3. The UK
- 5.7.2.4. Spain
- 5.7.2.5. Italy
- 5.7.2.6. Portugal
- 5.7.2.7. Ireland
- 5.7.2.8. Austria
- 5.7.2.9. Switzerland
- 5.7.2.10. Benelux
- 5.7.2.11. Nordic
- 5.7.2.12. Rest of Western Europe
- 6. Eastern Europe Energy Management Systems Market Analysis, Opportunity and Forecast, 2016-2032
- 6.1. Eastern Europe Energy Management Systems Market Analysis, 2016-2021
- 6.2. Eastern Europe Energy Management Systems Market Opportunity and Forecast, 2023-2032
- 6.3. Eastern Europe Energy Management Systems Market Analysis, Opportunity and Forecast, By By System Type, 2016-2032
- 6.3.1. Eastern Europe Energy Management Systems Market Analysis by By System Type: Introduction
- 6.3.2. Market Size Absolute $ Opportunity Analysis and Forecast, By By System Type, 2016-2032
- 6.3.3. Industrial energy management systems (IEMS)
- 6.3.4. Building energy management systems (BEMS)
- 6.3.5. Home energy management systems (HEMS)
- 6.4. Eastern Europe Energy Management Systems Market Analysis, Opportunity and Forecast, By By Vertical Component, 2016-2032
- 6.4.1. Eastern Europe Energy Management Systems Market Analysis by By Vertical Component: Introduction
- 6.4.2. Market Size Absolute $ Opportunity Analysis and Forecast, By By Vertical Component, 2016-2032
- 6.4.3. Hardware
- 6.4.4. Software
- 6.4.5. Services
- 6.5. Eastern Europe Energy Management Systems Market Analysis, Opportunity and Forecast, By By Vertical Deployment , 2016-2032
- 6.5.1. Eastern Europe Energy Management Systems Market Analysis by By Vertical Deployment : Introduction
- 6.5.2. Market Size Absolute $ Opportunity Analysis and Forecast, By By Vertical Deployment , 2016-2032
- 6.5.3. On-Premises
- 6.5.4. Cloud
- 6.6. Eastern Europe Energy Management Systems Market Analysis, Opportunity and Forecast, By By Vertical, 2016-2032
- 6.6.1. Eastern Europe Energy Management Systems Market Analysis by By Vertical: Introduction
- 6.6.2. Market Size Absolute $ Opportunity Analysis and Forecast, By By Vertical, 2016-2032
- 6.6.3. Manufacturing
- 6.6.4. Residential
- 6.6.5. Energy & Power
- 6.6.6. Telecom & IT
- 6.6.7. Retail
- 6.6.8. Healthcare
- 6.6.9. Others
- 6.7. Eastern Europe Energy Management Systems Market Analysis, Opportunity and Forecast, By Country , 2016-2032
- 6.7.1. Eastern Europe Energy Management Systems Market Analysis by Country : Introduction
- 6.7.2. Market Size Absolute $ Opportunity Analysis and Forecast, Country , 2016-2032
- 6.7.2.1. Russia
- 6.7.2.2. Poland
- 6.7.2.3. The Czech Republic
- 6.7.2.4. Greece
- 6.7.2.5. Rest of Eastern Europe
- 7. APAC Energy Management Systems Market Analysis, Opportunity and Forecast, 2016-2032
- 7.1. APAC Energy Management Systems Market Analysis, 2016-2021
- 7.2. APAC Energy Management Systems Market Opportunity and Forecast, 2023-2032
- 7.3. APAC Energy Management Systems Market Analysis, Opportunity and Forecast, By By System Type, 2016-2032
- 7.3.1. APAC Energy Management Systems Market Analysis by By System Type: Introduction
- 7.3.2. Market Size Absolute $ Opportunity Analysis and Forecast, By By System Type, 2016-2032
- 7.3.3. Industrial energy management systems (IEMS)
- 7.3.4. Building energy management systems (BEMS)
- 7.3.5. Home energy management systems (HEMS)
- 7.4. APAC Energy Management Systems Market Analysis, Opportunity and Forecast, By By Vertical Component, 2016-2032
- 7.4.1. APAC Energy Management Systems Market Analysis by By Vertical Component: Introduction
- 7.4.2. Market Size Absolute $ Opportunity Analysis and Forecast, By By Vertical Component, 2016-2032
- 7.4.3. Hardware
- 7.4.4. Software
- 7.4.5. Services
- 7.5. APAC Energy Management Systems Market Analysis, Opportunity and Forecast, By By Vertical Deployment , 2016-2032
- 7.5.1. APAC Energy Management Systems Market Analysis by By Vertical Deployment : Introduction
- 7.5.2. Market Size Absolute $ Opportunity Analysis and Forecast, By By Vertical Deployment , 2016-2032
- 7.5.3. On-Premises
- 7.5.4. Cloud
- 7.6. APAC Energy Management Systems Market Analysis, Opportunity and Forecast, By By Vertical, 2016-2032
- 7.6.1. APAC Energy Management Systems Market Analysis by By Vertical: Introduction
- 7.6.2. Market Size Absolute $ Opportunity Analysis and Forecast, By By Vertical, 2016-2032
- 7.6.3. Manufacturing
- 7.6.4. Residential
- 7.6.5. Energy & Power
- 7.6.6. Telecom & IT
- 7.6.7. Retail
- 7.6.8. Healthcare
- 7.6.9. Others
- 7.7. APAC Energy Management Systems Market Analysis, Opportunity and Forecast, By Country , 2016-2032
- 7.7.1. APAC Energy Management Systems Market Analysis by Country : Introduction
- 7.7.2. Market Size Absolute $ Opportunity Analysis and Forecast, Country , 2016-2032
- 7.7.2.1. China
- 7.7.2.2. Japan
- 7.7.2.3. South Korea
- 7.7.2.4. India
- 7.7.2.5. Australia & New Zeland
- 7.7.2.6. Indonesia
- 7.7.2.7. Malaysia
- 7.7.2.8. Philippines
- 7.7.2.9. Singapore
- 7.7.2.10. Thailand
- 7.7.2.11. Vietnam
- 7.7.2.12. Rest of APAC
- 8. Latin America Energy Management Systems Market Analysis, Opportunity and Forecast, 2016-2032
- 8.1. Latin America Energy Management Systems Market Analysis, 2016-2021
- 8.2. Latin America Energy Management Systems Market Opportunity and Forecast, 2023-2032
- 8.3. Latin America Energy Management Systems Market Analysis, Opportunity and Forecast, By By System Type, 2016-2032
- 8.3.1. Latin America Energy Management Systems Market Analysis by By System Type: Introduction
- 8.3.2. Market Size Absolute $ Opportunity Analysis and Forecast, By By System Type, 2016-2032
- 8.3.3. Industrial energy management systems (IEMS)
- 8.3.4. Building energy management systems (BEMS)
- 8.3.5. Home energy management systems (HEMS)
- 8.4. Latin America Energy Management Systems Market Analysis, Opportunity and Forecast, By By Vertical Component, 2016-2032
- 8.4.1. Latin America Energy Management Systems Market Analysis by By Vertical Component: Introduction
- 8.4.2. Market Size Absolute $ Opportunity Analysis and Forecast, By By Vertical Component, 2016-2032
- 8.4.3. Hardware
- 8.4.4. Software
- 8.4.5. Services
- 8.5. Latin America Energy Management Systems Market Analysis, Opportunity and Forecast, By By Vertical Deployment , 2016-2032
- 8.5.1. Latin America Energy Management Systems Market Analysis by By Vertical Deployment : Introduction
- 8.5.2. Market Size Absolute $ Opportunity Analysis and Forecast, By By Vertical Deployment , 2016-2032
- 8.5.3. On-Premises
- 8.5.4. Cloud
- 8.6. Latin America Energy Management Systems Market Analysis, Opportunity and Forecast, By By Vertical, 2016-2032
- 8.6.1. Latin America Energy Management Systems Market Analysis by By Vertical: Introduction
- 8.6.2. Market Size Absolute $ Opportunity Analysis and Forecast, By By Vertical, 2016-2032
- 8.6.3. Manufacturing
- 8.6.4. Residential
- 8.6.5. Energy & Power
- 8.6.6. Telecom & IT
- 8.6.7. Retail
- 8.6.8. Healthcare
- 8.6.9. Others
- 8.7. Latin America Energy Management Systems Market Analysis, Opportunity and Forecast, By Country , 2016-2032
- 8.7.1. Latin America Energy Management Systems Market Analysis by Country : Introduction
- 8.7.2. Market Size Absolute $ Opportunity Analysis and Forecast, Country , 2016-2032
- 8.7.2.1. Brazil
- 8.7.2.2. Colombia
- 8.7.2.3. Chile
- 8.7.2.4. Argentina
- 8.7.2.5. Costa Rica
- 8.7.2.6. Rest of Latin America
- 9. Middle East & Africa Energy Management Systems Market Analysis, Opportunity and Forecast, 2016-2032
- 9.1. Middle East & Africa Energy Management Systems Market Analysis, 2016-2021
- 9.2. Middle East & Africa Energy Management Systems Market Opportunity and Forecast, 2023-2032
- 9.3. Middle East & Africa Energy Management Systems Market Analysis, Opportunity and Forecast, By By System Type, 2016-2032
- 9.3.1. Middle East & Africa Energy Management Systems Market Analysis by By System Type: Introduction
- 9.3.2. Market Size Absolute $ Opportunity Analysis and Forecast, By By System Type, 2016-2032
- 9.3.3. Industrial energy management systems (IEMS)
- 9.3.4. Building energy management systems (BEMS)
- 9.3.5. Home energy management systems (HEMS)
- 9.4. Middle East & Africa Energy Management Systems Market Analysis, Opportunity and Forecast, By By Vertical Component, 2016-2032
- 9.4.1. Middle East & Africa Energy Management Systems Market Analysis by By Vertical Component: Introduction
- 9.4.2. Market Size Absolute $ Opportunity Analysis and Forecast, By By Vertical Component, 2016-2032
- 9.4.3. Hardware
- 9.4.4. Software
- 9.4.5. Services
- 9.5. Middle East & Africa Energy Management Systems Market Analysis, Opportunity and Forecast, By By Vertical Deployment , 2016-2032
- 9.5.1. Middle East & Africa Energy Management Systems Market Analysis by By Vertical Deployment : Introduction
- 9.5.2. Market Size Absolute $ Opportunity Analysis and Forecast, By By Vertical Deployment , 2016-2032
- 9.5.3. On-Premises
- 9.5.4. Cloud
- 9.6. Middle East & Africa Energy Management Systems Market Analysis, Opportunity and Forecast, By By Vertical, 2016-2032
- 9.6.1. Middle East & Africa Energy Management Systems Market Analysis by By Vertical: Introduction
- 9.6.2. Market Size Absolute $ Opportunity Analysis and Forecast, By By Vertical, 2016-2032
- 9.6.3. Manufacturing
- 9.6.4. Residential
- 9.6.5. Energy & Power
- 9.6.6. Telecom & IT
- 9.6.7. Retail
- 9.6.8. Healthcare
- 9.6.9. Others
- 9.7. Middle East & Africa Energy Management Systems Market Analysis, Opportunity and Forecast, By Country , 2016-2032
- 9.7.1. Middle East & Africa Energy Management Systems Market Analysis by Country : Introduction
- 9.7.2. Market Size Absolute $ Opportunity Analysis and Forecast, Country , 2016-2032
- 9.7.2.1. Algeria
- 9.7.2.2. Egypt
- 9.7.2.3. Israel
- 9.7.2.4. Kuwait
- 9.7.2.5. Nigeria
- 9.7.2.6. Saudi Arabia
- 9.7.2.7. South Africa
- 9.7.2.8. Turkey
- 9.7.2.9. The UAE
- 9.7.2.10. Rest of MEA
- 10. Global Energy Management Systems Market Analysis, Opportunity and Forecast, By Region , 2016-2032
- 10.1. Global Energy Management Systems Market Analysis by Region : Introduction
- 10.2. Market Size Absolute $ Opportunity Analysis and Forecast, By Region , 2016-2032
- 10.2.1. North America
- 10.2.2. Western Europe
- 10.2.3. Eastern Europe
- 10.2.4. APAC
- 10.2.5. Latin America
- 10.2.6. Middle East & Africa
- 11. Global Energy Management Systems Market Competitive Landscape, Market Share Analysis, and Company Profiles
- 11.1. Market Share Analysis
- 11.2. Company Profiles
- 11.3. Schneider Electric SE
- 11.3.1. Company Overview
- 11.3.2. Financial Highlights
- 11.3.3. Product Portfolio
- 11.3.4. SWOT Analysis
- 11.3.5. Key Strategies and Developments
- 11.4. Honeywell International Inc.
- 11.4.1. Company Overview
- 11.4.2. Financial Highlights
- 11.4.3. Product Portfolio
- 11.4.4. SWOT Analysis
- 11.4.5. Key Strategies and Developments
- 11.5. Siemens AG
- 11.5.1. Company Overview
- 11.5.2. Financial Highlights
- 11.5.3. Product Portfolio
- 11.5.4. SWOT Analysis
- 11.5.5. Key Strategies and Developments
- 11.6. Johnson Controls, Inc.
- 11.6.1. Company Overview
- 11.6.2. Financial Highlights
- 11.6.3. Product Portfolio
- 11.6.4. SWOT Analysis
- 11.6.5. Key Strategies and Developments
- 11.7. C3.ai, Inc.
- 11.7.1. Company Overview
- 11.7.2. Financial Highlights
- 11.7.3. Product Portfolio
- 11.7.4. SWOT Analysis
- 11.7.5. Key Strategies and Developments
- 11.8. GridPoint
- 11.8.1. Company Overview
- 11.8.2. Financial Highlights
- 11.8.3. Product Portfolio
- 11.8.4. SWOT Analysis
- 11.8.5. Key Strategies and Developments
- 11.9. General Electric
- 11.9.1. Company Overview
- 11.9.2. Financial Highlights
- 11.9.3. Product Portfolio
- 11.9.4. SWOT Analysis
- 11.9.5. Key Strategies and Developments
- 11.10. ABB
- 11.10.1. Company Overview
- 11.10.2. Financial Highlights
- 11.10.3. Product Portfolio
- 11.10.4. SWOT Analysis
- 11.10.5. Key Strategies and Developments
- 11.11. International Business Machines Corporation
- 11.11.1. Company Overview
- 11.11.2. Financial Highlights
- 11.11.3. Product Portfolio
- 11.11.4. SWOT Analysis
- 11.11.5. Key Strategies and Developments
- 11.12. Cisco Systems, Inc.
- 11.12.1. Company Overview
- 11.12.2. Financial Highlights
- 11.12.3. Product Portfolio
- 11.12.4. SWOT Analysis
- 11.12.5. Key Strategies and Developments
- 11.13.1. Company Overview
- 11.13.2. Financial Highlights
- 11.13.3. Product Portfolio
- 11.13.4. SWOT Analysis
- 11.13.5. Key Strategies and Developments
- 12. Assumptions and Acronyms
- 13. Research Methodology
- 14. Contact
"
- List of Figures
- "
- Figure 1: Global Energy Management Systems Market Revenue (US$ Mn) Market Share by By System Type in 2022
- Figure 2: Global Energy Management Systems Market Market Attractiveness Analysis by By System Type, 2016-2032
- Figure 3: Global Energy Management Systems Market Revenue (US$ Mn) Market Share by By Vertical Componentin 2022
- Figure 4: Global Energy Management Systems Market Market Attractiveness Analysis by By Vertical Component, 2016-2032
- Figure 5: Global Energy Management Systems Market Revenue (US$ Mn) Market Share by By Vertical Deployment in 2022
- Figure 6: Global Energy Management Systems Market Market Attractiveness Analysis by By Vertical Deployment , 2016-2032
- Figure 7: Global Energy Management Systems Market Revenue (US$ Mn) Market Share by By Verticalin 2022
- Figure 8: Global Energy Management Systems Market Market Attractiveness Analysis by By Vertical, 2016-2032
- Figure 9: Global Energy Management Systems Market Revenue (US$ Mn) Market Share by Region in 2022
- Figure 10: Global Energy Management Systems Market Market Attractiveness Analysis by Region, 2016-2032
- Figure 11: Global Energy Management Systems Market Market Revenue (US$ Mn) (2016-2032)
- Figure 12: Global Energy Management Systems Market Market Revenue (US$ Mn) Comparison by Region (2016-2032)
- Figure 13: Global Energy Management Systems Market Market Revenue (US$ Mn) Comparison by By System Type (2016-2032)
- Figure 14: Global Energy Management Systems Market Market Revenue (US$ Mn) Comparison by By Vertical Component (2016-2032)
- Figure 15: Global Energy Management Systems Market Market Revenue (US$ Mn) Comparison by By Vertical Deployment (2016-2032)
- Figure 16: Global Energy Management Systems Market Market Revenue (US$ Mn) Comparison by By Vertical (2016-2032)
- Figure 17: Global Energy Management Systems Market Market Y-o-Y Growth Rate Comparison by Region (2016-2032)
- Figure 18: Global Energy Management Systems Market Market Y-o-Y Growth Rate Comparison by By System Type (2016-2032)
- Figure 19: Global Energy Management Systems Market Market Y-o-Y Growth Rate Comparison by By Vertical Component (2016-2032)
- Figure 20: Global Energy Management Systems Market Market Y-o-Y Growth Rate Comparison by By Vertical Deployment (2016-2032)
- Figure 21: Global Energy Management Systems Market Market Y-o-Y Growth Rate Comparison by By Vertical (2016-2032)
- Figure 22: Global Energy Management Systems Market Market Share Comparison by Region (2016-2032)
- Figure 23: Global Energy Management Systems Market Market Share Comparison by By System Type (2016-2032)
- Figure 24: Global Energy Management Systems Market Market Share Comparison by By Vertical Component (2016-2032)
- Figure 25: Global Energy Management Systems Market Market Share Comparison by By Vertical Deployment (2016-2032)
- Figure 26: Global Energy Management Systems Market Market Share Comparison by By Vertical (2016-2032)
- Figure 27: North America Energy Management Systems Market Revenue (US$ Mn) Market Share by By System Typein 2022
- Figure 28: North America Energy Management Systems Market Market Attractiveness Analysis by By System Type, 2016-2032
- Figure 29: North America Energy Management Systems Market Revenue (US$ Mn) Market Share by By Vertical Componentin 2022
- Figure 30: North America Energy Management Systems Market Market Attractiveness Analysis by By Vertical Component, 2016-2032
- Figure 31: North America Energy Management Systems Market Revenue (US$ Mn) Market Share by By Vertical Deployment in 2022
- Figure 32: North America Energy Management Systems Market Market Attractiveness Analysis by By Vertical Deployment , 2016-2032
- Figure 33: North America Energy Management Systems Market Revenue (US$ Mn) Market Share by By Verticalin 2022
- Figure 34: North America Energy Management Systems Market Market Attractiveness Analysis by By Vertical, 2016-2032
- Figure 35: North America Energy Management Systems Market Revenue (US$ Mn) Market Share by Country in 2022
- Figure 36: North America Energy Management Systems Market Market Attractiveness Analysis by Country, 2016-2032
- Figure 37: North America Energy Management Systems Market Market Revenue (US$ Mn) (2016-2032)
- Figure 38: North America Energy Management Systems Market Market Revenue (US$ Mn) Comparison by Country (2016-2032)
- Figure 39: North America Energy Management Systems Market Market Revenue (US$ Mn) Comparison by By System Type (2016-2032)
- Figure 40: North America Energy Management Systems Market Market Revenue (US$ Mn) Comparison by By Vertical Component (2016-2032)
- Figure 41: North America Energy Management Systems Market Market Revenue (US$ Mn) Comparison by By Vertical Deployment (2016-2032)
- Figure 42: North America Energy Management Systems Market Market Revenue (US$ Mn) Comparison by By Vertical (2016-2032)
- Figure 43: North America Energy Management Systems Market Market Y-o-Y Growth Rate Comparison by Country (2016-2032)
- Figure 44: North America Energy Management Systems Market Market Y-o-Y Growth Rate Comparison by By System Type (2016-2032)
- Figure 45: North America Energy Management Systems Market Market Y-o-Y Growth Rate Comparison by By Vertical Component (2016-2032)
- Figure 46: North America Energy Management Systems Market Market Y-o-Y Growth Rate Comparison by By Vertical Deployment (2016-2032)
- Figure 47: North America Energy Management Systems Market Market Y-o-Y Growth Rate Comparison by By Vertical (2016-2032)
- Figure 48: North America Energy Management Systems Market Market Share Comparison by Country (2016-2032)
- Figure 49: North America Energy Management Systems Market Market Share Comparison by By System Type (2016-2032)
- Figure 50: North America Energy Management Systems Market Market Share Comparison by By Vertical Component (2016-2032)
- Figure 51: North America Energy Management Systems Market Market Share Comparison by By Vertical Deployment (2016-2032)
- Figure 52: North America Energy Management Systems Market Market Share Comparison by By Vertical (2016-2032)
- Figure 53: Western Europe Energy Management Systems Market Revenue (US$ Mn) Market Share by By System Typein 2022
- Figure 54: Western Europe Energy Management Systems Market Market Attractiveness Analysis by By System Type, 2016-2032
- Figure 55: Western Europe Energy Management Systems Market Revenue (US$ Mn) Market Share by By Vertical Componentin 2022
- Figure 56: Western Europe Energy Management Systems Market Market Attractiveness Analysis by By Vertical Component, 2016-2032
- Figure 57: Western Europe Energy Management Systems Market Revenue (US$ Mn) Market Share by By Vertical Deployment in 2022
- Figure 58: Western Europe Energy Management Systems Market Market Attractiveness Analysis by By Vertical Deployment , 2016-2032
- Figure 59: Western Europe Energy Management Systems Market Revenue (US$ Mn) Market Share by By Verticalin 2022
- Figure 60: Western Europe Energy Management Systems Market Market Attractiveness Analysis by By Vertical, 2016-2032
- Figure 61: Western Europe Energy Management Systems Market Revenue (US$ Mn) Market Share by Country in 2022
- Figure 62: Western Europe Energy Management Systems Market Market Attractiveness Analysis by Country, 2016-2032
- Figure 63: Western Europe Energy Management Systems Market Market Revenue (US$ Mn) (2016-2032)
- Figure 64: Western Europe Energy Management Systems Market Market Revenue (US$ Mn) Comparison by Country (2016-2032)
- Figure 65: Western Europe Energy Management Systems Market Market Revenue (US$ Mn) Comparison by By System Type (2016-2032)
- Figure 66: Western Europe Energy Management Systems Market Market Revenue (US$ Mn) Comparison by By Vertical Component (2016-2032)
- Figure 67: Western Europe Energy Management Systems Market Market Revenue (US$ Mn) Comparison by By Vertical Deployment (2016-2032)
- Figure 68: Western Europe Energy Management Systems Market Market Revenue (US$ Mn) Comparison by By Vertical (2016-2032)
- Figure 69: Western Europe Energy Management Systems Market Market Y-o-Y Growth Rate Comparison by Country (2016-2032)
- Figure 70: Western Europe Energy Management Systems Market Market Y-o-Y Growth Rate Comparison by By System Type (2016-2032)
- Figure 71: Western Europe Energy Management Systems Market Market Y-o-Y Growth Rate Comparison by By Vertical Component (2016-2032)
- Figure 72: Western Europe Energy Management Systems Market Market Y-o-Y Growth Rate Comparison by By Vertical Deployment (2016-2032)
- Figure 73: Western Europe Energy Management Systems Market Market Y-o-Y Growth Rate Comparison by By Vertical (2016-2032)
- Figure 74: Western Europe Energy Management Systems Market Market Share Comparison by Country (2016-2032)
- Figure 75: Western Europe Energy Management Systems Market Market Share Comparison by By System Type (2016-2032)
- Figure 76: Western Europe Energy Management Systems Market Market Share Comparison by By Vertical Component (2016-2032)
- Figure 77: Western Europe Energy Management Systems Market Market Share Comparison by By Vertical Deployment (2016-2032)
- Figure 78: Western Europe Energy Management Systems Market Market Share Comparison by By Vertical (2016-2032)
- Figure 79: Eastern Europe Energy Management Systems Market Revenue (US$ Mn) Market Share by By System Typein 2022
- Figure 80: Eastern Europe Energy Management Systems Market Market Attractiveness Analysis by By System Type, 2016-2032
- Figure 81: Eastern Europe Energy Management Systems Market Revenue (US$ Mn) Market Share by By Vertical Componentin 2022
- Figure 82: Eastern Europe Energy Management Systems Market Market Attractiveness Analysis by By Vertical Component, 2016-2032
- Figure 83: Eastern Europe Energy Management Systems Market Revenue (US$ Mn) Market Share by By Vertical Deployment in 2022
- Figure 84: Eastern Europe Energy Management Systems Market Market Attractiveness Analysis by By Vertical Deployment , 2016-2032
- Figure 85: Eastern Europe Energy Management Systems Market Revenue (US$ Mn) Market Share by By Verticalin 2022
- Figure 86: Eastern Europe Energy Management Systems Market Market Attractiveness Analysis by By Vertical, 2016-2032
- Figure 87: Eastern Europe Energy Management Systems Market Revenue (US$ Mn) Market Share by Country in 2022
- Figure 88: Eastern Europe Energy Management Systems Market Market Attractiveness Analysis by Country, 2016-2032
- Figure 89: Eastern Europe Energy Management Systems Market Market Revenue (US$ Mn) (2016-2032)
- Figure 90: Eastern Europe Energy Management Systems Market Market Revenue (US$ Mn) Comparison by Country (2016-2032)
- Figure 91: Eastern Europe Energy Management Systems Market Market Revenue (US$ Mn) Comparison by By System Type (2016-2032)
- Figure 92: Eastern Europe Energy Management Systems Market Market Revenue (US$ Mn) Comparison by By Vertical Component (2016-2032)
- Figure 93: Eastern Europe Energy Management Systems Market Market Revenue (US$ Mn) Comparison by By Vertical Deployment (2016-2032)
- Figure 94: Eastern Europe Energy Management Systems Market Market Revenue (US$ Mn) Comparison by By Vertical (2016-2032)
- Figure 95: Eastern Europe Energy Management Systems Market Market Y-o-Y Growth Rate Comparison by Country (2016-2032)
- Figure 96: Eastern Europe Energy Management Systems Market Market Y-o-Y Growth Rate Comparison by By System Type (2016-2032)
- Figure 97: Eastern Europe Energy Management Systems Market Market Y-o-Y Growth Rate Comparison by By Vertical Component (2016-2032)
- Figure 98: Eastern Europe Energy Management Systems Market Market Y-o-Y Growth Rate Comparison by By Vertical Deployment (2016-2032)
- Figure 99: Eastern Europe Energy Management Systems Market Market Y-o-Y Growth Rate Comparison by By Vertical (2016-2032)
- Figure 100: Eastern Europe Energy Management Systems Market Market Share Comparison by Country (2016-2032)
- Figure 101: Eastern Europe Energy Management Systems Market Market Share Comparison by By System Type (2016-2032)
- Figure 102: Eastern Europe Energy Management Systems Market Market Share Comparison by By Vertical Component (2016-2032)
- Figure 103: Eastern Europe Energy Management Systems Market Market Share Comparison by By Vertical Deployment (2016-2032)
- Figure 104: Eastern Europe Energy Management Systems Market Market Share Comparison by By Vertical (2016-2032)
- Figure 105: APAC Energy Management Systems Market Revenue (US$ Mn) Market Share by By System Typein 2022
- Figure 106: APAC Energy Management Systems Market Market Attractiveness Analysis by By System Type, 2016-2032
- Figure 107: APAC Energy Management Systems Market Revenue (US$ Mn) Market Share by By Vertical Componentin 2022
- Figure 108: APAC Energy Management Systems Market Market Attractiveness Analysis by By Vertical Component, 2016-2032
- Figure 109: APAC Energy Management Systems Market Revenue (US$ Mn) Market Share by By Vertical Deployment in 2022
- Figure 110: APAC Energy Management Systems Market Market Attractiveness Analysis by By Vertical Deployment , 2016-2032
- Figure 111: APAC Energy Management Systems Market Revenue (US$ Mn) Market Share by By Verticalin 2022
- Figure 112: APAC Energy Management Systems Market Market Attractiveness Analysis by By Vertical, 2016-2032
- Figure 113: APAC Energy Management Systems Market Revenue (US$ Mn) Market Share by Country in 2022
- Figure 114: APAC Energy Management Systems Market Market Attractiveness Analysis by Country, 2016-2032
- Figure 115: APAC Energy Management Systems Market Market Revenue (US$ Mn) (2016-2032)
- Figure 116: APAC Energy Management Systems Market Market Revenue (US$ Mn) Comparison by Country (2016-2032)
- Figure 117: APAC Energy Management Systems Market Market Revenue (US$ Mn) Comparison by By System Type (2016-2032)
- Figure 118: APAC Energy Management Systems Market Market Revenue (US$ Mn) Comparison by By Vertical Component (2016-2032)
- Figure 119: APAC Energy Management Systems Market Market Revenue (US$ Mn) Comparison by By Vertical Deployment (2016-2032)
- Figure 120: APAC Energy Management Systems Market Market Revenue (US$ Mn) Comparison by By Vertical (2016-2032)
- Figure 121: APAC Energy Management Systems Market Market Y-o-Y Growth Rate Comparison by Country (2016-2032)
- Figure 122: APAC Energy Management Systems Market Market Y-o-Y Growth Rate Comparison by By System Type (2016-2032)
- Figure 123: APAC Energy Management Systems Market Market Y-o-Y Growth Rate Comparison by By Vertical Component (2016-2032)
- Figure 124: APAC Energy Management Systems Market Market Y-o-Y Growth Rate Comparison by By Vertical Deployment (2016-2032)
- Figure 125: APAC Energy Management Systems Market Market Y-o-Y Growth Rate Comparison by By Vertical (2016-2032)
- Figure 126: APAC Energy Management Systems Market Market Share Comparison by Country (2016-2032)
- Figure 127: APAC Energy Management Systems Market Market Share Comparison by By System Type (2016-2032)
- Figure 128: APAC Energy Management Systems Market Market Share Comparison by By Vertical Component (2016-2032)
- Figure 129: APAC Energy Management Systems Market Market Share Comparison by By Vertical Deployment (2016-2032)
- Figure 130: APAC Energy Management Systems Market Market Share Comparison by By Vertical (2016-2032)
- Figure 131: Latin America Energy Management Systems Market Revenue (US$ Mn) Market Share by By System Typein 2022
- Figure 132: Latin America Energy Management Systems Market Market Attractiveness Analysis by By System Type, 2016-2032
- Figure 133: Latin America Energy Management Systems Market Revenue (US$ Mn) Market Share by By Vertical Componentin 2022
- Figure 134: Latin America Energy Management Systems Market Market Attractiveness Analysis by By Vertical Component, 2016-2032
- Figure 135: Latin America Energy Management Systems Market Revenue (US$ Mn) Market Share by By Vertical Deployment in 2022
- Figure 136: Latin America Energy Management Systems Market Market Attractiveness Analysis by By Vertical Deployment , 2016-2032
- Figure 137: Latin America Energy Management Systems Market Revenue (US$ Mn) Market Share by By Verticalin 2022
- Figure 138: Latin America Energy Management Systems Market Market Attractiveness Analysis by By Vertical, 2016-2032
- Figure 139: Latin America Energy Management Systems Market Revenue (US$ Mn) Market Share by Country in 2022
- Figure 140: Latin America Energy Management Systems Market Market Attractiveness Analysis by Country, 2016-2032
- Figure 141: Latin America Energy Management Systems Market Market Revenue (US$ Mn) (2016-2032)
- Figure 142: Latin America Energy Management Systems Market Market Revenue (US$ Mn) Comparison by Country (2016-2032)
- Figure 143: Latin America Energy Management Systems Market Market Revenue (US$ Mn) Comparison by By System Type (2016-2032)
- Figure 144: Latin America Energy Management Systems Market Market Revenue (US$ Mn) Comparison by By Vertical Component (2016-2032)
- Figure 145: Latin America Energy Management Systems Market Market Revenue (US$ Mn) Comparison by By Vertical Deployment (2016-2032)
- Figure 146: Latin America Energy Management Systems Market Market Revenue (US$ Mn) Comparison by By Vertical (2016-2032)
- Figure 147: Latin America Energy Management Systems Market Market Y-o-Y Growth Rate Comparison by Country (2016-2032)
- Figure 148: Latin America Energy Management Systems Market Market Y-o-Y Growth Rate Comparison by By System Type (2016-2032)
- Figure 149: Latin America Energy Management Systems Market Market Y-o-Y Growth Rate Comparison by By Vertical Component (2016-2032)
- Figure 150: Latin America Energy Management Systems Market Market Y-o-Y Growth Rate Comparison by By Vertical Deployment (2016-2032)
- Figure 151: Latin America Energy Management Systems Market Market Y-o-Y Growth Rate Comparison by By Vertical (2016-2032)
- Figure 152: Latin America Energy Management Systems Market Market Share Comparison by Country (2016-2032)
- Figure 153: Latin America Energy Management Systems Market Market Share Comparison by By System Type (2016-2032)
- Figure 154: Latin America Energy Management Systems Market Market Share Comparison by By Vertical Component (2016-2032)
- Figure 155: Latin America Energy Management Systems Market Market Share Comparison by By Vertical Deployment (2016-2032)
- Figure 156: Latin America Energy Management Systems Market Market Share Comparison by By Vertical (2016-2032)
- Figure 157: Middle East & Africa Energy Management Systems Market Revenue (US$ Mn) Market Share by By System Typein 2022
- Figure 158: Middle East & Africa Energy Management Systems Market Market Attractiveness Analysis by By System Type, 2016-2032
- Figure 159: Middle East & Africa Energy Management Systems Market Revenue (US$ Mn) Market Share by By Vertical Componentin 2022
- Figure 160: Middle East & Africa Energy Management Systems Market Market Attractiveness Analysis by By Vertical Component, 2016-2032
- Figure 161: Middle East & Africa Energy Management Systems Market Revenue (US$ Mn) Market Share by By Vertical Deployment in 2022
- Figure 162: Middle East & Africa Energy Management Systems Market Market Attractiveness Analysis by By Vertical Deployment , 2016-2032
- Figure 163: Middle East & Africa Energy Management Systems Market Revenue (US$ Mn) Market Share by By Verticalin 2022
- Figure 164: Middle East & Africa Energy Management Systems Market Market Attractiveness Analysis by By Vertical, 2016-2032
- Figure 165: Middle East & Africa Energy Management Systems Market Revenue (US$ Mn) Market Share by Country in 2022
- Figure 166: Middle East & Africa Energy Management Systems Market Market Attractiveness Analysis by Country, 2016-2032
- Figure 167: Middle East & Africa Energy Management Systems Market Market Revenue (US$ Mn) (2016-2032)
- Figure 168: Middle East & Africa Energy Management Systems Market Market Revenue (US$ Mn) Comparison by Country (2016-2032)
- Figure 169: Middle East & Africa Energy Management Systems Market Market Revenue (US$ Mn) Comparison by By System Type (2016-2032)
- Figure 170: Middle East & Africa Energy Management Systems Market Market Revenue (US$ Mn) Comparison by By Vertical Component (2016-2032)
- Figure 171: Middle East & Africa Energy Management Systems Market Market Revenue (US$ Mn) Comparison by By Vertical Deployment (2016-2032)
- Figure 172: Middle East & Africa Energy Management Systems Market Market Revenue (US$ Mn) Comparison by By Vertical (2016-2032)
- Figure 173: Middle East & Africa Energy Management Systems Market Market Y-o-Y Growth Rate Comparison by Country (2016-2032)
- Figure 174: Middle East & Africa Energy Management Systems Market Market Y-o-Y Growth Rate Comparison by By System Type (2016-2032)
- Figure 175: Middle East & Africa Energy Management Systems Market Market Y-o-Y Growth Rate Comparison by By Vertical Component (2016-2032)
- Figure 176: Middle East & Africa Energy Management Systems Market Market Y-o-Y Growth Rate Comparison by By Vertical Deployment (2016-2032)
- Figure 177: Middle East & Africa Energy Management Systems Market Market Y-o-Y Growth Rate Comparison by By Vertical (2016-2032)
- Figure 178: Middle East & Africa Energy Management Systems Market Market Share Comparison by Country (2016-2032)
- Figure 179: Middle East & Africa Energy Management Systems Market Market Share Comparison by By System Type (2016-2032)
- Figure 180: Middle East & Africa Energy Management Systems Market Market Share Comparison by By Vertical Component (2016-2032)
- Figure 181: Middle East & Africa Energy Management Systems Market Market Share Comparison by By Vertical Deployment (2016-2032)
- Figure 182: Middle East & Africa Energy Management Systems Market Market Share Comparison by By Vertical (2016-2032)
"
- List of Tables
- "
- Table 1: Global Energy Management Systems Market Market Comparison by By System Type (2016-2032)
- Table 2: Global Energy Management Systems Market Market Comparison by By Vertical Component (2016-2032)
- Table 3: Global Energy Management Systems Market Market Comparison by By Vertical Deployment (2016-2032)
- Table 4: Global Energy Management Systems Market Market Comparison by By Vertical (2016-2032)
- Table 5: Global Energy Management Systems Market Revenue (US$ Mn) Comparison by Region (2016-2032)
- Table 6: Global Energy Management Systems Market Market Revenue (US$ Mn) (2016-2032)
- Table 7: Global Energy Management Systems Market Market Revenue (US$ Mn) Comparison by Region (2016-2032)
- Table 8: Global Energy Management Systems Market Market Revenue (US$ Mn) Comparison by By System Type (2016-2032)
- Table 9: Global Energy Management Systems Market Market Revenue (US$ Mn) Comparison by By Vertical Component (2016-2032)
- Table 10: Global Energy Management Systems Market Market Revenue (US$ Mn) Comparison by By Vertical Deployment (2016-2032)
- Table 11: Global Energy Management Systems Market Market Revenue (US$ Mn) Comparison by By Vertical (2016-2032)
- Table 12: Global Energy Management Systems Market Market Y-o-Y Growth Rate Comparison by Region (2016-2032)
- Table 13: Global Energy Management Systems Market Market Y-o-Y Growth Rate Comparison by By System Type (2016-2032)
- Table 14: Global Energy Management Systems Market Market Y-o-Y Growth Rate Comparison by By Vertical Component (2016-2032)
- Table 15: Global Energy Management Systems Market Market Y-o-Y Growth Rate Comparison by By Vertical Deployment (2016-2032)
- Table 16: Global Energy Management Systems Market Market Y-o-Y Growth Rate Comparison by By Vertical (2016-2032)
- Table 17: Global Energy Management Systems Market Market Share Comparison by Region (2016-2032)
- Table 18: Global Energy Management Systems Market Market Share Comparison by By System Type (2016-2032)
- Table 19: Global Energy Management Systems Market Market Share Comparison by By Vertical Component (2016-2032)
- Table 20: Global Energy Management Systems Market Market Share Comparison by By Vertical Deployment (2016-2032)
- Table 21: Global Energy Management Systems Market Market Share Comparison by By Vertical (2016-2032)
- Table 22: North America Energy Management Systems Market Market Comparison by By Vertical Component (2016-2032)
- Table 23: North America Energy Management Systems Market Market Comparison by By Vertical Deployment (2016-2032)
- Table 24: North America Energy Management Systems Market Market Comparison by By Vertical (2016-2032)
- Table 25: North America Energy Management Systems Market Revenue (US$ Mn) Comparison by Country (2016-2032)
- Table 26: North America Energy Management Systems Market Market Revenue (US$ Mn) (2016-2032)
- Table 27: North America Energy Management Systems Market Market Revenue (US$ Mn) Comparison by Country (2016-2032)
- Table 28: North America Energy Management Systems Market Market Revenue (US$ Mn) Comparison by By System Type (2016-2032)
- Table 29: North America Energy Management Systems Market Market Revenue (US$ Mn) Comparison by By Vertical Component (2016-2032)
- Table 30: North America Energy Management Systems Market Market Revenue (US$ Mn) Comparison by By Vertical Deployment (2016-2032)
- Table 31: North America Energy Management Systems Market Market Revenue (US$ Mn) Comparison by By Vertical (2016-2032)
- Table 32: North America Energy Management Systems Market Market Y-o-Y Growth Rate Comparison by Country (2016-2032)
- Table 33: North America Energy Management Systems Market Market Y-o-Y Growth Rate Comparison by By System Type (2016-2032)
- Table 34: North America Energy Management Systems Market Market Y-o-Y Growth Rate Comparison by By Vertical Component (2016-2032)
- Table 35: North America Energy Management Systems Market Market Y-o-Y Growth Rate Comparison by By Vertical Deployment (2016-2032)
- Table 36: North America Energy Management Systems Market Market Y-o-Y Growth Rate Comparison by By Vertical (2016-2032)
- Table 37: North America Energy Management Systems Market Market Share Comparison by Country (2016-2032)
- Table 38: North America Energy Management Systems Market Market Share Comparison by By System Type (2016-2032)
- Table 39: North America Energy Management Systems Market Market Share Comparison by By Vertical Component (2016-2032)
- Table 40: North America Energy Management Systems Market Market Share Comparison by By Vertical Deployment (2016-2032)
- Table 41: North America Energy Management Systems Market Market Share Comparison by By Vertical (2016-2032)
- Table 42: Western Europe Energy Management Systems Market Market Comparison by By System Type (2016-2032)
- Table 43: Western Europe Energy Management Systems Market Market Comparison by By Vertical Component (2016-2032)
- Table 44: Western Europe Energy Management Systems Market Market Comparison by By Vertical Deployment (2016-2032)
- Table 45: Western Europe Energy Management Systems Market Market Comparison by By Vertical (2016-2032)
- Table 46: Western Europe Energy Management Systems Market Revenue (US$ Mn) Comparison by Country (2016-2032)
- Table 47: Western Europe Energy Management Systems Market Market Revenue (US$ Mn) (2016-2032)
- Table 48: Western Europe Energy Management Systems Market Market Revenue (US$ Mn) Comparison by Country (2016-2032)
- Table 49: Western Europe Energy Management Systems Market Market Revenue (US$ Mn) Comparison by By System Type (2016-2032)
- Table 50: Western Europe Energy Management Systems Market Market Revenue (US$ Mn) Comparison by By Vertical Component (2016-2032)
- Table 51: Western Europe Energy Management Systems Market Market Revenue (US$ Mn) Comparison by By Vertical Deployment (2016-2032)
- Table 52: Western Europe Energy Management Systems Market Market Revenue (US$ Mn) Comparison by By Vertical (2016-2032)
- Table 53: Western Europe Energy Management Systems Market Market Y-o-Y Growth Rate Comparison by Country (2016-2032)
- Table 54: Western Europe Energy Management Systems Market Market Y-o-Y Growth Rate Comparison by By System Type (2016-2032)
- Table 55: Western Europe Energy Management Systems Market Market Y-o-Y Growth Rate Comparison by By Vertical Component (2016-2032)
- Table 56: Western Europe Energy Management Systems Market Market Y-o-Y Growth Rate Comparison by By Vertical Deployment (2016-2032)
- Table 57: Western Europe Energy Management Systems Market Market Y-o-Y Growth Rate Comparison by By Vertical (2016-2032)
- Table 58: Western Europe Energy Management Systems Market Market Share Comparison by Country (2016-2032)
- Table 59: Western Europe Energy Management Systems Market Market Share Comparison by By System Type (2016-2032)
- Table 60: Western Europe Energy Management Systems Market Market Share Comparison by By Vertical Component (2016-2032)
- Table 61: Western Europe Energy Management Systems Market Market Share Comparison by By Vertical Deployment (2016-2032)
- Table 62: Western Europe Energy Management Systems Market Market Share Comparison by By Vertical (2016-2032)
- Table 63: Eastern Europe Energy Management Systems Market Market Comparison by By System Type (2016-2032)
- Table 64: Eastern Europe Energy Management Systems Market Market Comparison by By Vertical Component (2016-2032)
- Table 65: Eastern Europe Energy Management Systems Market Market Comparison by By Vertical Deployment (2016-2032)
- Table 66: Eastern Europe Energy Management Systems Market Market Comparison by By Vertical (2016-2032)
- Table 67: Eastern Europe Energy Management Systems Market Revenue (US$ Mn) Comparison by Country (2016-2032)
- Table 68: Eastern Europe Energy Management Systems Market Market Revenue (US$ Mn) (2016-2032)
- Table 69: Eastern Europe Energy Management Systems Market Market Revenue (US$ Mn) Comparison by Country (2016-2032)
- Table 70: Eastern Europe Energy Management Systems Market Market Revenue (US$ Mn) Comparison by By System Type (2016-2032)
- Table 71: Eastern Europe Energy Management Systems Market Market Revenue (US$ Mn) Comparison by By Vertical Component (2016-2032)
- Table 72: Eastern Europe Energy Management Systems Market Market Revenue (US$ Mn) Comparison by By Vertical Deployment (2016-2032)
- Table 73: Eastern Europe Energy Management Systems Market Market Revenue (US$ Mn) Comparison by By Vertical (2016-2032)
- Table 74: Eastern Europe Energy Management Systems Market Market Y-o-Y Growth Rate Comparison by Country (2016-2032)
- Table 75: Eastern Europe Energy Management Systems Market Market Y-o-Y Growth Rate Comparison by By System Type (2016-2032)
- Table 76: Eastern Europe Energy Management Systems Market Market Y-o-Y Growth Rate Comparison by By Vertical Component (2016-2032)
- Table 77: Eastern Europe Energy Management Systems Market Market Y-o-Y Growth Rate Comparison by By Vertical Deployment (2016-2032)
- Table 78: Eastern Europe Energy Management Systems Market Market Y-o-Y Growth Rate Comparison by By Vertical (2016-2032)
- Table 79: Eastern Europe Energy Management Systems Market Market Share Comparison by Country (2016-2032)
- Table 80: Eastern Europe Energy Management Systems Market Market Share Comparison by By System Type (2016-2032)
- Table 81: Eastern Europe Energy Management Systems Market Market Share Comparison by By Vertical Component (2016-2032)
- Table 82: Eastern Europe Energy Management Systems Market Market Share Comparison by By Vertical Deployment (2016-2032)
- Table 83: Eastern Europe Energy Management Systems Market Market Share Comparison by By Vertical (2016-2032)
- Table 84: APAC Energy Management Systems Market Market Comparison by By System Type (2016-2032)
- Table 85: APAC Energy Management Systems Market Market Comparison by By Vertical Component (2016-2032)
- Table 86: APAC Energy Management Systems Market Market Comparison by By Vertical Deployment (2016-2032)
- Table 87: APAC Energy Management Systems Market Market Comparison by By Vertical (2016-2032)
- Table 88: APAC Energy Management Systems Market Revenue (US$ Mn) Comparison by Country (2016-2032)
- Table 89: APAC Energy Management Systems Market Market Revenue (US$ Mn) (2016-2032)
- Table 90: APAC Energy Management Systems Market Market Revenue (US$ Mn) Comparison by Country (2016-2032)
- Table 91: APAC Energy Management Systems Market Market Revenue (US$ Mn) Comparison by By System Type (2016-2032)
- Table 92: APAC Energy Management Systems Market Market Revenue (US$ Mn) Comparison by By Vertical Component (2016-2032)
- Table 93: APAC Energy Management Systems Market Market Revenue (US$ Mn) Comparison by By Vertical Deployment (2016-2032)
- Table 94: APAC Energy Management Systems Market Market Revenue (US$ Mn) Comparison by By Vertical (2016-2032)
- Table 95: APAC Energy Management Systems Market Market Y-o-Y Growth Rate Comparison by Country (2016-2032)
- Table 96: APAC Energy Management Systems Market Market Y-o-Y Growth Rate Comparison by By System Type (2016-2032)
- Table 97: APAC Energy Management Systems Market Market Y-o-Y Growth Rate Comparison by By Vertical Component (2016-2032)
- Table 98: APAC Energy Management Systems Market Market Y-o-Y Growth Rate Comparison by By Vertical Deployment (2016-2032)
- Table 99: APAC Energy Management Systems Market Market Y-o-Y Growth Rate Comparison by By Vertical (2016-2032)
- Table 100: APAC Energy Management Systems Market Market Share Comparison by Country (2016-2032)
- Table 101: APAC Energy Management Systems Market Market Share Comparison by By System Type (2016-2032)
- Table 102: APAC Energy Management Systems Market Market Share Comparison by By Vertical Component (2016-2032)
- Table 103: APAC Energy Management Systems Market Market Share Comparison by By Vertical Deployment (2016-2032)
- Table 104: APAC Energy Management Systems Market Market Share Comparison by By Vertical (2016-2032)
- Table 105: Latin America Energy Management Systems Market Market Comparison by By System Type (2016-2032)
- Table 106: Latin America Energy Management Systems Market Market Comparison by By Vertical Component (2016-2032)
- Table 107: Latin America Energy Management Systems Market Market Comparison by By Vertical Deployment (2016-2032)
- Table 108: Latin America Energy Management Systems Market Market Comparison by By Vertical (2016-2032)
- Table 109: Latin America Energy Management Systems Market Revenue (US$ Mn) Comparison by Country (2016-2032)
- Table 110: Latin America Energy Management Systems Market Market Revenue (US$ Mn) (2016-2032)
- Table 111: Latin America Energy Management Systems Market Market Revenue (US$ Mn) Comparison by Country (2016-2032)
- Table 112: Latin America Energy Management Systems Market Market Revenue (US$ Mn) Comparison by By System Type (2016-2032)
- Table 113: Latin America Energy Management Systems Market Market Revenue (US$ Mn) Comparison by By Vertical Component (2016-2032)
- Table 114: Latin America Energy Management Systems Market Market Revenue (US$ Mn) Comparison by By Vertical Deployment (2016-2032)
- Table 115: Latin America Energy Management Systems Market Market Revenue (US$ Mn) Comparison by By Vertical (2016-2032)
- Table 116: Latin America Energy Management Systems Market Market Y-o-Y Growth Rate Comparison by Country (2016-2032)
- Table 117: Latin America Energy Management Systems Market Market Y-o-Y Growth Rate Comparison by By System Type (2016-2032)
- Table 118: Latin America Energy Management Systems Market Market Y-o-Y Growth Rate Comparison by By Vertical Component (2016-2032)
- Table 119: Latin America Energy Management Systems Market Market Y-o-Y Growth Rate Comparison by By Vertical Deployment (2016-2032)
- Table 120: Latin America Energy Management Systems Market Market Y-o-Y Growth Rate Comparison by By Vertical (2016-2032)
- Table 121: Latin America Energy Management Systems Market Market Share Comparison by Country (2016-2032)
- Table 122: Latin America Energy Management Systems Market Market Share Comparison by By System Type (2016-2032)
- Table 123: Latin America Energy Management Systems Market Market Share Comparison by By Vertical Component (2016-2032)
- Table 124: Latin America Energy Management Systems Market Market Share Comparison by By Vertical Deployment (2016-2032)
- Table 125: Latin America Energy Management Systems Market Market Share Comparison by By Vertical (2016-2032)
- Table 126: Middle East & Africa Energy Management Systems Market Market Comparison by By System Type (2016-2032)
- Table 127: Middle East & Africa Energy Management Systems Market Market Comparison by By Vertical Component (2016-2032)
- Table 128: Middle East & Africa Energy Management Systems Market Market Comparison by By Vertical Deployment (2016-2032)
- Table 129: Middle East & Africa Energy Management Systems Market Market Comparison by By Vertical (2016-2032)
- Table 130: Middle East & Africa Energy Management Systems Market Revenue (US$ Mn) Comparison by Country (2016-2032)
- Table 131: Middle East & Africa Energy Management Systems Market Market Revenue (US$ Mn) (2016-2032)
- Table 132: Middle East & Africa Energy Management Systems Market Market Revenue (US$ Mn) Comparison by Country (2016-2032)
- Table 133: Middle East & Africa Energy Management Systems Market Market Revenue (US$ Mn) Comparison by By System Type (2016-2032)
- Table 134: Middle East & Africa Energy Management Systems Market Market Revenue (US$ Mn) Comparison by By Vertical Component (2016-2032)
- Table 135: Middle East & Africa Energy Management Systems Market Market Revenue (US$ Mn) Comparison by By Vertical Deployment (2016-2032)
- Table 136: Middle East & Africa Energy Management Systems Market Market Revenue (US$ Mn) Comparison by By Vertical (2016-2032)
- Table 137: Middle East & Africa Energy Management Systems Market Market Y-o-Y Growth Rate Comparison by Country (2016-2032)
- Table 138: Middle East & Africa Energy Management Systems Market Market Y-o-Y Growth Rate Comparison by By System Type (2016-2032)
- Table 139: Middle East & Africa Energy Management Systems Market Market Y-o-Y Growth Rate Comparison by By Vertical Component (2016-2032)
- Table 140: Middle East & Africa Energy Management Systems Market Market Y-o-Y Growth Rate Comparison by By Vertical Deployment (2016-2032)
- Table 141: Middle East & Africa Energy Management Systems Market Market Y-o-Y Growth Rate Comparison by By Vertical (2016-2032)
- Table 142: Middle East & Africa Energy Management Systems Market Market Share Comparison by Country (2016-2032)
- Table 143: Middle East & Africa Energy Management Systems Market Market Share Comparison by By System Type (2016-2032)
- Table 144: Middle East & Africa Energy Management Systems Market Market Share Comparison by By Vertical Component (2016-2032)
- Table 145: Middle East & Africa Energy Management Systems Market Market Share Comparison by By Vertical Deployment (2016-2032)
- Table 146: Middle East & Africa Energy Management Systems Market Market Share Comparison by By Vertical (2016-2032)
- 1. Executive Summary
-
- Schneider Electric SE
- Honeywell International Inc.
- Siemens AG
- Johnson Controls, Inc.
- C3.ai, Inc.
- GridPoint
- General Electric
- ABB
- International Business Machines Corporation
- Cisco Systems, Inc.
Our Clients


View Our Licence Options
