Dried Fruit Market By Type(Raisins, Apricots, Figs, Dates, Berries, Others), By Application(Bakery and Confectionery, Dairy and Frozen Desserts, Breakfast Cereals,Beverages, Sweet and Savory Snacks, Others), By Region And Companies - Industry Segment Outlook, Market Assessment, Competition Scenario, Trends, And Forecast 2024-2033
-
43320
-
Feb 2024
-
179
-


-
This report was compiled by Shreyas Rokade Shreyas Rokade is a seasoned Research Analyst with CMFE, bringing extensive expertise in market research and consulting, with a strong background in Chemical Engineering. Correspondence Team Lead-CMFE Linkedin | Detailed Market research Methodology Our methodology involves a mix of primary research, including interviews with leading mental health experts, and secondary research from reputable medical journals and databases. View Detailed Methodology Page
-
Quick Navigation
Report Overview
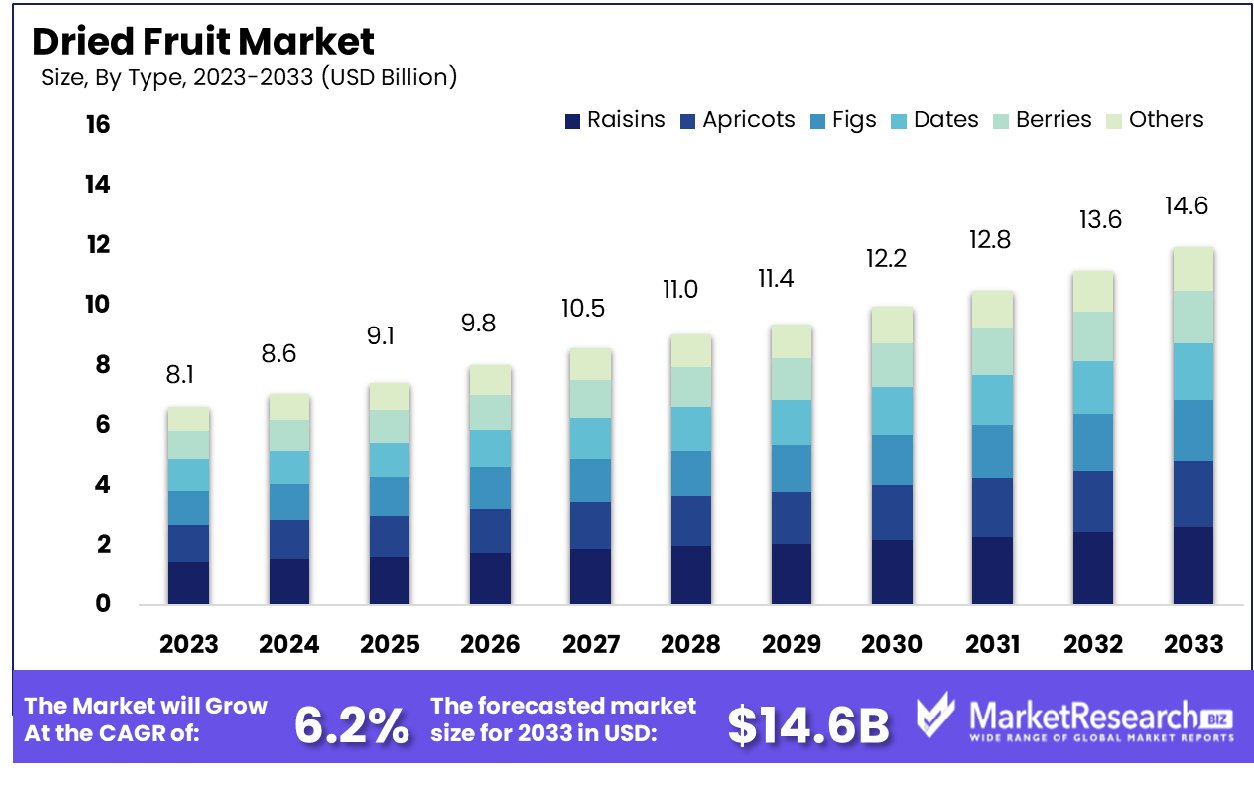
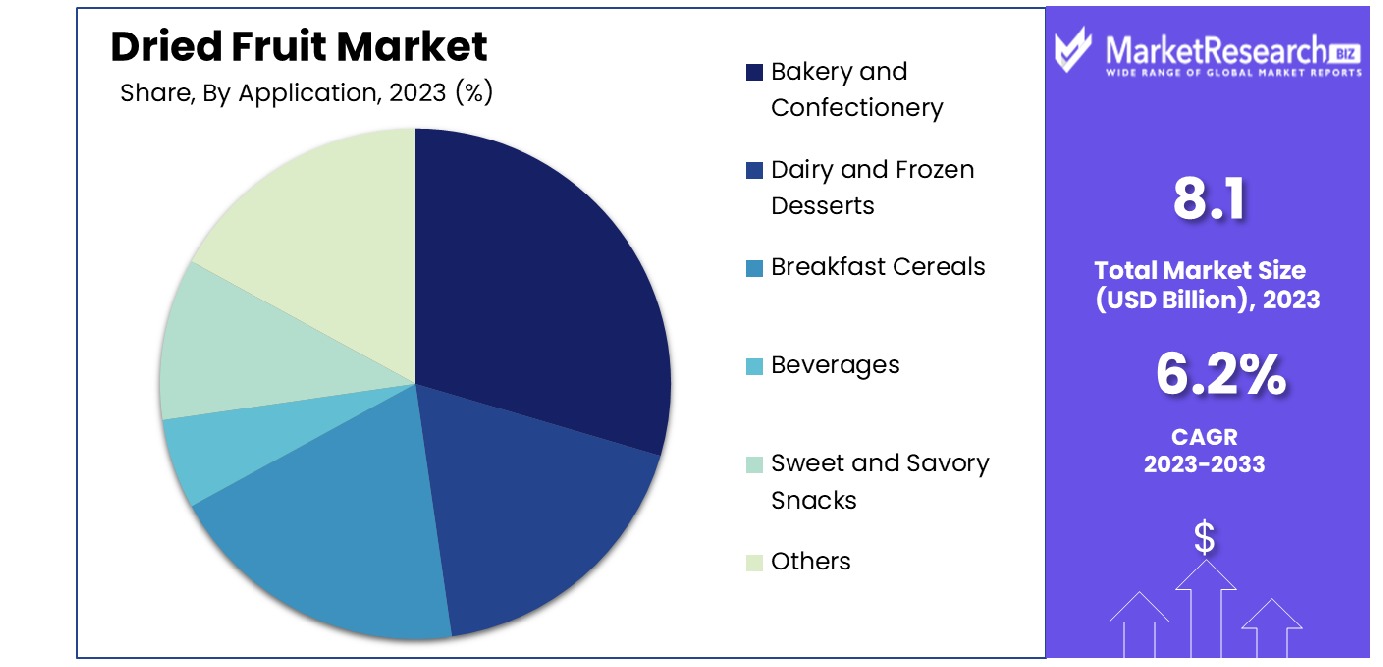
The dried fruit market was valued at USD 8.1 billion in 2023. It is expected to reach USD 14.6 billion by 2033, with a CAGR of 6.2% during the forecast period from 2024 to 2033.
The surge in consumer preferences and health consciousness are some of the key driving factors for the dried fruit market. Dried fruit is defined as the fruit that has almost all water removed through the drying techniques. This method lengthens the shelf life which makes it more convenient and delightful to eat.
These dried fruits are very light and have a crispy texture with concentrated fruit flavor. The freeze-dried fruits preserve the fruit pieces accurately and intact. As per the FDA, the freezing of dried fruits is called lyophilization, which is a technique of removing water from the fruits after it is frozen and placed under a vacuum, which permits the ice to change directly from solid state to vapor without going through a liquid phase. Freeze-dried fruits can be used in several ways as dehydrated fruits. These foods are rich in fiber and antioxidants making them an ideal choice for consumers who are seeking a healthy lifestyle.
According to a report published by Nutfruit, the world dried fruit production has witnessed positive growth in the last six seasons by producing 1.3 million metric tonnes. It was 3.1 million metric tonnes in total in 2022/2023. Over the last few decades, dried fruits have been nearly and mostly produced in middle and high-income countries. While dried fruit production tended to be cultivated in middle-income countries by 56,982 million metric tonnes per year on average, it also remained steady in high-income regions. The USA provides 76% of the world’s almond crop in 2022/2023 and it continues to hold its position as the supply leader. Turkiye is the leading producer by 24% of production, followed by China (14%), Iran (14%), USA, and India by 13% and 14% respectively.
Consumers are getting more health conscious due to which the top manufacturers in the food and beverages industries are using dried fruits in their food service industry products to meet the consumer’s demand. There are several benefits of consuming dried fruit products such as controlling and regulating diabetes, augmenting nutrient intake, enhances digestive health and immunity. It also helps in weight loss, and healthy pregnancies and keep the skin healthy and glowing. The demand for dehydrated fruit products will increase due to their requirement in day-to-day food activities that maintain a healthy lifestyle as well as it will help in market expansion in the coming years.
Key Takeaways
- Market Growth: Dried fruit market was valued at USD 8.1 billion in 2023. It is expected to reach USD 14.6 billion by 2033, with a CAGR of 6.2% during the forecast period from 2024 to 2033.
- By Type: Raisins dominate the market by type, commanding a significant share due to their versatile usage.
- By Application: In bakery and confectionery applications, raisins continue to dominate, maintaining a strong presence.
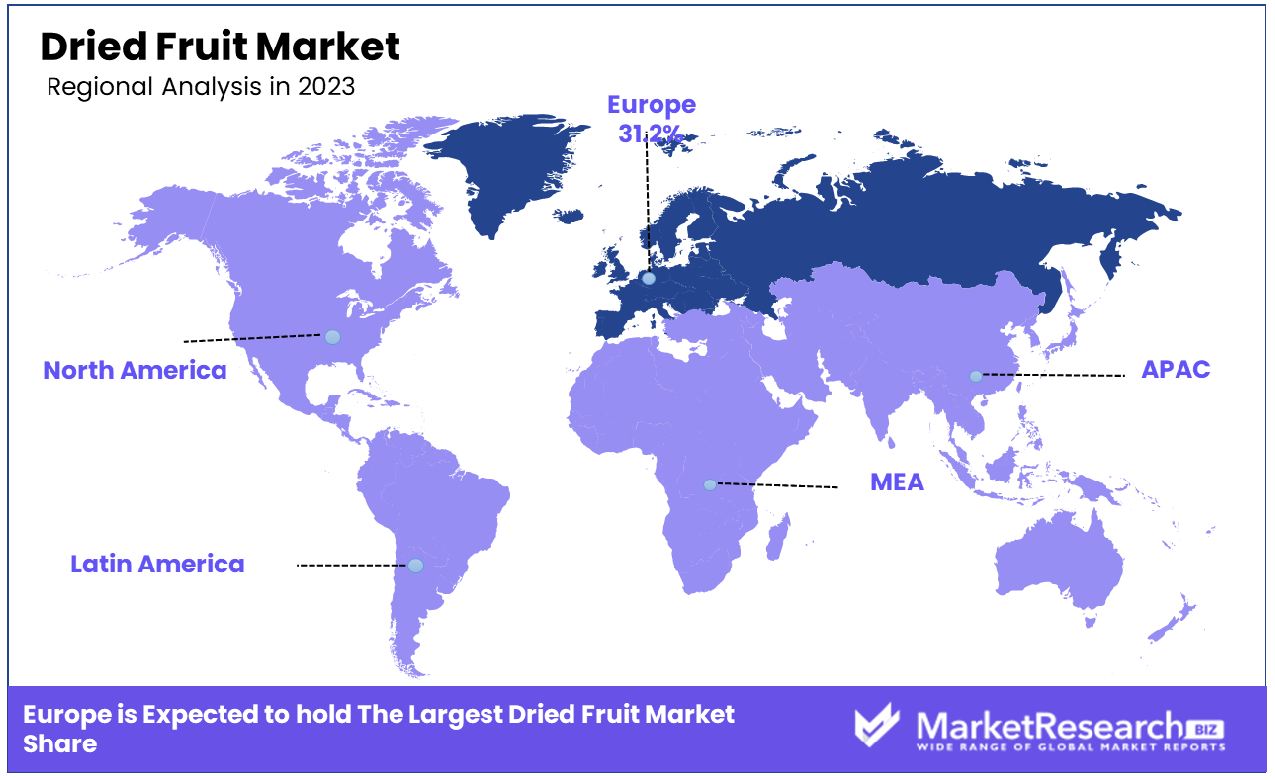
- Regional Dominance: Europe holds a dominant 31.2% market share in the dried fruit industry, showcasing its substantial influence.
- Growth Opportunity: The premiumization trend drives growth in the dried fruit market, offering exotic varieties. Value-added ingredients elevate market appeal, meeting the demand for healthier snacks.
Driving factors
Health Consciousness Propels Dried Fruit Market Growth
The increasing health consciousness among consumers significantly drives the dried fruit market's expansion. Dried fruits offer a dense concentration of fiber, vitamins, and minerals — up to 3.5 times that of their fresh counterparts, making them a nutritious snack alternative. Their high fiber and nutrient content align with the growing consumer preference for healthier, less processed food options. Marketing initiatives like branding raisins as "nature's candy" exemplify the industry's approach to positioning dried fruits as wholesome, healthful choices. This trend taps into the broader movement towards wellness and nutritional content-focused diets.
Convenience Fuels Dried Fruit Market Expansion
Dried fruits' convenience factor is a pivotal driver of market growth. Their lightweight, non-perishable nature makes them an ideal on-the-go snack for increasingly busy lifestyles. The incorporation of dried fruits into trail mixes, combining them with edible nuts industry and seeds, showcases their appeal as a portable, convenient food option. This adaptability to modern, fast-paced living conditions underpins their rising popularity and market demand.
Innovation Broadens Dried Fruit Market Reach
Innovation in product development and packaging is expanding the dried fruit market. New product formats like dehydrated food chips and dried fruit-nut mixes cater to diverse consumer tastes and preferences. Additionally, advancements in packaging, such as vacuum-sealed pouches, enhance product shelf life and appeal. The investment in research and development, exemplified by initiatives like the Almond Centre of Excellence in Loxton, South Australia, illustrates the industry's commitment to adopting best practices and sustainable methods. These innovations not only diversify product offerings but also resonate with evolving consumer demands for variety and sustainability.
Restraining Factors
High Pricing Limits Dried Fruit Accessibility
The dried fruit market processing involved in drying fruits adds to the overall cost, making them less affordable for lower-income consumers. For example, dried apricots and figs are often perceived as luxury items due to their high price points. This price barrier restricts the market’s expansion, particularly in segments where cost sensitivity is a decisive factor for consumers. The market's growth is thus constrained by its limited appeal to a broader, more price-conscious customer base.
Seasonal Variations Affect Dried Fruit Supply
Fluctuations in fresh fruit availability caused by seasonal changes directly affect the supply chain for dried fruits. This seasonality leads to volatility in both the production and prices of dried fruits. For instance, the availability of dried mangoes decreases during monsoon seasons. A notable example is the adverse impact of wet summer conditions in Australia, which led to warnings of potential shortages in dried fruits like apricots and pears. Such seasonal dependencies create challenges in maintaining a consistent supply and can impede market growth.
By Type Analysis
Raisins Dominate The Market By Type Due To Consumer Preference.
In the dried fruit market, Raisins hold a dominant position. This segment's leadership can be attributed to their widespread availability, affordability, and versatility in various culinary applications. Raisins, dried grapes, are known for their natural sweetness and are used extensively in bakery industry products, cereal bars, healthy snacks, and even savory dishes. Their long shelf life and nutritional value, including high fiber content and essential minerals, make them a popular choice among consumers. The global production of raisins is significant, with countries like the USA, Turkey, and Iran being key producers, ensuring a steady supply in the market.
Other types like dried Apricots, Figs, Dates, Berries, and Others also contribute significantly to the market. Dried apricots and figs are valued for their distinct flavors and health benefits, while dates are popular in Middle Eastern cuisine. Dried berries, including cranberries and blueberries, are gaining popularity for their antioxidant properties.
By Application Analysis
In Bakery And Confectionery Applications, Raisins Remain Dominant.
In terms of application, Bakery and Confectionery is the leading segment in the dried fruit market. Dried fruits, especially raisins, are a staple ingredient in various bakery industry products like cakes, cookies, bread, and pastries. Their natural sweetness, texture, and ability to retain moisture make them ideal for baked goods. Confectioneries also utilize dried fruits in chocolates, candies, and other sweet treats, adding a healthy and flavorful dimension.
Dairy and Frozen Desserts, Breakfast Cereals, Beverage manufacturers, Sweet and Savory Snacks, and Others also see substantial use of dried fruits. When it comes to dairy items, dried fruits add the taste and consistency of yogurt as well as Ice creams.
They are a common addition to breakfast cereals, providing natural sweetness and nutritional benefits. Beverage manufacturers, including teas and health drinks, incorporate dried fruits for flavoring. In snacks, they offer a healthy, convenient option. Although dried fruits come in a variety of types and find uses in numerous applications, their crucial role in confectionery and bakery products underscores their predominant position in the market.
Key Market Segments
By Type
- Raisins
- Apricots
- Figs
- Dates
- Berries
- Others
By Application
- Bakery and Confectionery
- Dairy and Frozen Desserts
- Breakfast Cereals
- Beverages
- Sweet and Savory Snacks
- Others
Growth Opportunity
Premiumization Elevating the Dried Fruit Market with Exotic Varieties
The key trend of premiumization in the dried fruit market offers substantial growth opportunities. Consumers are increasingly seeking unique, high-quality products that offer a sense of indulgence. Introducing exotic dried fruit varieties, such as dragonfruit chips, can tap into this demand for premium options. Companies like Patanjali Foods are capitalizing on this trend, aiming to significantly increase their turnover from premium products over the next five years. By focusing on high-end products, dried fruit brands can cater to a more affluent consumer base, driving both market growth and brand differentiation.
Value-added Ingredients Enhancing Market Appeal with Dried Fruits
Incorporating dried fruits market growth as value-added ingredients in products such as trail mixes, granola clusters, and snack bars presents a lucrative strong growth avenue for the dried fruit market. This integration offers innovation opportunities for food manufacturers, enabling them to enhance the nutritional value and flavor profiles of their products. As consumers increasingly seek convenient yet health-conscious snack options, the inclusion of dried fruits in these products meets this demand. This strategy not only expands the application of dried fruits but also aligns with evolving consumer preferences toward healthier snacking options.
Latest Trends
Circular Economy Adoption
Industries increasingly embrace circular economy principles, prioritizing recyclable materials, minimalistic designs, and reusable packaging. This shift aims to minimize key trends of waste and environmental impact throughout the product lifecycle, aligning with consumer demand for eco-friendly solutions market trends.
Bio-Based Materials Surge
The utilization of bio-based materials, such as plant-derived plastics and compostable packaging, is gaining momentum. Driven by consumer awareness and regulatory pressures, businesses seek alternatives to traditional petroleum-based plastics, fostering innovation in sustainable packaging solutions. This trend reflects a growing commitment to environmental stewardship and resource efficiency.
Regional Analysis
Europe Dominates with 31.2% Market Share in the Dried Fruit Industry
Europe’s command over 31.2% of the dried fruit market can be primarily linked to the region's robust distribution channels and the high consumer preference for healthy snacks. European consumers are increasingly leaning towards healthier, convenient eating options, and dried fruits offer a perfect blend of nutrition and convenience. Furthermore, Europe's stringent quality standards ensure premium quality products, bolstering consumer trust and market growth. Also, the growing vegan and vegetarian population in Europe contributes significantly to the demand for plant-based, nutrient-rich food options like dried fruits.
The region is witnessing a surge in organic dried fruit consumption, driven by the rising awareness about the benefits of organic farming practices and chemical-free products. Additionally, innovative packaging and marketing strategies by key players in the region are enhancing product visibility and appeal. The market is also impacted by Europe’s strategic geographical location, which facilitates easy importation of various dried fruits from around the world, thus enriching the product variety available to consumers.
North America's Stance in the Dried Fruit Market
Within North America, the dried fruit market is driven by increasing awareness among consumers of the health benefits of dried fruits. There's a growing trend of incorporating dried fruits into various diets and wellness routines. The market is also supported by strong retail distribution channels and aggressive marketing strategies.
Asia Pacific's Role in the Dried Fruit Market
The market for dried fruits in Asia Pacific is growing because of the growing awareness of health among consumers, as well as access to a broad variety of dried fruit from the region. The market benefits from the traditional usage of dried fruits in local cuisines and as festive offerings, alongside their emerging use as a convenient snack option.
Key Regions and Countries
North America
- The US
- Canada
- Rest of North America
Europe
- Germany
- France
- The UK
- Spain
- Netherlands
- Russia
- Italy
- Rest of Europe
Asia-Pacific
- China
- Japan
- Singapore
- Thailand
- South Korea
- Vietnam
- India
- New Zealand
- Rest of Asia Pacific
Latin America
- Mexico
- Brazil
- Rest of Latin America
Middle East & Africa
- Saudi Arabia
- South Africa
- UAE
- Rest of Middle East & Africa
Key Players Analysis
The market for dried fruits is a growing and interconnected sector,major players. Namrong Foodstuff Co., Ltd, Qingdao Kington Produce Co., Ltd, and Shanxin Exxon Trading Co., Ltd, based in China, capitalize on the country's vast agricultural resources and advanced processing technologies. Their strategic positioning in one of the world’s largest markets for dried fruits provides them with a significant competitive edge.
AGRANA Beteiligungs-AG and Dohler GmbH, with their European origins, focus on innovation in food processing and a strong commitment to quality, catering to a health-conscious consumer base. Their extensive product ranges and sustainable practices enable them to maintain a strong market presence in Europe and beyond.
Companies like Agthia Group PJSC and Geobres S.A. emphasize regional strengths and cultural preferences in their product offerings. Their strategic positioning allows them to effectively cater to specific regional tastes and demands.
Market Key Players
- Namrong Foodstuff Co., Ltd (China)
- Qingdao Kington Produce Co., Ltd (China)
- Shanxin Exxon Trading Co., Ltd (China)
- AGRANA Beteiligungs-AG (Austria)
- Agthia Group PJSC (UAE)
- Angas Park Fruit Co. (Australia)
- Archer Daniels Midland Company (USA)
- Bergin Fruit and Nut Co. Inc. (USA)
- Berrifine A/S (Denmark)
- Chaucer Foods Ltd (UK)
- Dohler GmbH (Germany)
- European Freeze Dry (UK)
- Farmley by Connedit Business Solutions Private Limited (India)
- FutureCeuticals, Inc. (USA)
- Geobres S.A. (Greece)
Recent Development
- In December 2023, General Mills plans to expand its snack bar line in 2024, introducing new products across popular brands like Nature Valley and Cocoa Puffs, including protein smoothie bars, soft-baked muffin bars, and savory nut crunch options.
- In November 2023, Naturals, the renowned Indian artisanal ice cream brand, introduces the limited-edition Royal Dry Fruit ice cream for Diwali, featuring apricots, cashews, prunes, and chocolate chunks blended with traditional flavors like Kesar, milk, and sugar.
- In August 2023, Pet Nutrition Meals, LLC unveiled its flagship brand, NAAVI, at SUPERZOO 2023. NAAVI offers innovative dog diets featuring slow-roasted proteins, air-dried fruits industry, ancient grains, and air-puffed probiotic crisps, providing flexibility and nutrition for pet owners.
Report Scope
Report Features Description Market Value (2023) USD 8.1 Billion Forecast Revenue (2033) USD 14.6 Billion CAGR (2024-2032) 6.2% Base Year for Estimation 2023 Historic Period 2016-2023 Forecast Period 2024-2033 Report Coverage Revenue Forecast, Market Dynamics, COVID-19 Impact, Competitive Landscape, Recent Developments Segments Covered By Type(Raisins, Apricots, Figs, Dates, Berries, Others), By Application(Bakery and Confectionery, Dairy and Frozen Desserts, Breakfast Cereals,Beverages, Sweet and Savory Snacks, Others) Regional Analysis North America - The US, Canada, Rest of North America, Europe - Germany, France, The UK, Spain, Italy, Russia, Netherlands, Rest of Europe, Asia-Pacific - China, Japan, South Korea, India, New Zealand, Singapore, Thailand, Vietnam, Rest of Asia Pacific, Latin America - Brazil, Mexico, Rest of Latin America, Middle East & Africa - South Africa, Saudi Arabia, UAE, Rest of Middle East & Africa Competitive Landscape Namrong Foodstuff Co., Ltd (China), Qingdao Kington Produce Co., Ltd (China), Shanxin Exxon Trading Co., Ltd (China), AGRANA Beteiligungs-AG (Austria), Agthia Group PJSC (UAE), Angas Park Fruit Co. (Australia), Archer Daniels Midland Company (USA), Bergin Fruit and Nut Co. Inc. (USA), Berrifine A/S (Denmark), Chaucer Foods Ltd (UK), Dohler GmbH (Germany), European Freeze Dry (UK), Farmley by Connedit Business Solutions Private Limited (India), FutureCeuticals, Inc. (USA), Geobres S.A. (Greece) Customization Scope Customization for segments, region/country-level will be provided. Moreover, additional customization can be done based on the requirements. Purchase Options We have three licenses to opt for Single User License, Multi-User License (Up to 5 Users), Corporate Use License (Unlimited User and Printable PDF) -
- 1. Executive Summary
- 1.1. Definition
- 1.2. Taxonomy
- 1.3. Research Scope
- 1.4. Key Analysis
- 1.5. Key Findings by Major Segments
- 1.6. Top strategies by Major Players
- 2. Global Dried Fruit Market Overview
- 2.1. Dried Fruit Market Dynamics
- 2.1.1. Drivers
- 2.1.2. Opportunities
- 2.1.3. Restraints
- 2.1.4. Challenges
- 2.2. Macro-economic Factors
- 2.3. Regulatory Framework
- 2.4. Market Investment Feasibility Index
- 2.5. PEST Analysis
- 2.6. PORTER’S Five Force Analysis
- 2.7. Drivers & Restraints Impact Analysis
- 2.8. Industry Chain Analysis
- 2.9. Cost Structure Analysis
- 2.10. Marketing Strategy
- 2.11. Russia-Ukraine War Impact Analysis
- 2.12. Opportunity Map Analysis
- 2.13. Market Competition Scenario Analysis
- 2.14. Product Life Cycle Analysis
- 2.15. Opportunity Orbits
- 2.16. Manufacturer Intensity Map
- 2.17. Major Companies sales by Value & Volume
- 2.1. Dried Fruit Market Dynamics
- 3. Global Dried Fruit Market Analysis, Opportunity and Forecast, 2016-2032
- 3.1. Global Dried Fruit Market Analysis, 2016-2021
- 3.2. Global Dried Fruit Market Opportunity and Forecast, 2023-2032
- 3.3. Global Dried Fruit Market Analysis, Opportunity and Forecast, By By Type, 2016-2032
- 3.3.1. Global Dried Fruit Market Analysis by By Type: Introduction
- 3.3.2. Market Size Absolute $ Opportunity Analysis and Forecast, By By Type, 2016-2032
- 3.3.3. Raisins
- 3.3.4. Apricots
- 3.3.5. Figs
- 3.3.6. Dates
- 3.3.7. Berries
- 3.3.8. Others
- 3.4. Global Dried Fruit Market Analysis, Opportunity and Forecast, By By Application , 2016-2032
- 3.4.1. Global Dried Fruit Market Analysis by By Application : Introduction
- 3.4.2. Market Size Absolute $ Opportunity Analysis and Forecast, By By Application , 2016-2032
- 3.4.3. Bakery and Confectionery
- 3.4.4. Dairy and Frozen Desserts
- 3.4.5. Breakfast Cereals
- 3.4.6. Beverages
- 3.4.7. Sweet and Savory Snacks
- 3.4.8. Others
- 4. North America Dried Fruit Market Analysis, Opportunity and Forecast, 2016-2032
- 4.1. North America Dried Fruit Market Analysis, 2016-2021
- 4.2. North America Dried Fruit Market Opportunity and Forecast, 2023-2032
- 4.3. North America Dried Fruit Market Analysis, Opportunity and Forecast, By By Type, 2016-2032
- 4.3.1. North America Dried Fruit Market Analysis by By Type: Introduction
- 4.3.2. Market Size Absolute $ Opportunity Analysis and Forecast, By By Type, 2016-2032
- 4.3.3. Raisins
- 4.3.4. Apricots
- 4.3.5. Figs
- 4.3.6. Dates
- 4.3.7. Berries
- 4.3.8. Others
- 4.4. North America Dried Fruit Market Analysis, Opportunity and Forecast, By By Application , 2016-2032
- 4.4.1. North America Dried Fruit Market Analysis by By Application : Introduction
- 4.4.2. Market Size Absolute $ Opportunity Analysis and Forecast, By By Application , 2016-2032
- 4.4.3. Bakery and Confectionery
- 4.4.4. Dairy and Frozen Desserts
- 4.4.5. Breakfast Cereals
- 4.4.6. Beverages
- 4.4.7. Sweet and Savory Snacks
- 4.4.8. Others
- 4.5. North America Dried Fruit Market Analysis, Opportunity and Forecast, By Country , 2016-2032
- 4.5.1. North America Dried Fruit Market Analysis by Country : Introduction
- 4.5.2. Market Size Absolute $ Opportunity Analysis and Forecast, Country , 2016-2032
- 4.5.2.1. The US
- 4.5.2.2. Canada
- 4.5.2.3. Mexico
- 5. Western Europe Dried Fruit Market Analysis, Opportunity and Forecast, 2016-2032
- 5.1. Western Europe Dried Fruit Market Analysis, 2016-2021
- 5.2. Western Europe Dried Fruit Market Opportunity and Forecast, 2023-2032
- 5.3. Western Europe Dried Fruit Market Analysis, Opportunity and Forecast, By By Type, 2016-2032
- 5.3.1. Western Europe Dried Fruit Market Analysis by By Type: Introduction
- 5.3.2. Market Size Absolute $ Opportunity Analysis and Forecast, By By Type, 2016-2032
- 5.3.3. Raisins
- 5.3.4. Apricots
- 5.3.5. Figs
- 5.3.6. Dates
- 5.3.7. Berries
- 5.3.8. Others
- 5.4. Western Europe Dried Fruit Market Analysis, Opportunity and Forecast, By By Application , 2016-2032
- 5.4.1. Western Europe Dried Fruit Market Analysis by By Application : Introduction
- 5.4.2. Market Size Absolute $ Opportunity Analysis and Forecast, By By Application , 2016-2032
- 5.4.3. Bakery and Confectionery
- 5.4.4. Dairy and Frozen Desserts
- 5.4.5. Breakfast Cereals
- 5.4.6. Beverages
- 5.4.7. Sweet and Savory Snacks
- 5.4.8. Others
- 5.5. Western Europe Dried Fruit Market Analysis, Opportunity and Forecast, By Country , 2016-2032
- 5.5.1. Western Europe Dried Fruit Market Analysis by Country : Introduction
- 5.5.2. Market Size Absolute $ Opportunity Analysis and Forecast, Country , 2016-2032
- 5.5.2.1. Germany
- 5.5.2.2. France
- 5.5.2.3. The UK
- 5.5.2.4. Spain
- 5.5.2.5. Italy
- 5.5.2.6. Portugal
- 5.5.2.7. Ireland
- 5.5.2.8. Austria
- 5.5.2.9. Switzerland
- 5.5.2.10. Benelux
- 5.5.2.11. Nordic
- 5.5.2.12. Rest of Western Europe
- 6. Eastern Europe Dried Fruit Market Analysis, Opportunity and Forecast, 2016-2032
- 6.1. Eastern Europe Dried Fruit Market Analysis, 2016-2021
- 6.2. Eastern Europe Dried Fruit Market Opportunity and Forecast, 2023-2032
- 6.3. Eastern Europe Dried Fruit Market Analysis, Opportunity and Forecast, By By Type, 2016-2032
- 6.3.1. Eastern Europe Dried Fruit Market Analysis by By Type: Introduction
- 6.3.2. Market Size Absolute $ Opportunity Analysis and Forecast, By By Type, 2016-2032
- 6.3.3. Raisins
- 6.3.4. Apricots
- 6.3.5. Figs
- 6.3.6. Dates
- 6.3.7. Berries
- 6.3.8. Others
- 6.4. Eastern Europe Dried Fruit Market Analysis, Opportunity and Forecast, By By Application , 2016-2032
- 6.4.1. Eastern Europe Dried Fruit Market Analysis by By Application : Introduction
- 6.4.2. Market Size Absolute $ Opportunity Analysis and Forecast, By By Application , 2016-2032
- 6.4.3. Bakery and Confectionery
- 6.4.4. Dairy and Frozen Desserts
- 6.4.5. Breakfast Cereals
- 6.4.6. Beverages
- 6.4.7. Sweet and Savory Snacks
- 6.4.8. Others
- 6.5. Eastern Europe Dried Fruit Market Analysis, Opportunity and Forecast, By Country , 2016-2032
- 6.5.1. Eastern Europe Dried Fruit Market Analysis by Country : Introduction
- 6.5.2. Market Size Absolute $ Opportunity Analysis and Forecast, Country , 2016-2032
- 6.5.2.1. Russia
- 6.5.2.2. Poland
- 6.5.2.3. The Czech Republic
- 6.5.2.4. Greece
- 6.5.2.5. Rest of Eastern Europe
- 7. APAC Dried Fruit Market Analysis, Opportunity and Forecast, 2016-2032
- 7.1. APAC Dried Fruit Market Analysis, 2016-2021
- 7.2. APAC Dried Fruit Market Opportunity and Forecast, 2023-2032
- 7.3. APAC Dried Fruit Market Analysis, Opportunity and Forecast, By By Type, 2016-2032
- 7.3.1. APAC Dried Fruit Market Analysis by By Type: Introduction
- 7.3.2. Market Size Absolute $ Opportunity Analysis and Forecast, By By Type, 2016-2032
- 7.3.3. Raisins
- 7.3.4. Apricots
- 7.3.5. Figs
- 7.3.6. Dates
- 7.3.7. Berries
- 7.3.8. Others
- 7.4. APAC Dried Fruit Market Analysis, Opportunity and Forecast, By By Application , 2016-2032
- 7.4.1. APAC Dried Fruit Market Analysis by By Application : Introduction
- 7.4.2. Market Size Absolute $ Opportunity Analysis and Forecast, By By Application , 2016-2032
- 7.4.3. Bakery and Confectionery
- 7.4.4. Dairy and Frozen Desserts
- 7.4.5. Breakfast Cereals
- 7.4.6. Beverages
- 7.4.7. Sweet and Savory Snacks
- 7.4.8. Others
- 7.5. APAC Dried Fruit Market Analysis, Opportunity and Forecast, By Country , 2016-2032
- 7.5.1. APAC Dried Fruit Market Analysis by Country : Introduction
- 7.5.2. Market Size Absolute $ Opportunity Analysis and Forecast, Country , 2016-2032
- 7.5.2.1. China
- 7.5.2.2. Japan
- 7.5.2.3. South Korea
- 7.5.2.4. India
- 7.5.2.5. Australia & New Zeland
- 7.5.2.6. Indonesia
- 7.5.2.7. Malaysia
- 7.5.2.8. Philippines
- 7.5.2.9. Singapore
- 7.5.2.10. Thailand
- 7.5.2.11. Vietnam
- 7.5.2.12. Rest of APAC
- 8. Latin America Dried Fruit Market Analysis, Opportunity and Forecast, 2016-2032
- 8.1. Latin America Dried Fruit Market Analysis, 2016-2021
- 8.2. Latin America Dried Fruit Market Opportunity and Forecast, 2023-2032
- 8.3. Latin America Dried Fruit Market Analysis, Opportunity and Forecast, By By Type, 2016-2032
- 8.3.1. Latin America Dried Fruit Market Analysis by By Type: Introduction
- 8.3.2. Market Size Absolute $ Opportunity Analysis and Forecast, By By Type, 2016-2032
- 8.3.3. Raisins
- 8.3.4. Apricots
- 8.3.5. Figs
- 8.3.6. Dates
- 8.3.7. Berries
- 8.3.8. Others
- 8.4. Latin America Dried Fruit Market Analysis, Opportunity and Forecast, By By Application , 2016-2032
- 8.4.1. Latin America Dried Fruit Market Analysis by By Application : Introduction
- 8.4.2. Market Size Absolute $ Opportunity Analysis and Forecast, By By Application , 2016-2032
- 8.4.3. Bakery and Confectionery
- 8.4.4. Dairy and Frozen Desserts
- 8.4.5. Breakfast Cereals
- 8.4.6. Beverages
- 8.4.7. Sweet and Savory Snacks
- 8.4.8. Others
- 8.5. Latin America Dried Fruit Market Analysis, Opportunity and Forecast, By Country , 2016-2032
- 8.5.1. Latin America Dried Fruit Market Analysis by Country : Introduction
- 8.5.2. Market Size Absolute $ Opportunity Analysis and Forecast, Country , 2016-2032
- 8.5.2.1. Brazil
- 8.5.2.2. Colombia
- 8.5.2.3. Chile
- 8.5.2.4. Argentina
- 8.5.2.5. Costa Rica
- 8.5.2.6. Rest of Latin America
- 9. Middle East & Africa Dried Fruit Market Analysis, Opportunity and Forecast, 2016-2032
- 9.1. Middle East & Africa Dried Fruit Market Analysis, 2016-2021
- 9.2. Middle East & Africa Dried Fruit Market Opportunity and Forecast, 2023-2032
- 9.3. Middle East & Africa Dried Fruit Market Analysis, Opportunity and Forecast, By By Type, 2016-2032
- 9.3.1. Middle East & Africa Dried Fruit Market Analysis by By Type: Introduction
- 9.3.2. Market Size Absolute $ Opportunity Analysis and Forecast, By By Type, 2016-2032
- 9.3.3. Raisins
- 9.3.4. Apricots
- 9.3.5. Figs
- 9.3.6. Dates
- 9.3.7. Berries
- 9.3.8. Others
- 9.4. Middle East & Africa Dried Fruit Market Analysis, Opportunity and Forecast, By By Application , 2016-2032
- 9.4.1. Middle East & Africa Dried Fruit Market Analysis by By Application : Introduction
- 9.4.2. Market Size Absolute $ Opportunity Analysis and Forecast, By By Application , 2016-2032
- 9.4.3. Bakery and Confectionery
- 9.4.4. Dairy and Frozen Desserts
- 9.4.5. Breakfast Cereals
- 9.4.6. Beverages
- 9.4.7. Sweet and Savory Snacks
- 9.4.8. Others
- 9.5. Middle East & Africa Dried Fruit Market Analysis, Opportunity and Forecast, By Country , 2016-2032
- 9.5.1. Middle East & Africa Dried Fruit Market Analysis by Country : Introduction
- 9.5.2. Market Size Absolute $ Opportunity Analysis and Forecast, Country , 2016-2032
- 9.5.2.1. Algeria
- 9.5.2.2. Egypt
- 9.5.2.3. Israel
- 9.5.2.4. Kuwait
- 9.5.2.5. Nigeria
- 9.5.2.6. Saudi Arabia
- 9.5.2.7. South Africa
- 9.5.2.8. Turkey
- 9.5.2.9. The UAE
- 9.5.2.10. Rest of MEA
- 10. Global Dried Fruit Market Analysis, Opportunity and Forecast, By Region , 2016-2032
- 10.1. Global Dried Fruit Market Analysis by Region : Introduction
- 10.2. Market Size Absolute $ Opportunity Analysis and Forecast, By Region , 2016-2032
- 10.2.1. North America
- 10.2.2. Western Europe
- 10.2.3. Eastern Europe
- 10.2.4. APAC
- 10.2.5. Latin America
- 10.2.6. Middle East & Africa
- 11. Global Dried Fruit Market Competitive Landscape, Market Share Analysis, and Company Profiles
- 11.1. Market Share Analysis
- 11.2. Company Profiles
- 11.3. Namrong Foodstuff Co., Ltd (China)
- 11.3.1. Company Overview
- 11.3.2. Financial Highlights
- 11.3.3. Product Portfolio
- 11.3.4. SWOT Analysis
- 11.3.5. Key Strategies and Developments
- 11.4. Qingdao Kington Produce Co., Ltd (China)
- 11.4.1. Company Overview
- 11.4.2. Financial Highlights
- 11.4.3. Product Portfolio
- 11.4.4. SWOT Analysis
- 11.4.5. Key Strategies and Developments
- 11.5. Shanxin Exxon Trading Co., Ltd (China)
- 11.5.1. Company Overview
- 11.5.2. Financial Highlights
- 11.5.3. Product Portfolio
- 11.5.4. SWOT Analysis
- 11.5.5. Key Strategies and Developments
- 11.6. AGRANA Beteiligungs-AG (Austria)
- 11.6.1. Company Overview
- 11.6.2. Financial Highlights
- 11.6.3. Product Portfolio
- 11.6.4. SWOT Analysis
- 11.6.5. Key Strategies and Developments
- 11.7. Agthia Group PJSC (UAE)
- 11.7.1. Company Overview
- 11.7.2. Financial Highlights
- 11.7.3. Product Portfolio
- 11.7.4. SWOT Analysis
- 11.7.5. Key Strategies and Developments
- 11.8. Angas Park Fruit Co. (Australia)
- 11.8.1. Company Overview
- 11.8.2. Financial Highlights
- 11.8.3. Product Portfolio
- 11.8.4. SWOT Analysis
- 11.8.5. Key Strategies and Developments
- 11.9. Archer Daniels Midland Company (USA)
- 11.9.1. Company Overview
- 11.9.2. Financial Highlights
- 11.9.3. Product Portfolio
- 11.9.4. SWOT Analysis
- 11.9.5. Key Strategies and Developments
- 11.10. Bergin Fruit and Nut Co. Inc. (USA)
- 11.10.1. Company Overview
- 11.10.2. Financial Highlights
- 11.10.3. Product Portfolio
- 11.10.4. SWOT Analysis
- 11.10.5. Key Strategies and Developments
- 11.11. Berrifine A/S (Denmark)
- 11.11.1. Company Overview
- 11.11.2. Financial Highlights
- 11.11.3. Product Portfolio
- 11.11.4. SWOT Analysis
- 11.11.5. Key Strategies and Developments
- 11.12. Chaucer Foods Ltd (UK)
- 11.12.1. Company Overview
- 11.12.2. Financial Highlights
- 11.12.3. Product Portfolio
- 11.12.4. SWOT Analysis
- 11.12.5. Key Strategies and Developments
- 11.13.1. Company Overview
- 11.13.2. Financial Highlights
- 11.13.3. Product Portfolio
- 11.13.4. SWOT Analysis
- 11.13.5. Key Strategies and Developments
- 11.14. Dohler GmbH (Germany)
- 11.14.1. Company Overview
- 11.14.2. Financial Highlights
- 11.14.3. Product Portfolio
- 11.14.4. SWOT Analysis
- 11.14.5. Key Strategies and Developments
- 11.15. Farmley by Connedit Business Solutions Private Limited (India)
- 11.15.1. Company Overview
- 11.15.2. Financial Highlights
- 11.15.3. Product Portfolio
- 11.15.4. SWOT Analysis
- 11.15.5. Key Strategies and Developments
- 11.16. FutureCeuticals, Inc. (USA)
- 11.16.1. Company Overview
- 11.16.2. Financial Highlights
- 11.16.3. Product Portfolio
- 11.16.4. SWOT Analysis
- 11.16.5. Key Strategies and Developments
- 11.17. Geobres S.A. (Greece)
- 11.17.1. Company Overview
- 11.17.2. Financial Highlights
- 11.17.3. Product Portfolio
- 11.17.4. SWOT Analysis
- 11.17.5. Key Strategies and Developments
- 12. Assumptions and Acronyms
- 13. Research Methodology
- 14. Contact
"
- List of Figures
- "
- Figure 1: Global Dried Fruit Market Revenue (US$ Mn) Market Share by By Type in 2022
- Figure 2: Global Dried Fruit Market Market Attractiveness Analysis by By Type, 2016-2032
- Figure 3: Global Dried Fruit Market Revenue (US$ Mn) Market Share by By Application in 2022
- Figure 4: Global Dried Fruit Market Market Attractiveness Analysis by By Application , 2016-2032
- Figure 5: Global Dried Fruit Market Revenue (US$ Mn) Market Share by Region in 2022
- Figure 6: Global Dried Fruit Market Market Attractiveness Analysis by Region, 2016-2032
- Figure 7: Global Dried Fruit Market Market Revenue (US$ Mn) (2016-2032)
- Figure 8: Global Dried Fruit Market Market Revenue (US$ Mn) Comparison by Region (2016-2032)
- Figure 9: Global Dried Fruit Market Market Revenue (US$ Mn) Comparison by By Type (2016-2032)
- Figure 10: Global Dried Fruit Market Market Revenue (US$ Mn) Comparison by By Application (2016-2032)
- Figure 11: Global Dried Fruit Market Market Y-o-Y Growth Rate Comparison by Region (2016-2032)
- Figure 12: Global Dried Fruit Market Market Y-o-Y Growth Rate Comparison by By Type (2016-2032)
- Figure 13: Global Dried Fruit Market Market Y-o-Y Growth Rate Comparison by By Application (2016-2032)
- Figure 14: Global Dried Fruit Market Market Share Comparison by Region (2016-2032)
- Figure 15: Global Dried Fruit Market Market Share Comparison by By Type (2016-2032)
- Figure 16: Global Dried Fruit Market Market Share Comparison by By Application (2016-2032)
- Figure 17: North America Dried Fruit Market Revenue (US$ Mn) Market Share by By Typein 2022
- Figure 18: North America Dried Fruit Market Market Attractiveness Analysis by By Type, 2016-2032
- Figure 19: North America Dried Fruit Market Revenue (US$ Mn) Market Share by By Application in 2022
- Figure 20: North America Dried Fruit Market Market Attractiveness Analysis by By Application , 2016-2032
- Figure 21: North America Dried Fruit Market Revenue (US$ Mn) Market Share by Country in 2022
- Figure 22: North America Dried Fruit Market Market Attractiveness Analysis by Country, 2016-2032
- Figure 23: North America Dried Fruit Market Market Revenue (US$ Mn) (2016-2032)
- Figure 24: North America Dried Fruit Market Market Revenue (US$ Mn) Comparison by Country (2016-2032)
- Figure 25: North America Dried Fruit Market Market Revenue (US$ Mn) Comparison by By Type (2016-2032)
- Figure 26: North America Dried Fruit Market Market Revenue (US$ Mn) Comparison by By Application (2016-2032)
- Figure 27: North America Dried Fruit Market Market Y-o-Y Growth Rate Comparison by Country (2016-2032)
- Figure 28: North America Dried Fruit Market Market Y-o-Y Growth Rate Comparison by By Type (2016-2032)
- Figure 29: North America Dried Fruit Market Market Y-o-Y Growth Rate Comparison by By Application (2016-2032)
- Figure 30: North America Dried Fruit Market Market Share Comparison by Country (2016-2032)
- Figure 31: North America Dried Fruit Market Market Share Comparison by By Type (2016-2032)
- Figure 32: North America Dried Fruit Market Market Share Comparison by By Application (2016-2032)
- Figure 33: Western Europe Dried Fruit Market Revenue (US$ Mn) Market Share by By Typein 2022
- Figure 34: Western Europe Dried Fruit Market Market Attractiveness Analysis by By Type, 2016-2032
- Figure 35: Western Europe Dried Fruit Market Revenue (US$ Mn) Market Share by By Application in 2022
- Figure 36: Western Europe Dried Fruit Market Market Attractiveness Analysis by By Application , 2016-2032
- Figure 37: Western Europe Dried Fruit Market Revenue (US$ Mn) Market Share by Country in 2022
- Figure 38: Western Europe Dried Fruit Market Market Attractiveness Analysis by Country, 2016-2032
- Figure 39: Western Europe Dried Fruit Market Market Revenue (US$ Mn) (2016-2032)
- Figure 40: Western Europe Dried Fruit Market Market Revenue (US$ Mn) Comparison by Country (2016-2032)
- Figure 41: Western Europe Dried Fruit Market Market Revenue (US$ Mn) Comparison by By Type (2016-2032)
- Figure 42: Western Europe Dried Fruit Market Market Revenue (US$ Mn) Comparison by By Application (2016-2032)
- Figure 43: Western Europe Dried Fruit Market Market Y-o-Y Growth Rate Comparison by Country (2016-2032)
- Figure 44: Western Europe Dried Fruit Market Market Y-o-Y Growth Rate Comparison by By Type (2016-2032)
- Figure 45: Western Europe Dried Fruit Market Market Y-o-Y Growth Rate Comparison by By Application (2016-2032)
- Figure 46: Western Europe Dried Fruit Market Market Share Comparison by Country (2016-2032)
- Figure 47: Western Europe Dried Fruit Market Market Share Comparison by By Type (2016-2032)
- Figure 48: Western Europe Dried Fruit Market Market Share Comparison by By Application (2016-2032)
- Figure 49: Eastern Europe Dried Fruit Market Revenue (US$ Mn) Market Share by By Typein 2022
- Figure 50: Eastern Europe Dried Fruit Market Market Attractiveness Analysis by By Type, 2016-2032
- Figure 51: Eastern Europe Dried Fruit Market Revenue (US$ Mn) Market Share by By Application in 2022
- Figure 52: Eastern Europe Dried Fruit Market Market Attractiveness Analysis by By Application , 2016-2032
- Figure 53: Eastern Europe Dried Fruit Market Revenue (US$ Mn) Market Share by Country in 2022
- Figure 54: Eastern Europe Dried Fruit Market Market Attractiveness Analysis by Country, 2016-2032
- Figure 55: Eastern Europe Dried Fruit Market Market Revenue (US$ Mn) (2016-2032)
- Figure 56: Eastern Europe Dried Fruit Market Market Revenue (US$ Mn) Comparison by Country (2016-2032)
- Figure 57: Eastern Europe Dried Fruit Market Market Revenue (US$ Mn) Comparison by By Type (2016-2032)
- Figure 58: Eastern Europe Dried Fruit Market Market Revenue (US$ Mn) Comparison by By Application (2016-2032)
- Figure 59: Eastern Europe Dried Fruit Market Market Y-o-Y Growth Rate Comparison by Country (2016-2032)
- Figure 60: Eastern Europe Dried Fruit Market Market Y-o-Y Growth Rate Comparison by By Type (2016-2032)
- Figure 61: Eastern Europe Dried Fruit Market Market Y-o-Y Growth Rate Comparison by By Application (2016-2032)
- Figure 62: Eastern Europe Dried Fruit Market Market Share Comparison by Country (2016-2032)
- Figure 63: Eastern Europe Dried Fruit Market Market Share Comparison by By Type (2016-2032)
- Figure 64: Eastern Europe Dried Fruit Market Market Share Comparison by By Application (2016-2032)
- Figure 65: APAC Dried Fruit Market Revenue (US$ Mn) Market Share by By Typein 2022
- Figure 66: APAC Dried Fruit Market Market Attractiveness Analysis by By Type, 2016-2032
- Figure 67: APAC Dried Fruit Market Revenue (US$ Mn) Market Share by By Application in 2022
- Figure 68: APAC Dried Fruit Market Market Attractiveness Analysis by By Application , 2016-2032
- Figure 69: APAC Dried Fruit Market Revenue (US$ Mn) Market Share by Country in 2022
- Figure 70: APAC Dried Fruit Market Market Attractiveness Analysis by Country, 2016-2032
- Figure 71: APAC Dried Fruit Market Market Revenue (US$ Mn) (2016-2032)
- Figure 72: APAC Dried Fruit Market Market Revenue (US$ Mn) Comparison by Country (2016-2032)
- Figure 73: APAC Dried Fruit Market Market Revenue (US$ Mn) Comparison by By Type (2016-2032)
- Figure 74: APAC Dried Fruit Market Market Revenue (US$ Mn) Comparison by By Application (2016-2032)
- Figure 75: APAC Dried Fruit Market Market Y-o-Y Growth Rate Comparison by Country (2016-2032)
- Figure 76: APAC Dried Fruit Market Market Y-o-Y Growth Rate Comparison by By Type (2016-2032)
- Figure 77: APAC Dried Fruit Market Market Y-o-Y Growth Rate Comparison by By Application (2016-2032)
- Figure 78: APAC Dried Fruit Market Market Share Comparison by Country (2016-2032)
- Figure 79: APAC Dried Fruit Market Market Share Comparison by By Type (2016-2032)
- Figure 80: APAC Dried Fruit Market Market Share Comparison by By Application (2016-2032)
- Figure 81: Latin America Dried Fruit Market Revenue (US$ Mn) Market Share by By Typein 2022
- Figure 82: Latin America Dried Fruit Market Market Attractiveness Analysis by By Type, 2016-2032
- Figure 83: Latin America Dried Fruit Market Revenue (US$ Mn) Market Share by By Application in 2022
- Figure 84: Latin America Dried Fruit Market Market Attractiveness Analysis by By Application , 2016-2032
- Figure 85: Latin America Dried Fruit Market Revenue (US$ Mn) Market Share by Country in 2022
- Figure 86: Latin America Dried Fruit Market Market Attractiveness Analysis by Country, 2016-2032
- Figure 87: Latin America Dried Fruit Market Market Revenue (US$ Mn) (2016-2032)
- Figure 88: Latin America Dried Fruit Market Market Revenue (US$ Mn) Comparison by Country (2016-2032)
- Figure 89: Latin America Dried Fruit Market Market Revenue (US$ Mn) Comparison by By Type (2016-2032)
- Figure 90: Latin America Dried Fruit Market Market Revenue (US$ Mn) Comparison by By Application (2016-2032)
- Figure 91: Latin America Dried Fruit Market Market Y-o-Y Growth Rate Comparison by Country (2016-2032)
- Figure 92: Latin America Dried Fruit Market Market Y-o-Y Growth Rate Comparison by By Type (2016-2032)
- Figure 93: Latin America Dried Fruit Market Market Y-o-Y Growth Rate Comparison by By Application (2016-2032)
- Figure 94: Latin America Dried Fruit Market Market Share Comparison by Country (2016-2032)
- Figure 95: Latin America Dried Fruit Market Market Share Comparison by By Type (2016-2032)
- Figure 96: Latin America Dried Fruit Market Market Share Comparison by By Application (2016-2032)
- Figure 97: Middle East & Africa Dried Fruit Market Revenue (US$ Mn) Market Share by By Typein 2022
- Figure 98: Middle East & Africa Dried Fruit Market Market Attractiveness Analysis by By Type, 2016-2032
- Figure 99: Middle East & Africa Dried Fruit Market Revenue (US$ Mn) Market Share by By Application in 2022
- Figure 100: Middle East & Africa Dried Fruit Market Market Attractiveness Analysis by By Application , 2016-2032
- Figure 101: Middle East & Africa Dried Fruit Market Revenue (US$ Mn) Market Share by Country in 2022
- Figure 102: Middle East & Africa Dried Fruit Market Market Attractiveness Analysis by Country, 2016-2032
- Figure 103: Middle East & Africa Dried Fruit Market Market Revenue (US$ Mn) (2016-2032)
- Figure 104: Middle East & Africa Dried Fruit Market Market Revenue (US$ Mn) Comparison by Country (2016-2032)
- Figure 105: Middle East & Africa Dried Fruit Market Market Revenue (US$ Mn) Comparison by By Type (2016-2032)
- Figure 106: Middle East & Africa Dried Fruit Market Market Revenue (US$ Mn) Comparison by By Application (2016-2032)
- Figure 107: Middle East & Africa Dried Fruit Market Market Y-o-Y Growth Rate Comparison by Country (2016-2032)
- Figure 108: Middle East & Africa Dried Fruit Market Market Y-o-Y Growth Rate Comparison by By Type (2016-2032)
- Figure 109: Middle East & Africa Dried Fruit Market Market Y-o-Y Growth Rate Comparison by By Application (2016-2032)
- Figure 110: Middle East & Africa Dried Fruit Market Market Share Comparison by Country (2016-2032)
- Figure 111: Middle East & Africa Dried Fruit Market Market Share Comparison by By Type (2016-2032)
- Figure 112: Middle East & Africa Dried Fruit Market Market Share Comparison by By Application (2016-2032)
"
- List of Tables
- "
- Table 1: Global Dried Fruit Market Market Comparison by By Type (2016-2032)
- Table 2: Global Dried Fruit Market Market Comparison by By Application (2016-2032)
- Table 3: Global Dried Fruit Market Revenue (US$ Mn) Comparison by Region (2016-2032)
- Table 4: Global Dried Fruit Market Market Revenue (US$ Mn) (2016-2032)
- Table 5: Global Dried Fruit Market Market Revenue (US$ Mn) Comparison by Region (2016-2032)
- Table 6: Global Dried Fruit Market Market Revenue (US$ Mn) Comparison by By Type (2016-2032)
- Table 7: Global Dried Fruit Market Market Revenue (US$ Mn) Comparison by By Application (2016-2032)
- Table 8: Global Dried Fruit Market Market Y-o-Y Growth Rate Comparison by Region (2016-2032)
- Table 9: Global Dried Fruit Market Market Y-o-Y Growth Rate Comparison by By Type (2016-2032)
- Table 10: Global Dried Fruit Market Market Y-o-Y Growth Rate Comparison by By Application (2016-2032)
- Table 11: Global Dried Fruit Market Market Share Comparison by Region (2016-2032)
- Table 12: Global Dried Fruit Market Market Share Comparison by By Type (2016-2032)
- Table 13: Global Dried Fruit Market Market Share Comparison by By Application (2016-2032)
- Table 14: North America Dried Fruit Market Market Comparison by By Application (2016-2032)
- Table 15: North America Dried Fruit Market Revenue (US$ Mn) Comparison by Country (2016-2032)
- Table 16: North America Dried Fruit Market Market Revenue (US$ Mn) (2016-2032)
- Table 17: North America Dried Fruit Market Market Revenue (US$ Mn) Comparison by Country (2016-2032)
- Table 18: North America Dried Fruit Market Market Revenue (US$ Mn) Comparison by By Type (2016-2032)
- Table 19: North America Dried Fruit Market Market Revenue (US$ Mn) Comparison by By Application (2016-2032)
- Table 20: North America Dried Fruit Market Market Y-o-Y Growth Rate Comparison by Country (2016-2032)
- Table 21: North America Dried Fruit Market Market Y-o-Y Growth Rate Comparison by By Type (2016-2032)
- Table 22: North America Dried Fruit Market Market Y-o-Y Growth Rate Comparison by By Application (2016-2032)
- Table 23: North America Dried Fruit Market Market Share Comparison by Country (2016-2032)
- Table 24: North America Dried Fruit Market Market Share Comparison by By Type (2016-2032)
- Table 25: North America Dried Fruit Market Market Share Comparison by By Application (2016-2032)
- Table 26: Western Europe Dried Fruit Market Market Comparison by By Type (2016-2032)
- Table 27: Western Europe Dried Fruit Market Market Comparison by By Application (2016-2032)
- Table 28: Western Europe Dried Fruit Market Revenue (US$ Mn) Comparison by Country (2016-2032)
- Table 29: Western Europe Dried Fruit Market Market Revenue (US$ Mn) (2016-2032)
- Table 30: Western Europe Dried Fruit Market Market Revenue (US$ Mn) Comparison by Country (2016-2032)
- Table 31: Western Europe Dried Fruit Market Market Revenue (US$ Mn) Comparison by By Type (2016-2032)
- Table 32: Western Europe Dried Fruit Market Market Revenue (US$ Mn) Comparison by By Application (2016-2032)
- Table 33: Western Europe Dried Fruit Market Market Y-o-Y Growth Rate Comparison by Country (2016-2032)
- Table 34: Western Europe Dried Fruit Market Market Y-o-Y Growth Rate Comparison by By Type (2016-2032)
- Table 35: Western Europe Dried Fruit Market Market Y-o-Y Growth Rate Comparison by By Application (2016-2032)
- Table 36: Western Europe Dried Fruit Market Market Share Comparison by Country (2016-2032)
- Table 37: Western Europe Dried Fruit Market Market Share Comparison by By Type (2016-2032)
- Table 38: Western Europe Dried Fruit Market Market Share Comparison by By Application (2016-2032)
- Table 39: Eastern Europe Dried Fruit Market Market Comparison by By Type (2016-2032)
- Table 40: Eastern Europe Dried Fruit Market Market Comparison by By Application (2016-2032)
- Table 41: Eastern Europe Dried Fruit Market Revenue (US$ Mn) Comparison by Country (2016-2032)
- Table 42: Eastern Europe Dried Fruit Market Market Revenue (US$ Mn) (2016-2032)
- Table 43: Eastern Europe Dried Fruit Market Market Revenue (US$ Mn) Comparison by Country (2016-2032)
- Table 44: Eastern Europe Dried Fruit Market Market Revenue (US$ Mn) Comparison by By Type (2016-2032)
- Table 45: Eastern Europe Dried Fruit Market Market Revenue (US$ Mn) Comparison by By Application (2016-2032)
- Table 46: Eastern Europe Dried Fruit Market Market Y-o-Y Growth Rate Comparison by Country (2016-2032)
- Table 47: Eastern Europe Dried Fruit Market Market Y-o-Y Growth Rate Comparison by By Type (2016-2032)
- Table 48: Eastern Europe Dried Fruit Market Market Y-o-Y Growth Rate Comparison by By Application (2016-2032)
- Table 49: Eastern Europe Dried Fruit Market Market Share Comparison by Country (2016-2032)
- Table 50: Eastern Europe Dried Fruit Market Market Share Comparison by By Type (2016-2032)
- Table 51: Eastern Europe Dried Fruit Market Market Share Comparison by By Application (2016-2032)
- Table 52: APAC Dried Fruit Market Market Comparison by By Type (2016-2032)
- Table 53: APAC Dried Fruit Market Market Comparison by By Application (2016-2032)
- Table 54: APAC Dried Fruit Market Revenue (US$ Mn) Comparison by Country (2016-2032)
- Table 55: APAC Dried Fruit Market Market Revenue (US$ Mn) (2016-2032)
- Table 56: APAC Dried Fruit Market Market Revenue (US$ Mn) Comparison by Country (2016-2032)
- Table 57: APAC Dried Fruit Market Market Revenue (US$ Mn) Comparison by By Type (2016-2032)
- Table 58: APAC Dried Fruit Market Market Revenue (US$ Mn) Comparison by By Application (2016-2032)
- Table 59: APAC Dried Fruit Market Market Y-o-Y Growth Rate Comparison by Country (2016-2032)
- Table 60: APAC Dried Fruit Market Market Y-o-Y Growth Rate Comparison by By Type (2016-2032)
- Table 61: APAC Dried Fruit Market Market Y-o-Y Growth Rate Comparison by By Application (2016-2032)
- Table 62: APAC Dried Fruit Market Market Share Comparison by Country (2016-2032)
- Table 63: APAC Dried Fruit Market Market Share Comparison by By Type (2016-2032)
- Table 64: APAC Dried Fruit Market Market Share Comparison by By Application (2016-2032)
- Table 65: Latin America Dried Fruit Market Market Comparison by By Type (2016-2032)
- Table 66: Latin America Dried Fruit Market Market Comparison by By Application (2016-2032)
- Table 67: Latin America Dried Fruit Market Revenue (US$ Mn) Comparison by Country (2016-2032)
- Table 68: Latin America Dried Fruit Market Market Revenue (US$ Mn) (2016-2032)
- Table 69: Latin America Dried Fruit Market Market Revenue (US$ Mn) Comparison by Country (2016-2032)
- Table 70: Latin America Dried Fruit Market Market Revenue (US$ Mn) Comparison by By Type (2016-2032)
- Table 71: Latin America Dried Fruit Market Market Revenue (US$ Mn) Comparison by By Application (2016-2032)
- Table 72: Latin America Dried Fruit Market Market Y-o-Y Growth Rate Comparison by Country (2016-2032)
- Table 73: Latin America Dried Fruit Market Market Y-o-Y Growth Rate Comparison by By Type (2016-2032)
- Table 74: Latin America Dried Fruit Market Market Y-o-Y Growth Rate Comparison by By Application (2016-2032)
- Table 75: Latin America Dried Fruit Market Market Share Comparison by Country (2016-2032)
- Table 76: Latin America Dried Fruit Market Market Share Comparison by By Type (2016-2032)
- Table 77: Latin America Dried Fruit Market Market Share Comparison by By Application (2016-2032)
- Table 78: Middle East & Africa Dried Fruit Market Market Comparison by By Type (2016-2032)
- Table 79: Middle East & Africa Dried Fruit Market Market Comparison by By Application (2016-2032)
- Table 80: Middle East & Africa Dried Fruit Market Revenue (US$ Mn) Comparison by Country (2016-2032)
- Table 81: Middle East & Africa Dried Fruit Market Market Revenue (US$ Mn) (2016-2032)
- Table 82: Middle East & Africa Dried Fruit Market Market Revenue (US$ Mn) Comparison by Country (2016-2032)
- Table 83: Middle East & Africa Dried Fruit Market Market Revenue (US$ Mn) Comparison by By Type (2016-2032)
- Table 84: Middle East & Africa Dried Fruit Market Market Revenue (US$ Mn) Comparison by By Application (2016-2032)
- Table 85: Middle East & Africa Dried Fruit Market Market Y-o-Y Growth Rate Comparison by Country (2016-2032)
- Table 86: Middle East & Africa Dried Fruit Market Market Y-o-Y Growth Rate Comparison by By Type (2016-2032)
- Table 87: Middle East & Africa Dried Fruit Market Market Y-o-Y Growth Rate Comparison by By Application (2016-2032)
- Table 88: Middle East & Africa Dried Fruit Market Market Share Comparison by Country (2016-2032)
- Table 89: Middle East & Africa Dried Fruit Market Market Share Comparison by By Type (2016-2032)
- Table 90: Middle East & Africa Dried Fruit Market Market Share Comparison by By Application (2016-2032)
- 1. Executive Summary
-
- Namrong Foodstuff Co., Ltd (China)
- Qingdao Kington Produce Co., Ltd (China)
- Shanxin Exxon Trading Co., Ltd (China)
- AGRANA Beteiligungs-AG (Austria)
- Agthia Group PJSC (UAE)
- Angas Park Fruit Co. (Australia)
- Archer Daniels Midland Company (USA)
- Bergin Fruit and Nut Co. Inc. (USA)
- Berrifine A/S (Denmark)
- Chaucer Foods Ltd (UK)
- Dohler GmbH (Germany)
- European Freeze Dry (UK)
- Farmley by Connedit Business Solutions Private Limited (India)
- FutureCeuticals, Inc. (USA)
- Geobres S.A. (Greece)
Our Clients


View Our Licence Options
