
Autonomous Aircraft Market By Aircraft Type(Rotary Wing, Fixed Wing), By Technology(Fully Autonomous, Increasingly Autonomous (IA)), By End Use(Commercial Aircraft, Passenger Air Vehicle, Combat and ISR, Cargo and Delivery Aircraft, Air Medical Services, Personal Air Vehicle, Others) By Region And Companies - Industry Segment Outlook, Market Assessment, Competition Scenario, Trends, And Forecast 2023-2032
-
42794
-
Jan 2022
-
181
-


-
This report was compiled by Research Team Research team of over 50 passionate professionals leverages advanced research methodologies and analytical expertise to deliver insightful, data-driven market intelligence that empowers businesses across diverse industries to make strategic, well-informed Correspondence Research Team Linkedin | Detailed Market research Methodology Our methodology involves a mix of primary research, including interviews with leading mental health experts, and secondary research from reputable medical journals and databases. View Detailed Methodology Page
-
Quick Navigation
- Autonomous Aircraft Market Size, Share, Trends Analysis
- Driving Factors
- Restraining Factors
- Autonomous Aircraft Market Segmentation Analysis
- Autonomous Aircraft Market Industry Segments
- Growth Opportunities
- Autonomous Aircraft Market Regional Analysis
- Autonomous Aircraft Industry By Region
- Autonomous Aircraft Market Key Player Analysis
- Autonomous Aircraft Market Industry Key Players
- Autonomous Aircraft Market Recent Development
- Report Scope
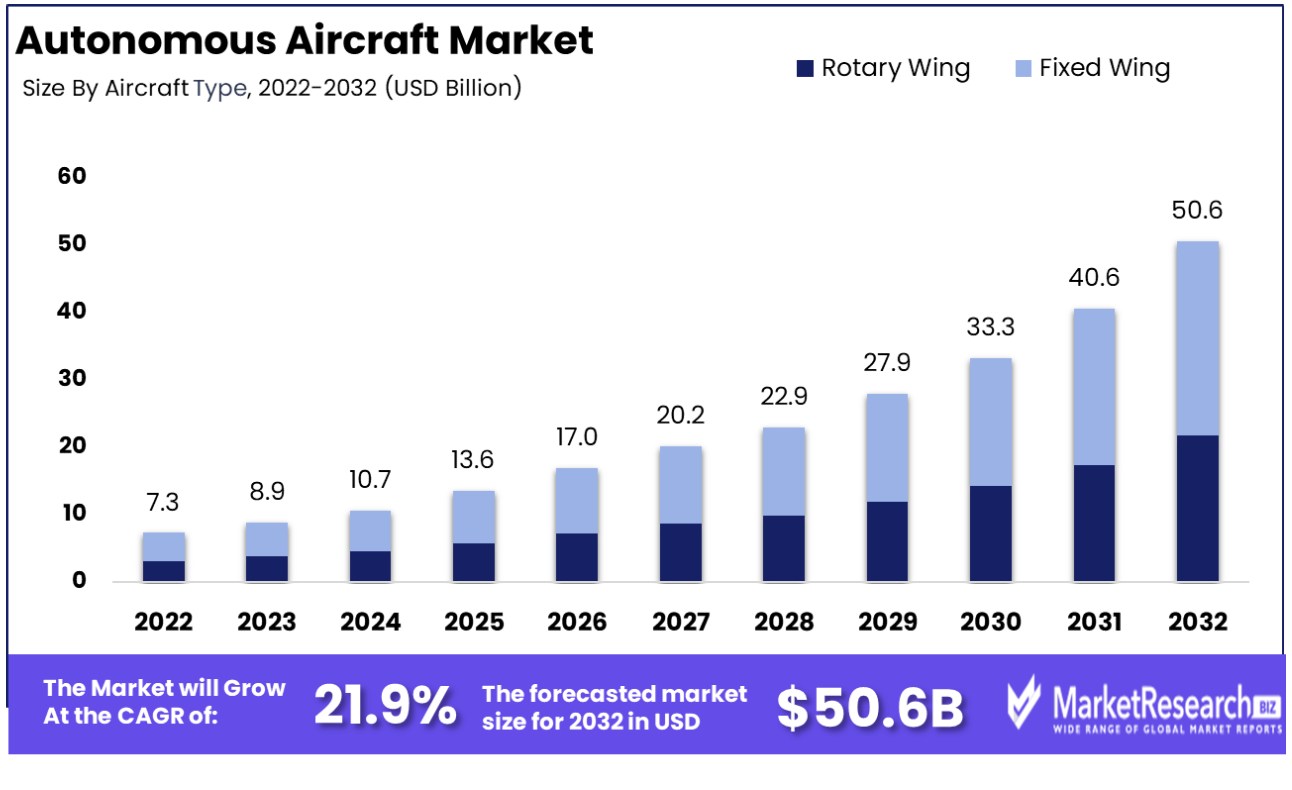
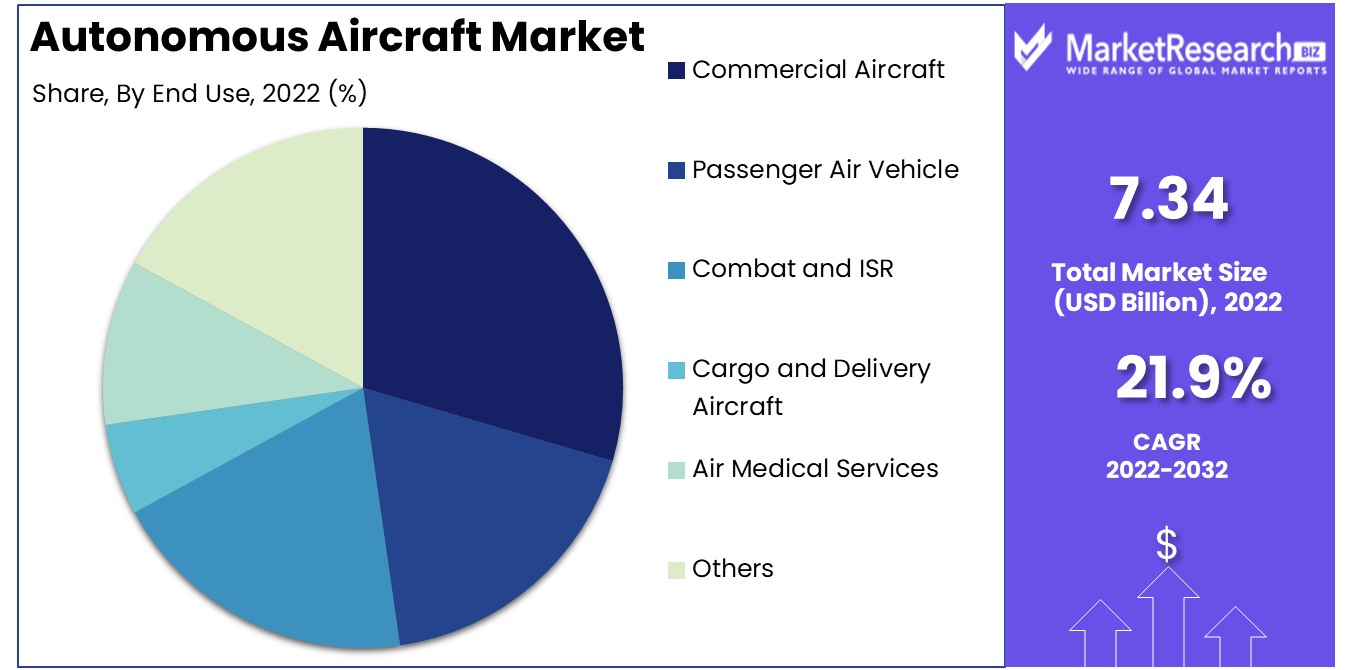
The Autonomous Aircraft Market was valued at USD 7.34 billion in 2022. It is expected to reach USD 50.6 billion by 2032, with a CAGR of 21.9% during the forecast period from 2023 to 2032.
The surge in demand for AI and IoT, and huge investment in commercial goods transportation are some of the main driving factors for the autonomous aircraft expansion. The aviation industry is expanding due to the surge of autonomous aircraft. Autonomous aircraft can operate without a pilot on board and can fly from one destination to another without any human interference. These aircraft can change the structure of the aviation industry, by offering high-end safety, enhanced efficiency, and decreasing operational expenses.
Autonomous aircraft have advanced sensors, computer vision, and AI algorithms. This type of combination of advanced technologies permits the aircraft to navigate the direction of the skies with precise accuracy and enhanced safety than traditional aircraft. These modern and advanced aircraft can perform difficult maneuvers like preventing obstacles and other aircraft without any human interference. It can decrease the operational costs by lessening fuel consumption and maintenance expenses. These types of aircraft need minimal maintenance than traditional aircraft, as they are designed for more reliability and need minimal supervision.
Manufacturers in the aviation industry are using AI for various applications. As the emergence of new applications will begin the firms to find ways to take benefit of the generative AI model such as ChatGPT which will use ML and other advanced neural networks to produce outputs that are not prepared by human programmers.
GridRaster is a software firm that has a specialty in prolonged reality advanced technologies such as augmented reality and virtual reality that have AI and spatial mapping software. It offers these types of tools for the aviation and automotive industries and collaborates with many top U.S. defense contractors.
Airbus has introduced a connected experience solution which is IoT implementation. This will provide different types of new and exciting travel experiences such as customized environments with improvised new applications that make sure to offer better interactions with the passenger’s direct surroundings including personalized entertainment and several dining choices.
Such types of advanced technologies in autonomous aircraft will increase due to their high-end demand in various sectors which will help in market expansion in the forecast period.
Driving Factors
Military Applications Propel UAV Demand
The increasing use of Unmanned Aerial Vehicles (UAVs) in military applications is a significant driving force in the growth of the Autonomous Aircraft Market. Military forces worldwide are adopting UAVs for various purposes, including surveillance, reconnaissance, and targeted operations.
The advantages of UAVs, such as their ability to operate in hazardous environments and gather critical data while keeping personnel safe, are key factors in this growing demand. This trend reflects a broader shift in defense strategies towards technology-driven solutions and is likely to continue driving market growth as military applications of UAVs expand and evolve.
Cost Savings and Reduced Human Error Enhance Market Viability
The potential for cost savings and reduced human error is significantly contributing to the growth of the Autonomous Aircraft Market. Autonomous aircraft offer greater operational efficiency and reliability, eliminating the need for human pilots as well as their associated costs.
This reduction in human error not only enhances safety but also improves operational precision. These advantages are particularly appealing in sectors where cost efficiency and safety are paramount, such as commercial aviation and logistics. The ongoing advancements in autonomous technology suggest a growing market influenced by the need for cost-effective and reliable aerial solutions.
Cargo and Delivery Investments Expand Market Scope
The massive spending on the autonomous delivery and cargo sector is fueling the growth of the Autonomous Aircraft Market As e-commerce and global trade continue to grow, there is an increasing demand for efficient and innovative delivery methods.
Autonomous aircraft, capable of transporting goods quickly and efficiently, are becoming an attractive solution for businesses looking to optimize their supply chains. This investment trend indicates a market evolving in response to the logistics and delivery needs of a rapidly digitalizing global economy, suggesting long-term market growth driven by commercial and logistical applications.
Security Concerns Necessitate Advanced Solutions
The rise in security concerns and cyber threats is a critical factor shaping the Autonomous Aircraft Market. As these aircraft rely heavily on digital systems, ensuring their security against cyber threats is paramount.
The need for more sophisticated security measures is fueling technological innovation and investment into security solutions for autonomous aircraft. The focus on security is not only a response to current threats but also a proactive measure to safeguard against future vulnerabilities, indicating a market adapting to the evolving landscape of digital security in aviation.
Restraining Factors
Lack of Profitable Airlines in Emerging Economies Hinders Autonomous Aircraft Market Growth
These economies often have underdeveloped aviation sectors with fewer airlines operating at profitable margins. The investment in autonomous aircraft technology requires substantial financial resources and a stable market environment, which may not be present in these regions.
Without profitable and financially stable airlines, the incentives to invest in expensive, cutting-edge autonomous technologies are limited. Emerging economies' airline sector's inability to remain financially sustainable hinders the growth and adoption of autonomous aircraft markets in these regions.
High Costs of Autonomous Aircraft Platforms Impede Market Expansion
The high costs associated with developing and deploying autonomous aircraft platforms are a major impediment to the market's expansion. The research, development, and implementation of autonomous flying technologies involve significant investment in advanced systems, such as AI, sensors, and communication networks.
Additionally, the costs of regulatory compliance, safety certifications, and pilot training for new systems further escalate the expenses. For many airlines, especially smaller or budget carriers, these costs can be prohibitively high, making the transition to autonomous aircraft a challenging and potentially unprofitable venture. Consequently, the high financial barrier associated with autonomous aircraft platforms can limit their widespread adoption in the aviation industry.
Autonomous Aircraft Market Segmentation Analysis
By Aircraft Type
The rotary wing segment is currently the market leader in the autonomous aircraft sector. This dominance is primarily due to the versatility and maneuverability of rotary-wing aircraft, which makes them ideal for a variety of applications including urban air mobility, cargo transport, and search and rescue operations. The development of this segment is heavily influenced by advancements in vertical take-off and landing (VTOL) technologies, making them well-suited for operations in congested urban environments. Despite the challenges in noise reduction and energy efficiency, continuous technological advancements in rotorcraft design and hybrid-electric propulsion systems are expected to further bolster the segment's growth.
Fixed-wing autonomous aircraft, while not as dominant as rotary-wing aircraft, are significant for longer-range and higher-speed applications. This segment benefits from greater fuel efficiency and larger payload capacity, making them suitable for applications such as long-range cargo delivery, surveillance, and environmental monitoring. The success of this segment relies on the implementation of advanced navigation systems and improvements to aerodynamic efficiency.
By Autonomy Component
Software is the heart of autonomous aircraft and constitutes the largest segment of the market for components that enable autonomy. This encompasses algorithms for flight control, navigation, obstacle detection, and decision-making. The growth of this segment is propelled by advancements in AI, machine learning, and data analytics, which enhance the aircraft's ability to operate safely and efficiently in complex environments. The development of robust and reliable software is critical for regulatory approvals and public acceptance.
Other key components like cameras, ADIRU, intelligent servos, flight management computers, radars, transponders, propulsion systems, and actuation systems each play a vital role in the functionality and safety of autonomous aircraft. Un ongoing development in autonomous aircraft technology - including improved sensor accuracy and miniaturization - is vital to its growth and evolution in the market..
By Technology
Fully autonomous aircraft, capable of operating without human intervention, represent the most advanced segment in the market. This segment's development is driven by the need for increased operational efficiency, reduced human error, and the potential for cost savings in pilot training and manpower. The growth of fully autonomous aircraft hinges on technological advancements, regulatory approvals, and public trust.
The Increasingly Autonomous aircraft category - consisting of aircraft with various levels of autonomy - plays a vital role in the continued integration of autonomous technologies into aviation. This segment serves as a stepping stone towards full autonomy, allowing for incremental advancements and testing in real-world scenarios.
By End Use
The commercial aircraft segment leads the autonomous aircraft market. This includes passenger air vehicles and cargo delivery aircraft, which are expected to revolutionize urban mobility and logistics. The segment's growth is driven by the increasing demand for efficient, eco-friendly, and cost-effective transportation solutions. Integrating autonomous technologies in commercial aircraft is seen as key to meeting the ever-increasing global demand for air travel and cargo services.
Other end uses like passenger air vehicles, combat and ISR (Intelligence, Surveillance, Reconnaissance), air medical services, and personal air vehicles each contribute to the market's diversity. The adoption of autonomous technologies in these areas is influenced by specific requirements such as operational flexibility, rapid response times, and mission-critical reliability. Continuous advancements and approvals from regulators in this area are essential for the growth of the autonomous aircraft market.
Autonomous Aircraft Market Industry Segments
By Aircraft Type
- Rotary Wing
- Fixed Wing
By Autonomy Component
- Software
- Cameras
- Air Data Inertial Reference Units (ADIRU)
- Intelligent Servos
- Air Data Inertial Reference Units (ADIRU)
- Flight Management Computers
- Radars and Transponders
- Propulsion Systems
- Actuation System
By Technology
- Fully Autonomous
- Increasingly Autonomous (IA)
By End Use
- Commercial Aircraft
- Passenger Air Vehicle
- Combat and ISR
- Cargo and Delivery Aircraft
- Air Medical Services
- Personal Air Vehicle
- Others
Growth Opportunities
Cargo and Delivery Operations Propel Growth in the Autonomous Aircraft Market
The increasing demand for faster, more efficient, and cost-effective delivery solutions, especially for e-commerce, is driving interest in autonomous aerial vehicles. These aircraft can streamline logistics operations, particularly in areas where ground transport is challenging. Recent trends in drone and unmanned aerial vehicle (UAV) technology have shown promising developments in this area, suggesting a substantial market expansion as these autonomous systems become more integrated into commercial logistics and delivery networks.
Regional Connectivity Boosts Autonomous Aircraft Market
Enhancing regional connectivity through autonomous aircraft is a key driver for market growth. Autonomous aircraft, including passenger drones and air taxis, offer a solution to connect remote and underserved regions where traditional transportation infrastructure is limited or inefficient. These aircraft can provide critical connections for short-haul travel, offering a quick and accessible means of transport. The push for improved regional connectivity, coupled with advancements in autonomous aviation technology, indicates significant growth potential for the autonomous aircraft market, as they become an increasingly viable option for enhancing regional transportation networks.
Autonomous Aircraft Market Regional Analysis
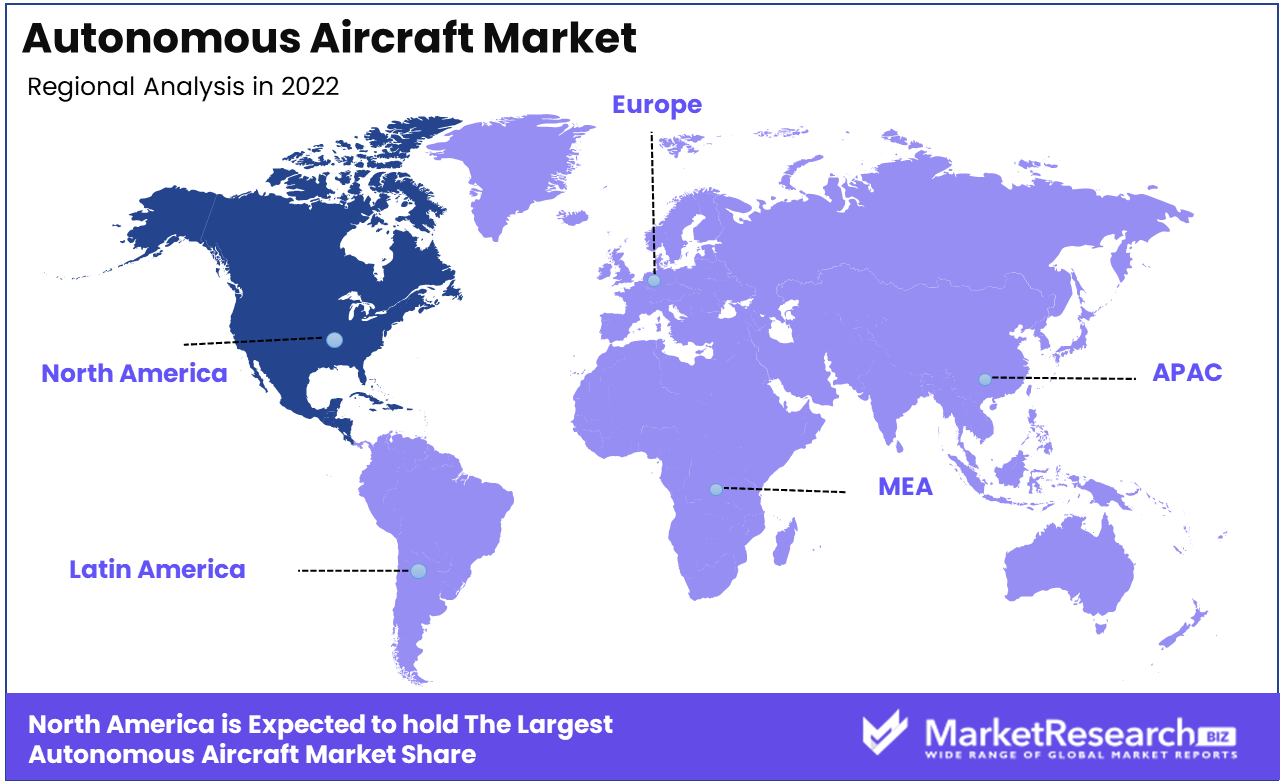
North America Dominates with 39.5% Market Share in Autonomous Aircraft Market
North America holds an astounding 39.5% market share for autonomous aircraft sales, driven by advanced aerospace technology and an enviable presence of industry players across both North American nations. The region's focus on innovation in aviation technology, particularly in unmanned aerial systems and autonomous flight capabilities, plays a critical role. With numerous major defense and aerospace contractors and military manufacturers based here, the United States plays an instrumental role in designing, testing, and deploying automated weapons systems. aircraft. Furthermore, its supportive regulatory environment and substantial investments in research and development provide for market expansion in this region.
The market dynamics in North America are influenced by the increasing demand for efficient and safe air transportation solutions. Military application of unmanned systems for surveillance, reconnaissance, and combat missions drives market expansion further; while urban air mobility solutions and the potential application of autonomous aircraft for commercial purposes shape its market landscape.
Europe Is A Pioneering in Aviation Technology and Safety
Europe’s autonomous aircraft market is driven by the region's pioneering efforts in aviation technology and a strong emphasis on safety and regulatory standards. European countries have been proactive in researching and developing autonomous flight technologies, with a focus on integrating these systems into the existing aviation framework. The collaboration among European aerospace companies and regulatory bodies supports the growth of the market.
Asia-Pacific's Rapid Technological Advancement and Growing Aviation Sector
In Asia-Pacific, the autonomous aircraft market is expanding rapidly, fueled by technological advancements and a growing aviation sector. Countries like China and Japan are investing in autonomous drone technology and exploring its applications in commercial air transport and logistics. Asia-Pacific's economic development, increased air traffic volume, and increasing interest in innovative air mobility solutions all play an integral part in driving its autonomous aircraft market forward.
Autonomous Aircraft Industry By Region
North America
- The US
- Canada
Europe
- Germany
- France
- The UK
- Spain
- Italy
- Russia
- Netherlands
- Rest of Europe
Asia-Pacific
- China
- Japan
- South Korea
- India
- New Zealand
- Singapore
- Thailand
- Vietnam
- Rest of Asia Pacific
Latin America
- Brazil
- Mexico
- Rest of Latin America
Middle East & Africa
- South Africa
- Saudi Arabia
- UAE
- Rest of the Middle East & Africa
Autonomous Aircraft Market Key Player Analysis
Autonomous Aircraft Market companies play an instrumental role in driving technological innovation and market development. Airbus S.A.S. and Boeing, as aerospace giants, are leading the charge in developing autonomous commercial and cargo aircraft, underscoring the industry's focus on enhancing efficiency and safety in aviation.
BAE Systems and Lockheed Martin Corporation, with their strong defense backgrounds, contribute significantly to the market through unmanned aerial vehicles (UAVs) and autonomous systems for military applications, reflecting the market's emphasis on security and surveillance capabilities.
Elbit Systems and Raytheon Technologies, known for their defense and aerospace technologies, play crucial roles in advancing autonomous flight systems and sensor technologies, vital for the operational success of autonomous aircraft. AeroVironment, Inc., specializing in small UAVs, showcases the market's innovation in compact and versatile aerial solutions, catering to both civilian and military needs.
Autonomous Aircraft Market Industry Key Players
- Airbus S.A.S.
- BAE Systems
- Boeing
- Elbit Systems
- AeroVironment, Inc.
- Embraer
- Lockheed Martin Corporation
- Northrop Grumman Corporation
- Raytheon Technologies
- Saab AB
Autonomous Aircraft Market Recent Development
- In September 2023, defense contractor Anduril announced its acquisition of aviation firm Blue Force Technologies, including its Fury drone design. Fury, initially pitched as a pilotless aggressor jet, gained importance as the U.S. military increasingly focused on autonomous uncrewed combat aircraft.
- In August 2023, the University of California, Davis, initiated groundbreaking research led by Professor Zhaodan Kong from the Department of Mechanical and Aerospace Engineering. The research focuses on early wildfire detection using a network of technological tools, including drones and ground sensors, to enhance firefighter safety and promote sustainability.
- In January 2023, Cirrus Aircraft introduced its Generation 2 (G2) version of Vision Jet, featuring Autothrottle, which integrates with the autopilot and can automatically adjust the aircraft's speed for different flight phases.
- In 2023, Xwing entered into a contract with the US Air Force as part of the AFWERX Autonomy Prime program. This Phase II Small Business Innovation Research (SBIR) contract involves autonomous flight trials using Xwing's Superpilot system to advance remotely supervised operations and optimize the technology for future defense missions.
Report Scope
Report Features Description Market Value (2023) USD 7.34 Billion Forecast Revenue (2033) USD 50.6 Billion CAGR (2024-2032) 21.9% Base Year for Estimation 2023 Historic Period 2016-2023 Forecast Period 2024-2033 Report Coverage Revenue Forecast, Market Dynamics, COVID-19 Impact, Competitive Landscape, Recent Developments Segments Covered By Aircraft Type(Rotary Wing, Fixed Wing), By Autonomy Component(Software, Cameras, Air Data Inertial Reference Units (ADIRU), Intelligent Servos, Air Data Inertial Reference Units (ADIRU), Flight Management Computers, Radars and Transponders, Propulsion Systems, Actuation System), By Technology(Fully Autonomous, Increasingly Autonomous (IA)), By End Use(Commercial Aircraft, Passenger Air Vehicle, Combat and ISR, Cargo and Delivery Aircraft, Air Medical Services, Personal Air Vehicle, Others) Regional Analysis North America - The US, Canada, Rest of North America, Europe - Germany, France, The UK, Spain, Italy, Russia, Netherlands, Rest of Europe, Asia-Pacific - China, Japan, South Korea, India, New Zealand, Singapore, Thailand, Vietnam, Rest of Asia Pacific, Latin America - Brazil, Mexico, Rest of Latin America, Middle East & Africa - South Africa, Saudi Arabia, UAE, Rest of Middle East & Africa Competitive Landscape Airbus S.A.S., BAE Systems, Boeing, Elbit Systems , AeroVironment, Inc., Embraer, Lockheed Martin Corporation, Northrop Grumman Corporation, Raytheon Technologies, Saab AB Customization Scope Customization for segments, region/country-level will be provided. Moreover, additional customization can be done based on the requirements. Purchase Options We have three licenses to opt for Single User License, Multi-User License (Up to 5 Users), Corporate Use License (Unlimited User and Printable PDF) -
- 1. Executive Summary
- 1.1. Definition
- 1.2. Taxonomy
- 1.3. Research Scope
- 1.4. Key Analysis
- 1.5. Key Findings by Major Segments
- 1.6. Top strategies by Major Players
- 2. Global Structural Health Monitoring Market Overview
- 2.1. Structural Health Monitoring Market Dynamics
- 2.1.1. Drivers
- 2.1.2. Opportunities
- 2.1.3. Restraints
- 2.1.4. Challenges
- 2.2. Macro-economic Factors
- 2.3. Regulatory Framework
- 2.4. Market Investment Feasibility Index
- 2.5. PEST Analysis
- 2.6. PORTER’S Five Force Analysis
- 2.7. Drivers & Restraints Impact Analysis
- 2.8. Industry Chain Analysis
- 2.9. Cost Structure Analysis
- 2.10. Marketing Strategy
- 2.11. Russia-Ukraine War Impact Analysis
- 2.12. Opportunity Map Analysis
- 2.13. Market Competition Scenario Analysis
- 2.14. Product Life Cycle Analysis
- 2.15. Opportunity Orbits
- 2.16. Manufacturer Intensity Map
- 2.17. Major Companies sales by Value & Volume
- 2.1. Structural Health Monitoring Market Dynamics
- 3. Global Structural Health Monitoring Market Analysis, Opportunity and Forecast, 2016-2032
- 3.1. Global Structural Health Monitoring Market Analysis, 2016-2021
- 3.2. Global Structural Health Monitoring Market Opportunity and Forecast, 2023-2032
- 3.3. Global Structural Health Monitoring Market Analysis, Opportunity and Forecast, By By Aircraft Type, 2016-2032
- 3.3.1. Global Structural Health Monitoring Market Analysis by By Aircraft Type: Introduction
- 3.3.2. Market Size Absolute $ Opportunity Analysis and Forecast, By By Aircraft Type, 2016-2032
- 3.3.3. Rotary Wing
- 3.3.4. Fixed Wing
- 3.4. Global Structural Health Monitoring Market Analysis, Opportunity and Forecast, By By Autonomy Component, 2016-2032
- 3.4.1. Global Structural Health Monitoring Market Analysis by By Autonomy Component: Introduction
- 3.4.2. Market Size Absolute $ Opportunity Analysis and Forecast, By By Autonomy Component, 2016-2032
- 3.4.3. Software
- 3.4.4. Cameras
- 3.4.5. Air Data Inertial Reference (US$ Mn & Units)s (ADIRU)
- 3.4.6. Intelligent Servos
- 3.4.7. Air Data Inertial Reference (US$ Mn & Units)s (ADIRU)
- 3.4.8. Flight Management Computers
- 3.4.9. Radars and Transponders
- 3.4.10. Propulsion Systems
- 3.4.11. Actuation System
- 3.5. Global Structural Health Monitoring Market Analysis, Opportunity and Forecast, By By Technology, 2016-2032
- 3.5.1. Global Structural Health Monitoring Market Analysis by By Technology: Introduction
- 3.5.2. Market Size Absolute $ Opportunity Analysis and Forecast, By By Technology, 2016-2032
- 3.5.3. Fully Autonomous
- 3.5.4. Increasingly Autonomous (IA)
- 3.6. Global Structural Health Monitoring Market Analysis, Opportunity and Forecast, By By End Use, 2016-2032
- 3.6.1. Global Structural Health Monitoring Market Analysis by By End Use: Introduction
- 3.6.2. Market Size Absolute $ Opportunity Analysis and Forecast, By By End Use, 2016-2032
- 3.6.3. Commercial Aircraft
- 3.6.4. Passenger Air Vehicle
- 3.6.5. Combat and ISR
- 3.6.6. Cargo and Delivery Aircraft
- 3.6.7. Air Medical Services
- 3.6.8. Personal Air Vehicle
- 3.6.9. Others
- 4. North America Structural Health Monitoring Market Analysis, Opportunity and Forecast, 2016-2032
- 4.1. North America Structural Health Monitoring Market Analysis, 2016-2021
- 4.2. North America Structural Health Monitoring Market Opportunity and Forecast, 2023-2032
- 4.3. North America Structural Health Monitoring Market Analysis, Opportunity and Forecast, By By Aircraft Type, 2016-2032
- 4.3.1. North America Structural Health Monitoring Market Analysis by By Aircraft Type: Introduction
- 4.3.2. Market Size Absolute $ Opportunity Analysis and Forecast, By By Aircraft Type, 2016-2032
- 4.3.3. Rotary Wing
- 4.3.4. Fixed Wing
- 4.4. North America Structural Health Monitoring Market Analysis, Opportunity and Forecast, By By Autonomy Component, 2016-2032
- 4.4.1. North America Structural Health Monitoring Market Analysis by By Autonomy Component: Introduction
- 4.4.2. Market Size Absolute $ Opportunity Analysis and Forecast, By By Autonomy Component, 2016-2032
- 4.4.3. Software
- 4.4.4. Cameras
- 4.4.5. Air Data Inertial Reference (US$ Mn & Units)s (ADIRU)
- 4.4.6. Intelligent Servos
- 4.4.7. Air Data Inertial Reference (US$ Mn & Units)s (ADIRU)
- 4.4.8. Flight Management Computers
- 4.4.9. Radars and Transponders
- 4.4.10. Propulsion Systems
- 4.4.11. Actuation System
- 4.5. North America Structural Health Monitoring Market Analysis, Opportunity and Forecast, By By Technology, 2016-2032
- 4.5.1. North America Structural Health Monitoring Market Analysis by By Technology: Introduction
- 4.5.2. Market Size Absolute $ Opportunity Analysis and Forecast, By By Technology, 2016-2032
- 4.5.3. Fully Autonomous
- 4.5.4. Increasingly Autonomous (IA)
- 4.6. North America Structural Health Monitoring Market Analysis, Opportunity and Forecast, By By End Use, 2016-2032
- 4.6.1. North America Structural Health Monitoring Market Analysis by By End Use: Introduction
- 4.6.2. Market Size Absolute $ Opportunity Analysis and Forecast, By By End Use, 2016-2032
- 4.6.3. Commercial Aircraft
- 4.6.4. Passenger Air Vehicle
- 4.6.5. Combat and ISR
- 4.6.6. Cargo and Delivery Aircraft
- 4.6.7. Air Medical Services
- 4.6.8. Personal Air Vehicle
- 4.6.9. Others
- 4.7. North America Structural Health Monitoring Market Analysis, Opportunity and Forecast, By Country , 2016-2032
- 4.7.1. North America Structural Health Monitoring Market Analysis by Country : Introduction
- 4.7.2. Market Size Absolute $ Opportunity Analysis and Forecast, Country , 2016-2032
- 4.7.2.1. The US
- 4.7.2.2. Canada
- 4.7.2.3. Mexico
- 5. Western Europe Structural Health Monitoring Market Analysis, Opportunity and Forecast, 2016-2032
- 5.1. Western Europe Structural Health Monitoring Market Analysis, 2016-2021
- 5.2. Western Europe Structural Health Monitoring Market Opportunity and Forecast, 2023-2032
- 5.3. Western Europe Structural Health Monitoring Market Analysis, Opportunity and Forecast, By By Aircraft Type, 2016-2032
- 5.3.1. Western Europe Structural Health Monitoring Market Analysis by By Aircraft Type: Introduction
- 5.3.2. Market Size Absolute $ Opportunity Analysis and Forecast, By By Aircraft Type, 2016-2032
- 5.3.3. Rotary Wing
- 5.3.4. Fixed Wing
- 5.4. Western Europe Structural Health Monitoring Market Analysis, Opportunity and Forecast, By By Autonomy Component, 2016-2032
- 5.4.1. Western Europe Structural Health Monitoring Market Analysis by By Autonomy Component: Introduction
- 5.4.2. Market Size Absolute $ Opportunity Analysis and Forecast, By By Autonomy Component, 2016-2032
- 5.4.3. Software
- 5.4.4. Cameras
- 5.4.5. Air Data Inertial Reference (US$ Mn & Units)s (ADIRU)
- 5.4.6. Intelligent Servos
- 5.4.7. Air Data Inertial Reference (US$ Mn & Units)s (ADIRU)
- 5.4.8. Flight Management Computers
- 5.4.9. Radars and Transponders
- 5.4.10. Propulsion Systems
- 5.4.11. Actuation System
- 5.5. Western Europe Structural Health Monitoring Market Analysis, Opportunity and Forecast, By By Technology, 2016-2032
- 5.5.1. Western Europe Structural Health Monitoring Market Analysis by By Technology: Introduction
- 5.5.2. Market Size Absolute $ Opportunity Analysis and Forecast, By By Technology, 2016-2032
- 5.5.3. Fully Autonomous
- 5.5.4. Increasingly Autonomous (IA)
- 5.6. Western Europe Structural Health Monitoring Market Analysis, Opportunity and Forecast, By By End Use, 2016-2032
- 5.6.1. Western Europe Structural Health Monitoring Market Analysis by By End Use: Introduction
- 5.6.2. Market Size Absolute $ Opportunity Analysis and Forecast, By By End Use, 2016-2032
- 5.6.3. Commercial Aircraft
- 5.6.4. Passenger Air Vehicle
- 5.6.5. Combat and ISR
- 5.6.6. Cargo and Delivery Aircraft
- 5.6.7. Air Medical Services
- 5.6.8. Personal Air Vehicle
- 5.6.9. Others
- 5.7. Western Europe Structural Health Monitoring Market Analysis, Opportunity and Forecast, By Country , 2016-2032
- 5.7.1. Western Europe Structural Health Monitoring Market Analysis by Country : Introduction
- 5.7.2. Market Size Absolute $ Opportunity Analysis and Forecast, Country , 2016-2032
- 5.7.2.1. Germany
- 5.7.2.2. France
- 5.7.2.3. The UK
- 5.7.2.4. Spain
- 5.7.2.5. Italy
- 5.7.2.6. Portugal
- 5.7.2.7. Ireland
- 5.7.2.8. Austria
- 5.7.2.9. Switzerland
- 5.7.2.10. Benelux
- 5.7.2.11. Nordic
- 5.7.2.12. Rest of Western Europe
- 6. Eastern Europe Structural Health Monitoring Market Analysis, Opportunity and Forecast, 2016-2032
- 6.1. Eastern Europe Structural Health Monitoring Market Analysis, 2016-2021
- 6.2. Eastern Europe Structural Health Monitoring Market Opportunity and Forecast, 2023-2032
- 6.3. Eastern Europe Structural Health Monitoring Market Analysis, Opportunity and Forecast, By By Aircraft Type, 2016-2032
- 6.3.1. Eastern Europe Structural Health Monitoring Market Analysis by By Aircraft Type: Introduction
- 6.3.2. Market Size Absolute $ Opportunity Analysis and Forecast, By By Aircraft Type, 2016-2032
- 6.3.3. Rotary Wing
- 6.3.4. Fixed Wing
- 6.4. Eastern Europe Structural Health Monitoring Market Analysis, Opportunity and Forecast, By By Autonomy Component, 2016-2032
- 6.4.1. Eastern Europe Structural Health Monitoring Market Analysis by By Autonomy Component: Introduction
- 6.4.2. Market Size Absolute $ Opportunity Analysis and Forecast, By By Autonomy Component, 2016-2032
- 6.4.3. Software
- 6.4.4. Cameras
- 6.4.5. Air Data Inertial Reference (US$ Mn & Units)s (ADIRU)
- 6.4.6. Intelligent Servos
- 6.4.7. Air Data Inertial Reference (US$ Mn & Units)s (ADIRU)
- 6.4.8. Flight Management Computers
- 6.4.9. Radars and Transponders
- 6.4.10. Propulsion Systems
- 6.4.11. Actuation System
- 6.5. Eastern Europe Structural Health Monitoring Market Analysis, Opportunity and Forecast, By By Technology, 2016-2032
- 6.5.1. Eastern Europe Structural Health Monitoring Market Analysis by By Technology: Introduction
- 6.5.2. Market Size Absolute $ Opportunity Analysis and Forecast, By By Technology, 2016-2032
- 6.5.3. Fully Autonomous
- 6.5.4. Increasingly Autonomous (IA)
- 6.6. Eastern Europe Structural Health Monitoring Market Analysis, Opportunity and Forecast, By By End Use, 2016-2032
- 6.6.1. Eastern Europe Structural Health Monitoring Market Analysis by By End Use: Introduction
- 6.6.2. Market Size Absolute $ Opportunity Analysis and Forecast, By By End Use, 2016-2032
- 6.6.3. Commercial Aircraft
- 6.6.4. Passenger Air Vehicle
- 6.6.5. Combat and ISR
- 6.6.6. Cargo and Delivery Aircraft
- 6.6.7. Air Medical Services
- 6.6.8. Personal Air Vehicle
- 6.6.9. Others
- 6.7. Eastern Europe Structural Health Monitoring Market Analysis, Opportunity and Forecast, By Country , 2016-2032
- 6.7.1. Eastern Europe Structural Health Monitoring Market Analysis by Country : Introduction
- 6.7.2. Market Size Absolute $ Opportunity Analysis and Forecast, Country , 2016-2032
- 6.7.2.1. Russia
- 6.7.2.2. Poland
- 6.7.2.3. The Czech Republic
- 6.7.2.4. Greece
- 6.7.2.5. Rest of Eastern Europe
- 7. APAC Structural Health Monitoring Market Analysis, Opportunity and Forecast, 2016-2032
- 7.1. APAC Structural Health Monitoring Market Analysis, 2016-2021
- 7.2. APAC Structural Health Monitoring Market Opportunity and Forecast, 2023-2032
- 7.3. APAC Structural Health Monitoring Market Analysis, Opportunity and Forecast, By By Aircraft Type, 2016-2032
- 7.3.1. APAC Structural Health Monitoring Market Analysis by By Aircraft Type: Introduction
- 7.3.2. Market Size Absolute $ Opportunity Analysis and Forecast, By By Aircraft Type, 2016-2032
- 7.3.3. Rotary Wing
- 7.3.4. Fixed Wing
- 7.4. APAC Structural Health Monitoring Market Analysis, Opportunity and Forecast, By By Autonomy Component, 2016-2032
- 7.4.1. APAC Structural Health Monitoring Market Analysis by By Autonomy Component: Introduction
- 7.4.2. Market Size Absolute $ Opportunity Analysis and Forecast, By By Autonomy Component, 2016-2032
- 7.4.3. Software
- 7.4.4. Cameras
- 7.4.5. Air Data Inertial Reference (US$ Mn & Units)s (ADIRU)
- 7.4.6. Intelligent Servos
- 7.4.7. Air Data Inertial Reference (US$ Mn & Units)s (ADIRU)
- 7.4.8. Flight Management Computers
- 7.4.9. Radars and Transponders
- 7.4.10. Propulsion Systems
- 7.4.11. Actuation System
- 7.5. APAC Structural Health Monitoring Market Analysis, Opportunity and Forecast, By By Technology, 2016-2032
- 7.5.1. APAC Structural Health Monitoring Market Analysis by By Technology: Introduction
- 7.5.2. Market Size Absolute $ Opportunity Analysis and Forecast, By By Technology, 2016-2032
- 7.5.3. Fully Autonomous
- 7.5.4. Increasingly Autonomous (IA)
- 7.6. APAC Structural Health Monitoring Market Analysis, Opportunity and Forecast, By By End Use, 2016-2032
- 7.6.1. APAC Structural Health Monitoring Market Analysis by By End Use: Introduction
- 7.6.2. Market Size Absolute $ Opportunity Analysis and Forecast, By By End Use, 2016-2032
- 7.6.3. Commercial Aircraft
- 7.6.4. Passenger Air Vehicle
- 7.6.5. Combat and ISR
- 7.6.6. Cargo and Delivery Aircraft
- 7.6.7. Air Medical Services
- 7.6.8. Personal Air Vehicle
- 7.6.9. Others
- 7.7. APAC Structural Health Monitoring Market Analysis, Opportunity and Forecast, By Country , 2016-2032
- 7.7.1. APAC Structural Health Monitoring Market Analysis by Country : Introduction
- 7.7.2. Market Size Absolute $ Opportunity Analysis and Forecast, Country , 2016-2032
- 7.7.2.1. China
- 7.7.2.2. Japan
- 7.7.2.3. South Korea
- 7.7.2.4. India
- 7.7.2.5. Australia & New Zeland
- 7.7.2.6. Indonesia
- 7.7.2.7. Malaysia
- 7.7.2.8. Philippines
- 7.7.2.9. Singapore
- 7.7.2.10. Thailand
- 7.7.2.11. Vietnam
- 7.7.2.12. Rest of APAC
- 8. Latin America Structural Health Monitoring Market Analysis, Opportunity and Forecast, 2016-2032
- 8.1. Latin America Structural Health Monitoring Market Analysis, 2016-2021
- 8.2. Latin America Structural Health Monitoring Market Opportunity and Forecast, 2023-2032
- 8.3. Latin America Structural Health Monitoring Market Analysis, Opportunity and Forecast, By By Aircraft Type, 2016-2032
- 8.3.1. Latin America Structural Health Monitoring Market Analysis by By Aircraft Type: Introduction
- 8.3.2. Market Size Absolute $ Opportunity Analysis and Forecast, By By Aircraft Type, 2016-2032
- 8.3.3. Rotary Wing
- 8.3.4. Fixed Wing
- 8.4. Latin America Structural Health Monitoring Market Analysis, Opportunity and Forecast, By By Autonomy Component, 2016-2032
- 8.4.1. Latin America Structural Health Monitoring Market Analysis by By Autonomy Component: Introduction
- 8.4.2. Market Size Absolute $ Opportunity Analysis and Forecast, By By Autonomy Component, 2016-2032
- 8.4.3. Software
- 8.4.4. Cameras
- 8.4.5. Air Data Inertial Reference (US$ Mn & Units)s (ADIRU)
- 8.4.6. Intelligent Servos
- 8.4.7. Air Data Inertial Reference (US$ Mn & Units)s (ADIRU)
- 8.4.8. Flight Management Computers
- 8.4.9. Radars and Transponders
- 8.4.10. Propulsion Systems
- 8.4.11. Actuation System
- 8.5. Latin America Structural Health Monitoring Market Analysis, Opportunity and Forecast, By By Technology, 2016-2032
- 8.5.1. Latin America Structural Health Monitoring Market Analysis by By Technology: Introduction
- 8.5.2. Market Size Absolute $ Opportunity Analysis and Forecast, By By Technology, 2016-2032
- 8.5.3. Fully Autonomous
- 8.5.4. Increasingly Autonomous (IA)
- 8.6. Latin America Structural Health Monitoring Market Analysis, Opportunity and Forecast, By By End Use, 2016-2032
- 8.6.1. Latin America Structural Health Monitoring Market Analysis by By End Use: Introduction
- 8.6.2. Market Size Absolute $ Opportunity Analysis and Forecast, By By End Use, 2016-2032
- 8.6.3. Commercial Aircraft
- 8.6.4. Passenger Air Vehicle
- 8.6.5. Combat and ISR
- 8.6.6. Cargo and Delivery Aircraft
- 8.6.7. Air Medical Services
- 8.6.8. Personal Air Vehicle
- 8.6.9. Others
- 8.7. Latin America Structural Health Monitoring Market Analysis, Opportunity and Forecast, By Country , 2016-2032
- 8.7.1. Latin America Structural Health Monitoring Market Analysis by Country : Introduction
- 8.7.2. Market Size Absolute $ Opportunity Analysis and Forecast, Country , 2016-2032
- 8.7.2.1. Brazil
- 8.7.2.2. Colombia
- 8.7.2.3. Chile
- 8.7.2.4. Argentina
- 8.7.2.5. Costa Rica
- 8.7.2.6. Rest of Latin America
- 9. Middle East & Africa Structural Health Monitoring Market Analysis, Opportunity and Forecast, 2016-2032
- 9.1. Middle East & Africa Structural Health Monitoring Market Analysis, 2016-2021
- 9.2. Middle East & Africa Structural Health Monitoring Market Opportunity and Forecast, 2023-2032
- 9.3. Middle East & Africa Structural Health Monitoring Market Analysis, Opportunity and Forecast, By By Aircraft Type, 2016-2032
- 9.3.1. Middle East & Africa Structural Health Monitoring Market Analysis by By Aircraft Type: Introduction
- 9.3.2. Market Size Absolute $ Opportunity Analysis and Forecast, By By Aircraft Type, 2016-2032
- 9.3.3. Rotary Wing
- 9.3.4. Fixed Wing
- 9.4. Middle East & Africa Structural Health Monitoring Market Analysis, Opportunity and Forecast, By By Autonomy Component, 2016-2032
- 9.4.1. Middle East & Africa Structural Health Monitoring Market Analysis by By Autonomy Component: Introduction
- 9.4.2. Market Size Absolute $ Opportunity Analysis and Forecast, By By Autonomy Component, 2016-2032
- 9.4.3. Software
- 9.4.4. Cameras
- 9.4.5. Air Data Inertial Reference (US$ Mn & Units)s (ADIRU)
- 9.4.6. Intelligent Servos
- 9.4.7. Air Data Inertial Reference (US$ Mn & Units)s (ADIRU)
- 9.4.8. Flight Management Computers
- 9.4.9. Radars and Transponders
- 9.4.10. Propulsion Systems
- 9.4.11. Actuation System
- 9.5. Middle East & Africa Structural Health Monitoring Market Analysis, Opportunity and Forecast, By By Technology, 2016-2032
- 9.5.1. Middle East & Africa Structural Health Monitoring Market Analysis by By Technology: Introduction
- 9.5.2. Market Size Absolute $ Opportunity Analysis and Forecast, By By Technology, 2016-2032
- 9.5.3. Fully Autonomous
- 9.5.4. Increasingly Autonomous (IA)
- 9.6. Middle East & Africa Structural Health Monitoring Market Analysis, Opportunity and Forecast, By By End Use, 2016-2032
- 9.6.1. Middle East & Africa Structural Health Monitoring Market Analysis by By End Use: Introduction
- 9.6.2. Market Size Absolute $ Opportunity Analysis and Forecast, By By End Use, 2016-2032
- 9.6.3. Commercial Aircraft
- 9.6.4. Passenger Air Vehicle
- 9.6.5. Combat and ISR
- 9.6.6. Cargo and Delivery Aircraft
- 9.6.7. Air Medical Services
- 9.6.8. Personal Air Vehicle
- 9.6.9. Others
- 9.7. Middle East & Africa Structural Health Monitoring Market Analysis, Opportunity and Forecast, By Country , 2016-2032
- 9.7.1. Middle East & Africa Structural Health Monitoring Market Analysis by Country : Introduction
- 9.7.2. Market Size Absolute $ Opportunity Analysis and Forecast, Country , 2016-2032
- 9.7.2.1. Algeria
- 9.7.2.2. Egypt
- 9.7.2.3. Israel
- 9.7.2.4. Kuwait
- 9.7.2.5. Nigeria
- 9.7.2.6. Saudi Arabia
- 9.7.2.7. South Africa
- 9.7.2.8. Turkey
- 9.7.2.9. The UAE
- 9.7.2.10. Rest of MEA
- 10. Global Structural Health Monitoring Market Analysis, Opportunity and Forecast, By Region , 2016-2032
- 10.1. Global Structural Health Monitoring Market Analysis by Region : Introduction
- 10.2. Market Size Absolute $ Opportunity Analysis and Forecast, By Region , 2016-2032
- 10.2.1. North America
- 10.2.2. Western Europe
- 10.2.3. Eastern Europe
- 10.2.4. APAC
- 10.2.5. Latin America
- 10.2.6. Middle East & Africa
- 11. Global Structural Health Monitoring Market Competitive Landscape, Market Share Analysis, and Company Profiles
- 11.1. Market Share Analysis
- 11.2. Company Profiles
- 11.3. Airbus S.A.S.
- 11.3.1. Company Overview
- 11.3.2. Financial Highlights
- 11.3.3. Product Portfolio
- 11.3.4. SWOT Analysis
- 11.3.5. Key Strategies and Developments
- 11.4. BAE Systems
- 11.4.1. Company Overview
- 11.4.2. Financial Highlights
- 11.4.3. Product Portfolio
- 11.4.4. SWOT Analysis
- 11.4.5. Key Strategies and Developments
- 11.5. Boeing
- 11.5.1. Company Overview
- 11.5.2. Financial Highlights
- 11.5.3. Product Portfolio
- 11.5.4. SWOT Analysis
- 11.5.5. Key Strategies and Developments
- 11.6. Elbit Systems
- 11.6.1. Company Overview
- 11.6.2. Financial Highlights
- 11.6.3. Product Portfolio
- 11.6.4. SWOT Analysis
- 11.6.5. Key Strategies and Developments
- 11.7. AeroVironment, Inc.
- 11.7.1. Company Overview
- 11.7.2. Financial Highlights
- 11.7.3. Product Portfolio
- 11.7.4. SWOT Analysis
- 11.7.5. Key Strategies and Developments
- 11.8. Embraer
- 11.8.1. Company Overview
- 11.8.2. Financial Highlights
- 11.8.3. Product Portfolio
- 11.8.4. SWOT Analysis
- 11.8.5. Key Strategies and Developments
- 11.9. Lockheed Martin Corporation
- 11.9.1. Company Overview
- 11.9.2. Financial Highlights
- 11.9.3. Product Portfolio
- 11.9.4. SWOT Analysis
- 11.9.5. Key Strategies and Developments
- 11.10. Northrop Grumman Corporation
- 11.10.1. Company Overview
- 11.10.2. Financial Highlights
- 11.10.3. Product Portfolio
- 11.10.4. SWOT Analysis
- 11.10.5. Key Strategies and Developments
- 11.11. Raytheon Technologies
- 11.11.1. Company Overview
- 11.11.2. Financial Highlights
- 11.11.3. Product Portfolio
- 11.11.4. SWOT Analysis
- 11.11.5. Key Strategies and Developments
- 11.12. Saab AB
- 11.12.1. Company Overview
- 11.12.2. Financial Highlights
- 11.12.3. Product Portfolio
- 11.12.4. SWOT Analysis
- 11.12.5. Key Strategies and Developments
- 11.13.1. Company Overview
- 11.13.2. Financial Highlights
- 11.13.3. Product Portfolio
- 11.13.4. SWOT Analysis
- 11.13.5. Key Strategies and Developments
- 12. Assumptions and Acronyms
- 13. Research Methodology
- 14. Contact
"
- List of Figures
- "
- Figure 1: Global Structural Health Monitoring Market Revenue (US$ Mn) Market Share by By Aircraft Type in 2022
- Figure 2: Global Structural Health Monitoring Market Market Attractiveness Analysis by By Aircraft Type, 2016-2032
- Figure 3: Global Structural Health Monitoring Market Revenue (US$ Mn) Market Share by By Autonomy Componentin 2022
- Figure 4: Global Structural Health Monitoring Market Market Attractiveness Analysis by By Autonomy Component, 2016-2032
- Figure 5: Global Structural Health Monitoring Market Revenue (US$ Mn) Market Share by By Technologyin 2022
- Figure 6: Global Structural Health Monitoring Market Market Attractiveness Analysis by By Technology, 2016-2032
- Figure 7: Global Structural Health Monitoring Market Revenue (US$ Mn) Market Share by By End Usein 2022
- Figure 8: Global Structural Health Monitoring Market Market Attractiveness Analysis by By End Use, 2016-2032
- Figure 9: Global Structural Health Monitoring Market Revenue (US$ Mn) Market Share by Region in 2022
- Figure 10: Global Structural Health Monitoring Market Market Attractiveness Analysis by Region, 2016-2032
- Figure 11: Global Structural Health Monitoring Market Market Revenue (US$ Mn) (2016-2032)
- Figure 12: Global Structural Health Monitoring Market Market Revenue (US$ Mn) Comparison by Region (2016-2032)
- Figure 13: Global Structural Health Monitoring Market Market Revenue (US$ Mn) Comparison by By Aircraft Type (2016-2032)
- Figure 14: Global Structural Health Monitoring Market Market Revenue (US$ Mn) Comparison by By Autonomy Component (2016-2032)
- Figure 15: Global Structural Health Monitoring Market Market Revenue (US$ Mn) Comparison by By Technology (2016-2032)
- Figure 16: Global Structural Health Monitoring Market Market Revenue (US$ Mn) Comparison by By End Use (2016-2032)
- Figure 17: Global Structural Health Monitoring Market Market Y-o-Y Growth Rate Comparison by Region (2016-2032)
- Figure 18: Global Structural Health Monitoring Market Market Y-o-Y Growth Rate Comparison by By Aircraft Type (2016-2032)
- Figure 19: Global Structural Health Monitoring Market Market Y-o-Y Growth Rate Comparison by By Autonomy Component (2016-2032)
- Figure 20: Global Structural Health Monitoring Market Market Y-o-Y Growth Rate Comparison by By Technology (2016-2032)
- Figure 21: Global Structural Health Monitoring Market Market Y-o-Y Growth Rate Comparison by By End Use (2016-2032)
- Figure 22: Global Structural Health Monitoring Market Market Share Comparison by Region (2016-2032)
- Figure 23: Global Structural Health Monitoring Market Market Share Comparison by By Aircraft Type (2016-2032)
- Figure 24: Global Structural Health Monitoring Market Market Share Comparison by By Autonomy Component (2016-2032)
- Figure 25: Global Structural Health Monitoring Market Market Share Comparison by By Technology (2016-2032)
- Figure 26: Global Structural Health Monitoring Market Market Share Comparison by By End Use (2016-2032)
- Figure 27: North America Structural Health Monitoring Market Revenue (US$ Mn) Market Share by By Aircraft Typein 2022
- Figure 28: North America Structural Health Monitoring Market Market Attractiveness Analysis by By Aircraft Type, 2016-2032
- Figure 29: North America Structural Health Monitoring Market Revenue (US$ Mn) Market Share by By Autonomy Componentin 2022
- Figure 30: North America Structural Health Monitoring Market Market Attractiveness Analysis by By Autonomy Component, 2016-2032
- Figure 31: North America Structural Health Monitoring Market Revenue (US$ Mn) Market Share by By Technologyin 2022
- Figure 32: North America Structural Health Monitoring Market Market Attractiveness Analysis by By Technology, 2016-2032
- Figure 33: North America Structural Health Monitoring Market Revenue (US$ Mn) Market Share by By End Usein 2022
- Figure 34: North America Structural Health Monitoring Market Market Attractiveness Analysis by By End Use, 2016-2032
- Figure 35: North America Structural Health Monitoring Market Revenue (US$ Mn) Market Share by Country in 2022
- Figure 36: North America Structural Health Monitoring Market Market Attractiveness Analysis by Country, 2016-2032
- Figure 37: North America Structural Health Monitoring Market Market Revenue (US$ Mn) (2016-2032)
- Figure 38: North America Structural Health Monitoring Market Market Revenue (US$ Mn) Comparison by Country (2016-2032)
- Figure 39: North America Structural Health Monitoring Market Market Revenue (US$ Mn) Comparison by By Aircraft Type (2016-2032)
- Figure 40: North America Structural Health Monitoring Market Market Revenue (US$ Mn) Comparison by By Autonomy Component (2016-2032)
- Figure 41: North America Structural Health Monitoring Market Market Revenue (US$ Mn) Comparison by By Technology (2016-2032)
- Figure 42: North America Structural Health Monitoring Market Market Revenue (US$ Mn) Comparison by By End Use (2016-2032)
- Figure 43: North America Structural Health Monitoring Market Market Y-o-Y Growth Rate Comparison by Country (2016-2032)
- Figure 44: North America Structural Health Monitoring Market Market Y-o-Y Growth Rate Comparison by By Aircraft Type (2016-2032)
- Figure 45: North America Structural Health Monitoring Market Market Y-o-Y Growth Rate Comparison by By Autonomy Component (2016-2032)
- Figure 46: North America Structural Health Monitoring Market Market Y-o-Y Growth Rate Comparison by By Technology (2016-2032)
- Figure 47: North America Structural Health Monitoring Market Market Y-o-Y Growth Rate Comparison by By End Use (2016-2032)
- Figure 48: North America Structural Health Monitoring Market Market Share Comparison by Country (2016-2032)
- Figure 49: North America Structural Health Monitoring Market Market Share Comparison by By Aircraft Type (2016-2032)
- Figure 50: North America Structural Health Monitoring Market Market Share Comparison by By Autonomy Component (2016-2032)
- Figure 51: North America Structural Health Monitoring Market Market Share Comparison by By Technology (2016-2032)
- Figure 52: North America Structural Health Monitoring Market Market Share Comparison by By End Use (2016-2032)
- Figure 53: Western Europe Structural Health Monitoring Market Revenue (US$ Mn) Market Share by By Aircraft Typein 2022
- Figure 54: Western Europe Structural Health Monitoring Market Market Attractiveness Analysis by By Aircraft Type, 2016-2032
- Figure 55: Western Europe Structural Health Monitoring Market Revenue (US$ Mn) Market Share by By Autonomy Componentin 2022
- Figure 56: Western Europe Structural Health Monitoring Market Market Attractiveness Analysis by By Autonomy Component, 2016-2032
- Figure 57: Western Europe Structural Health Monitoring Market Revenue (US$ Mn) Market Share by By Technologyin 2022
- Figure 58: Western Europe Structural Health Monitoring Market Market Attractiveness Analysis by By Technology, 2016-2032
- Figure 59: Western Europe Structural Health Monitoring Market Revenue (US$ Mn) Market Share by By End Usein 2022
- Figure 60: Western Europe Structural Health Monitoring Market Market Attractiveness Analysis by By End Use, 2016-2032
- Figure 61: Western Europe Structural Health Monitoring Market Revenue (US$ Mn) Market Share by Country in 2022
- Figure 62: Western Europe Structural Health Monitoring Market Market Attractiveness Analysis by Country, 2016-2032
- Figure 63: Western Europe Structural Health Monitoring Market Market Revenue (US$ Mn) (2016-2032)
- Figure 64: Western Europe Structural Health Monitoring Market Market Revenue (US$ Mn) Comparison by Country (2016-2032)
- Figure 65: Western Europe Structural Health Monitoring Market Market Revenue (US$ Mn) Comparison by By Aircraft Type (2016-2032)
- Figure 66: Western Europe Structural Health Monitoring Market Market Revenue (US$ Mn) Comparison by By Autonomy Component (2016-2032)
- Figure 67: Western Europe Structural Health Monitoring Market Market Revenue (US$ Mn) Comparison by By Technology (2016-2032)
- Figure 68: Western Europe Structural Health Monitoring Market Market Revenue (US$ Mn) Comparison by By End Use (2016-2032)
- Figure 69: Western Europe Structural Health Monitoring Market Market Y-o-Y Growth Rate Comparison by Country (2016-2032)
- Figure 70: Western Europe Structural Health Monitoring Market Market Y-o-Y Growth Rate Comparison by By Aircraft Type (2016-2032)
- Figure 71: Western Europe Structural Health Monitoring Market Market Y-o-Y Growth Rate Comparison by By Autonomy Component (2016-2032)
- Figure 72: Western Europe Structural Health Monitoring Market Market Y-o-Y Growth Rate Comparison by By Technology (2016-2032)
- Figure 73: Western Europe Structural Health Monitoring Market Market Y-o-Y Growth Rate Comparison by By End Use (2016-2032)
- Figure 74: Western Europe Structural Health Monitoring Market Market Share Comparison by Country (2016-2032)
- Figure 75: Western Europe Structural Health Monitoring Market Market Share Comparison by By Aircraft Type (2016-2032)
- Figure 76: Western Europe Structural Health Monitoring Market Market Share Comparison by By Autonomy Component (2016-2032)
- Figure 77: Western Europe Structural Health Monitoring Market Market Share Comparison by By Technology (2016-2032)
- Figure 78: Western Europe Structural Health Monitoring Market Market Share Comparison by By End Use (2016-2032)
- Figure 79: Eastern Europe Structural Health Monitoring Market Revenue (US$ Mn) Market Share by By Aircraft Typein 2022
- Figure 80: Eastern Europe Structural Health Monitoring Market Market Attractiveness Analysis by By Aircraft Type, 2016-2032
- Figure 81: Eastern Europe Structural Health Monitoring Market Revenue (US$ Mn) Market Share by By Autonomy Componentin 2022
- Figure 82: Eastern Europe Structural Health Monitoring Market Market Attractiveness Analysis by By Autonomy Component, 2016-2032
- Figure 83: Eastern Europe Structural Health Monitoring Market Revenue (US$ Mn) Market Share by By Technologyin 2022
- Figure 84: Eastern Europe Structural Health Monitoring Market Market Attractiveness Analysis by By Technology, 2016-2032
- Figure 85: Eastern Europe Structural Health Monitoring Market Revenue (US$ Mn) Market Share by By End Usein 2022
- Figure 86: Eastern Europe Structural Health Monitoring Market Market Attractiveness Analysis by By End Use, 2016-2032
- Figure 87: Eastern Europe Structural Health Monitoring Market Revenue (US$ Mn) Market Share by Country in 2022
- Figure 88: Eastern Europe Structural Health Monitoring Market Market Attractiveness Analysis by Country, 2016-2032
- Figure 89: Eastern Europe Structural Health Monitoring Market Market Revenue (US$ Mn) (2016-2032)
- Figure 90: Eastern Europe Structural Health Monitoring Market Market Revenue (US$ Mn) Comparison by Country (2016-2032)
- Figure 91: Eastern Europe Structural Health Monitoring Market Market Revenue (US$ Mn) Comparison by By Aircraft Type (2016-2032)
- Figure 92: Eastern Europe Structural Health Monitoring Market Market Revenue (US$ Mn) Comparison by By Autonomy Component (2016-2032)
- Figure 93: Eastern Europe Structural Health Monitoring Market Market Revenue (US$ Mn) Comparison by By Technology (2016-2032)
- Figure 94: Eastern Europe Structural Health Monitoring Market Market Revenue (US$ Mn) Comparison by By End Use (2016-2032)
- Figure 95: Eastern Europe Structural Health Monitoring Market Market Y-o-Y Growth Rate Comparison by Country (2016-2032)
- Figure 96: Eastern Europe Structural Health Monitoring Market Market Y-o-Y Growth Rate Comparison by By Aircraft Type (2016-2032)
- Figure 97: Eastern Europe Structural Health Monitoring Market Market Y-o-Y Growth Rate Comparison by By Autonomy Component (2016-2032)
- Figure 98: Eastern Europe Structural Health Monitoring Market Market Y-o-Y Growth Rate Comparison by By Technology (2016-2032)
- Figure 99: Eastern Europe Structural Health Monitoring Market Market Y-o-Y Growth Rate Comparison by By End Use (2016-2032)
- Figure 100: Eastern Europe Structural Health Monitoring Market Market Share Comparison by Country (2016-2032)
- Figure 101: Eastern Europe Structural Health Monitoring Market Market Share Comparison by By Aircraft Type (2016-2032)
- Figure 102: Eastern Europe Structural Health Monitoring Market Market Share Comparison by By Autonomy Component (2016-2032)
- Figure 103: Eastern Europe Structural Health Monitoring Market Market Share Comparison by By Technology (2016-2032)
- Figure 104: Eastern Europe Structural Health Monitoring Market Market Share Comparison by By End Use (2016-2032)
- Figure 105: APAC Structural Health Monitoring Market Revenue (US$ Mn) Market Share by By Aircraft Typein 2022
- Figure 106: APAC Structural Health Monitoring Market Market Attractiveness Analysis by By Aircraft Type, 2016-2032
- Figure 107: APAC Structural Health Monitoring Market Revenue (US$ Mn) Market Share by By Autonomy Componentin 2022
- Figure 108: APAC Structural Health Monitoring Market Market Attractiveness Analysis by By Autonomy Component, 2016-2032
- Figure 109: APAC Structural Health Monitoring Market Revenue (US$ Mn) Market Share by By Technologyin 2022
- Figure 110: APAC Structural Health Monitoring Market Market Attractiveness Analysis by By Technology, 2016-2032
- Figure 111: APAC Structural Health Monitoring Market Revenue (US$ Mn) Market Share by By End Usein 2022
- Figure 112: APAC Structural Health Monitoring Market Market Attractiveness Analysis by By End Use, 2016-2032
- Figure 113: APAC Structural Health Monitoring Market Revenue (US$ Mn) Market Share by Country in 2022
- Figure 114: APAC Structural Health Monitoring Market Market Attractiveness Analysis by Country, 2016-2032
- Figure 115: APAC Structural Health Monitoring Market Market Revenue (US$ Mn) (2016-2032)
- Figure 116: APAC Structural Health Monitoring Market Market Revenue (US$ Mn) Comparison by Country (2016-2032)
- Figure 117: APAC Structural Health Monitoring Market Market Revenue (US$ Mn) Comparison by By Aircraft Type (2016-2032)
- Figure 118: APAC Structural Health Monitoring Market Market Revenue (US$ Mn) Comparison by By Autonomy Component (2016-2032)
- Figure 119: APAC Structural Health Monitoring Market Market Revenue (US$ Mn) Comparison by By Technology (2016-2032)
- Figure 120: APAC Structural Health Monitoring Market Market Revenue (US$ Mn) Comparison by By End Use (2016-2032)
- Figure 121: APAC Structural Health Monitoring Market Market Y-o-Y Growth Rate Comparison by Country (2016-2032)
- Figure 122: APAC Structural Health Monitoring Market Market Y-o-Y Growth Rate Comparison by By Aircraft Type (2016-2032)
- Figure 123: APAC Structural Health Monitoring Market Market Y-o-Y Growth Rate Comparison by By Autonomy Component (2016-2032)
- Figure 124: APAC Structural Health Monitoring Market Market Y-o-Y Growth Rate Comparison by By Technology (2016-2032)
- Figure 125: APAC Structural Health Monitoring Market Market Y-o-Y Growth Rate Comparison by By End Use (2016-2032)
- Figure 126: APAC Structural Health Monitoring Market Market Share Comparison by Country (2016-2032)
- Figure 127: APAC Structural Health Monitoring Market Market Share Comparison by By Aircraft Type (2016-2032)
- Figure 128: APAC Structural Health Monitoring Market Market Share Comparison by By Autonomy Component (2016-2032)
- Figure 129: APAC Structural Health Monitoring Market Market Share Comparison by By Technology (2016-2032)
- Figure 130: APAC Structural Health Monitoring Market Market Share Comparison by By End Use (2016-2032)
- Figure 131: Latin America Structural Health Monitoring Market Revenue (US$ Mn) Market Share by By Aircraft Typein 2022
- Figure 132: Latin America Structural Health Monitoring Market Market Attractiveness Analysis by By Aircraft Type, 2016-2032
- Figure 133: Latin America Structural Health Monitoring Market Revenue (US$ Mn) Market Share by By Autonomy Componentin 2022
- Figure 134: Latin America Structural Health Monitoring Market Market Attractiveness Analysis by By Autonomy Component, 2016-2032
- Figure 135: Latin America Structural Health Monitoring Market Revenue (US$ Mn) Market Share by By Technologyin 2022
- Figure 136: Latin America Structural Health Monitoring Market Market Attractiveness Analysis by By Technology, 2016-2032
- Figure 137: Latin America Structural Health Monitoring Market Revenue (US$ Mn) Market Share by By End Usein 2022
- Figure 138: Latin America Structural Health Monitoring Market Market Attractiveness Analysis by By End Use, 2016-2032
- Figure 139: Latin America Structural Health Monitoring Market Revenue (US$ Mn) Market Share by Country in 2022
- Figure 140: Latin America Structural Health Monitoring Market Market Attractiveness Analysis by Country, 2016-2032
- Figure 141: Latin America Structural Health Monitoring Market Market Revenue (US$ Mn) (2016-2032)
- Figure 142: Latin America Structural Health Monitoring Market Market Revenue (US$ Mn) Comparison by Country (2016-2032)
- Figure 143: Latin America Structural Health Monitoring Market Market Revenue (US$ Mn) Comparison by By Aircraft Type (2016-2032)
- Figure 144: Latin America Structural Health Monitoring Market Market Revenue (US$ Mn) Comparison by By Autonomy Component (2016-2032)
- Figure 145: Latin America Structural Health Monitoring Market Market Revenue (US$ Mn) Comparison by By Technology (2016-2032)
- Figure 146: Latin America Structural Health Monitoring Market Market Revenue (US$ Mn) Comparison by By End Use (2016-2032)
- Figure 147: Latin America Structural Health Monitoring Market Market Y-o-Y Growth Rate Comparison by Country (2016-2032)
- Figure 148: Latin America Structural Health Monitoring Market Market Y-o-Y Growth Rate Comparison by By Aircraft Type (2016-2032)
- Figure 149: Latin America Structural Health Monitoring Market Market Y-o-Y Growth Rate Comparison by By Autonomy Component (2016-2032)
- Figure 150: Latin America Structural Health Monitoring Market Market Y-o-Y Growth Rate Comparison by By Technology (2016-2032)
- Figure 151: Latin America Structural Health Monitoring Market Market Y-o-Y Growth Rate Comparison by By End Use (2016-2032)
- Figure 152: Latin America Structural Health Monitoring Market Market Share Comparison by Country (2016-2032)
- Figure 153: Latin America Structural Health Monitoring Market Market Share Comparison by By Aircraft Type (2016-2032)
- Figure 154: Latin America Structural Health Monitoring Market Market Share Comparison by By Autonomy Component (2016-2032)
- Figure 155: Latin America Structural Health Monitoring Market Market Share Comparison by By Technology (2016-2032)
- Figure 156: Latin America Structural Health Monitoring Market Market Share Comparison by By End Use (2016-2032)
- Figure 157: Middle East & Africa Structural Health Monitoring Market Revenue (US$ Mn) Market Share by By Aircraft Typein 2022
- Figure 158: Middle East & Africa Structural Health Monitoring Market Market Attractiveness Analysis by By Aircraft Type, 2016-2032
- Figure 159: Middle East & Africa Structural Health Monitoring Market Revenue (US$ Mn) Market Share by By Autonomy Componentin 2022
- Figure 160: Middle East & Africa Structural Health Monitoring Market Market Attractiveness Analysis by By Autonomy Component, 2016-2032
- Figure 161: Middle East & Africa Structural Health Monitoring Market Revenue (US$ Mn) Market Share by By Technologyin 2022
- Figure 162: Middle East & Africa Structural Health Monitoring Market Market Attractiveness Analysis by By Technology, 2016-2032
- Figure 163: Middle East & Africa Structural Health Monitoring Market Revenue (US$ Mn) Market Share by By End Usein 2022
- Figure 164: Middle East & Africa Structural Health Monitoring Market Market Attractiveness Analysis by By End Use, 2016-2032
- Figure 165: Middle East & Africa Structural Health Monitoring Market Revenue (US$ Mn) Market Share by Country in 2022
- Figure 166: Middle East & Africa Structural Health Monitoring Market Market Attractiveness Analysis by Country, 2016-2032
- Figure 167: Middle East & Africa Structural Health Monitoring Market Market Revenue (US$ Mn) (2016-2032)
- Figure 168: Middle East & Africa Structural Health Monitoring Market Market Revenue (US$ Mn) Comparison by Country (2016-2032)
- Figure 169: Middle East & Africa Structural Health Monitoring Market Market Revenue (US$ Mn) Comparison by By Aircraft Type (2016-2032)
- Figure 170: Middle East & Africa Structural Health Monitoring Market Market Revenue (US$ Mn) Comparison by By Autonomy Component (2016-2032)
- Figure 171: Middle East & Africa Structural Health Monitoring Market Market Revenue (US$ Mn) Comparison by By Technology (2016-2032)
- Figure 172: Middle East & Africa Structural Health Monitoring Market Market Revenue (US$ Mn) Comparison by By End Use (2016-2032)
- Figure 173: Middle East & Africa Structural Health Monitoring Market Market Y-o-Y Growth Rate Comparison by Country (2016-2032)
- Figure 174: Middle East & Africa Structural Health Monitoring Market Market Y-o-Y Growth Rate Comparison by By Aircraft Type (2016-2032)
- Figure 175: Middle East & Africa Structural Health Monitoring Market Market Y-o-Y Growth Rate Comparison by By Autonomy Component (2016-2032)
- Figure 176: Middle East & Africa Structural Health Monitoring Market Market Y-o-Y Growth Rate Comparison by By Technology (2016-2032)
- Figure 177: Middle East & Africa Structural Health Monitoring Market Market Y-o-Y Growth Rate Comparison by By End Use (2016-2032)
- Figure 178: Middle East & Africa Structural Health Monitoring Market Market Share Comparison by Country (2016-2032)
- Figure 179: Middle East & Africa Structural Health Monitoring Market Market Share Comparison by By Aircraft Type (2016-2032)
- Figure 180: Middle East & Africa Structural Health Monitoring Market Market Share Comparison by By Autonomy Component (2016-2032)
- Figure 181: Middle East & Africa Structural Health Monitoring Market Market Share Comparison by By Technology (2016-2032)
- Figure 182: Middle East & Africa Structural Health Monitoring Market Market Share Comparison by By End Use (2016-2032)
"
- List of Tables
- "
- Table 1: Global Structural Health Monitoring Market Market Comparison by By Aircraft Type (2016-2032)
- Table 2: Global Structural Health Monitoring Market Market Comparison by By Autonomy Component (2016-2032)
- Table 3: Global Structural Health Monitoring Market Market Comparison by By Technology (2016-2032)
- Table 4: Global Structural Health Monitoring Market Market Comparison by By End Use (2016-2032)
- Table 5: Global Structural Health Monitoring Market Revenue (US$ Mn) Comparison by Region (2016-2032)
- Table 6: Global Structural Health Monitoring Market Market Revenue (US$ Mn) (2016-2032)
- Table 7: Global Structural Health Monitoring Market Market Revenue (US$ Mn) Comparison by Region (2016-2032)
- Table 8: Global Structural Health Monitoring Market Market Revenue (US$ Mn) Comparison by By Aircraft Type (2016-2032)
- Table 9: Global Structural Health Monitoring Market Market Revenue (US$ Mn) Comparison by By Autonomy Component (2016-2032)
- Table 10: Global Structural Health Monitoring Market Market Revenue (US$ Mn) Comparison by By Technology (2016-2032)
- Table 11: Global Structural Health Monitoring Market Market Revenue (US$ Mn) Comparison by By End Use (2016-2032)
- Table 12: Global Structural Health Monitoring Market Market Y-o-Y Growth Rate Comparison by Region (2016-2032)
- Table 13: Global Structural Health Monitoring Market Market Y-o-Y Growth Rate Comparison by By Aircraft Type (2016-2032)
- Table 14: Global Structural Health Monitoring Market Market Y-o-Y Growth Rate Comparison by By Autonomy Component (2016-2032)
- Table 15: Global Structural Health Monitoring Market Market Y-o-Y Growth Rate Comparison by By Technology (2016-2032)
- Table 16: Global Structural Health Monitoring Market Market Y-o-Y Growth Rate Comparison by By End Use (2016-2032)
- Table 17: Global Structural Health Monitoring Market Market Share Comparison by Region (2016-2032)
- Table 18: Global Structural Health Monitoring Market Market Share Comparison by By Aircraft Type (2016-2032)
- Table 19: Global Structural Health Monitoring Market Market Share Comparison by By Autonomy Component (2016-2032)
- Table 20: Global Structural Health Monitoring Market Market Share Comparison by By Technology (2016-2032)
- Table 21: Global Structural Health Monitoring Market Market Share Comparison by By End Use (2016-2032)
- Table 22: North America Structural Health Monitoring Market Market Comparison by By Autonomy Component (2016-2032)
- Table 23: North America Structural Health Monitoring Market Market Comparison by By Technology (2016-2032)
- Table 24: North America Structural Health Monitoring Market Market Comparison by By End Use (2016-2032)
- Table 25: North America Structural Health Monitoring Market Revenue (US$ Mn) Comparison by Country (2016-2032)
- Table 26: North America Structural Health Monitoring Market Market Revenue (US$ Mn) (2016-2032)
- Table 27: North America Structural Health Monitoring Market Market Revenue (US$ Mn) Comparison by Country (2016-2032)
- Table 28: North America Structural Health Monitoring Market Market Revenue (US$ Mn) Comparison by By Aircraft Type (2016-2032)
- Table 29: North America Structural Health Monitoring Market Market Revenue (US$ Mn) Comparison by By Autonomy Component (2016-2032)
- Table 30: North America Structural Health Monitoring Market Market Revenue (US$ Mn) Comparison by By Technology (2016-2032)
- Table 31: North America Structural Health Monitoring Market Market Revenue (US$ Mn) Comparison by By End Use (2016-2032)
- Table 32: North America Structural Health Monitoring Market Market Y-o-Y Growth Rate Comparison by Country (2016-2032)
- Table 33: North America Structural Health Monitoring Market Market Y-o-Y Growth Rate Comparison by By Aircraft Type (2016-2032)
- Table 34: North America Structural Health Monitoring Market Market Y-o-Y Growth Rate Comparison by By Autonomy Component (2016-2032)
- Table 35: North America Structural Health Monitoring Market Market Y-o-Y Growth Rate Comparison by By Technology (2016-2032)
- Table 36: North America Structural Health Monitoring Market Market Y-o-Y Growth Rate Comparison by By End Use (2016-2032)
- Table 37: North America Structural Health Monitoring Market Market Share Comparison by Country (2016-2032)
- Table 38: North America Structural Health Monitoring Market Market Share Comparison by By Aircraft Type (2016-2032)
- Table 39: North America Structural Health Monitoring Market Market Share Comparison by By Autonomy Component (2016-2032)
- Table 40: North America Structural Health Monitoring Market Market Share Comparison by By Technology (2016-2032)
- Table 41: North America Structural Health Monitoring Market Market Share Comparison by By End Use (2016-2032)
- Table 42: Western Europe Structural Health Monitoring Market Market Comparison by By Aircraft Type (2016-2032)
- Table 43: Western Europe Structural Health Monitoring Market Market Comparison by By Autonomy Component (2016-2032)
- Table 44: Western Europe Structural Health Monitoring Market Market Comparison by By Technology (2016-2032)
- Table 45: Western Europe Structural Health Monitoring Market Market Comparison by By End Use (2016-2032)
- Table 46: Western Europe Structural Health Monitoring Market Revenue (US$ Mn) Comparison by Country (2016-2032)
- Table 47: Western Europe Structural Health Monitoring Market Market Revenue (US$ Mn) (2016-2032)
- Table 48: Western Europe Structural Health Monitoring Market Market Revenue (US$ Mn) Comparison by Country (2016-2032)
- Table 49: Western Europe Structural Health Monitoring Market Market Revenue (US$ Mn) Comparison by By Aircraft Type (2016-2032)
- Table 50: Western Europe Structural Health Monitoring Market Market Revenue (US$ Mn) Comparison by By Autonomy Component (2016-2032)
- Table 51: Western Europe Structural Health Monitoring Market Market Revenue (US$ Mn) Comparison by By Technology (2016-2032)
- Table 52: Western Europe Structural Health Monitoring Market Market Revenue (US$ Mn) Comparison by By End Use (2016-2032)
- Table 53: Western Europe Structural Health Monitoring Market Market Y-o-Y Growth Rate Comparison by Country (2016-2032)
- Table 54: Western Europe Structural Health Monitoring Market Market Y-o-Y Growth Rate Comparison by By Aircraft Type (2016-2032)
- Table 55: Western Europe Structural Health Monitoring Market Market Y-o-Y Growth Rate Comparison by By Autonomy Component (2016-2032)
- Table 56: Western Europe Structural Health Monitoring Market Market Y-o-Y Growth Rate Comparison by By Technology (2016-2032)
- Table 57: Western Europe Structural Health Monitoring Market Market Y-o-Y Growth Rate Comparison by By End Use (2016-2032)
- Table 58: Western Europe Structural Health Monitoring Market Market Share Comparison by Country (2016-2032)
- Table 59: Western Europe Structural Health Monitoring Market Market Share Comparison by By Aircraft Type (2016-2032)
- Table 60: Western Europe Structural Health Monitoring Market Market Share Comparison by By Autonomy Component (2016-2032)
- Table 61: Western Europe Structural Health Monitoring Market Market Share Comparison by By Technology (2016-2032)
- Table 62: Western Europe Structural Health Monitoring Market Market Share Comparison by By End Use (2016-2032)
- Table 63: Eastern Europe Structural Health Monitoring Market Market Comparison by By Aircraft Type (2016-2032)
- Table 64: Eastern Europe Structural Health Monitoring Market Market Comparison by By Autonomy Component (2016-2032)
- Table 65: Eastern Europe Structural Health Monitoring Market Market Comparison by By Technology (2016-2032)
- Table 66: Eastern Europe Structural Health Monitoring Market Market Comparison by By End Use (2016-2032)
- Table 67: Eastern Europe Structural Health Monitoring Market Revenue (US$ Mn) Comparison by Country (2016-2032)
- Table 68: Eastern Europe Structural Health Monitoring Market Market Revenue (US$ Mn) (2016-2032)
- Table 69: Eastern Europe Structural Health Monitoring Market Market Revenue (US$ Mn) Comparison by Country (2016-2032)
- Table 70: Eastern Europe Structural Health Monitoring Market Market Revenue (US$ Mn) Comparison by By Aircraft Type (2016-2032)
- Table 71: Eastern Europe Structural Health Monitoring Market Market Revenue (US$ Mn) Comparison by By Autonomy Component (2016-2032)
- Table 72: Eastern Europe Structural Health Monitoring Market Market Revenue (US$ Mn) Comparison by By Technology (2016-2032)
- Table 73: Eastern Europe Structural Health Monitoring Market Market Revenue (US$ Mn) Comparison by By End Use (2016-2032)
- Table 74: Eastern Europe Structural Health Monitoring Market Market Y-o-Y Growth Rate Comparison by Country (2016-2032)
- Table 75: Eastern Europe Structural Health Monitoring Market Market Y-o-Y Growth Rate Comparison by By Aircraft Type (2016-2032)
- Table 76: Eastern Europe Structural Health Monitoring Market Market Y-o-Y Growth Rate Comparison by By Autonomy Component (2016-2032)
- Table 77: Eastern Europe Structural Health Monitoring Market Market Y-o-Y Growth Rate Comparison by By Technology (2016-2032)
- Table 78: Eastern Europe Structural Health Monitoring Market Market Y-o-Y Growth Rate Comparison by By End Use (2016-2032)
- Table 79: Eastern Europe Structural Health Monitoring Market Market Share Comparison by Country (2016-2032)
- Table 80: Eastern Europe Structural Health Monitoring Market Market Share Comparison by By Aircraft Type (2016-2032)
- Table 81: Eastern Europe Structural Health Monitoring Market Market Share Comparison by By Autonomy Component (2016-2032)
- Table 82: Eastern Europe Structural Health Monitoring Market Market Share Comparison by By Technology (2016-2032)
- Table 83: Eastern Europe Structural Health Monitoring Market Market Share Comparison by By End Use (2016-2032)
- Table 84: APAC Structural Health Monitoring Market Market Comparison by By Aircraft Type (2016-2032)
- Table 85: APAC Structural Health Monitoring Market Market Comparison by By Autonomy Component (2016-2032)
- Table 86: APAC Structural Health Monitoring Market Market Comparison by By Technology (2016-2032)
- Table 87: APAC Structural Health Monitoring Market Market Comparison by By End Use (2016-2032)
- Table 88: APAC Structural Health Monitoring Market Revenue (US$ Mn) Comparison by Country (2016-2032)
- Table 89: APAC Structural Health Monitoring Market Market Revenue (US$ Mn) (2016-2032)
- Table 90: APAC Structural Health Monitoring Market Market Revenue (US$ Mn) Comparison by Country (2016-2032)
- Table 91: APAC Structural Health Monitoring Market Market Revenue (US$ Mn) Comparison by By Aircraft Type (2016-2032)
- Table 92: APAC Structural Health Monitoring Market Market Revenue (US$ Mn) Comparison by By Autonomy Component (2016-2032)
- Table 93: APAC Structural Health Monitoring Market Market Revenue (US$ Mn) Comparison by By Technology (2016-2032)
- Table 94: APAC Structural Health Monitoring Market Market Revenue (US$ Mn) Comparison by By End Use (2016-2032)
- Table 95: APAC Structural Health Monitoring Market Market Y-o-Y Growth Rate Comparison by Country (2016-2032)
- Table 96: APAC Structural Health Monitoring Market Market Y-o-Y Growth Rate Comparison by By Aircraft Type (2016-2032)
- Table 97: APAC Structural Health Monitoring Market Market Y-o-Y Growth Rate Comparison by By Autonomy Component (2016-2032)
- Table 98: APAC Structural Health Monitoring Market Market Y-o-Y Growth Rate Comparison by By Technology (2016-2032)
- Table 99: APAC Structural Health Monitoring Market Market Y-o-Y Growth Rate Comparison by By End Use (2016-2032)
- Table 100: APAC Structural Health Monitoring Market Market Share Comparison by Country (2016-2032)
- Table 101: APAC Structural Health Monitoring Market Market Share Comparison by By Aircraft Type (2016-2032)
- Table 102: APAC Structural Health Monitoring Market Market Share Comparison by By Autonomy Component (2016-2032)
- Table 103: APAC Structural Health Monitoring Market Market Share Comparison by By Technology (2016-2032)
- Table 104: APAC Structural Health Monitoring Market Market Share Comparison by By End Use (2016-2032)
- Table 105: Latin America Structural Health Monitoring Market Market Comparison by By Aircraft Type (2016-2032)
- Table 106: Latin America Structural Health Monitoring Market Market Comparison by By Autonomy Component (2016-2032)
- Table 107: Latin America Structural Health Monitoring Market Market Comparison by By Technology (2016-2032)
- Table 108: Latin America Structural Health Monitoring Market Market Comparison by By End Use (2016-2032)
- Table 109: Latin America Structural Health Monitoring Market Revenue (US$ Mn) Comparison by Country (2016-2032)
- Table 110: Latin America Structural Health Monitoring Market Market Revenue (US$ Mn) (2016-2032)
- Table 111: Latin America Structural Health Monitoring Market Market Revenue (US$ Mn) Comparison by Country (2016-2032)
- Table 112: Latin America Structural Health Monitoring Market Market Revenue (US$ Mn) Comparison by By Aircraft Type (2016-2032)
- Table 113: Latin America Structural Health Monitoring Market Market Revenue (US$ Mn) Comparison by By Autonomy Component (2016-2032)
- Table 114: Latin America Structural Health Monitoring Market Market Revenue (US$ Mn) Comparison by By Technology (2016-2032)
- Table 115: Latin America Structural Health Monitoring Market Market Revenue (US$ Mn) Comparison by By End Use (2016-2032)
- Table 116: Latin America Structural Health Monitoring Market Market Y-o-Y Growth Rate Comparison by Country (2016-2032)
- Table 117: Latin America Structural Health Monitoring Market Market Y-o-Y Growth Rate Comparison by By Aircraft Type (2016-2032)
- Table 118: Latin America Structural Health Monitoring Market Market Y-o-Y Growth Rate Comparison by By Autonomy Component (2016-2032)
- Table 119: Latin America Structural Health Monitoring Market Market Y-o-Y Growth Rate Comparison by By Technology (2016-2032)
- Table 120: Latin America Structural Health Monitoring Market Market Y-o-Y Growth Rate Comparison by By End Use (2016-2032)
- Table 121: Latin America Structural Health Monitoring Market Market Share Comparison by Country (2016-2032)
- Table 122: Latin America Structural Health Monitoring Market Market Share Comparison by By Aircraft Type (2016-2032)
- Table 123: Latin America Structural Health Monitoring Market Market Share Comparison by By Autonomy Component (2016-2032)
- Table 124: Latin America Structural Health Monitoring Market Market Share Comparison by By Technology (2016-2032)
- Table 125: Latin America Structural Health Monitoring Market Market Share Comparison by By End Use (2016-2032)
- Table 126: Middle East & Africa Structural Health Monitoring Market Market Comparison by By Aircraft Type (2016-2032)
- Table 127: Middle East & Africa Structural Health Monitoring Market Market Comparison by By Autonomy Component (2016-2032)
- Table 128: Middle East & Africa Structural Health Monitoring Market Market Comparison by By Technology (2016-2032)
- Table 129: Middle East & Africa Structural Health Monitoring Market Market Comparison by By End Use (2016-2032)
- Table 130: Middle East & Africa Structural Health Monitoring Market Revenue (US$ Mn) Comparison by Country (2016-2032)
- Table 131: Middle East & Africa Structural Health Monitoring Market Market Revenue (US$ Mn) (2016-2032)
- Table 132: Middle East & Africa Structural Health Monitoring Market Market Revenue (US$ Mn) Comparison by Country (2016-2032)
- Table 133: Middle East & Africa Structural Health Monitoring Market Market Revenue (US$ Mn) Comparison by By Aircraft Type (2016-2032)
- Table 134: Middle East & Africa Structural Health Monitoring Market Market Revenue (US$ Mn) Comparison by By Autonomy Component (2016-2032)
- Table 135: Middle East & Africa Structural Health Monitoring Market Market Revenue (US$ Mn) Comparison by By Technology (2016-2032)
- Table 136: Middle East & Africa Structural Health Monitoring Market Market Revenue (US$ Mn) Comparison by By End Use (2016-2032)
- Table 137: Middle East & Africa Structural Health Monitoring Market Market Y-o-Y Growth Rate Comparison by Country (2016-2032)
- Table 138: Middle East & Africa Structural Health Monitoring Market Market Y-o-Y Growth Rate Comparison by By Aircraft Type (2016-2032)
- Table 139: Middle East & Africa Structural Health Monitoring Market Market Y-o-Y Growth Rate Comparison by By Autonomy Component (2016-2032)
- Table 140: Middle East & Africa Structural Health Monitoring Market Market Y-o-Y Growth Rate Comparison by By Technology (2016-2032)
- Table 141: Middle East & Africa Structural Health Monitoring Market Market Y-o-Y Growth Rate Comparison by By End Use (2016-2032)
- Table 142: Middle East & Africa Structural Health Monitoring Market Market Share Comparison by Country (2016-2032)
- Table 143: Middle East & Africa Structural Health Monitoring Market Market Share Comparison by By Aircraft Type (2016-2032)
- Table 144: Middle East & Africa Structural Health Monitoring Market Market Share Comparison by By Autonomy Component (2016-2032)
- Table 145: Middle East & Africa Structural Health Monitoring Market Market Share Comparison by By Technology (2016-2032)
- Table 146: Middle East & Africa Structural Health Monitoring Market Market Share Comparison by By End Use (2016-2032)
- 1. Executive Summary
-
- Airbus S.A.S.
- BAE Systems
- Boeing
- Elbit Systems
- AeroVironment, Inc.
- Embraer
- Lockheed Martin Corporation
- Northrop Grumman Corporation
- Raytheon Technologies
- Saab AB
Our Clients


View Our Licence Options
