
Genetically Modified Seeds Market By Crop Type (Corn, Soybean, Cotton, Canola, potato, Sugar Beets, and Other), By Trait Type (Herbicide Tolerance, Insect Resistance, and Other), By Region and Companies - Industry Segment Outlook, Market Assessment, Competition Scenario, Trends, and Forecast 2023-2032
-
40249
-
July 2023
-
137
-


-
This report was compiled by Shreyas Rokade Shreyas Rokade is a seasoned Research Analyst with CMFE, bringing extensive expertise in market research and consulting, with a strong background in Chemical Engineering. Correspondence Team Lead-CMFE Linkedin | Detailed Market research Methodology Our methodology involves a mix of primary research, including interviews with leading mental health experts, and secondary research from reputable medical journals and databases. View Detailed Methodology Page
-
Quick Navigation
Report Overview
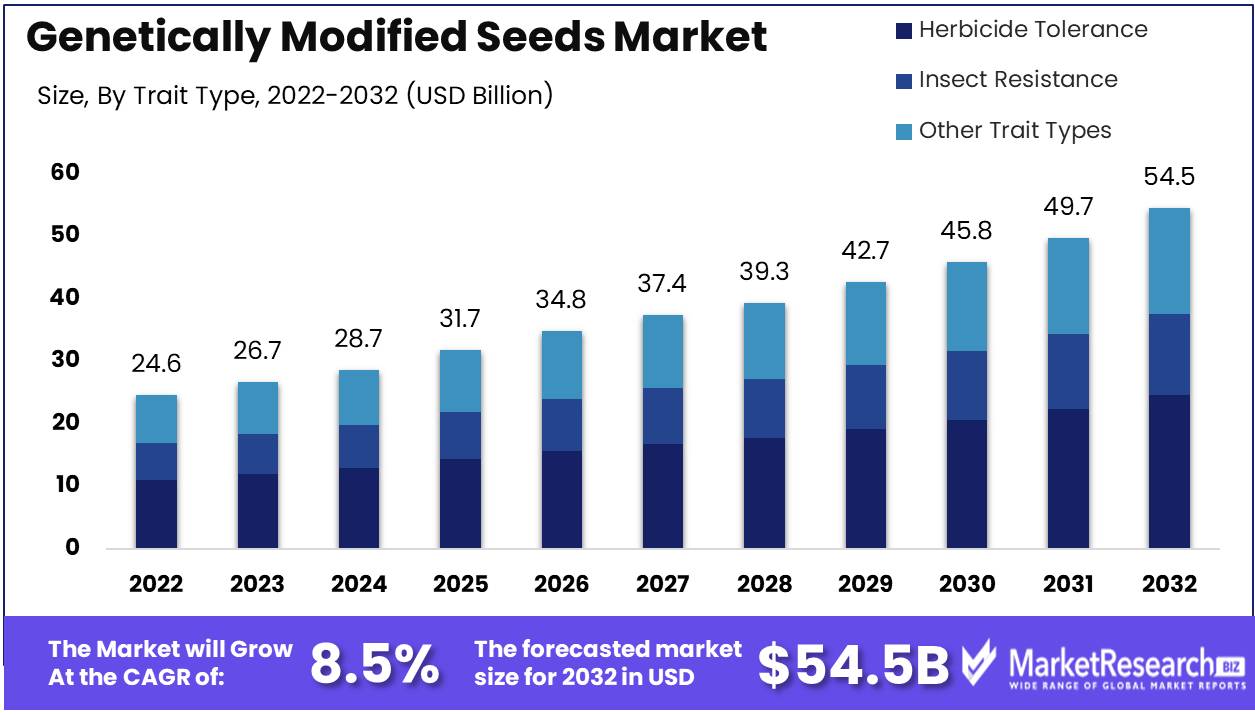
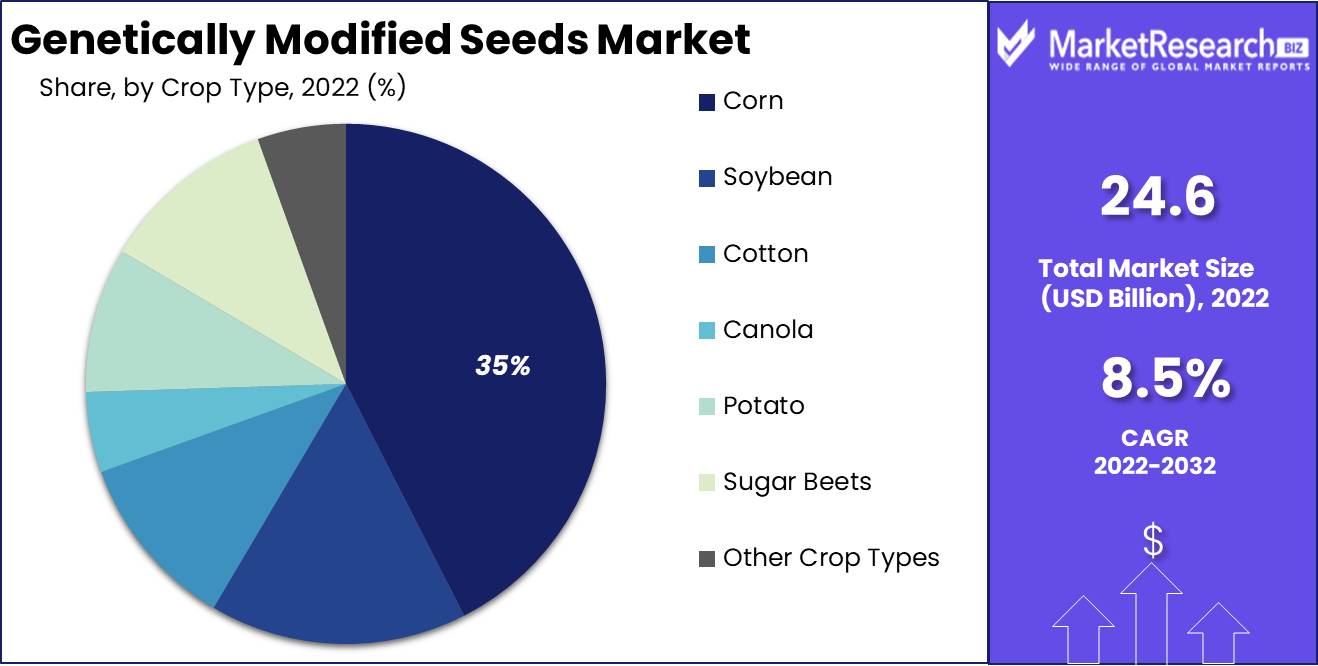
Genetically Modified Seeds Market size is expected to be worth around USD 54.5 Bn by 2032 from USD 24.6 Bn in 2022, growing at a CAGR of 8.5% during the forecast period from 2023 to 2032.
Genetically modified seeds (GM) is a technology that involves inserting DNA into the genome of seeds. For the production of GM plants, new DNA is transferred into plant cells. These cells are usually grown in tissue culture, where they develop into plants. The seeds produced by these plants will inherit the new DNA. The modified seeds are also known as genetically modified organisms.
Driving factors
Increasing Use in Biofuels Production Driving the Growth of Global Genetically Modified (GM) Seeds Market
Modern plant biotechnological applications propel certain useful traits, such as herbicides tolerance and insect repellent, which help in increasing crop yields and protecting crops. The crops with such traits help in reducing the cost of pesticides and herbicides, thus, demand for genetically modified crop seeds is increasing in the market. The increasing adoption of biofuels due to increasing demand for fuel alternatives propels the market growth.
The crops such as canola and soybean are known as energy crops which are used in the fermentation process of biofuel production to form bioalcohols, butanol, and production of ethanol. The fuels which are based on plants come from renewable sources and can be grown anywhere and they have low carbon emissions which have a positive impact on genetically modified seeds market growth. Several countries in North America and the Asia Pacific region are concentrating on the production of biofuels due to the increasing costs of crude oil. The increasing demand for animal feed, and rising preference for oleo-chemicals driving the market growth.
Also the emergence of new technologies in farming such as vertical farming, and increasing demand for plant-based meat products driving the growth rate of the market. Genetic engineering reduces the costs of food production, reduced the need for pesticides, helps in increasing nutrient composition, provides high resistance to pests, and provides tremendous health benefits. Also, genetically modified crops help farmers to reduce environmental footprints by reducing the use of fuels and pesticides. These are some key factors driving the growth of the genetically modified seeds market.
Restraining Factors
Allergic Issues and Lost of Insect Diversity have Negative Impact on Market Growth
Genetically modified crops disrupt the natural process of gene flow. Sometimes genetically modified seeds result in allergic reactions in several individuals. The genetic engineering of seeds required high cost which has a negative impact on genetically modified seeds market growth. Genetically modified crops reduce insect biodiversity when crops are resistant to insects.
Crop Type Analysis
The Corn Segment is Dominant in the Market, with Largest Market Revenue Share
By crop type, the market is segmented into corn, soybean, cotton, canola, potato, sugar beets, and other crop types. The corn segment was dominant in the market, with the largest market revenue share of 35% in 2022. A lot of genetically modified corn and soybean are used in processed foods and drinks. Most of the corn is used as feed for livestock. Thus, the demand is increasing in the genetically modified seeds market. About 90% of corn and soybean are genetically modified and mostly used in the United States.
The United States has the largest area of genetically modified crops worldwide, at 71.5 million hectares, followed by Brazil with 52.8 million hectares. The GMO soybean is used as feed for livestock, predominantly poultry, and livestock, and in making soybean oil. Genetically modified soybean crops are also containing nutritional values such as proteins which are widely used in processed foods and dietary supplements. Soybean and corn are also used as energy crops in the production of biofuels. The cotton crops segment is expected to grow at the fastest CAGR during the forecast period.
The genetically modified crop cotton, also known as BT Cotton, is highly pest-resistant. Brazil cultivates around 44.2 million hectares’ area of modified cotton. The canola crop is genetically modified to decrease the tolerance of herbicides. The canola is commonly used to feed many types of farm animals used for meat and milk production. The demand for animal feed is increasing in animal farming. Thus, the demand for genetically modified alfalfa is increasing in the market.
Trait Type Analysis
Herbicide Tolerance Segment is Dominant in Market
By trait type, the market is segmented into herbicide tolerance, insect resistance, and other trait types. The herbicide tolerance segment was dominant in the market, with the largest genetically modified seeds market revenue share of 83% in 2022. Most of the herbicide resistance GM crops have been engineered for glyphosate tolerance; in the USA, 93% of soybean and most of the GM maize grown is glyphosate tolerant.
Genetically modified herbicide-tolerant crop growth is not affected by herbicides used on the weeds around them. The farmers prefer herbicide-tolerant crops, are help in increasing crop yields and reduce costs. These types of crops are commonly known as “Roundup Ready” in American agriculture, with 93% of soybeans, 82% of cotton, and 85% of corn planted engineered to be herbicide resistant.
The insect resistance segment is expected to grow at the fastest CAGR during the forecast period due to changes in climatic conditions and the tolerance of insects that affect crop yields. Most of the seeds that are genetically modified and used for insect resistance come from the Bacillus thuringgiensis bacterium. This type of crop includes soybean, maize, cotton, canola, and alfalfa, which are genetically modified crops.
Key Market Segments
By Crop Type
- Corn
- Soybean
- Cotton
- Canola
- Potato
- Sugar Beets
- Other Crop Types
By Trait Type
- Herbicide Tolerance
- Insect Resistance
- Other Trait Types
Growth Opportunity
The Advancements in Agricultural Biotechnology is Expected to Create Lucrative Growth Opportunities in Market
Genetically modified crops help to reduce agricultural greenhouse gas (GHG) emissions. With the increasing demand for natural fuels such as biofuels which helps in reducing greenhouse gas emission, the demand for genetically modified seeds is expected to increase in the forecast period. Genetically modified crops use fewer chemicals, water, soil, and energy as compared to traditional crops. The increasing innovations in agricultural biotechnology allow farmers to improve crop yield, and efficient land use, which is expected to drive the genetically modified seeds market in the forecast period.
About 75% of processed foods are produced by using genetically modified crops. Worldwide concerns regarding health among individuals is increasing, therefore the demand for GMO soybean is increasing in the dietary supplement manufacturing industries. Several industries in agricultural biotechnology are focusing on improving R&D activities to gain high crop yields with reducing operating costs. Also, stringent regulations on the emission of hazardous gases drive the demand for energy crops in biofuel production.
Latest Trends
The Demand for Herbicide Tolerance GMOs is Increasing
Major players in the genetically modified seed industry are expanding their business in their respective countries for expanding their footprints and geographical reach. Most of the GMO crops grown today are developed to help farmers prevent crop loss. Farmers worldwide prefer genetically modified herbicide tolerance and insect-resistant crops to reduce farming costs and increase crop yields. The demand for nutrition-rich food is increasing worldwide, therefore farmers are shifting towards GM crops to provide nutritional values. These are some key market trends in the genetically modified seeds market.
Regional Analysis
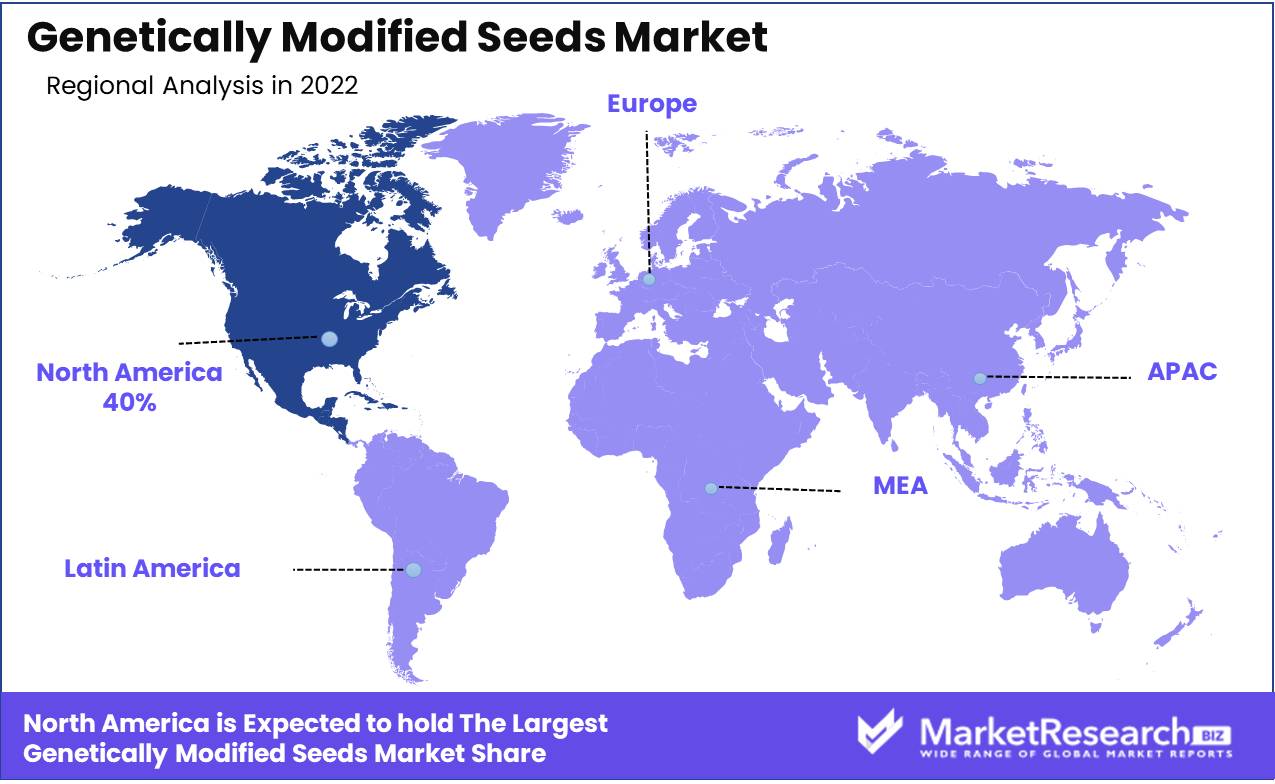
North America Region is Dominant in the Market with Largest Market Share
The North America region was dominant in the market with the largest market share of 40% in 2022. About 85-90% of soybean and corn crops are cultivated in the North America region, propelling the genetically modified seeds market growth. The GMO crops are used to make ingredients that Americans eat such as corn oil, corn syrup, soybean oil, and granulated sugar. There are more than 120 varieties of genetically modified crops in the United States mostly herbicide-tolerant and insect-resistant crops. Also increasing the costs of petrol and diesel the need for biofuels is increasing, thus the demand for GMOs is increasing in the region.
The Asia Pacific region is expected to grow at the fastest CAGR and holds the largest market size during the forecast period due to increasing research and development activities in agricultural biotechnology. Japan imports about 3.2 million tons of soybeans, 2.4 million tons of canola, and 16 million metric tons of corn per year. The Government regulatory bodies in various countries are focusing on genetic engineering for agricultural developments and increasing crop yields. Also the increasing population of emerging economies such as China, India, and Japan, the need for food is increasing, which is expected to drive the genetically modified seeds market in the forecast period.
Key Regions and Countries
North America
- US
- Canada
- Mexico
Western Europe
- Germany
- France
- The UK
- Spain
- Italy
- Portugal
- Ireland
- Austria
- Switzerland
- Benelux
- Nordic
- Rest of Western Europe
Eastern Europe
- Russia
- Poland
- The Czech Republic
- Greece
- Rest of Eastern Europe
APAC
- China
- Japan
- South Korea
- India
- Australia & New Zealand
- Indonesia
- Malaysia
- Philippines
- Singapore
- Thailand
- Vietnam
- Rest of APAC
Latin America
- Brazil
- Colombia
- Chile
- Argentina
- Costa Rica
- Rest of Latin America
Middle East & Africa
- Algeria
- Egypt
- Israel
- Kuwait
- Nigeria
- Saudi Arabia
- South Africa
- Turkey
- United Arab Emirates
- Rest of MEA
Key Players Analysis
key market players are focused on a variety of strategic policies to develop their respective businesses in foreign markets. Key players in agricultural biotechnology are focusing on R&D activities to expand their business and stay competitive in the market. The Major key players in genetically modified seeds market are Barenbrug Holding B.V, BASF S.E., Bayer A.G, Corteva Inc., Groupe Limagrain Holding, KWS SAAT SE & Co. KGaA, Land O Lakes Inc., Sakata Seed Corp., Syngenta AG, Takii & Co. Ltd., Calytx Inc., JK Agri Genetics Ltd., Vimorin & Cie SA, Bejo Zadan B.V., DLF seeds A/S, DowDupont Inc., Canterra Seeds Holdings Ltd., and Other Key Players.
Top Key Players in Genetically Modified Seeds Market
- Barenbrug Holding B.V
- BASF S.E.
- Bayer A.G
- Corteva Inc.
- Groupe Limagrain Holding
- KWS SAAT SE & Co. KGaA
- Land O Lakes Inc.
- Sakata Seed Corp.
- Syngenta AG
- Takii & Co. Ltd.
- Calytx Inc.
- JK Agri Genetics Ltd.
- Vimorin & Cie SA
- Bejo Zadan B.V.
- DLF seeds A/S
- DowDupont Inc.
- Canterra Seeds Holdings Ltd.
- Other key Players
Recent Development
- In 2020, ChemChina transferred its entire agricultural business to Syngenta Group, which also includes Adama and the agricultural activities of Sinochem in addition to Syngenta.
- In February 2019, the U.S. approved the soybean event FAD2KO for food and feed use.
Report Scope:
Report Features Description Market Value (2022) USD 24.6 Bn Forecast Revenue (2032) USD 54.5 Bn CAGR (2023-2032) 8.5% Base Year for Estimation 2022 Historic Period 2016-2022 Forecast Period 2023-2032 Report Coverage Revenue Forecast, Market Dynamics, COVID-19 Impact, Competitive Landscape, Recent Developments Segments Covered By Crop Type- Corn, Soybean, Cotton, Canola, potato, Sugar Beets, and Other Crop Types; By Trait Type- Herbicide Tolerance, Insect Resistance, and Other Trait Types. Regional Analysis North America – The US, Canada, & Mexico; Western Europe – Germany, France, The UK, Spain, Italy, Portugal, Ireland, Austria, Switzerland, Benelux, Nordic, & Rest of Western Europe; Eastern Europe – Russia, Poland, The Czech Republic, Greece, & Rest of Eastern Europe; APAC – China, Japan, South Korea, India, Australia & New Zealand, Indonesia, Malaysia, Philippines, Singapore, Thailand, Vietnam, & Rest of APAC; Latin America – Brazil, Colombia, Chile, Argentina, Costa Rica, & Rest of Latin America; Middle East & Africa – Algeria, Egypt, Israel, Kuwait, Nigeria, Saudi Arabia, South Africa, Turkey, United Arab Emirates, & Rest of MEA Competitive Landscape Barenbrug Holding B.V, BASF S.E., Bayer A.G, Corteva Inc., Groupe Limagrain Holding, KWS SAAT SE & Co. KGaA, Land O Lakes Inc., Sakata Seed Corp., Syngenta AG, Takii & Co. Ltd., Calytx Inc., JK Agri Genetics Ltd., Vimorin & Cie SA, Bejo Zadan B.V., DLF seeds A/S, DowDupont Inc.,Canterra Seeds Holdings Ltd., and Other key Players. Customization Scope Customization for segments, region/country-level will be provided. Moreover, additional customization can be done based on the requirements. Purchase Options We have three licenses to opt for: Single User License, Multi-User License (Up to 5 Users), Corporate Use License (Unlimited User and Printable PDF) -
- 1. Executive Summary
- 1.1. Definition
- 1.2. Taxonomy
- 1.3. Research Scope
- 1.4. Key Analysis
- 1.5. Key Findings by Major Segments
- 1.6. Top strategies by Major Players
- 2. Global Genetically Modified Seeds Market Overview
- 2.1. Genetically Modified Seeds Market Dynamics
- 2.1.1. Drivers
- 2.1.2. Opportunities
- 2.1.3. Restraints
- 2.1.4. Challenges
- 2.2. Macro-economic Factors
- 2.3. Regulatory Framework
- 2.4. Market Investment Feasibility Index
- 2.5. PEST Analysis
- 2.6. PORTER’S Five Force Analysis
- 2.7. Drivers & Restraints Impact Analysis
- 2.8. Industry Chain Analysis
- 2.9. Cost Structure Analysis
- 2.10. Marketing Strategy
- 2.11. Russia-Ukraine War Impact Analysis
- 2.12. Opportunity Map Analysis
- 2.13. Market Competition Scenario Analysis
- 2.14. Product Life Cycle Analysis
- 2.15. Opportunity Orbits
- 2.16. Manufacturer Intensity Map
- 2.17. Major Companies sales by Value & Volume
- 2.1. Genetically Modified Seeds Market Dynamics
- 3. Global Genetically Modified Seeds Market Analysis, Opportunity and Forecast, 2016-2032
- 3.1. Global Genetically Modified Seeds Market Analysis, 2016-2021
- 3.2. Global Genetically Modified Seeds Market Opportunity and Forecast, 2023-2032
- 3.3. Global Genetically Modified Seeds Market Analysis, Opportunity and Forecast, By Crop Type, 2016-2032
- 3.3.1. Global Genetically Modified Seeds Market Analysis by Crop Type: Introduction
- 3.3.2. Market Size Absolute $ Opportunity Analysis and Forecast, By Crop Type, 2016-2032
- 3.3.3. Corn
- 3.3.4. Soybean
- 3.3.5. Cotton
- 3.3.6. Canola
- 3.3.7. potato
- 3.3.8. Sugar Beets
- 3.3.9. Other Crop Types
- 3.4. Global Genetically Modified Seeds Market Analysis, Opportunity and Forecast, By Trait Type, 2016-2032
- 3.4.1. Global Genetically Modified Seeds Market Analysis by Trait Type: Introduction
- 3.4.2. Market Size Absolute $ Opportunity Analysis and Forecast, By Trait Type, 2016-2032
- 3.4.3. Herbicide Tolerance
- 3.4.4. Insect Resistance
- 3.4.5. Other Trait Types
- 4. North America Genetically Modified Seeds Market Analysis, Opportunity and Forecast, 2016-2032
- 4.1. North America Genetically Modified Seeds Market Analysis, 2016-2021
- 4.2. North America Genetically Modified Seeds Market Opportunity and Forecast, 2023-2032
- 4.3. North America Genetically Modified Seeds Market Analysis, Opportunity and Forecast, By Crop Type, 2016-2032
- 4.3.1. North America Genetically Modified Seeds Market Analysis by Crop Type: Introduction
- 4.3.2. Market Size Absolute $ Opportunity Analysis and Forecast, By Crop Type, 2016-2032
- 4.3.3. Corn
- 4.3.4. Soybean
- 4.3.5. Cotton
- 4.3.6. Canola
- 4.3.7. potato
- 4.3.8. Sugar Beets
- 4.3.9. Other Crop Types
- 4.4. North America Genetically Modified Seeds Market Analysis, Opportunity and Forecast, By Trait Type, 2016-2032
- 4.4.1. North America Genetically Modified Seeds Market Analysis by Trait Type: Introduction
- 4.4.2. Market Size Absolute $ Opportunity Analysis and Forecast, By Trait Type, 2016-2032
- 4.4.3. Herbicide Tolerance
- 4.4.4. Insect Resistance
- 4.4.5. Other Trait Types
- 4.5. North America Genetically Modified Seeds Market Analysis, Opportunity and Forecast, By Country , 2016-2032
- 4.5.1. North America Genetically Modified Seeds Market Analysis by Country : Introduction
- 4.5.2. Market Size Absolute $ Opportunity Analysis and Forecast, Country , 2016-2032
- 4.5.2.1. The US
- 4.5.2.2. Canada
- 4.5.2.3. Mexico
- 5. Western Europe Genetically Modified Seeds Market Analysis, Opportunity and Forecast, 2016-2032
- 5.1. Western Europe Genetically Modified Seeds Market Analysis, 2016-2021
- 5.2. Western Europe Genetically Modified Seeds Market Opportunity and Forecast, 2023-2032
- 5.3. Western Europe Genetically Modified Seeds Market Analysis, Opportunity and Forecast, By Crop Type, 2016-2032
- 5.3.1. Western Europe Genetically Modified Seeds Market Analysis by Crop Type: Introduction
- 5.3.2. Market Size Absolute $ Opportunity Analysis and Forecast, By Crop Type, 2016-2032
- 5.3.3. Corn
- 5.3.4. Soybean
- 5.3.5. Cotton
- 5.3.6. Canola
- 5.3.7. potato
- 5.3.8. Sugar Beets
- 5.3.9. Other Crop Types
- 5.4. Western Europe Genetically Modified Seeds Market Analysis, Opportunity and Forecast, By Trait Type, 2016-2032
- 5.4.1. Western Europe Genetically Modified Seeds Market Analysis by Trait Type: Introduction
- 5.4.2. Market Size Absolute $ Opportunity Analysis and Forecast, By Trait Type, 2016-2032
- 5.4.3. Herbicide Tolerance
- 5.4.4. Insect Resistance
- 5.4.5. Other Trait Types
- 5.5. Western Europe Genetically Modified Seeds Market Analysis, Opportunity and Forecast, By Country , 2016-2032
- 5.5.1. Western Europe Genetically Modified Seeds Market Analysis by Country : Introduction
- 5.5.2. Market Size Absolute $ Opportunity Analysis and Forecast, Country , 2016-2032
- 5.5.2.1. Germany
- 5.5.2.2. France
- 5.5.2.3. The UK
- 5.5.2.4. Spain
- 5.5.2.5. Italy
- 5.5.2.6. Portugal
- 5.5.2.7. Ireland
- 5.5.2.8. Austria
- 5.5.2.9. Switzerland
- 5.5.2.10. Benelux
- 5.5.2.11. Nordic
- 5.5.2.12. Rest of Western Europe
- 6. Eastern Europe Genetically Modified Seeds Market Analysis, Opportunity and Forecast, 2016-2032
- 6.1. Eastern Europe Genetically Modified Seeds Market Analysis, 2016-2021
- 6.2. Eastern Europe Genetically Modified Seeds Market Opportunity and Forecast, 2023-2032
- 6.3. Eastern Europe Genetically Modified Seeds Market Analysis, Opportunity and Forecast, By Crop Type, 2016-2032
- 6.3.1. Eastern Europe Genetically Modified Seeds Market Analysis by Crop Type: Introduction
- 6.3.2. Market Size Absolute $ Opportunity Analysis and Forecast, By Crop Type, 2016-2032
- 6.3.3. Corn
- 6.3.4. Soybean
- 6.3.5. Cotton
- 6.3.6. Canola
- 6.3.7. potato
- 6.3.8. Sugar Beets
- 6.3.9. Other Crop Types
- 6.4. Eastern Europe Genetically Modified Seeds Market Analysis, Opportunity and Forecast, By Trait Type, 2016-2032
- 6.4.1. Eastern Europe Genetically Modified Seeds Market Analysis by Trait Type: Introduction
- 6.4.2. Market Size Absolute $ Opportunity Analysis and Forecast, By Trait Type, 2016-2032
- 6.4.3. Herbicide Tolerance
- 6.4.4. Insect Resistance
- 6.4.5. Other Trait Types
- 6.5. Eastern Europe Genetically Modified Seeds Market Analysis, Opportunity and Forecast, By Country , 2016-2032
- 6.5.1. Eastern Europe Genetically Modified Seeds Market Analysis by Country : Introduction
- 6.5.2. Market Size Absolute $ Opportunity Analysis and Forecast, Country , 2016-2032
- 6.5.2.1. Russia
- 6.5.2.2. Poland
- 6.5.2.3. The Czech Republic
- 6.5.2.4. Greece
- 6.5.2.5. Rest of Eastern Europe
- 7. APAC Genetically Modified Seeds Market Analysis, Opportunity and Forecast, 2016-2032
- 7.1. APAC Genetically Modified Seeds Market Analysis, 2016-2021
- 7.2. APAC Genetically Modified Seeds Market Opportunity and Forecast, 2023-2032
- 7.3. APAC Genetically Modified Seeds Market Analysis, Opportunity and Forecast, By Crop Type, 2016-2032
- 7.3.1. APAC Genetically Modified Seeds Market Analysis by Crop Type: Introduction
- 7.3.2. Market Size Absolute $ Opportunity Analysis and Forecast, By Crop Type, 2016-2032
- 7.3.3. Corn
- 7.3.4. Soybean
- 7.3.5. Cotton
- 7.3.6. Canola
- 7.3.7. potato
- 7.3.8. Sugar Beets
- 7.3.9. Other Crop Types
- 7.4. APAC Genetically Modified Seeds Market Analysis, Opportunity and Forecast, By Trait Type, 2016-2032
- 7.4.1. APAC Genetically Modified Seeds Market Analysis by Trait Type: Introduction
- 7.4.2. Market Size Absolute $ Opportunity Analysis and Forecast, By Trait Type, 2016-2032
- 7.4.3. Herbicide Tolerance
- 7.4.4. Insect Resistance
- 7.4.5. Other Trait Types
- 7.5. APAC Genetically Modified Seeds Market Analysis, Opportunity and Forecast, By Country , 2016-2032
- 7.5.1. APAC Genetically Modified Seeds Market Analysis by Country : Introduction
- 7.5.2. Market Size Absolute $ Opportunity Analysis and Forecast, Country , 2016-2032
- 7.5.2.1. China
- 7.5.2.2. Japan
- 7.5.2.3. South Korea
- 7.5.2.4. India
- 7.5.2.5. Australia & New Zeland
- 7.5.2.6. Indonesia
- 7.5.2.7. Malaysia
- 7.5.2.8. Philippines
- 7.5.2.9. Singapore
- 7.5.2.10. Thailand
- 7.5.2.11. Vietnam
- 7.5.2.12. Rest of APAC
- 8. Latin America Genetically Modified Seeds Market Analysis, Opportunity and Forecast, 2016-2032
- 8.1. Latin America Genetically Modified Seeds Market Analysis, 2016-2021
- 8.2. Latin America Genetically Modified Seeds Market Opportunity and Forecast, 2023-2032
- 8.3. Latin America Genetically Modified Seeds Market Analysis, Opportunity and Forecast, By Crop Type, 2016-2032
- 8.3.1. Latin America Genetically Modified Seeds Market Analysis by Crop Type: Introduction
- 8.3.2. Market Size Absolute $ Opportunity Analysis and Forecast, By Crop Type, 2016-2032
- 8.3.3. Corn
- 8.3.4. Soybean
- 8.3.5. Cotton
- 8.3.6. Canola
- 8.3.7. potato
- 8.3.8. Sugar Beets
- 8.3.9. Other Crop Types
- 8.4. Latin America Genetically Modified Seeds Market Analysis, Opportunity and Forecast, By Trait Type, 2016-2032
- 8.4.1. Latin America Genetically Modified Seeds Market Analysis by Trait Type: Introduction
- 8.4.2. Market Size Absolute $ Opportunity Analysis and Forecast, By Trait Type, 2016-2032
- 8.4.3. Herbicide Tolerance
- 8.4.4. Insect Resistance
- 8.4.5. Other Trait Types
- 8.5. Latin America Genetically Modified Seeds Market Analysis, Opportunity and Forecast, By Country , 2016-2032
- 8.5.1. Latin America Genetically Modified Seeds Market Analysis by Country : Introduction
- 8.5.2. Market Size Absolute $ Opportunity Analysis and Forecast, Country , 2016-2032
- 8.5.2.1. Brazil
- 8.5.2.2. Colombia
- 8.5.2.3. Chile
- 8.5.2.4. Argentina
- 8.5.2.5. Costa Rica
- 8.5.2.6. Rest of Latin America
- 9. Middle East & Africa Genetically Modified Seeds Market Analysis, Opportunity and Forecast, 2016-2032
- 9.1. Middle East & Africa Genetically Modified Seeds Market Analysis, 2016-2021
- 9.2. Middle East & Africa Genetically Modified Seeds Market Opportunity and Forecast, 2023-2032
- 9.3. Middle East & Africa Genetically Modified Seeds Market Analysis, Opportunity and Forecast, By Crop Type, 2016-2032
- 9.3.1. Middle East & Africa Genetically Modified Seeds Market Analysis by Crop Type: Introduction
- 9.3.2. Market Size Absolute $ Opportunity Analysis and Forecast, By Crop Type, 2016-2032
- 9.3.3. Corn
- 9.3.4. Soybean
- 9.3.5. Cotton
- 9.3.6. Canola
- 9.3.7. potato
- 9.3.8. Sugar Beets
- 9.3.9. Other Crop Types
- 9.4. Middle East & Africa Genetically Modified Seeds Market Analysis, Opportunity and Forecast, By Trait Type, 2016-2032
- 9.4.1. Middle East & Africa Genetically Modified Seeds Market Analysis by Trait Type: Introduction
- 9.4.2. Market Size Absolute $ Opportunity Analysis and Forecast, By Trait Type, 2016-2032
- 9.4.3. Herbicide Tolerance
- 9.4.4. Insect Resistance
- 9.4.5. Other Trait Types
- 9.5. Middle East & Africa Genetically Modified Seeds Market Analysis, Opportunity and Forecast, By Country , 2016-2032
- 9.5.1. Middle East & Africa Genetically Modified Seeds Market Analysis by Country : Introduction
- 9.5.2. Market Size Absolute $ Opportunity Analysis and Forecast, Country , 2016-2032
- 9.5.2.1. Algeria
- 9.5.2.2. Egypt
- 9.5.2.3. Israel
- 9.5.2.4. Kuwait
- 9.5.2.5. Nigeria
- 9.5.2.6. Saudi Arabia
- 9.5.2.7. South Africa
- 9.5.2.8. Turkey
- 9.5.2.9. The UAE
- 9.5.2.10. Rest of MEA
- 10. Global Genetically Modified Seeds Market Analysis, Opportunity and Forecast, By Region , 2016-2032
- 10.1. Global Genetically Modified Seeds Market Analysis by Region : Introduction
- 10.2. Market Size Absolute $ Opportunity Analysis and Forecast, By Region , 2016-2032
- 10.2.1. North America
- 10.2.2. Western Europe
- 10.2.3. Eastern Europe
- 10.2.4. APAC
- 10.2.5. Latin America
- 10.2.6. Middle East & Africa
- 11. Global Genetically Modified Seeds Market Competitive Landscape, Market Share Analysis, and Company Profiles
- 11.1. Market Share Analysis
- 11.2. Company Profiles
- 11.3. Barenbrug Holding B.V
- 11.3.1. Company Overview
- 11.3.2. Financial Highlights
- 11.3.3. Product Portfolio
- 11.3.4. SWOT Analysis
- 11.3.5. Key Strategies and Developments
- 11.4. BASF S.E.
- 11.4.1. Company Overview
- 11.4.2. Financial Highlights
- 11.4.3. Product Portfolio
- 11.4.4. SWOT Analysis
- 11.4.5. Key Strategies and Developments
- 11.5. Bayer A.G
- 11.5.1. Company Overview
- 11.5.2. Financial Highlights
- 11.5.3. Product Portfolio
- 11.5.4. SWOT Analysis
- 11.5.5. Key Strategies and Developments
- 11.6. Corteva Inc.
- 11.6.1. Company Overview
- 11.6.2. Financial Highlights
- 11.6.3. Product Portfolio
- 11.6.4. SWOT Analysis
- 11.6.5. Key Strategies and Developments
- 11.7. Groupe Limagrain Holding
- 11.7.1. Company Overview
- 11.7.2. Financial Highlights
- 11.7.3. Product Portfolio
- 11.7.4. SWOT Analysis
- 11.7.5. Key Strategies and Developments
- 11.8. KWS SAAT SE & Co. KGaA
- 11.8.1. Company Overview
- 11.8.2. Financial Highlights
- 11.8.3. Product Portfolio
- 11.8.4. SWOT Analysis
- 11.8.5. Key Strategies and Developments
- 11.9. Land O Lakes Inc.
- 11.9.1. Company Overview
- 11.9.2. Financial Highlights
- 11.9.3. Product Portfolio
- 11.9.4. SWOT Analysis
- 11.9.5. Key Strategies and Developments
- 11.10. Sakata Seed Corp.
- 11.10.1. Company Overview
- 11.10.2. Financial Highlights
- 11.10.3. Product Portfolio
- 11.10.4. SWOT Analysis
- 11.10.5. Key Strategies and Developments
- 11.11. Syngenta AG
- 11.11.1. Company Overview
- 11.11.2. Financial Highlights
- 11.11.3. Product Portfolio
- 11.11.4. SWOT Analysis
- 11.11.5. Key Strategies and Developments
- 11.12. Takii & Co. Ltd.
- 11.12.1. Company Overview
- 11.12.2. Financial Highlights
- 11.12.3. Product Portfolio
- 11.12.4. SWOT Analysis
- 11.12.5. Key Strategies and Developments
- 11.13. Calytx Inc.
- 11.13.1. Company Overview
- 11.13.2. Financial Highlights
- 11.13.3. Product Portfolio
- 11.13.4. SWOT Analysis
- 11.13.5. Key Strategies and Developments
- 11.14. Other Key Players
- 11.14.1. Company Overview
- 11.14.2. Financial Highlights
- 11.14.3. Product Portfolio
- 11.14.4. SWOT Analysis
- 11.14.5. Key Strategies and Developments
- 12. Assumptions and Acronyms
- 13. Research Methodology
- 14. Contact
- List of Figures
- Figure 1: Global Genetically Modified Seeds Market Revenue (US$ Mn) Market Share by Crop Type in 2022
- Figure 2: Global Genetically Modified Seeds Market Attractiveness Analysis by Crop Type, 2016-2032
- Figure 3: Global Genetically Modified Seeds Market Revenue (US$ Mn) Market Share by Trait Typein 2022
- Figure 4: Global Genetically Modified Seeds Market Attractiveness Analysis by Trait Type, 2016-2032
- Figure 5: Global Genetically Modified Seeds Market Revenue (US$ Mn) Market Share by Region in 2022
- Figure 6: Global Genetically Modified Seeds Market Attractiveness Analysis by Region, 2016-2032
- Figure 7: Global Genetically Modified Seeds Market Revenue (US$ Mn) (2016-2032)
- Figure 8: Global Genetically Modified Seeds Market Revenue (US$ Mn) Comparison by Region (2016-2032)
- Figure 9: Global Genetically Modified Seeds Market Revenue (US$ Mn) Comparison by Crop Type (2016-2032)
- Figure 10: Global Genetically Modified Seeds Market Revenue (US$ Mn) Comparison by Trait Type (2016-2032)
- Figure 11: Global Genetically Modified Seeds Market Y-o-Y Growth Rate Comparison by Region (2016-2032)
- Figure 12: Global Genetically Modified Seeds Market Y-o-Y Growth Rate Comparison by Crop Type (2016-2032)
- Figure 13: Global Genetically Modified Seeds Market Y-o-Y Growth Rate Comparison by Trait Type (2016-2032)
- Figure 14: Global Genetically Modified Seeds Market Share Comparison by Region (2016-2032)
- Figure 15: Global Genetically Modified Seeds Market Share Comparison by Crop Type (2016-2032)
- Figure 16: Global Genetically Modified Seeds Market Share Comparison by Trait Type (2016-2032)
- Figure 17: North America Genetically Modified Seeds Market Revenue (US$ Mn) Market Share by Crop Typein 2022
- Figure 18: North America Genetically Modified Seeds Market Attractiveness Analysis by Crop Type, 2016-2032
- Figure 19: North America Genetically Modified Seeds Market Revenue (US$ Mn) Market Share by Trait Typein 2022
- Figure 20: North America Genetically Modified Seeds Market Attractiveness Analysis by Trait Type, 2016-2032
- Figure 21: North America Genetically Modified Seeds Market Revenue (US$ Mn) Market Share by Country in 2022
- Figure 22: North America Genetically Modified Seeds Market Attractiveness Analysis by Country, 2016-2032
- Figure 23: North America Genetically Modified Seeds Market Revenue (US$ Mn) (2016-2032)
- Figure 24: North America Genetically Modified Seeds Market Revenue (US$ Mn) Comparison by Country (2016-2032)
- Figure 25: North America Genetically Modified Seeds Market Revenue (US$ Mn) Comparison by Crop Type (2016-2032)
- Figure 26: North America Genetically Modified Seeds Market Revenue (US$ Mn) Comparison by Trait Type (2016-2032)
- Figure 27: North America Genetically Modified Seeds Market Y-o-Y Growth Rate Comparison by Country (2016-2032)
- Figure 28: North America Genetically Modified Seeds Market Y-o-Y Growth Rate Comparison by Crop Type (2016-2032)
- Figure 29: North America Genetically Modified Seeds Market Y-o-Y Growth Rate Comparison by Trait Type (2016-2032)
- Figure 30: North America Genetically Modified Seeds Market Share Comparison by Country (2016-2032)
- Figure 31: North America Genetically Modified Seeds Market Share Comparison by Crop Type (2016-2032)
- Figure 32: North America Genetically Modified Seeds Market Share Comparison by Trait Type (2016-2032)
- Figure 33: Western Europe Genetically Modified Seeds Market Revenue (US$ Mn) Market Share by Crop Typein 2022
- Figure 34: Western Europe Genetically Modified Seeds Market Attractiveness Analysis by Crop Type, 2016-2032
- Figure 35: Western Europe Genetically Modified Seeds Market Revenue (US$ Mn) Market Share by Trait Typein 2022
- Figure 36: Western Europe Genetically Modified Seeds Market Attractiveness Analysis by Trait Type, 2016-2032
- Figure 37: Western Europe Genetically Modified Seeds Market Revenue (US$ Mn) Market Share by Country in 2022
- Figure 38: Western Europe Genetically Modified Seeds Market Attractiveness Analysis by Country, 2016-2032
- Figure 39: Western Europe Genetically Modified Seeds Market Revenue (US$ Mn) (2016-2032)
- Figure 40: Western Europe Genetically Modified Seeds Market Revenue (US$ Mn) Comparison by Country (2016-2032)
- Figure 41: Western Europe Genetically Modified Seeds Market Revenue (US$ Mn) Comparison by Crop Type (2016-2032)
- Figure 42: Western Europe Genetically Modified Seeds Market Revenue (US$ Mn) Comparison by Trait Type (2016-2032)
- Figure 43: Western Europe Genetically Modified Seeds Market Y-o-Y Growth Rate Comparison by Country (2016-2032)
- Figure 44: Western Europe Genetically Modified Seeds Market Y-o-Y Growth Rate Comparison by Crop Type (2016-2032)
- Figure 45: Western Europe Genetically Modified Seeds Market Y-o-Y Growth Rate Comparison by Trait Type (2016-2032)
- Figure 46: Western Europe Genetically Modified Seeds Market Share Comparison by Country (2016-2032)
- Figure 47: Western Europe Genetically Modified Seeds Market Share Comparison by Crop Type (2016-2032)
- Figure 48: Western Europe Genetically Modified Seeds Market Share Comparison by Trait Type (2016-2032)
- Figure 49: Eastern Europe Genetically Modified Seeds Market Revenue (US$ Mn) Market Share by Crop Typein 2022
- Figure 50: Eastern Europe Genetically Modified Seeds Market Attractiveness Analysis by Crop Type, 2016-2032
- Figure 51: Eastern Europe Genetically Modified Seeds Market Revenue (US$ Mn) Market Share by Trait Typein 2022
- Figure 52: Eastern Europe Genetically Modified Seeds Market Attractiveness Analysis by Trait Type, 2016-2032
- Figure 53: Eastern Europe Genetically Modified Seeds Market Revenue (US$ Mn) Market Share by Country in 2022
- Figure 54: Eastern Europe Genetically Modified Seeds Market Attractiveness Analysis by Country, 2016-2032
- Figure 55: Eastern Europe Genetically Modified Seeds Market Revenue (US$ Mn) (2016-2032)
- Figure 56: Eastern Europe Genetically Modified Seeds Market Revenue (US$ Mn) Comparison by Country (2016-2032)
- Figure 57: Eastern Europe Genetically Modified Seeds Market Revenue (US$ Mn) Comparison by Crop Type (2016-2032)
- Figure 58: Eastern Europe Genetically Modified Seeds Market Revenue (US$ Mn) Comparison by Trait Type (2016-2032)
- Figure 59: Eastern Europe Genetically Modified Seeds Market Y-o-Y Growth Rate Comparison by Country (2016-2032)
- Figure 60: Eastern Europe Genetically Modified Seeds Market Y-o-Y Growth Rate Comparison by Crop Type (2016-2032)
- Figure 61: Eastern Europe Genetically Modified Seeds Market Y-o-Y Growth Rate Comparison by Trait Type (2016-2032)
- Figure 62: Eastern Europe Genetically Modified Seeds Market Share Comparison by Country (2016-2032)
- Figure 63: Eastern Europe Genetically Modified Seeds Market Share Comparison by Crop Type (2016-2032)
- Figure 64: Eastern Europe Genetically Modified Seeds Market Share Comparison by Trait Type (2016-2032)
- Figure 65: APAC Genetically Modified Seeds Market Revenue (US$ Mn) Market Share by Crop Typein 2022
- Figure 66: APAC Genetically Modified Seeds Market Attractiveness Analysis by Crop Type, 2016-2032
- Figure 67: APAC Genetically Modified Seeds Market Revenue (US$ Mn) Market Share by Trait Typein 2022
- Figure 68: APAC Genetically Modified Seeds Market Attractiveness Analysis by Trait Type, 2016-2032
- Figure 69: APAC Genetically Modified Seeds Market Revenue (US$ Mn) Market Share by Country in 2022
- Figure 70: APAC Genetically Modified Seeds Market Attractiveness Analysis by Country, 2016-2032
- Figure 71: APAC Genetically Modified Seeds Market Revenue (US$ Mn) (2016-2032)
- Figure 72: APAC Genetically Modified Seeds Market Revenue (US$ Mn) Comparison by Country (2016-2032)
- Figure 73: APAC Genetically Modified Seeds Market Revenue (US$ Mn) Comparison by Crop Type (2016-2032)
- Figure 74: APAC Genetically Modified Seeds Market Revenue (US$ Mn) Comparison by Trait Type (2016-2032)
- Figure 75: APAC Genetically Modified Seeds Market Y-o-Y Growth Rate Comparison by Country (2016-2032)
- Figure 76: APAC Genetically Modified Seeds Market Y-o-Y Growth Rate Comparison by Crop Type (2016-2032)
- Figure 77: APAC Genetically Modified Seeds Market Y-o-Y Growth Rate Comparison by Trait Type (2016-2032)
- Figure 78: APAC Genetically Modified Seeds Market Share Comparison by Country (2016-2032)
- Figure 79: APAC Genetically Modified Seeds Market Share Comparison by Crop Type (2016-2032)
- Figure 80: APAC Genetically Modified Seeds Market Share Comparison by Trait Type (2016-2032)
- Figure 81: Latin America Genetically Modified Seeds Market Revenue (US$ Mn) Market Share by Crop Typein 2022
- Figure 82: Latin America Genetically Modified Seeds Market Attractiveness Analysis by Crop Type, 2016-2032
- Figure 83: Latin America Genetically Modified Seeds Market Revenue (US$ Mn) Market Share by Trait Typein 2022
- Figure 84: Latin America Genetically Modified Seeds Market Attractiveness Analysis by Trait Type, 2016-2032
- Figure 85: Latin America Genetically Modified Seeds Market Revenue (US$ Mn) Market Share by Country in 2022
- Figure 86: Latin America Genetically Modified Seeds Market Attractiveness Analysis by Country, 2016-2032
- Figure 87: Latin America Genetically Modified Seeds Market Revenue (US$ Mn) (2016-2032)
- Figure 88: Latin America Genetically Modified Seeds Market Revenue (US$ Mn) Comparison by Country (2016-2032)
- Figure 89: Latin America Genetically Modified Seeds Market Revenue (US$ Mn) Comparison by Crop Type (2016-2032)
- Figure 90: Latin America Genetically Modified Seeds Market Revenue (US$ Mn) Comparison by Trait Type (2016-2032)
- Figure 91: Latin America Genetically Modified Seeds Market Y-o-Y Growth Rate Comparison by Country (2016-2032)
- Figure 92: Latin America Genetically Modified Seeds Market Y-o-Y Growth Rate Comparison by Crop Type (2016-2032)
- Figure 93: Latin America Genetically Modified Seeds Market Y-o-Y Growth Rate Comparison by Trait Type (2016-2032)
- Figure 94: Latin America Genetically Modified Seeds Market Share Comparison by Country (2016-2032)
- Figure 95: Latin America Genetically Modified Seeds Market Share Comparison by Crop Type (2016-2032)
- Figure 96: Latin America Genetically Modified Seeds Market Share Comparison by Trait Type (2016-2032)
- Figure 97: Middle East & Africa Genetically Modified Seeds Market Revenue (US$ Mn) Market Share by Crop Typein 2022
- Figure 98: Middle East & Africa Genetically Modified Seeds Market Attractiveness Analysis by Crop Type, 2016-2032
- Figure 99: Middle East & Africa Genetically Modified Seeds Market Revenue (US$ Mn) Market Share by Trait Typein 2022
- Figure 100: Middle East & Africa Genetically Modified Seeds Market Attractiveness Analysis by Trait Type, 2016-2032
- Figure 101: Middle East & Africa Genetically Modified Seeds Market Revenue (US$ Mn) Market Share by Country in 2022
- Figure 102: Middle East & Africa Genetically Modified Seeds Market Attractiveness Analysis by Country, 2016-2032
- Figure 103: Middle East & Africa Genetically Modified Seeds Market Revenue (US$ Mn) (2016-2032)
- Figure 104: Middle East & Africa Genetically Modified Seeds Market Revenue (US$ Mn) Comparison by Country (2016-2032)
- Figure 105: Middle East & Africa Genetically Modified Seeds Market Revenue (US$ Mn) Comparison by Crop Type (2016-2032)
- Figure 106: Middle East & Africa Genetically Modified Seeds Market Revenue (US$ Mn) Comparison by Trait Type (2016-2032)
- Figure 107: Middle East & Africa Genetically Modified Seeds Market Y-o-Y Growth Rate Comparison by Country (2016-2032)
- Figure 108: Middle East & Africa Genetically Modified Seeds Market Y-o-Y Growth Rate Comparison by Crop Type (2016-2032)
- Figure 109: Middle East & Africa Genetically Modified Seeds Market Y-o-Y Growth Rate Comparison by Trait Type (2016-2032)
- Figure 110: Middle East & Africa Genetically Modified Seeds Market Share Comparison by Country (2016-2032)
- Figure 111: Middle East & Africa Genetically Modified Seeds Market Share Comparison by Crop Type (2016-2032)
- Figure 112: Middle East & Africa Genetically Modified Seeds Market Share Comparison by Trait Type (2016-2032)
- List of Tables
- Table 1: Global Genetically Modified Seeds Market Comparison by Crop Type (2016-2032)
- Table 2: Global Genetically Modified Seeds Market Comparison by Trait Type (2016-2032)
- Table 3: Global Genetically Modified Seeds Market Revenue (US$ Mn) Comparison by Region (2016-2032)
- Table 4: Global Genetically Modified Seeds Market Revenue (US$ Mn) (2016-2032)
- Table 5: Global Genetically Modified Seeds Market Revenue (US$ Mn) Comparison by Region (2016-2032)
- Table 6: Global Genetically Modified Seeds Market Revenue (US$ Mn) Comparison by Crop Type (2016-2032)
- Table 7: Global Genetically Modified Seeds Market Revenue (US$ Mn) Comparison by Trait Type (2016-2032)
- Table 8: Global Genetically Modified Seeds Market Y-o-Y Growth Rate Comparison by Region (2016-2032)
- Table 9: Global Genetically Modified Seeds Market Y-o-Y Growth Rate Comparison by Crop Type (2016-2032)
- Table 10: Global Genetically Modified Seeds Market Y-o-Y Growth Rate Comparison by Trait Type (2016-2032)
- Table 11: Global Genetically Modified Seeds Market Share Comparison by Region (2016-2032)
- Table 12: Global Genetically Modified Seeds Market Share Comparison by Crop Type (2016-2032)
- Table 13: Global Genetically Modified Seeds Market Share Comparison by Trait Type (2016-2032)
- Table 14: North America Genetically Modified Seeds Market Comparison by Trait Type (2016-2032)
- Table 15: North America Genetically Modified Seeds Market Revenue (US$ Mn) Comparison by Country (2016-2032)
- Table 16: North America Genetically Modified Seeds Market Revenue (US$ Mn) (2016-2032)
- Table 17: North America Genetically Modified Seeds Market Revenue (US$ Mn) Comparison by Country (2016-2032)
- Table 18: North America Genetically Modified Seeds Market Revenue (US$ Mn) Comparison by Crop Type (2016-2032)
- Table 19: North America Genetically Modified Seeds Market Revenue (US$ Mn) Comparison by Trait Type (2016-2032)
- Table 20: North America Genetically Modified Seeds Market Y-o-Y Growth Rate Comparison by Country (2016-2032)
- Table 21: North America Genetically Modified Seeds Market Y-o-Y Growth Rate Comparison by Crop Type (2016-2032)
- Table 22: North America Genetically Modified Seeds Market Y-o-Y Growth Rate Comparison by Trait Type (2016-2032)
- Table 23: North America Genetically Modified Seeds Market Share Comparison by Country (2016-2032)
- Table 24: North America Genetically Modified Seeds Market Share Comparison by Crop Type (2016-2032)
- Table 25: North America Genetically Modified Seeds Market Share Comparison by Trait Type (2016-2032)
- Table 26: Western Europe Genetically Modified Seeds Market Comparison by Crop Type (2016-2032)
- Table 27: Western Europe Genetically Modified Seeds Market Comparison by Trait Type (2016-2032)
- Table 28: Western Europe Genetically Modified Seeds Market Revenue (US$ Mn) Comparison by Country (2016-2032)
- Table 29: Western Europe Genetically Modified Seeds Market Revenue (US$ Mn) (2016-2032)
- Table 30: Western Europe Genetically Modified Seeds Market Revenue (US$ Mn) Comparison by Country (2016-2032)
- Table 31: Western Europe Genetically Modified Seeds Market Revenue (US$ Mn) Comparison by Crop Type (2016-2032)
- Table 32: Western Europe Genetically Modified Seeds Market Revenue (US$ Mn) Comparison by Trait Type (2016-2032)
- Table 33: Western Europe Genetically Modified Seeds Market Y-o-Y Growth Rate Comparison by Country (2016-2032)
- Table 34: Western Europe Genetically Modified Seeds Market Y-o-Y Growth Rate Comparison by Crop Type (2016-2032)
- Table 35: Western Europe Genetically Modified Seeds Market Y-o-Y Growth Rate Comparison by Trait Type (2016-2032)
- Table 36: Western Europe Genetically Modified Seeds Market Share Comparison by Country (2016-2032)
- Table 37: Western Europe Genetically Modified Seeds Market Share Comparison by Crop Type (2016-2032)
- Table 38: Western Europe Genetically Modified Seeds Market Share Comparison by Trait Type (2016-2032)
- Table 39: Eastern Europe Genetically Modified Seeds Market Comparison by Crop Type (2016-2032)
- Table 40: Eastern Europe Genetically Modified Seeds Market Comparison by Trait Type (2016-2032)
- Table 41: Eastern Europe Genetically Modified Seeds Market Revenue (US$ Mn) Comparison by Country (2016-2032)
- Table 42: Eastern Europe Genetically Modified Seeds Market Revenue (US$ Mn) (2016-2032)
- Table 43: Eastern Europe Genetically Modified Seeds Market Revenue (US$ Mn) Comparison by Country (2016-2032)
- Table 44: Eastern Europe Genetically Modified Seeds Market Revenue (US$ Mn) Comparison by Crop Type (2016-2032)
- Table 45: Eastern Europe Genetically Modified Seeds Market Revenue (US$ Mn) Comparison by Trait Type (2016-2032)
- Table 46: Eastern Europe Genetically Modified Seeds Market Y-o-Y Growth Rate Comparison by Country (2016-2032)
- Table 47: Eastern Europe Genetically Modified Seeds Market Y-o-Y Growth Rate Comparison by Crop Type (2016-2032)
- Table 48: Eastern Europe Genetically Modified Seeds Market Y-o-Y Growth Rate Comparison by Trait Type (2016-2032)
- Table 49: Eastern Europe Genetically Modified Seeds Market Share Comparison by Country (2016-2032)
- Table 50: Eastern Europe Genetically Modified Seeds Market Share Comparison by Crop Type (2016-2032)
- Table 51: Eastern Europe Genetically Modified Seeds Market Share Comparison by Trait Type (2016-2032)
- Table 52: APAC Genetically Modified Seeds Market Comparison by Crop Type (2016-2032)
- Table 53: APAC Genetically Modified Seeds Market Comparison by Trait Type (2016-2032)
- Table 54: APAC Genetically Modified Seeds Market Revenue (US$ Mn) Comparison by Country (2016-2032)
- Table 55: APAC Genetically Modified Seeds Market Revenue (US$ Mn) (2016-2032)
- Table 56: APAC Genetically Modified Seeds Market Revenue (US$ Mn) Comparison by Country (2016-2032)
- Table 57: APAC Genetically Modified Seeds Market Revenue (US$ Mn) Comparison by Crop Type (2016-2032)
- Table 58: APAC Genetically Modified Seeds Market Revenue (US$ Mn) Comparison by Trait Type (2016-2032)
- Table 59: APAC Genetically Modified Seeds Market Y-o-Y Growth Rate Comparison by Country (2016-2032)
- Table 60: APAC Genetically Modified Seeds Market Y-o-Y Growth Rate Comparison by Crop Type (2016-2032)
- Table 61: APAC Genetically Modified Seeds Market Y-o-Y Growth Rate Comparison by Trait Type (2016-2032)
- Table 62: APAC Genetically Modified Seeds Market Share Comparison by Country (2016-2032)
- Table 63: APAC Genetically Modified Seeds Market Share Comparison by Crop Type (2016-2032)
- Table 64: APAC Genetically Modified Seeds Market Share Comparison by Trait Type (2016-2032)
- Table 65: Latin America Genetically Modified Seeds Market Comparison by Crop Type (2016-2032)
- Table 66: Latin America Genetically Modified Seeds Market Comparison by Trait Type (2016-2032)
- Table 67: Latin America Genetically Modified Seeds Market Revenue (US$ Mn) Comparison by Country (2016-2032)
- Table 68: Latin America Genetically Modified Seeds Market Revenue (US$ Mn) (2016-2032)
- Table 69: Latin America Genetically Modified Seeds Market Revenue (US$ Mn) Comparison by Country (2016-2032)
- Table 70: Latin America Genetically Modified Seeds Market Revenue (US$ Mn) Comparison by Crop Type (2016-2032)
- Table 71: Latin America Genetically Modified Seeds Market Revenue (US$ Mn) Comparison by Trait Type (2016-2032)
- Table 72: Latin America Genetically Modified Seeds Market Y-o-Y Growth Rate Comparison by Country (2016-2032)
- Table 73: Latin America Genetically Modified Seeds Market Y-o-Y Growth Rate Comparison by Crop Type (2016-2032)
- Table 74: Latin America Genetically Modified Seeds Market Y-o-Y Growth Rate Comparison by Trait Type (2016-2032)
- Table 75: Latin America Genetically Modified Seeds Market Share Comparison by Country (2016-2032)
- Table 76: Latin America Genetically Modified Seeds Market Share Comparison by Crop Type (2016-2032)
- Table 77: Latin America Genetically Modified Seeds Market Share Comparison by Trait Type (2016-2032)
- Table 78: Middle East & Africa Genetically Modified Seeds Market Comparison by Crop Type (2016-2032)
- Table 79: Middle East & Africa Genetically Modified Seeds Market Comparison by Trait Type (2016-2032)
- Table 80: Middle East & Africa Genetically Modified Seeds Market Revenue (US$ Mn) Comparison by Country (2016-2032)
- Table 81: Middle East & Africa Genetically Modified Seeds Market Revenue (US$ Mn) (2016-2032)
- Table 82: Middle East & Africa Genetically Modified Seeds Market Revenue (US$ Mn) Comparison by Country (2016-2032)
- Table 83: Middle East & Africa Genetically Modified Seeds Market Revenue (US$ Mn) Comparison by Crop Type (2016-2032)
- Table 84: Middle East & Africa Genetically Modified Seeds Market Revenue (US$ Mn) Comparison by Trait Type (2016-2032)
- Table 85: Middle East & Africa Genetically Modified Seeds Market Y-o-Y Growth Rate Comparison by Country (2016-2032)
- Table 86: Middle East & Africa Genetically Modified Seeds Market Y-o-Y Growth Rate Comparison by Crop Type (2016-2032)
- Table 87: Middle East & Africa Genetically Modified Seeds Market Y-o-Y Growth Rate Comparison by Trait Type (2016-2032)
- Table 88: Middle East & Africa Genetically Modified Seeds Market Share Comparison by Country (2016-2032)
- Table 89: Middle East & Africa Genetically Modified Seeds Market Share Comparison by Crop Type (2016-2032)
- Table 90: Middle East & Africa Genetically Modified Seeds Market Share Comparison by Trait Type (2016-2032)
- 1. Executive Summary
-
- Barenbrug Holding B.V
- BASF S.E.
- Bayer A.G
- Corteva Inc.
- Groupe Limagrain Holding
- KWS SAAT SE & Co. KGaA
- Land O Lakes Inc.
- Sakata Seed Corp.
- Syngenta AG
- Takii & Co. Ltd.
- Calytx Inc.
- JK Agri Genetics Ltd.
- Vimorin & Cie SA
- Bejo Zadan B.V.
- DLF seeds A/S
- DowDupont Inc.
- Canterra Seeds Holdings Ltd.
- Other key Players
Our Clients


View Our Licence Options
