
Generative ai in Security Market By Type (Network Security, Application Security, Cloud Security, Other Security Types), By Service (Professional Services, Managed Services), By Deployment Mode (Cloud-Based, On-premises), By End Users (Retail, BFSI, Manufacturing, Healthcare, Other End-Users), By Region and Companies - Industry Segment Outlook, Market Assessment, Competition Scenario, Trends and Forecast 2024-2033
-
37856
-
Aug 2024
-
137
-


-
This report was compiled by Vishwa Gaul Vishwa is an experienced market research and consulting professional with over 8 years of expertise in the ICT industry, contributing to over 700 reports across telecommunications, software, hardware, and digital solutions. Correspondence Team Lead- ICT Linkedin | Detailed Market research Methodology Our methodology involves a mix of primary research, including interviews with leading mental health experts, and secondary research from reputable medical journals and databases. View Detailed Methodology Page
-
Quick Navigation
Report Overview
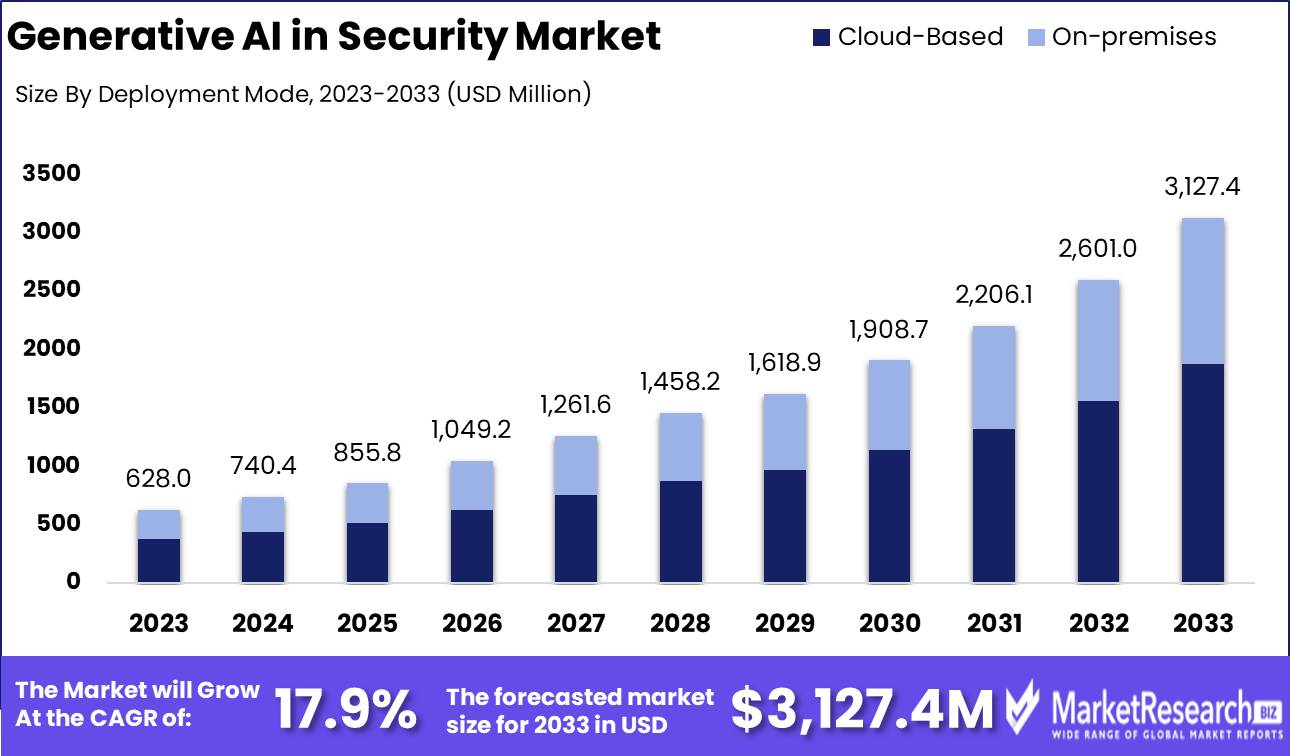
The Global Generative ai in Security Market was valued at USD 628 Mn in 2023. It is expected to reach USD 3127.4 Bn by 2033, with a CAGR of 17.9% during the forecast period from 2024 to 2033.
The Generative AI in Security Market encompasses the use of generative artificial intelligence technologies to enhance cybersecurity measures. This includes AI-driven tools and platforms designed to detect, respond to, and prevent cyber threats in real-time. The market is driven by the increasing sophistication of cyber-attacks and the need for advanced, autonomous security solutions. Generative AI's ability to analyze vast amounts of data and identify patterns makes it a critical component in modern cybersecurity strategies, helping organizations protect sensitive information and maintain operational integrity.
 The Generative AI in Security Market is poised for transformative growth, driven by the escalating complexity of cyber threats and the need for advanced, proactive security measures. SentinelOne's AI-driven platform, capable of autonomously responding to threats in under 30 seconds, exemplifies the significant operational efficiency gains offered by generative AI. This rapid response capability is crucial in mitigating damage and maintaining the integrity of organizational systems.
In 2022, phishing attacks increased by 21%, highlighting the potential misuse of generative AI by cybercriminals to craft more convincing and sophisticated attacks. This trend underscores the dual-edged nature of AI in cybersecurity—while it provides powerful tools for defense, it also equips attackers with advanced capabilities. Therefore, the deployment of generative AI in security requires continuous innovation and vigilance to stay ahead of evolving threats.
Generative AI enhances security by analyzing vast datasets to identify patterns and anomalies indicative of potential threats. This ability to process and learn from extensive data allows for the development of more accurate and efficient threat detection systems. Additionally, AI-driven platforms can adapt to new types of cyber-attacks more quickly than traditional security systems, providing a robust and dynamic defense mechanism.
The market is further supported by increasing investments in AI and cybersecurity by organizations seeking to protect their assets and data. As cyber threats become more sophisticated, the adoption of generative AI solutions is expected to rise, driven by the need for more effective and autonomous security measures.
Key Takeaways
- Market Value: The Global Generative ai in Security Market was valued at USD 628 Mn in 2023. It is expected to reach USD 3127.4 Bn by 2033, with a CAGR of 17.9% during the forecast period from 2024 to 2033.
- By Type: Network Security constitutes 35% of the market, crucial for protecting digital assets from cyber threats.
- By Service: Managed Services dominate with 55%, providing comprehensive security management solutions.
- By Deployment Mode: Cloud-Based solutions lead with 60%, offering scalability and remote accessibility.
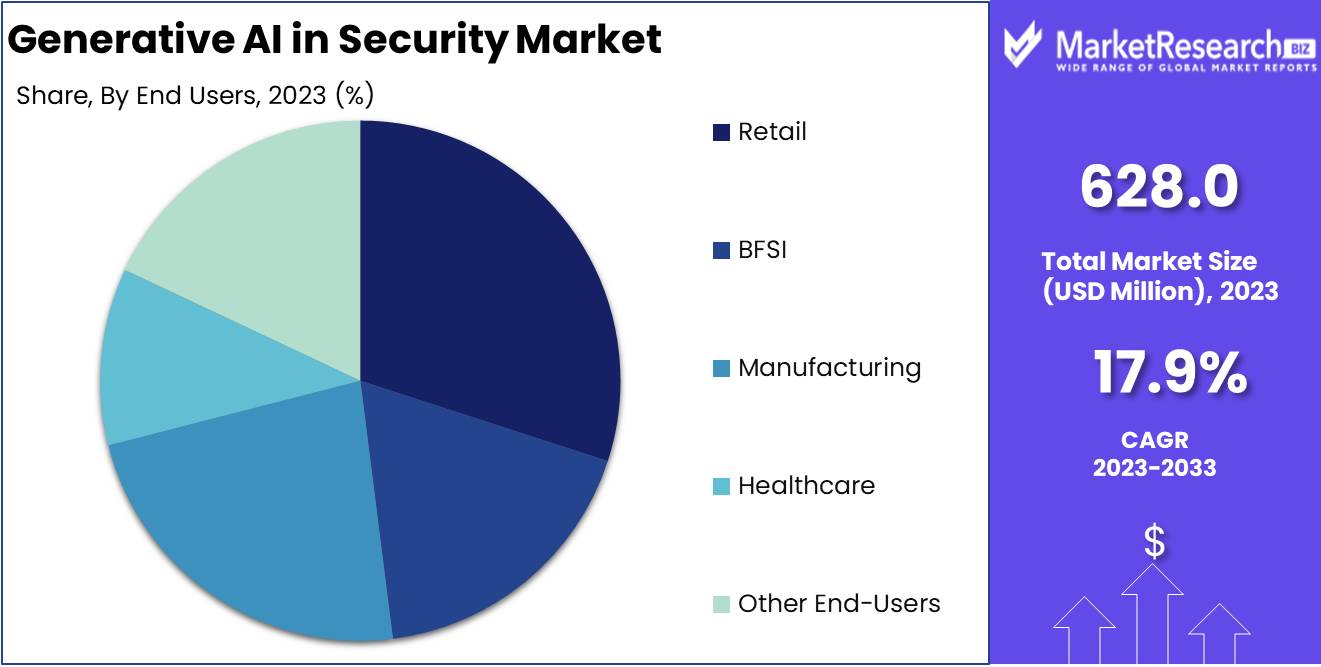
- By End Users: BFSI (Banking, Financial Services, and Insurance) uses 30%, leveraging AI for enhanced security measures.
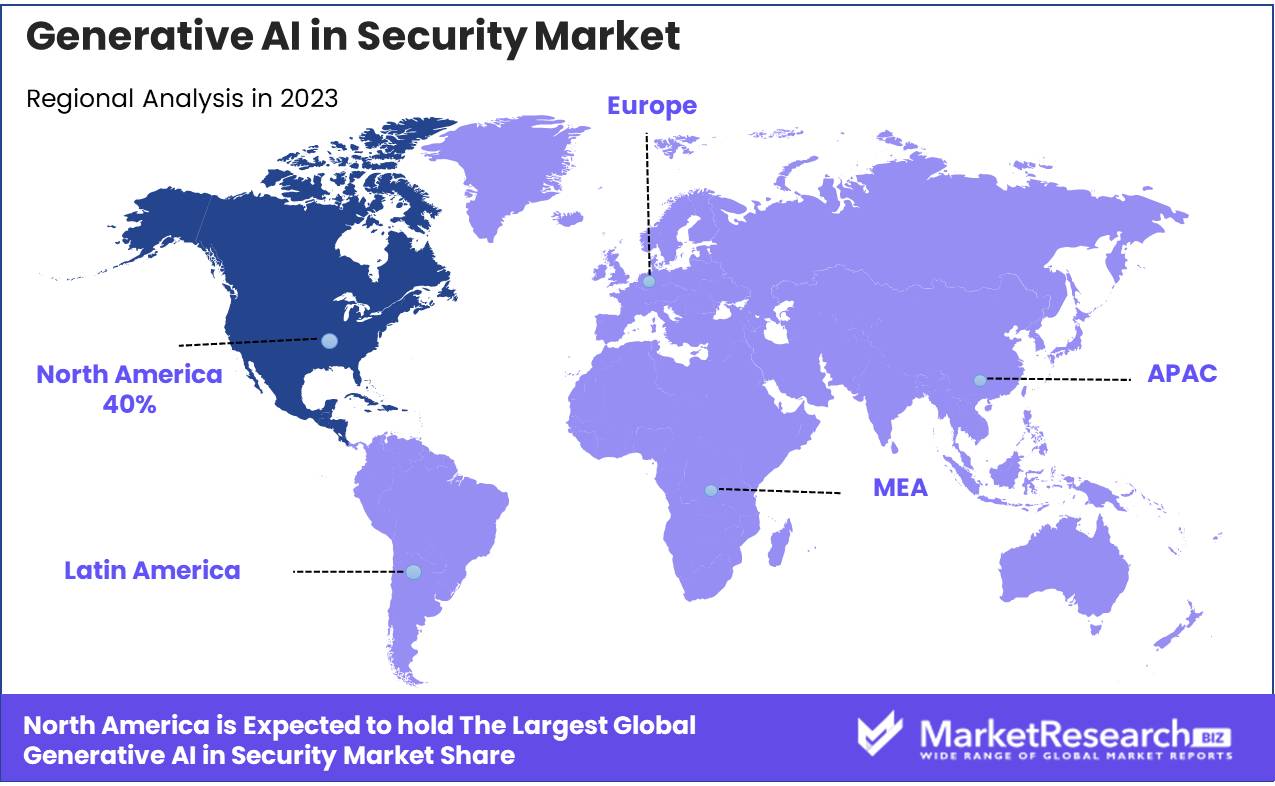
- Regional Dominance: North America holds a 43% market share, driven by advanced cybersecurity infrastructure and high adoption rates.
- Growth Opportunity: Integrating AI-driven threat detection and response systems can significantly enhance the efficacy of network security measures.
Driving factors
Increasing Cybersecurity Threats: A Catalyst for Market Growth
The rise in cybersecurity threats has become a significant catalyst for the growth of the generative AI in the security market. The rapid digital transformation across industries has exposed enterprises to a myriad of cyber threats, including malware, phishing, and ransomware attacks. According to a recent study, the global cost of cybercrime is expected to reach $10.5 trillion annually by 2025, underscoring the urgent need for advanced security solutions.
Generative AI, with its ability to predict and counteract sophisticated cyber-attacks, is increasingly being adopted by organizations to bolster their defense mechanisms. This growing reliance on AI-driven security solutions to mitigate risks is a primary driver for the market's expansion.
Advancements in AI and Machine Learning: Enhancing Security Capabilities
The continuous advancements in AI and machine learning technologies are profoundly enhancing the capabilities of security systems. Innovations in these fields have led to the development of more sophisticated algorithms that can analyze vast amounts of data, identify patterns, and predict potential threats with high accuracy. According to industry reports, the AI market in cybersecurity is projected to grow at a compound annual growth rate (CAGR) of 23.6% from 2021 to 2026.
These advancements enable generative AI to evolve continuously, adapting to new threat vectors and providing more robust and dynamic security solutions. Consequently, the integration of cutting-edge AI and machine learning technologies is propelling the growth of the generative AI in security market.
Growing Demand for Real-time Threat Detection: Driving Adoption of AI Solutions
The increasing need for real-time threat detection and response is a significant driver for the adoption of generative AI in security applications. Traditional security systems often fall short in providing timely responses to emerging threats, leaving organizations vulnerable to attacks. Generative AI offers real-time monitoring and immediate threat detection, allowing for proactive defense strategies.
The demand for such real-time capabilities is evident, with a survey indicating that 69% of organizations prioritize investing in real-time threat detection technologies. This trend is driving the widespread adoption of generative AI solutions, as they offer the agility and speed required to protect critical infrastructure and sensitive data effectively.
Restraining Factors
High Implementation Costs
The high implementation costs associated with generative AI solutions in security present a significant barrier to market growth. Developing, deploying, and maintaining advanced AI systems require substantial financial investment, often making it difficult for small and medium-sized enterprises (SMEs) to afford such technology. According to industry analysis, the average cost of implementing AI solutions can range from $100,000 to $300,000, depending on the complexity and scale of the project.
These high costs can deter potential adopters, especially those with limited budgets, thereby slowing down the overall market adoption rate. While large corporations might have the resources to invest in these technologies, the high upfront and ongoing costs remain a critical retraining factor for widespread market penetration.
Concerns over Data Privacy and AI Ethics
Concerns over data privacy and AI ethics are another major retraining factor impacting the generative AI in security market. The deployment of AI-driven security systems often involves the collection and analysis of vast amounts of sensitive data, raising significant privacy issues. Additionally, the ethical implications of using AI in security, such as bias in algorithms and decision-making transparency, have sparked widespread debate and skepticism.
A survey conducted by a leading cybersecurity firm revealed that 67% of organizations are hesitant to adopt AI solutions due to fears of compromising data privacy and ethical concerns. These apprehensions can lead to resistance from both regulators and potential users, impeding the adoption and growth of generative AI technologies in the security sector.
By Type Analysis
Network Security held a dominant market position in the By Type segment of the Generative AI in Security Market, capturing more than a 35% share.
In 2023, Network Security held a dominant market position in the By Type segment of the Generative AI in Security Market, capturing more than a 35% share. This dominance is driven by the increasing complexity and frequency of cyber threats targeting network infrastructures. Generative AI is leveraged in network security to detect and respond to anomalies, predict potential breaches, and automate threat mitigation.
Application Security also plays a significant role, ensuring that software applications are secure from cyber threats during their entire lifecycle. The use of AI in application security helps identify vulnerabilities, conduct code reviews, and enforce security policies.
Cloud Security is increasingly important as more organizations migrate to cloud environments. AI enhances cloud security by providing continuous monitoring, anomaly detection, and automated incident response.
Other Security Types, including endpoint security and identity management, collectively hold a smaller market share. These areas are essential for comprehensive security strategies but are more specialized compared to network security.
By Service Analysis
Managed Services held a dominant market position in the By Service segment of the Generative AI in Security Market, capturing more than a 55% share.
In 2023, Managed Services held a dominant market position in the By Service segment of the Generative AI in Security Market, capturing more than a 55% share. The high demand for managed services is driven by organizations seeking to outsource their security needs to specialized providers. Managed services leverage AI to offer continuous monitoring, threat detection, incident response, and compliance management, providing comprehensive security solutions that are scalable and cost-effective.
Professional Services are also significant, offering consulting, implementation, and integration services for AI-driven security solutions. These services help organizations design and deploy tailored security frameworks. However, their market share is smaller compared to managed services due to the growing preference for outsourced, all-inclusive security solutions provided by managed service providers.
By Deployment Mode Analysis
Cloud-Based held a dominant market position in the By Deployment Mode segment of the Generative AI in Security Market, capturing more than a 60% share.
In 2023, Cloud-Based deployment held a dominant market position in the By Deployment Mode segment of the Generative AI in Security Market, capturing more than a 60% share. The preference for cloud-based solutions is driven by their flexibility, scalability, and ease of deployment. Cloud-based AI security solutions can be quickly updated with the latest threat intelligence and offer seamless integration with existing cloud infrastructures.
On-premises deployment, while still relevant, holds a smaller market share due to the higher initial investment, maintenance costs, and limited scalability compared to cloud-based solutions. On-premises deployments are typically favored by organizations with stringent data sovereignty and compliance requirements.
By End Users Analysis
BFSI held a dominant market position in the By End Users segment of the Generative AI in Security Market, capturing more than a 30% share.
In 2023, BFSI (Banking, Financial Services, and Insurance) held a dominant market position in the By End Users segment of the Generative AI in Security Market, capturing more than a 30% share. The BFSI sector's focus on safeguarding sensitive financial data and meeting regulatory compliance drives the adoption of AI-driven security solutions.
Retail is also a significant end-user, utilizing AI for fraud detection, securing customer data, and managing supply chain security. However, its market share is smaller compared to BFSI due to the relatively lower regulatory pressures and data sensitivity.
Manufacturing employs AI in security to protect intellectual property, secure industrial control systems, and monitor supply chains. The market share for manufacturing is growing but remains smaller than BFSI and retail due to the sector's diverse security needs.
Healthcare relies on AI to protect patient data, secure electronic health records, and ensure compliance with health data regulations. The healthcare sector's adoption of AI security solutions is increasing, driven by the need to protect sensitive health information.
Other End-Users, including government, education, and energy sectors, also adopt AI-driven security solutions to protect critical infrastructure and data. These sectors collectively hold a smaller market share but are crucial for the overall security landscape.
Key Market Segments
By Type
- Network Security
- Application Security
- Cloud Security
- Other Security Types
By Service
- Professional Services
- Managed Services
By Deployment Mode
- Cloud-Based
- On-premises
By End Users
- Retail
- BFSI
- Manufacturing
- Healthcare
- Other End-Users
Growth Opportunity
Use of Advanced Materials for Better Performance
In 2024, one of the most significant trends in the automotive transparent antenna market will be the use of advanced materials to enhance performance. Innovations in materials science are leading to the development of antennas that are not only transparent but also more durable, efficient, and capable of supporting higher frequency signals.
These advanced materials, such as transparent conductive films and nanomaterials, offer superior conductivity and flexibility, enabling the production of antennas that are both aesthetically pleasing and highly functional. This trend is expected to drive the adoption of transparent antennas in more vehicle models, as automakers seek to leverage these performance enhancements to offer better connectivity solutions.
Integration with Vehicle Communication Systems
The integration of transparent antennas with vehicle communication systems will be another pivotal trend in 2024. As vehicles become more connected and reliant on seamless communication for navigation, safety, and entertainment, the need for integrated antenna solutions grows.
Transparent antennas can be embedded into windshields and other glass surfaces, providing a sleek and unobtrusive solution that supports various communication protocols, including vehicle-to-everything (V2X), GPS, and infotainment systems. This integration not only enhances the aesthetic appeal of the vehicle but also ensures robust and reliable connectivity, which is crucial for the functioning of modern vehicles.
Latest Trends
Integration with Existing Security Frameworks
In 2024, a critical trend in the generative AI in security market will be the seamless integration of generative AI technologies with existing security frameworks. Organizations are increasingly recognizing the need to bolster their current security infrastructure with advanced AI capabilities. Generative AI can enhance traditional security measures by providing adaptive and proactive defense mechanisms.
The integration process involves embedding AI algorithms within the existing security systems to improve threat detection, response times, and overall system resilience. This trend underscores the importance of AI-driven innovation in fortifying cybersecurity defenses without the need to overhaul entire security architectures.
Use of AI for Predictive Threat Intelligence
Another prominent trend in the generative AI in security market is the use of AI for predictive threat intelligence. Generative AI excels at analyzing vast datasets to identify patterns and anomalies that may indicate potential security threats. By leveraging predictive analytics, organizations can anticipate and mitigate cyber threats before they manifest into significant security breaches.
This proactive approach is crucial in an era where cyber threats are becoming increasingly sophisticated and frequent. Predictive threat intelligence enables security teams to stay ahead of attackers, enhancing their ability to protect sensitive data and critical systems.
Regional Analysis
North America held a dominant market position in the Generative AI in Security Market, capturing more than a 43% share.
The North America region dominated the Generative AI in Security Market in 2023, capturing more than a 43% share. This dominance is driven by the region's advanced technological infrastructure, high adoption rates of AI technologies, and significant investments in cybersecurity solutions. The U.S., in particular, is a major contributor, with numerous tech companies and startups developing innovative AI-driven security applications. The increasing frequency of cyber threats and stringent regulatory requirements further drive the adoption of generative AI in security across various industries, including finance, healthcare, and retail.
Europe follows closely, with a strong focus on data protection and privacy regulations such as GDPR. Countries like Germany, the UK, and France are investing heavily in AI-driven security solutions to protect critical infrastructure and ensure compliance with regulatory standards. The market growth in Europe is supported by government initiatives and public-private partnerships aimed at enhancing cybersecurity.
The Asia Pacific region is experiencing rapid growth in the adoption of generative AI in security, driven by the expanding digital landscape and increasing cyber threats. Countries like China, Japan, and India are investing in AI technologies to bolster their cybersecurity frameworks. The rising number of connected devices and the growth of e-commerce and digital services contribute to the demand for advanced security solutions in the region.
In the Middle East & Africa, the market is emerging, with growing awareness of the importance of cybersecurity. Countries in the Middle East, such as the UAE and Saudi Arabia, are making significant investments in AI-driven security solutions to protect their digital infrastructure. The region's market growth is also supported by government initiatives aimed at building robust cybersecurity frameworks.
Latin America is steadily adopting generative AI in security, with countries like Brazil and Mexico leading the charge. The increasing digitalization and growing number of cyber threats are driving the demand for advanced security solutions in the region.
Key Regions and Countries
North America
- US
- Canada
- Mexico
Western Europe
- Germany
- France
- The UK
- Spain
- Italy
- Portugal
- Ireland
- Austria
- Switzerland
- Benelux
- Nordic
- Rest of Western Europe
Eastern Europe
- Russia
- Poland
- The Czech Republic
- Greece
- Rest of Eastern Europe
APAC
- China
- Japan
- South Korea
- India
- Australia & New Zealand
- Indonesia
- Malaysia
- Philippines
- Singapore
- Thailand
- Vietnam
- Rest of APAC
Latin America
- Brazil
- Colombia
- Chile
- Argentina
- Costa Rica
- Rest of Latin America
Middle East & Africa
- Algeria
- Egypt
- Israel
- Kuwait
- Nigeria
- Saudi Arabia
- South Africa
- Turkey
- United Arab Emirates
- Rest of MEA
Key Players Analysis
IBM's extensive expertise in AI and cybersecurity positions it as a leader in the generative AI in security market. Leveraging Watson AI, IBM provides advanced threat detection and response capabilities, enhancing security protocols and mitigating risks effectively.
Intel's focus on AI hardware and software innovations strengthens its role in generative AI applications for security. Its processors optimize AI performance, enabling rapid analysis and response to security threats, making it a crucial player in this market.
NVIDIA’s AI-driven GPU technology is pivotal in enhancing generative AI security solutions. Its hardware accelerates AI processing, facilitating real-time threat detection and mitigation, thus significantly contributing to the market's growth.
Securonix's advanced security analytics and operations platform utilizes generative AI to detect anomalies and predict security breaches. Its innovative approach enhances the efficacy of security measures, making it a key player in the market.
Specializing in mobile threat defense, Skycure integrates generative AI to identify and neutralize emerging mobile threats. Its cutting-edge solutions ensure comprehensive security for mobile environments, reinforcing its market position.
ThreatMetrix employs generative AI to deliver robust digital identity verification and fraud prevention solutions. Its AI-driven approach enhances security protocols, reducing fraud risks and establishing it as a critical market player.
Numerous other companies are contributing to the market with innovative generative AI solutions. Their collective efforts are driving advancements in security, enhancing threat detection, and response capabilities across the industry.
Market Key Players
- IBM Corp.
- Intel Corp.
- NVIDIA Corp.
- Securonix Inc.
- Skycure Inc.
- Threatmetrix Inc.
- Other Key Players
Recent Development
- In June 2024, Securonix Inc. secured $20 million in funding to develop advanced generative AI solutions for insider threat detection. This funding will support research and development efforts to enhance security measures.
- In February 2024, IBM Corp. launched a new generative AI tool designed to detect and mitigate cybersecurity threats in real-time. This tool aims to reduce incident response times by 25%.
Report Scope
Report Features Description Market Value (2023) USD 628 Mn Forecast Revenue (2033) USD 3127.4 Bn CAGR (2024-2033) 17.9% Base Year for Estimation 2023 Historic Period 2018-2023 Forecast Period 2024-2033 Report Coverage Revenue Forecast, Market Dynamics, Competitive Landscape, Recent Developments Segments Covered By Type (Network Security, Application Security, Cloud Security, Other Security Types), By Service (Professional Services, Managed Services), By Deployment Mode (Cloud-Based, On-premises), By End Users (Retail, BFSI, Manufacturing, Healthcare, Other End-Users) Regional Analysis North America - The US, Canada, & Mexico; Western Europe - Germany, France, The UK, Spain, Italy, Portugal, Ireland, Austria, Switzerland, Benelux, Nordic, & Rest of Western Europe; Eastern Europe - Russia, Poland, The Czech Republic, Greece, & Rest of Eastern Europe; APAC - China, Japan, South Korea, India, Australia & New Zealand, Indonesia, Malaysia, Philippines, Singapore, Thailand, Vietnam, & Rest of APAC; Latin America - Brazil, Colombia, Chile, Argentina, Costa Rica, & Rest of Latin America; Middle East & Africa - Algeria, Egypt, Israel, Kuwait, Nigeria, Saudi Arabia, South Africa, Turkey, United Arab Emirates, & Rest of MEA Competitive Landscape IBM Corp., Intel Corp., NVIDIA Corp., Securonix Inc., Skycure Inc., Threatmetrix Inc., Other Key Players Customization Scope Customization for segments, region/country-level will be provided. Moreover, additional customization can be done based on the requirements. Purchase Options We have three licenses to opt for: Single User License, Multi-User License (Up to 5 Users), Corporate Use License (Unlimited User and Printable PDF) -
- 1. Executive Summary
- 1.1. Definition
- 1.2. Taxonomy
- 1.3. Research Scope
- 1.4. Key Analysis
- 1.5. Key Findings by Major Segments
- 1.6. Top strategies by Major Players
- 2. Global Generative AI in Security Market Overview
- 2.1. Generative AI in Security Market Dynamics
- 2.1.1. Drivers
- 2.1.2. Opportunities
- 2.1.3. Restraints
- 2.1.4. Challenges
- 2.2. Macro-economic Factors
- 2.3. Regulatory Framework
- 2.4. Market Investment Feasibility Index
- 2.5. PEST Analysis
- 2.6. PORTER’S Five Force Analysis
- 2.7. Drivers & Restraints Impact Analysis
- 2.8. Industry Chain Analysis
- 2.9. Cost Structure Analysis
- 2.10. Marketing Strategy
- 2.11. Russia-Ukraine War Impact Analysis
- 2.12. Opportunity Map Analysis
- 2.13. Market Competition Scenario Analysis
- 2.14. Product Life Cycle Analysis
- 2.15. Opportunity Orbits
- 2.16. Manufacturer Intensity Map
- 2.17. Major Companies sales by Value & Volume
- 2.1. Generative AI in Security Market Dynamics
- 3. Global Generative AI in Security Market Analysis, Opportunity and Forecast, 2016-2032
- 3.1. Global Generative AI in Security Market Analysis, 2016-2021
- 3.2. Global Generative AI in Security Market Opportunity and Forecast, 2023-2032
- 3.3. Global Generative AI in Security Market Analysis, Opportunity and Forecast, By Security Type, 2016-2032
- 3.3.1. Global Generative AI in Security Market Analysis by Security Type: Introduction
- 3.3.2. Market Size Absolute $ Opportunity Analysis and Forecast, By Security Type, 2016-2032
- 3.3.3. Network Security
- 3.3.4. Application Security
- 3.3.5. Cloud Security
- 3.3.6. Other Security Types
- 3.4. Global Generative AI in Security Market Analysis, Opportunity and Forecast, By Service, 2016-2032
- 3.4.1. Global Generative AI in Security Market Analysis by Service: Introduction
- 3.4.2. Market Size Absolute $ Opportunity Analysis and Forecast, By Service, 2016-2032
- 3.4.3. Professional Services
- 3.4.4. Managed Services
- 3.5. Global Generative AI in Security Market Analysis, Opportunity and Forecast, By Deployment Mode, 2016-2032
- 3.5.1. Global Generative AI in Security Market Analysis by Deployment Mode: Introduction
- 3.5.2. Market Size Absolute $ Opportunity Analysis and Forecast, By Deployment Mode, 2016-2032
- 3.5.3. Cloud-Based
- 3.5.4. On-Premises
- 3.6. Global Generative AI in Security Market Analysis, Opportunity and Forecast, By End User, 2016-2032
- 3.6.1. Global Generative AI in Security Market Analysis by End User: Introduction
- 3.6.2. Market Size Absolute $ Opportunity Analysis and Forecast, By End User, 2016-2032
- 3.6.3. Retail
- 3.6.4. BFSI
- 3.6.5. Manufacturing
- 3.6.6. Healthcare
- 3.6.7. Other End Users
- 4. North America Generative AI in Security Market Analysis, Opportunity and Forecast, 2016-2032
- 4.1. North America Generative AI in Security Market Analysis, 2016-2021
- 4.2. North America Generative AI in Security Market Opportunity and Forecast, 2023-2032
- 4.3. North America Generative AI in Security Market Analysis, Opportunity and Forecast, By Security Type, 2016-2032
- 4.3.1. North America Generative AI in Security Market Analysis by Security Type: Introduction
- 4.3.2. Market Size Absolute $ Opportunity Analysis and Forecast, By Security Type, 2016-2032
- 4.3.3. Network Security
- 4.3.4. Application Security
- 4.3.5. Cloud Security
- 4.3.6. Other Security Types
- 4.4. North America Generative AI in Security Market Analysis, Opportunity and Forecast, By Service, 2016-2032
- 4.4.1. North America Generative AI in Security Market Analysis by Service: Introduction
- 4.4.2. Market Size Absolute $ Opportunity Analysis and Forecast, By Service, 2016-2032
- 4.4.3. Professional Services
- 4.4.4. Managed Services
- 4.5. North America Generative AI in Security Market Analysis, Opportunity and Forecast, By Deployment Mode, 2016-2032
- 4.5.1. North America Generative AI in Security Market Analysis by Deployment Mode: Introduction
- 4.5.2. Market Size Absolute $ Opportunity Analysis and Forecast, By Deployment Mode, 2016-2032
- 4.5.3. Cloud-Based
- 4.5.4. On-Premises
- 4.6. North America Generative AI in Security Market Analysis, Opportunity and Forecast, By End User, 2016-2032
- 4.6.1. North America Generative AI in Security Market Analysis by End User: Introduction
- 4.6.2. Market Size Absolute $ Opportunity Analysis and Forecast, By End User, 2016-2032
- 4.6.3. Retail
- 4.6.4. BFSI
- 4.6.5. Manufacturing
- 4.6.6. Healthcare
- 4.6.7. Other End Users
- 4.7. North America Generative AI in Security Market Analysis, Opportunity and Forecast, By Country , 2016-2032
- 4.7.1. North America Generative AI in Security Market Analysis by Country : Introduction
- 4.7.2. Market Size Absolute $ Opportunity Analysis and Forecast, Country , 2016-2032
- 4.7.2.1. The US
- 4.7.2.2. Canada
- 4.7.2.3. Mexico
- 5. Western Europe Generative AI in Security Market Analysis, Opportunity and Forecast, 2016-2032
- 5.1. Western Europe Generative AI in Security Market Analysis, 2016-2021
- 5.2. Western Europe Generative AI in Security Market Opportunity and Forecast, 2023-2032
- 5.3. Western Europe Generative AI in Security Market Analysis, Opportunity and Forecast, By Security Type, 2016-2032
- 5.3.1. Western Europe Generative AI in Security Market Analysis by Security Type: Introduction
- 5.3.2. Market Size Absolute $ Opportunity Analysis and Forecast, By Security Type, 2016-2032
- 5.3.3. Network Security
- 5.3.4. Application Security
- 5.3.5. Cloud Security
- 5.3.6. Other Security Types
- 5.4. Western Europe Generative AI in Security Market Analysis, Opportunity and Forecast, By Service, 2016-2032
- 5.4.1. Western Europe Generative AI in Security Market Analysis by Service: Introduction
- 5.4.2. Market Size Absolute $ Opportunity Analysis and Forecast, By Service, 2016-2032
- 5.4.3. Professional Services
- 5.4.4. Managed Services
- 5.5. Western Europe Generative AI in Security Market Analysis, Opportunity and Forecast, By Deployment Mode, 2016-2032
- 5.5.1. Western Europe Generative AI in Security Market Analysis by Deployment Mode: Introduction
- 5.5.2. Market Size Absolute $ Opportunity Analysis and Forecast, By Deployment Mode, 2016-2032
- 5.5.3. Cloud-Based
- 5.5.4. On-Premises
- 5.6. Western Europe Generative AI in Security Market Analysis, Opportunity and Forecast, By End User, 2016-2032
- 5.6.1. Western Europe Generative AI in Security Market Analysis by End User: Introduction
- 5.6.2. Market Size Absolute $ Opportunity Analysis and Forecast, By End User, 2016-2032
- 5.6.3. Retail
- 5.6.4. BFSI
- 5.6.5. Manufacturing
- 5.6.6. Healthcare
- 5.6.7. Other End Users
- 5.7. Western Europe Generative AI in Security Market Analysis, Opportunity and Forecast, By Country , 2016-2032
- 5.7.1. Western Europe Generative AI in Security Market Analysis by Country : Introduction
- 5.7.2. Market Size Absolute $ Opportunity Analysis and Forecast, Country , 2016-2032
- 5.7.2.1. Germany
- 5.7.2.2. France
- 5.7.2.3. The UK
- 5.7.2.4. Spain
- 5.7.2.5. Italy
- 5.7.2.6. Portugal
- 5.7.2.7. Ireland
- 5.7.2.8. Austria
- 5.7.2.9. Switzerland
- 5.7.2.10. Benelux
- 5.7.2.11. Nordic
- 5.7.2.12. Rest of Western Europe
- 6. Eastern Europe Generative AI in Security Market Analysis, Opportunity and Forecast, 2016-2032
- 6.1. Eastern Europe Generative AI in Security Market Analysis, 2016-2021
- 6.2. Eastern Europe Generative AI in Security Market Opportunity and Forecast, 2023-2032
- 6.3. Eastern Europe Generative AI in Security Market Analysis, Opportunity and Forecast, By Security Type, 2016-2032
- 6.3.1. Eastern Europe Generative AI in Security Market Analysis by Security Type: Introduction
- 6.3.2. Market Size Absolute $ Opportunity Analysis and Forecast, By Security Type, 2016-2032
- 6.3.3. Network Security
- 6.3.4. Application Security
- 6.3.5. Cloud Security
- 6.3.6. Other Security Types
- 6.4. Eastern Europe Generative AI in Security Market Analysis, Opportunity and Forecast, By Service, 2016-2032
- 6.4.1. Eastern Europe Generative AI in Security Market Analysis by Service: Introduction
- 6.4.2. Market Size Absolute $ Opportunity Analysis and Forecast, By Service, 2016-2032
- 6.4.3. Professional Services
- 6.4.4. Managed Services
- 6.5. Eastern Europe Generative AI in Security Market Analysis, Opportunity and Forecast, By Deployment Mode, 2016-2032
- 6.5.1. Eastern Europe Generative AI in Security Market Analysis by Deployment Mode: Introduction
- 6.5.2. Market Size Absolute $ Opportunity Analysis and Forecast, By Deployment Mode, 2016-2032
- 6.5.3. Cloud-Based
- 6.5.4. On-Premises
- 6.6. Eastern Europe Generative AI in Security Market Analysis, Opportunity and Forecast, By End User, 2016-2032
- 6.6.1. Eastern Europe Generative AI in Security Market Analysis by End User: Introduction
- 6.6.2. Market Size Absolute $ Opportunity Analysis and Forecast, By End User, 2016-2032
- 6.6.3. Retail
- 6.6.4. BFSI
- 6.6.5. Manufacturing
- 6.6.6. Healthcare
- 6.6.7. Other End Users
- 6.7. Eastern Europe Generative AI in Security Market Analysis, Opportunity and Forecast, By Country , 2016-2032
- 6.7.1. Eastern Europe Generative AI in Security Market Analysis by Country : Introduction
- 6.7.2. Market Size Absolute $ Opportunity Analysis and Forecast, Country , 2016-2032
- 6.7.2.1. Russia
- 6.7.2.2. Poland
- 6.7.2.3. The Czech Republic
- 6.7.2.4. Greece
- 6.7.2.5. Rest of Eastern Europe
- 7. APAC Generative AI in Security Market Analysis, Opportunity and Forecast, 2016-2032
- 7.1. APAC Generative AI in Security Market Analysis, 2016-2021
- 7.2. APAC Generative AI in Security Market Opportunity and Forecast, 2023-2032
- 7.3. APAC Generative AI in Security Market Analysis, Opportunity and Forecast, By Security Type, 2016-2032
- 7.3.1. APAC Generative AI in Security Market Analysis by Security Type: Introduction
- 7.3.2. Market Size Absolute $ Opportunity Analysis and Forecast, By Security Type, 2016-2032
- 7.3.3. Network Security
- 7.3.4. Application Security
- 7.3.5. Cloud Security
- 7.3.6. Other Security Types
- 7.4. APAC Generative AI in Security Market Analysis, Opportunity and Forecast, By Service, 2016-2032
- 7.4.1. APAC Generative AI in Security Market Analysis by Service: Introduction
- 7.4.2. Market Size Absolute $ Opportunity Analysis and Forecast, By Service, 2016-2032
- 7.4.3. Professional Services
- 7.4.4. Managed Services
- 7.5. APAC Generative AI in Security Market Analysis, Opportunity and Forecast, By Deployment Mode, 2016-2032
- 7.5.1. APAC Generative AI in Security Market Analysis by Deployment Mode: Introduction
- 7.5.2. Market Size Absolute $ Opportunity Analysis and Forecast, By Deployment Mode, 2016-2032
- 7.5.3. Cloud-Based
- 7.5.4. On-Premises
- 7.6. APAC Generative AI in Security Market Analysis, Opportunity and Forecast, By End User, 2016-2032
- 7.6.1. APAC Generative AI in Security Market Analysis by End User: Introduction
- 7.6.2. Market Size Absolute $ Opportunity Analysis and Forecast, By End User, 2016-2032
- 7.6.3. Retail
- 7.6.4. BFSI
- 7.6.5. Manufacturing
- 7.6.6. Healthcare
- 7.6.7. Other End Users
- 7.7. APAC Generative AI in Security Market Analysis, Opportunity and Forecast, By Country , 2016-2032
- 7.7.1. APAC Generative AI in Security Market Analysis by Country : Introduction
- 7.7.2. Market Size Absolute $ Opportunity Analysis and Forecast, Country , 2016-2032
- 7.7.2.1. China
- 7.7.2.2. Japan
- 7.7.2.3. South Korea
- 7.7.2.4. India
- 7.7.2.5. Australia & New Zeland
- 7.7.2.6. Indonesia
- 7.7.2.7. Malaysia
- 7.7.2.8. Philippines
- 7.7.2.9. Singapore
- 7.7.2.10. Thailand
- 7.7.2.11. Vietnam
- 7.7.2.12. Rest of APAC
- 8. Latin America Generative AI in Security Market Analysis, Opportunity and Forecast, 2016-2032
- 8.1. Latin America Generative AI in Security Market Analysis, 2016-2021
- 8.2. Latin America Generative AI in Security Market Opportunity and Forecast, 2023-2032
- 8.3. Latin America Generative AI in Security Market Analysis, Opportunity and Forecast, By Security Type, 2016-2032
- 8.3.1. Latin America Generative AI in Security Market Analysis by Security Type: Introduction
- 8.3.2. Market Size Absolute $ Opportunity Analysis and Forecast, By Security Type, 2016-2032
- 8.3.3. Network Security
- 8.3.4. Application Security
- 8.3.5. Cloud Security
- 8.3.6. Other Security Types
- 8.4. Latin America Generative AI in Security Market Analysis, Opportunity and Forecast, By Service, 2016-2032
- 8.4.1. Latin America Generative AI in Security Market Analysis by Service: Introduction
- 8.4.2. Market Size Absolute $ Opportunity Analysis and Forecast, By Service, 2016-2032
- 8.4.3. Professional Services
- 8.4.4. Managed Services
- 8.5. Latin America Generative AI in Security Market Analysis, Opportunity and Forecast, By Deployment Mode, 2016-2032
- 8.5.1. Latin America Generative AI in Security Market Analysis by Deployment Mode: Introduction
- 8.5.2. Market Size Absolute $ Opportunity Analysis and Forecast, By Deployment Mode, 2016-2032
- 8.5.3. Cloud-Based
- 8.5.4. On-Premises
- 8.6. Latin America Generative AI in Security Market Analysis, Opportunity and Forecast, By End User, 2016-2032
- 8.6.1. Latin America Generative AI in Security Market Analysis by End User: Introduction
- 8.6.2. Market Size Absolute $ Opportunity Analysis and Forecast, By End User, 2016-2032
- 8.6.3. Retail
- 8.6.4. BFSI
- 8.6.5. Manufacturing
- 8.6.6. Healthcare
- 8.6.7. Other End Users
- 8.7. Latin America Generative AI in Security Market Analysis, Opportunity and Forecast, By Country , 2016-2032
- 8.7.1. Latin America Generative AI in Security Market Analysis by Country : Introduction
- 8.7.2. Market Size Absolute $ Opportunity Analysis and Forecast, Country , 2016-2032
- 8.7.2.1. Brazil
- 8.7.2.2. Colombia
- 8.7.2.3. Chile
- 8.7.2.4. Argentina
- 8.7.2.5. Costa Rica
- 8.7.2.6. Rest of Latin America
- 9. Middle East & Africa Generative AI in Security Market Analysis, Opportunity and Forecast, 2016-2032
- 9.1. Middle East & Africa Generative AI in Security Market Analysis, 2016-2021
- 9.2. Middle East & Africa Generative AI in Security Market Opportunity and Forecast, 2023-2032
- 9.3. Middle East & Africa Generative AI in Security Market Analysis, Opportunity and Forecast, By Security Type, 2016-2032
- 9.3.1. Middle East & Africa Generative AI in Security Market Analysis by Security Type: Introduction
- 9.3.2. Market Size Absolute $ Opportunity Analysis and Forecast, By Security Type, 2016-2032
- 9.3.3. Network Security
- 9.3.4. Application Security
- 9.3.5. Cloud Security
- 9.3.6. Other Security Types
- 9.4. Middle East & Africa Generative AI in Security Market Analysis, Opportunity and Forecast, By Service, 2016-2032
- 9.4.1. Middle East & Africa Generative AI in Security Market Analysis by Service: Introduction
- 9.4.2. Market Size Absolute $ Opportunity Analysis and Forecast, By Service, 2016-2032
- 9.4.3. Professional Services
- 9.4.4. Managed Services
- 9.5. Middle East & Africa Generative AI in Security Market Analysis, Opportunity and Forecast, By Deployment Mode, 2016-2032
- 9.5.1. Middle East & Africa Generative AI in Security Market Analysis by Deployment Mode: Introduction
- 9.5.2. Market Size Absolute $ Opportunity Analysis and Forecast, By Deployment Mode, 2016-2032
- 9.5.3. Cloud-Based
- 9.5.4. On-Premises
- 9.6. Middle East & Africa Generative AI in Security Market Analysis, Opportunity and Forecast, By End User, 2016-2032
- 9.6.1. Middle East & Africa Generative AI in Security Market Analysis by End User: Introduction
- 9.6.2. Market Size Absolute $ Opportunity Analysis and Forecast, By End User, 2016-2032
- 9.6.3. Retail
- 9.6.4. BFSI
- 9.6.5. Manufacturing
- 9.6.6. Healthcare
- 9.6.7. Other End Users
- 9.7. Middle East & Africa Generative AI in Security Market Analysis, Opportunity and Forecast, By Country , 2016-2032
- 9.7.1. Middle East & Africa Generative AI in Security Market Analysis by Country : Introduction
- 9.7.2. Market Size Absolute $ Opportunity Analysis and Forecast, Country , 2016-2032
- 9.7.2.1. Algeria
- 9.7.2.2. Egypt
- 9.7.2.3. Israel
- 9.7.2.4. Kuwait
- 9.7.2.5. Nigeria
- 9.7.2.6. Saudi Arabia
- 9.7.2.7. South Africa
- 9.7.2.8. Turkey
- 9.7.2.9. The UAE
- 9.7.2.10. Rest of MEA
- 10. Global Generative AI in Security Market Analysis, Opportunity and Forecast, By Region , 2016-2032
- 10.1. Global Generative AI in Security Market Analysis by Region : Introduction
- 10.2. Market Size Absolute $ Opportunity Analysis and Forecast, By Region , 2016-2032
- 10.2.1. North America
- 10.2.2. Western Europe
- 10.2.3. Eastern Europe
- 10.2.4. APAC
- 10.2.5. Latin America
- 10.2.6. Middle East & Africa
- 11. Global Generative AI in Security Market Competitive Landscape, Market Share Analysis, and Company Profiles
- 11.1. Market Share Analysis
- 11.2. Company Profiles
- 11.3. IBM Corp.
- 11.3.1. Company Overview
- 11.3.2. Financial Highlights
- 11.3.3. Product Portfolio
- 11.3.4. SWOT Analysis
- 11.3.5. Key Strategies and Developments
- 11.4. Intel Corp.
- 11.4.1. Company Overview
- 11.4.2. Financial Highlights
- 11.4.3. Product Portfolio
- 11.4.4. SWOT Analysis
- 11.4.5. Key Strategies and Developments
- 11.5. NVIDIA Corp.
- 11.5.1. Company Overview
- 11.5.2. Financial Highlights
- 11.5.3. Product Portfolio
- 11.5.4. SWOT Analysis
- 11.5.5. Key Strategies and Developments
- 11.6. Securonix Inc.
- 11.6.1. Company Overview
- 11.6.2. Financial Highlights
- 11.6.3. Product Portfolio
- 11.6.4. SWOT Analysis
- 11.6.5. Key Strategies and Developments
- 11.7. Skycure Inc.
- 11.7.1. Company Overview
- 11.7.2. Financial Highlights
- 11.7.3. Product Portfolio
- 11.7.4. SWOT Analysis
- 11.7.5. Key Strategies and Developments
- 11.8. Threatmetrix Inc.
- 11.8.1. Company Overview
- 11.8.2. Financial Highlights
- 11.8.3. Product Portfolio
- 11.8.4. SWOT Analysis
- 11.8.5. Key Strategies and Developments
- 11.9. Other Key Players
- 11.9.1. Company Overview
- 11.9.2. Financial Highlights
- 11.9.3. Product Portfolio
- 11.9.4. SWOT Analysis
- 11.9.5. Key Strategies and Developments
- 12. Assumptions and Acronyms
- 13. Research Methodology
- 14. Contact
- List of Figures
- Figure 1: Global Generative AI in Security Market Revenue (US$ Mn) Market Share by Security Type in 2022
- Figure 2: Global Generative AI in Security Market Attractiveness Analysis by Security Type, 2016-2032
- Figure 3: Global Generative AI in Security Market Revenue (US$ Mn) Market Share by Servicein 2022
- Figure 4: Global Generative AI in Security Market Attractiveness Analysis by Service, 2016-2032
- Figure 5: Global Generative AI in Security Market Revenue (US$ Mn) Market Share by Deployment Modein 2022
- Figure 6: Global Generative AI in Security Market Attractiveness Analysis by Deployment Mode, 2016-2032
- Figure 7: Global Generative AI in Security Market Revenue (US$ Mn) Market Share by End Userin 2022
- Figure 8: Global Generative AI in Security Market Attractiveness Analysis by End User, 2016-2032
- Figure 9: Global Generative AI in Security Market Revenue (US$ Mn) Market Share by Region in 2022
- Figure 10: Global Generative AI in Security Market Attractiveness Analysis by Region, 2016-2032
- Figure 11: Global Generative AI in Security Market Revenue (US$ Mn) (2016-2032)
- Figure 12: Global Generative AI in Security Market Revenue (US$ Mn) Comparison by Region (2016-2032)
- Figure 13: Global Generative AI in Security Market Revenue (US$ Mn) Comparison by Security Type (2016-2032)
- Figure 14: Global Generative AI in Security Market Revenue (US$ Mn) Comparison by Service (2016-2032)
- Figure 15: Global Generative AI in Security Market Revenue (US$ Mn) Comparison by Deployment Mode (2016-2032)
- Figure 16: Global Generative AI in Security Market Revenue (US$ Mn) Comparison by End User (2016-2032)
- Figure 17: Global Generative AI in Security Market Y-o-Y Growth Rate Comparison by Region (2016-2032)
- Figure 18: Global Generative AI in Security Market Y-o-Y Growth Rate Comparison by Security Type (2016-2032)
- Figure 19: Global Generative AI in Security Market Y-o-Y Growth Rate Comparison by Service (2016-2032)
- Figure 20: Global Generative AI in Security Market Y-o-Y Growth Rate Comparison by Deployment Mode (2016-2032)
- Figure 21: Global Generative AI in Security Market Y-o-Y Growth Rate Comparison by End User (2016-2032)
- Figure 22: Global Generative AI in Security Market Share Comparison by Region (2016-2032)
- Figure 23: Global Generative AI in Security Market Share Comparison by Security Type (2016-2032)
- Figure 24: Global Generative AI in Security Market Share Comparison by Service (2016-2032)
- Figure 25: Global Generative AI in Security Market Share Comparison by Deployment Mode (2016-2032)
- Figure 26: Global Generative AI in Security Market Share Comparison by End User (2016-2032)
- Figure 27: North America Generative AI in Security Market Revenue (US$ Mn) Market Share by Security Typein 2022
- Figure 28: North America Generative AI in Security Market Attractiveness Analysis by Security Type, 2016-2032
- Figure 29: North America Generative AI in Security Market Revenue (US$ Mn) Market Share by Servicein 2022
- Figure 30: North America Generative AI in Security Market Attractiveness Analysis by Service, 2016-2032
- Figure 31: North America Generative AI in Security Market Revenue (US$ Mn) Market Share by Deployment Modein 2022
- Figure 32: North America Generative AI in Security Market Attractiveness Analysis by Deployment Mode, 2016-2032
- Figure 33: North America Generative AI in Security Market Revenue (US$ Mn) Market Share by End Userin 2022
- Figure 34: North America Generative AI in Security Market Attractiveness Analysis by End User, 2016-2032
- Figure 35: North America Generative AI in Security Market Revenue (US$ Mn) Market Share by Country in 2022
- Figure 36: North America Generative AI in Security Market Attractiveness Analysis by Country, 2016-2032
- Figure 37: North America Generative AI in Security Market Revenue (US$ Mn) (2016-2032)
- Figure 38: North America Generative AI in Security Market Revenue (US$ Mn) Comparison by Country (2016-2032)
- Figure 39: North America Generative AI in Security Market Revenue (US$ Mn) Comparison by Security Type (2016-2032)
- Figure 40: North America Generative AI in Security Market Revenue (US$ Mn) Comparison by Service (2016-2032)
- Figure 41: North America Generative AI in Security Market Revenue (US$ Mn) Comparison by Deployment Mode (2016-2032)
- Figure 42: North America Generative AI in Security Market Revenue (US$ Mn) Comparison by End User (2016-2032)
- Figure 43: North America Generative AI in Security Market Y-o-Y Growth Rate Comparison by Country (2016-2032)
- Figure 44: North America Generative AI in Security Market Y-o-Y Growth Rate Comparison by Security Type (2016-2032)
- Figure 45: North America Generative AI in Security Market Y-o-Y Growth Rate Comparison by Service (2016-2032)
- Figure 46: North America Generative AI in Security Market Y-o-Y Growth Rate Comparison by Deployment Mode (2016-2032)
- Figure 47: North America Generative AI in Security Market Y-o-Y Growth Rate Comparison by End User (2016-2032)
- Figure 48: North America Generative AI in Security Market Share Comparison by Country (2016-2032)
- Figure 49: North America Generative AI in Security Market Share Comparison by Security Type (2016-2032)
- Figure 50: North America Generative AI in Security Market Share Comparison by Service (2016-2032)
- Figure 51: North America Generative AI in Security Market Share Comparison by Deployment Mode (2016-2032)
- Figure 52: North America Generative AI in Security Market Share Comparison by End User (2016-2032)
- Figure 53: Western Europe Generative AI in Security Market Revenue (US$ Mn) Market Share by Security Typein 2022
- Figure 54: Western Europe Generative AI in Security Market Attractiveness Analysis by Security Type, 2016-2032
- Figure 55: Western Europe Generative AI in Security Market Revenue (US$ Mn) Market Share by Servicein 2022
- Figure 56: Western Europe Generative AI in Security Market Attractiveness Analysis by Service, 2016-2032
- Figure 57: Western Europe Generative AI in Security Market Revenue (US$ Mn) Market Share by Deployment Modein 2022
- Figure 58: Western Europe Generative AI in Security Market Attractiveness Analysis by Deployment Mode, 2016-2032
- Figure 59: Western Europe Generative AI in Security Market Revenue (US$ Mn) Market Share by End Userin 2022
- Figure 60: Western Europe Generative AI in Security Market Attractiveness Analysis by End User, 2016-2032
- Figure 61: Western Europe Generative AI in Security Market Revenue (US$ Mn) Market Share by Country in 2022
- Figure 62: Western Europe Generative AI in Security Market Attractiveness Analysis by Country, 2016-2032
- Figure 63: Western Europe Generative AI in Security Market Revenue (US$ Mn) (2016-2032)
- Figure 64: Western Europe Generative AI in Security Market Revenue (US$ Mn) Comparison by Country (2016-2032)
- Figure 65: Western Europe Generative AI in Security Market Revenue (US$ Mn) Comparison by Security Type (2016-2032)
- Figure 66: Western Europe Generative AI in Security Market Revenue (US$ Mn) Comparison by Service (2016-2032)
- Figure 67: Western Europe Generative AI in Security Market Revenue (US$ Mn) Comparison by Deployment Mode (2016-2032)
- Figure 68: Western Europe Generative AI in Security Market Revenue (US$ Mn) Comparison by End User (2016-2032)
- Figure 69: Western Europe Generative AI in Security Market Y-o-Y Growth Rate Comparison by Country (2016-2032)
- Figure 70: Western Europe Generative AI in Security Market Y-o-Y Growth Rate Comparison by Security Type (2016-2032)
- Figure 71: Western Europe Generative AI in Security Market Y-o-Y Growth Rate Comparison by Service (2016-2032)
- Figure 72: Western Europe Generative AI in Security Market Y-o-Y Growth Rate Comparison by Deployment Mode (2016-2032)
- Figure 73: Western Europe Generative AI in Security Market Y-o-Y Growth Rate Comparison by End User (2016-2032)
- Figure 74: Western Europe Generative AI in Security Market Share Comparison by Country (2016-2032)
- Figure 75: Western Europe Generative AI in Security Market Share Comparison by Security Type (2016-2032)
- Figure 76: Western Europe Generative AI in Security Market Share Comparison by Service (2016-2032)
- Figure 77: Western Europe Generative AI in Security Market Share Comparison by Deployment Mode (2016-2032)
- Figure 78: Western Europe Generative AI in Security Market Share Comparison by End User (2016-2032)
- Figure 79: Eastern Europe Generative AI in Security Market Revenue (US$ Mn) Market Share by Security Typein 2022
- Figure 80: Eastern Europe Generative AI in Security Market Attractiveness Analysis by Security Type, 2016-2032
- Figure 81: Eastern Europe Generative AI in Security Market Revenue (US$ Mn) Market Share by Servicein 2022
- Figure 82: Eastern Europe Generative AI in Security Market Attractiveness Analysis by Service, 2016-2032
- Figure 83: Eastern Europe Generative AI in Security Market Revenue (US$ Mn) Market Share by Deployment Modein 2022
- Figure 84: Eastern Europe Generative AI in Security Market Attractiveness Analysis by Deployment Mode, 2016-2032
- Figure 85: Eastern Europe Generative AI in Security Market Revenue (US$ Mn) Market Share by End Userin 2022
- Figure 86: Eastern Europe Generative AI in Security Market Attractiveness Analysis by End User, 2016-2032
- Figure 87: Eastern Europe Generative AI in Security Market Revenue (US$ Mn) Market Share by Country in 2022
- Figure 88: Eastern Europe Generative AI in Security Market Attractiveness Analysis by Country, 2016-2032
- Figure 89: Eastern Europe Generative AI in Security Market Revenue (US$ Mn) (2016-2032)
- Figure 90: Eastern Europe Generative AI in Security Market Revenue (US$ Mn) Comparison by Country (2016-2032)
- Figure 91: Eastern Europe Generative AI in Security Market Revenue (US$ Mn) Comparison by Security Type (2016-2032)
- Figure 92: Eastern Europe Generative AI in Security Market Revenue (US$ Mn) Comparison by Service (2016-2032)
- Figure 93: Eastern Europe Generative AI in Security Market Revenue (US$ Mn) Comparison by Deployment Mode (2016-2032)
- Figure 94: Eastern Europe Generative AI in Security Market Revenue (US$ Mn) Comparison by End User (2016-2032)
- Figure 95: Eastern Europe Generative AI in Security Market Y-o-Y Growth Rate Comparison by Country (2016-2032)
- Figure 96: Eastern Europe Generative AI in Security Market Y-o-Y Growth Rate Comparison by Security Type (2016-2032)
- Figure 97: Eastern Europe Generative AI in Security Market Y-o-Y Growth Rate Comparison by Service (2016-2032)
- Figure 98: Eastern Europe Generative AI in Security Market Y-o-Y Growth Rate Comparison by Deployment Mode (2016-2032)
- Figure 99: Eastern Europe Generative AI in Security Market Y-o-Y Growth Rate Comparison by End User (2016-2032)
- Figure 100: Eastern Europe Generative AI in Security Market Share Comparison by Country (2016-2032)
- Figure 101: Eastern Europe Generative AI in Security Market Share Comparison by Security Type (2016-2032)
- Figure 102: Eastern Europe Generative AI in Security Market Share Comparison by Service (2016-2032)
- Figure 103: Eastern Europe Generative AI in Security Market Share Comparison by Deployment Mode (2016-2032)
- Figure 104: Eastern Europe Generative AI in Security Market Share Comparison by End User (2016-2032)
- Figure 105: APAC Generative AI in Security Market Revenue (US$ Mn) Market Share by Security Typein 2022
- Figure 106: APAC Generative AI in Security Market Attractiveness Analysis by Security Type, 2016-2032
- Figure 107: APAC Generative AI in Security Market Revenue (US$ Mn) Market Share by Servicein 2022
- Figure 108: APAC Generative AI in Security Market Attractiveness Analysis by Service, 2016-2032
- Figure 109: APAC Generative AI in Security Market Revenue (US$ Mn) Market Share by Deployment Modein 2022
- Figure 110: APAC Generative AI in Security Market Attractiveness Analysis by Deployment Mode, 2016-2032
- Figure 111: APAC Generative AI in Security Market Revenue (US$ Mn) Market Share by End Userin 2022
- Figure 112: APAC Generative AI in Security Market Attractiveness Analysis by End User, 2016-2032
- Figure 113: APAC Generative AI in Security Market Revenue (US$ Mn) Market Share by Country in 2022
- Figure 114: APAC Generative AI in Security Market Attractiveness Analysis by Country, 2016-2032
- Figure 115: APAC Generative AI in Security Market Revenue (US$ Mn) (2016-2032)
- Figure 116: APAC Generative AI in Security Market Revenue (US$ Mn) Comparison by Country (2016-2032)
- Figure 117: APAC Generative AI in Security Market Revenue (US$ Mn) Comparison by Security Type (2016-2032)
- Figure 118: APAC Generative AI in Security Market Revenue (US$ Mn) Comparison by Service (2016-2032)
- Figure 119: APAC Generative AI in Security Market Revenue (US$ Mn) Comparison by Deployment Mode (2016-2032)
- Figure 120: APAC Generative AI in Security Market Revenue (US$ Mn) Comparison by End User (2016-2032)
- Figure 121: APAC Generative AI in Security Market Y-o-Y Growth Rate Comparison by Country (2016-2032)
- Figure 122: APAC Generative AI in Security Market Y-o-Y Growth Rate Comparison by Security Type (2016-2032)
- Figure 123: APAC Generative AI in Security Market Y-o-Y Growth Rate Comparison by Service (2016-2032)
- Figure 124: APAC Generative AI in Security Market Y-o-Y Growth Rate Comparison by Deployment Mode (2016-2032)
- Figure 125: APAC Generative AI in Security Market Y-o-Y Growth Rate Comparison by End User (2016-2032)
- Figure 126: APAC Generative AI in Security Market Share Comparison by Country (2016-2032)
- Figure 127: APAC Generative AI in Security Market Share Comparison by Security Type (2016-2032)
- Figure 128: APAC Generative AI in Security Market Share Comparison by Service (2016-2032)
- Figure 129: APAC Generative AI in Security Market Share Comparison by Deployment Mode (2016-2032)
- Figure 130: APAC Generative AI in Security Market Share Comparison by End User (2016-2032)
- Figure 131: Latin America Generative AI in Security Market Revenue (US$ Mn) Market Share by Security Typein 2022
- Figure 132: Latin America Generative AI in Security Market Attractiveness Analysis by Security Type, 2016-2032
- Figure 133: Latin America Generative AI in Security Market Revenue (US$ Mn) Market Share by Servicein 2022
- Figure 134: Latin America Generative AI in Security Market Attractiveness Analysis by Service, 2016-2032
- Figure 135: Latin America Generative AI in Security Market Revenue (US$ Mn) Market Share by Deployment Modein 2022
- Figure 136: Latin America Generative AI in Security Market Attractiveness Analysis by Deployment Mode, 2016-2032
- Figure 137: Latin America Generative AI in Security Market Revenue (US$ Mn) Market Share by End Userin 2022
- Figure 138: Latin America Generative AI in Security Market Attractiveness Analysis by End User, 2016-2032
- Figure 139: Latin America Generative AI in Security Market Revenue (US$ Mn) Market Share by Country in 2022
- Figure 140: Latin America Generative AI in Security Market Attractiveness Analysis by Country, 2016-2032
- Figure 141: Latin America Generative AI in Security Market Revenue (US$ Mn) (2016-2032)
- Figure 142: Latin America Generative AI in Security Market Revenue (US$ Mn) Comparison by Country (2016-2032)
- Figure 143: Latin America Generative AI in Security Market Revenue (US$ Mn) Comparison by Security Type (2016-2032)
- Figure 144: Latin America Generative AI in Security Market Revenue (US$ Mn) Comparison by Service (2016-2032)
- Figure 145: Latin America Generative AI in Security Market Revenue (US$ Mn) Comparison by Deployment Mode (2016-2032)
- Figure 146: Latin America Generative AI in Security Market Revenue (US$ Mn) Comparison by End User (2016-2032)
- Figure 147: Latin America Generative AI in Security Market Y-o-Y Growth Rate Comparison by Country (2016-2032)
- Figure 148: Latin America Generative AI in Security Market Y-o-Y Growth Rate Comparison by Security Type (2016-2032)
- Figure 149: Latin America Generative AI in Security Market Y-o-Y Growth Rate Comparison by Service (2016-2032)
- Figure 150: Latin America Generative AI in Security Market Y-o-Y Growth Rate Comparison by Deployment Mode (2016-2032)
- Figure 151: Latin America Generative AI in Security Market Y-o-Y Growth Rate Comparison by End User (2016-2032)
- Figure 152: Latin America Generative AI in Security Market Share Comparison by Country (2016-2032)
- Figure 153: Latin America Generative AI in Security Market Share Comparison by Security Type (2016-2032)
- Figure 154: Latin America Generative AI in Security Market Share Comparison by Service (2016-2032)
- Figure 155: Latin America Generative AI in Security Market Share Comparison by Deployment Mode (2016-2032)
- Figure 156: Latin America Generative AI in Security Market Share Comparison by End User (2016-2032)
- Figure 157: Middle East & Africa Generative AI in Security Market Revenue (US$ Mn) Market Share by Security Typein 2022
- Figure 158: Middle East & Africa Generative AI in Security Market Attractiveness Analysis by Security Type, 2016-2032
- Figure 159: Middle East & Africa Generative AI in Security Market Revenue (US$ Mn) Market Share by Servicein 2022
- Figure 160: Middle East & Africa Generative AI in Security Market Attractiveness Analysis by Service, 2016-2032
- Figure 161: Middle East & Africa Generative AI in Security Market Revenue (US$ Mn) Market Share by Deployment Modein 2022
- Figure 162: Middle East & Africa Generative AI in Security Market Attractiveness Analysis by Deployment Mode, 2016-2032
- Figure 163: Middle East & Africa Generative AI in Security Market Revenue (US$ Mn) Market Share by End Userin 2022
- Figure 164: Middle East & Africa Generative AI in Security Market Attractiveness Analysis by End User, 2016-2032
- Figure 165: Middle East & Africa Generative AI in Security Market Revenue (US$ Mn) Market Share by Country in 2022
- Figure 166: Middle East & Africa Generative AI in Security Market Attractiveness Analysis by Country, 2016-2032
- Figure 167: Middle East & Africa Generative AI in Security Market Revenue (US$ Mn) (2016-2032)
- Figure 168: Middle East & Africa Generative AI in Security Market Revenue (US$ Mn) Comparison by Country (2016-2032)
- Figure 169: Middle East & Africa Generative AI in Security Market Revenue (US$ Mn) Comparison by Security Type (2016-2032)
- Figure 170: Middle East & Africa Generative AI in Security Market Revenue (US$ Mn) Comparison by Service (2016-2032)
- Figure 171: Middle East & Africa Generative AI in Security Market Revenue (US$ Mn) Comparison by Deployment Mode (2016-2032)
- Figure 172: Middle East & Africa Generative AI in Security Market Revenue (US$ Mn) Comparison by End User (2016-2032)
- Figure 173: Middle East & Africa Generative AI in Security Market Y-o-Y Growth Rate Comparison by Country (2016-2032)
- Figure 174: Middle East & Africa Generative AI in Security Market Y-o-Y Growth Rate Comparison by Security Type (2016-2032)
- Figure 175: Middle East & Africa Generative AI in Security Market Y-o-Y Growth Rate Comparison by Service (2016-2032)
- Figure 176: Middle East & Africa Generative AI in Security Market Y-o-Y Growth Rate Comparison by Deployment Mode (2016-2032)
- Figure 177: Middle East & Africa Generative AI in Security Market Y-o-Y Growth Rate Comparison by End User (2016-2032)
- Figure 178: Middle East & Africa Generative AI in Security Market Share Comparison by Country (2016-2032)
- Figure 179: Middle East & Africa Generative AI in Security Market Share Comparison by Security Type (2016-2032)
- Figure 180: Middle East & Africa Generative AI in Security Market Share Comparison by Service (2016-2032)
- Figure 181: Middle East & Africa Generative AI in Security Market Share Comparison by Deployment Mode (2016-2032)
- Figure 182: Middle East & Africa Generative AI in Security Market Share Comparison by End User (2016-2032)
- List of Tables
- Table 1: Global Generative AI in Security Market Comparison by Security Type (2016-2032)
- Table 2: Global Generative AI in Security Market Comparison by Service (2016-2032)
- Table 3: Global Generative AI in Security Market Comparison by Deployment Mode (2016-2032)
- Table 4: Global Generative AI in Security Market Comparison by End User (2016-2032)
- Table 5: Global Generative AI in Security Market Revenue (US$ Mn) Comparison by Region (2016-2032)
- Table 6: Global Generative AI in Security Market Revenue (US$ Mn) (2016-2032)
- Table 7: Global Generative AI in Security Market Revenue (US$ Mn) Comparison by Region (2016-2032)
- Table 8: Global Generative AI in Security Market Revenue (US$ Mn) Comparison by Security Type (2016-2032)
- Table 9: Global Generative AI in Security Market Revenue (US$ Mn) Comparison by Service (2016-2032)
- Table 10: Global Generative AI in Security Market Revenue (US$ Mn) Comparison by Deployment Mode (2016-2032)
- Table 11: Global Generative AI in Security Market Revenue (US$ Mn) Comparison by End User (2016-2032)
- Table 12: Global Generative AI in Security Market Y-o-Y Growth Rate Comparison by Region (2016-2032)
- Table 13: Global Generative AI in Security Market Y-o-Y Growth Rate Comparison by Security Type (2016-2032)
- Table 14: Global Generative AI in Security Market Y-o-Y Growth Rate Comparison by Service (2016-2032)
- Table 15: Global Generative AI in Security Market Y-o-Y Growth Rate Comparison by Deployment Mode (2016-2032)
- Table 16: Global Generative AI in Security Market Y-o-Y Growth Rate Comparison by End User (2016-2032)
- Table 17: Global Generative AI in Security Market Share Comparison by Region (2016-2032)
- Table 18: Global Generative AI in Security Market Share Comparison by Security Type (2016-2032)
- Table 19: Global Generative AI in Security Market Share Comparison by Service (2016-2032)
- Table 20: Global Generative AI in Security Market Share Comparison by Deployment Mode (2016-2032)
- Table 21: Global Generative AI in Security Market Share Comparison by End User (2016-2032)
- Table 22: North America Generative AI in Security Market Comparison by Service (2016-2032)
- Table 23: North America Generative AI in Security Market Comparison by Deployment Mode (2016-2032)
- Table 24: North America Generative AI in Security Market Comparison by End User (2016-2032)
- Table 25: North America Generative AI in Security Market Revenue (US$ Mn) Comparison by Country (2016-2032)
- Table 26: North America Generative AI in Security Market Revenue (US$ Mn) (2016-2032)
- Table 27: North America Generative AI in Security Market Revenue (US$ Mn) Comparison by Country (2016-2032)
- Table 28: North America Generative AI in Security Market Revenue (US$ Mn) Comparison by Security Type (2016-2032)
- Table 29: North America Generative AI in Security Market Revenue (US$ Mn) Comparison by Service (2016-2032)
- Table 30: North America Generative AI in Security Market Revenue (US$ Mn) Comparison by Deployment Mode (2016-2032)
- Table 31: North America Generative AI in Security Market Revenue (US$ Mn) Comparison by End User (2016-2032)
- Table 32: North America Generative AI in Security Market Y-o-Y Growth Rate Comparison by Country (2016-2032)
- Table 33: North America Generative AI in Security Market Y-o-Y Growth Rate Comparison by Security Type (2016-2032)
- Table 34: North America Generative AI in Security Market Y-o-Y Growth Rate Comparison by Service (2016-2032)
- Table 35: North America Generative AI in Security Market Y-o-Y Growth Rate Comparison by Deployment Mode (2016-2032)
- Table 36: North America Generative AI in Security Market Y-o-Y Growth Rate Comparison by End User (2016-2032)
- Table 37: North America Generative AI in Security Market Share Comparison by Country (2016-2032)
- Table 38: North America Generative AI in Security Market Share Comparison by Security Type (2016-2032)
- Table 39: North America Generative AI in Security Market Share Comparison by Service (2016-2032)
- Table 40: North America Generative AI in Security Market Share Comparison by Deployment Mode (2016-2032)
- Table 41: North America Generative AI in Security Market Share Comparison by End User (2016-2032)
- Table 42: Western Europe Generative AI in Security Market Comparison by Security Type (2016-2032)
- Table 43: Western Europe Generative AI in Security Market Comparison by Service (2016-2032)
- Table 44: Western Europe Generative AI in Security Market Comparison by Deployment Mode (2016-2032)
- Table 45: Western Europe Generative AI in Security Market Comparison by End User (2016-2032)
- Table 46: Western Europe Generative AI in Security Market Revenue (US$ Mn) Comparison by Country (2016-2032)
- Table 47: Western Europe Generative AI in Security Market Revenue (US$ Mn) (2016-2032)
- Table 48: Western Europe Generative AI in Security Market Revenue (US$ Mn) Comparison by Country (2016-2032)
- Table 49: Western Europe Generative AI in Security Market Revenue (US$ Mn) Comparison by Security Type (2016-2032)
- Table 50: Western Europe Generative AI in Security Market Revenue (US$ Mn) Comparison by Service (2016-2032)
- Table 51: Western Europe Generative AI in Security Market Revenue (US$ Mn) Comparison by Deployment Mode (2016-2032)
- Table 52: Western Europe Generative AI in Security Market Revenue (US$ Mn) Comparison by End User (2016-2032)
- Table 53: Western Europe Generative AI in Security Market Y-o-Y Growth Rate Comparison by Country (2016-2032)
- Table 54: Western Europe Generative AI in Security Market Y-o-Y Growth Rate Comparison by Security Type (2016-2032)
- Table 55: Western Europe Generative AI in Security Market Y-o-Y Growth Rate Comparison by Service (2016-2032)
- Table 56: Western Europe Generative AI in Security Market Y-o-Y Growth Rate Comparison by Deployment Mode (2016-2032)
- Table 57: Western Europe Generative AI in Security Market Y-o-Y Growth Rate Comparison by End User (2016-2032)
- Table 58: Western Europe Generative AI in Security Market Share Comparison by Country (2016-2032)
- Table 59: Western Europe Generative AI in Security Market Share Comparison by Security Type (2016-2032)
- Table 60: Western Europe Generative AI in Security Market Share Comparison by Service (2016-2032)
- Table 61: Western Europe Generative AI in Security Market Share Comparison by Deployment Mode (2016-2032)
- Table 62: Western Europe Generative AI in Security Market Share Comparison by End User (2016-2032)
- Table 63: Eastern Europe Generative AI in Security Market Comparison by Security Type (2016-2032)
- Table 64: Eastern Europe Generative AI in Security Market Comparison by Service (2016-2032)
- Table 65: Eastern Europe Generative AI in Security Market Comparison by Deployment Mode (2016-2032)
- Table 66: Eastern Europe Generative AI in Security Market Comparison by End User (2016-2032)
- Table 67: Eastern Europe Generative AI in Security Market Revenue (US$ Mn) Comparison by Country (2016-2032)
- Table 68: Eastern Europe Generative AI in Security Market Revenue (US$ Mn) (2016-2032)
- Table 69: Eastern Europe Generative AI in Security Market Revenue (US$ Mn) Comparison by Country (2016-2032)
- Table 70: Eastern Europe Generative AI in Security Market Revenue (US$ Mn) Comparison by Security Type (2016-2032)
- Table 71: Eastern Europe Generative AI in Security Market Revenue (US$ Mn) Comparison by Service (2016-2032)
- Table 72: Eastern Europe Generative AI in Security Market Revenue (US$ Mn) Comparison by Deployment Mode (2016-2032)
- Table 73: Eastern Europe Generative AI in Security Market Revenue (US$ Mn) Comparison by End User (2016-2032)
- Table 74: Eastern Europe Generative AI in Security Market Y-o-Y Growth Rate Comparison by Country (2016-2032)
- Table 75: Eastern Europe Generative AI in Security Market Y-o-Y Growth Rate Comparison by Security Type (2016-2032)
- Table 76: Eastern Europe Generative AI in Security Market Y-o-Y Growth Rate Comparison by Service (2016-2032)
- Table 77: Eastern Europe Generative AI in Security Market Y-o-Y Growth Rate Comparison by Deployment Mode (2016-2032)
- Table 78: Eastern Europe Generative AI in Security Market Y-o-Y Growth Rate Comparison by End User (2016-2032)
- Table 79: Eastern Europe Generative AI in Security Market Share Comparison by Country (2016-2032)
- Table 80: Eastern Europe Generative AI in Security Market Share Comparison by Security Type (2016-2032)
- Table 81: Eastern Europe Generative AI in Security Market Share Comparison by Service (2016-2032)
- Table 82: Eastern Europe Generative AI in Security Market Share Comparison by Deployment Mode (2016-2032)
- Table 83: Eastern Europe Generative AI in Security Market Share Comparison by End User (2016-2032)
- Table 84: APAC Generative AI in Security Market Comparison by Security Type (2016-2032)
- Table 85: APAC Generative AI in Security Market Comparison by Service (2016-2032)
- Table 86: APAC Generative AI in Security Market Comparison by Deployment Mode (2016-2032)
- Table 87: APAC Generative AI in Security Market Comparison by End User (2016-2032)
- Table 88: APAC Generative AI in Security Market Revenue (US$ Mn) Comparison by Country (2016-2032)
- Table 89: APAC Generative AI in Security Market Revenue (US$ Mn) (2016-2032)
- Table 90: APAC Generative AI in Security Market Revenue (US$ Mn) Comparison by Country (2016-2032)
- Table 91: APAC Generative AI in Security Market Revenue (US$ Mn) Comparison by Security Type (2016-2032)
- Table 92: APAC Generative AI in Security Market Revenue (US$ Mn) Comparison by Service (2016-2032)
- Table 93: APAC Generative AI in Security Market Revenue (US$ Mn) Comparison by Deployment Mode (2016-2032)
- Table 94: APAC Generative AI in Security Market Revenue (US$ Mn) Comparison by End User (2016-2032)
- Table 95: APAC Generative AI in Security Market Y-o-Y Growth Rate Comparison by Country (2016-2032)
- Table 96: APAC Generative AI in Security Market Y-o-Y Growth Rate Comparison by Security Type (2016-2032)
- Table 97: APAC Generative AI in Security Market Y-o-Y Growth Rate Comparison by Service (2016-2032)
- Table 98: APAC Generative AI in Security Market Y-o-Y Growth Rate Comparison by Deployment Mode (2016-2032)
- Table 99: APAC Generative AI in Security Market Y-o-Y Growth Rate Comparison by End User (2016-2032)
- Table 100: APAC Generative AI in Security Market Share Comparison by Country (2016-2032)
- Table 101: APAC Generative AI in Security Market Share Comparison by Security Type (2016-2032)
- Table 102: APAC Generative AI in Security Market Share Comparison by Service (2016-2032)
- Table 103: APAC Generative AI in Security Market Share Comparison by Deployment Mode (2016-2032)
- Table 104: APAC Generative AI in Security Market Share Comparison by End User (2016-2032)
- Table 105: Latin America Generative AI in Security Market Comparison by Security Type (2016-2032)
- Table 106: Latin America Generative AI in Security Market Comparison by Service (2016-2032)
- Table 107: Latin America Generative AI in Security Market Comparison by Deployment Mode (2016-2032)
- Table 108: Latin America Generative AI in Security Market Comparison by End User (2016-2032)
- Table 109: Latin America Generative AI in Security Market Revenue (US$ Mn) Comparison by Country (2016-2032)
- Table 110: Latin America Generative AI in Security Market Revenue (US$ Mn) (2016-2032)
- Table 111: Latin America Generative AI in Security Market Revenue (US$ Mn) Comparison by Country (2016-2032)
- Table 112: Latin America Generative AI in Security Market Revenue (US$ Mn) Comparison by Security Type (2016-2032)
- Table 113: Latin America Generative AI in Security Market Revenue (US$ Mn) Comparison by Service (2016-2032)
- Table 114: Latin America Generative AI in Security Market Revenue (US$ Mn) Comparison by Deployment Mode (2016-2032)
- Table 115: Latin America Generative AI in Security Market Revenue (US$ Mn) Comparison by End User (2016-2032)
- Table 116: Latin America Generative AI in Security Market Y-o-Y Growth Rate Comparison by Country (2016-2032)
- Table 117: Latin America Generative AI in Security Market Y-o-Y Growth Rate Comparison by Security Type (2016-2032)
- Table 118: Latin America Generative AI in Security Market Y-o-Y Growth Rate Comparison by Service (2016-2032)
- Table 119: Latin America Generative AI in Security Market Y-o-Y Growth Rate Comparison by Deployment Mode (2016-2032)
- Table 120: Latin America Generative AI in Security Market Y-o-Y Growth Rate Comparison by End User (2016-2032)
- Table 121: Latin America Generative AI in Security Market Share Comparison by Country (2016-2032)
- Table 122: Latin America Generative AI in Security Market Share Comparison by Security Type (2016-2032)
- Table 123: Latin America Generative AI in Security Market Share Comparison by Service (2016-2032)
- Table 124: Latin America Generative AI in Security Market Share Comparison by Deployment Mode (2016-2032)
- Table 125: Latin America Generative AI in Security Market Share Comparison by End User (2016-2032)
- Table 126: Middle East & Africa Generative AI in Security Market Comparison by Security Type (2016-2032)
- Table 127: Middle East & Africa Generative AI in Security Market Comparison by Service (2016-2032)
- Table 128: Middle East & Africa Generative AI in Security Market Comparison by Deployment Mode (2016-2032)
- Table 129: Middle East & Africa Generative AI in Security Market Comparison by End User (2016-2032)
- Table 130: Middle East & Africa Generative AI in Security Market Revenue (US$ Mn) Comparison by Country (2016-2032)
- Table 131: Middle East & Africa Generative AI in Security Market Revenue (US$ Mn) (2016-2032)
- Table 132: Middle East & Africa Generative AI in Security Market Revenue (US$ Mn) Comparison by Country (2016-2032)
- Table 133: Middle East & Africa Generative AI in Security Market Revenue (US$ Mn) Comparison by Security Type (2016-2032)
- Table 134: Middle East & Africa Generative AI in Security Market Revenue (US$ Mn) Comparison by Service (2016-2032)
- Table 135: Middle East & Africa Generative AI in Security Market Revenue (US$ Mn) Comparison by Deployment Mode (2016-2032)
- Table 136: Middle East & Africa Generative AI in Security Market Revenue (US$ Mn) Comparison by End User (2016-2032)
- Table 137: Middle East & Africa Generative AI in Security Market Y-o-Y Growth Rate Comparison by Country (2016-2032)
- Table 138: Middle East & Africa Generative AI in Security Market Y-o-Y Growth Rate Comparison by Security Type (2016-2032)
- Table 139: Middle East & Africa Generative AI in Security Market Y-o-Y Growth Rate Comparison by Service (2016-2032)
- Table 140: Middle East & Africa Generative AI in Security Market Y-o-Y Growth Rate Comparison by Deployment Mode (2016-2032)
- Table 141: Middle East & Africa Generative AI in Security Market Y-o-Y Growth Rate Comparison by End User (2016-2032)
- Table 142: Middle East & Africa Generative AI in Security Market Share Comparison by Country (2016-2032)
- Table 143: Middle East & Africa Generative AI in Security Market Share Comparison by Security Type (2016-2032)
- Table 144: Middle East & Africa Generative AI in Security Market Share Comparison by Service (2016-2032)
- Table 145: Middle East & Africa Generative AI in Security Market Share Comparison by Deployment Mode (2016-2032)
- Table 146: Middle East & Africa Generative AI in Security Market Share Comparison by End User (2016-2032)
- 1. Executive Summary
-
- IBM Corp.
- Intel Corp.
- NVIDIA Corp.
- Securonix Inc.
- Skycure Inc.
- Threatmetrix Inc.
- Other Key Players
Our Clients


View Our Licence Options
