
Generative AI in IT Operations Market By Component(Software, Services), By Deployment Mode(Cloud, On-premises), By Organization Size(Small and Medium Enterprises (SMEs), Large Enterprises), By Application(Performance Monitoring and Management, Anomaly Detection, Predictive Maintenance, Root Cause Analysis, Other Applications), By Region And Companies - Industry Segment Outlook, Market Assessment, Competition Scenario, Trends, And Forecast 2024-2033
-
43916
-
March 2024
-
179
-


-
This report was compiled by Vishwa Gaul Vishwa is an experienced market research and consulting professional with over 8 years of expertise in the ICT industry, contributing to over 700 reports across telecommunications, software, hardware, and digital solutions. Correspondence Team Lead- ICT Linkedin | Detailed Market research Methodology Our methodology involves a mix of primary research, including interviews with leading mental health experts, and secondary research from reputable medical journals and databases. View Detailed Methodology Page
-
Quick Navigation
Report Overview
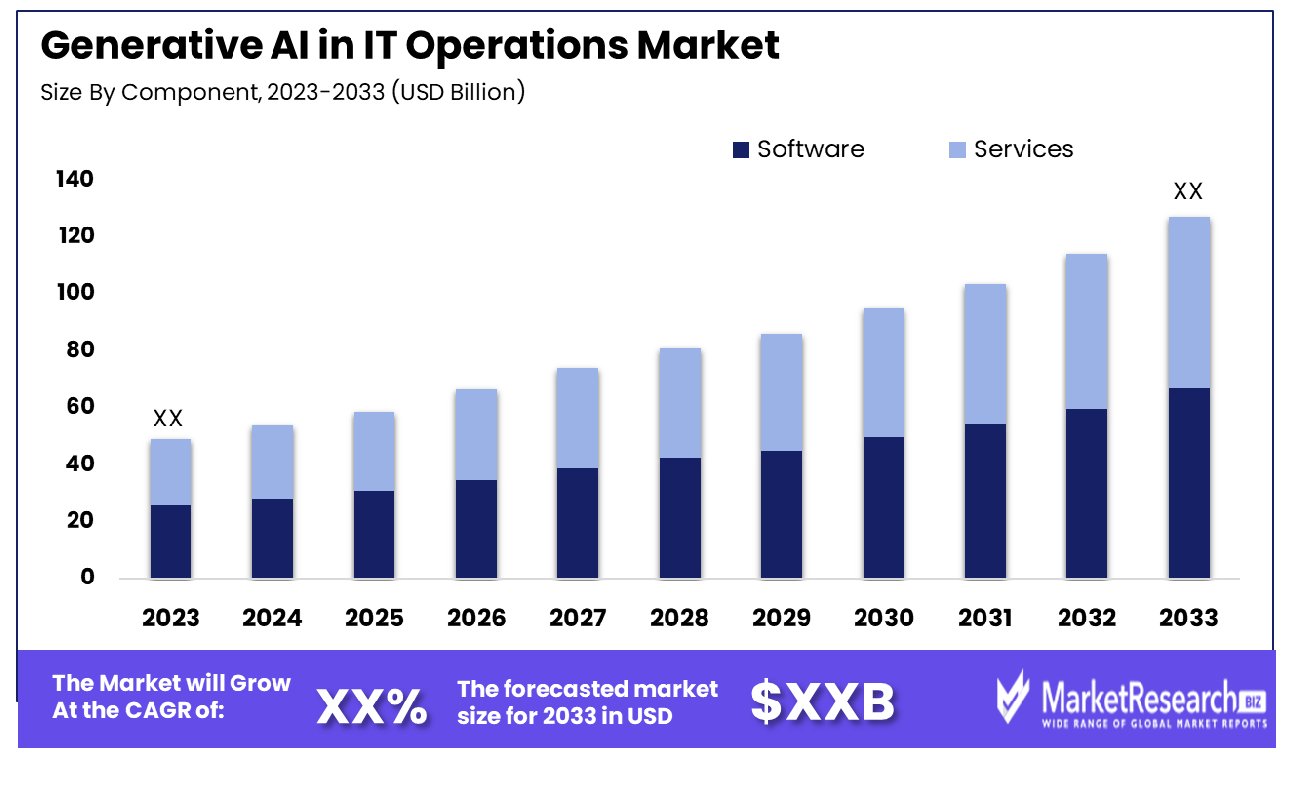
The generative AI in IT operations market was valued at USD XX Billion in 2023. It is expected to reach USD XX Billion by 2033, with a CAGR of XX% during the forecast period from 2024 to 2033. The surge in demand for advanced technologies and the rise in Information technologies companies are some of the main key driving factors for generative AI in IT operations market.
Generative AI in the IT operations is defined as the usage of artificial intelligence methods, especially generative models to streamline and enhance different aspects of IT management and infrastructure. Such models such as the GANs and VAEs can produce synthetic data representative of system behaviors, application performance, and network traffic. This synthetic data makes more effective testing, troubleshooting, and capacity planning as it simulates real-world situations without risking operation interruptions.
It also facilitates the development of predictive maintenance models by producing synthetic failure data by permitting IT teams to proactively address potential issues before they worsen. Additionally, it supports irregularity detections by developing models of normal system behavior by making swift identification of nonconformities that may show security threats or performance issues. In essence, generative AI in IT operations encourages organizations to improve reliability, efficacy, and security and to maintain complex IT infrastructures.
The Economics Times in March 2024, highlights that the Ministry of Electronics and Information Technology (MeitY) has issued approvals for companies to roll out AI, generative AI models. The government has also amended the T Act to launch rules for regulating AI companies and generative AI models and prevent “bias” of any kind.
Moreover, according to the venture beat in July 2023, highlights that more than half (54.6%) of the organizations are experimenting with generative AI, while a few (18.2%) have already amended it into their operations but only a few (18.2%) expect to spend more on the technology in the year ahead. According to the early outcome of a new survey of worldwide executives in data, AI, IT, security, and marketing.
Generative AI in IT operations provides enhanced systems testing, predictive maintenance, and troubleshooting by producing synthetic data for simulations. It improves irregularities detection and capacity planning making proactive problem-solving and enhanced resource allocation. Reliable, efficient, and secure management of complex IT infrastructure are also key aspects. The demand for generative AI in IT operations will increase due to its requirement in IT industries that will help in market expansion in the coming years.
Key Takeaways
- Market Growth: Generative AI in IT Operations Market was valued at USD XX Billion in 2023. It is expected to reach USD XX Billion by 2033, with a CAGR of XX% during the forecast period from 2024 to 2033.
- By Component: In the software component segment, predictive maintenance solutions emerge as the dominant sub-segment.
- By Deployment Mode: Cloud-based deployment stands out as the dominant sub-segment within the market's deployment modes.
- By Organization Size: Large enterprises notably lead in the adoption of predictive maintenance solutions within organizational size.
- By Application: Predictive maintenance emerges as the dominant sub-segment within the application landscape of the industry.
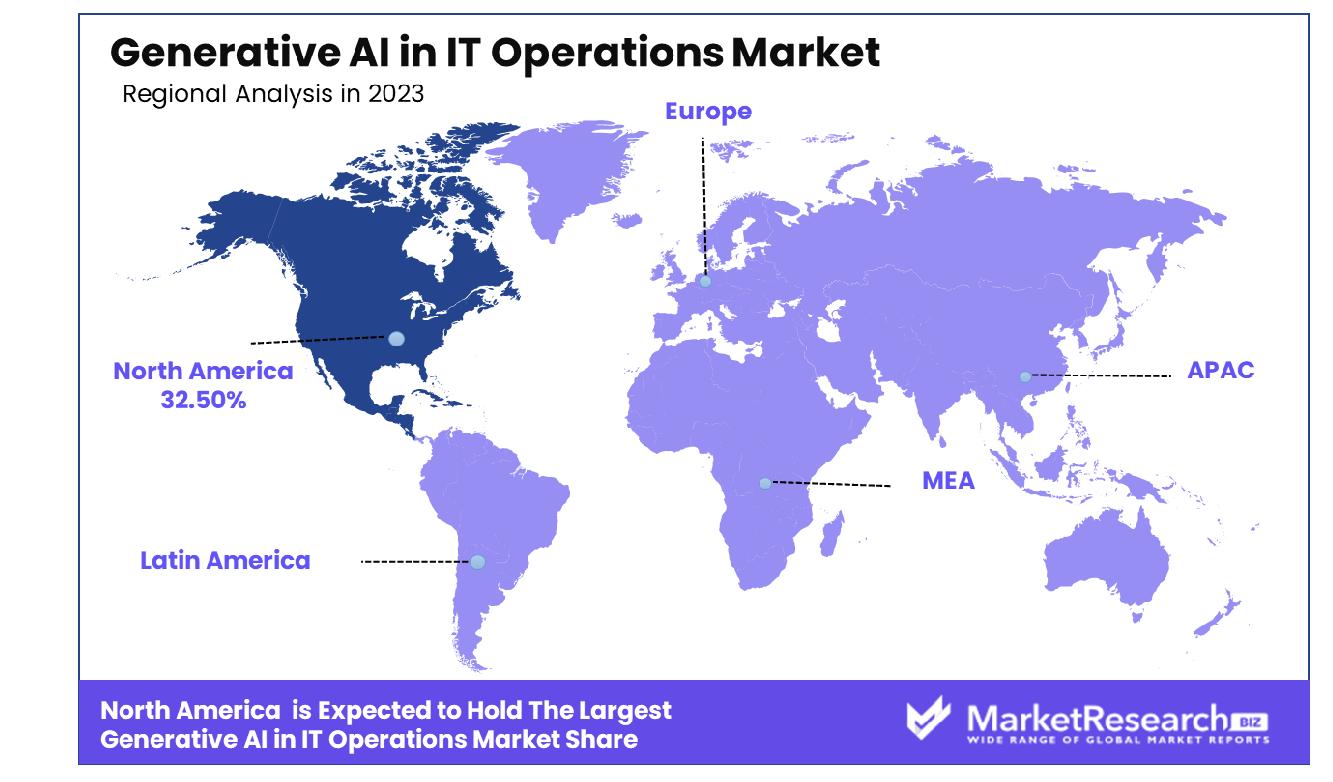
- Regional Dominance: North America leads the Generative AI in IT Operations market with a dominant 32.50% share.
- Growth Opportunity: Generative AI streamlines IT workflows, reducing manual tasks and enhancing efficiency. Predictive maintenance with Generative AI forecasts outages, minimizes downtime and optimizes resource allocation. This proactive approach reshapes IT operations, offering substantial growth opportunities in market expansion.
Driving factors
Automation of Repetitive IT Tasks Drives Market Growth
The automation of repetitive IT tasks through Generative AI significantly enhances operational efficiency within the IT domain, leading to substantial cost reductions. Generative AI's capacity to perform tasks such as ticket classification, alert triage, and log analysis not only streamlines workflows but also allocates human resources to more strategic initiatives.
The integration of these AI systems into IT operations catalyzes a transformative shift in the market, fostering a more agile, efficient, and cost-effective operational model. The long-term implications include a sustained increase in productivity and a competitive edge for adopters, reinforcing the market's growth trajectory.
Faster Issue Resolution Enhances Market Dynamics
By analyzing logs, traces, and metrics to swiftly pinpoint system issues' root causes, these AI models significantly reduce the mean time to resolution. Technologies like SambaNova's Generative AI, which specializes in analyzing telemetry data, exemplify the potential to minimize system downtime and enhance service reliability.
This rapid issue identification and resolution capability not only improves customer satisfaction but also reduces the financial impact of outages. The synergy between faster issue resolution and automated task management amplifies the market's growth, as organizations increasingly prioritize operational efficiency and resilience.
Enhanced IT System Resilience Boosts Market Expansion
Generative AI's role in augmenting IT system resilience is a critical driver of market growth. Continuous system monitoring for anomalies by AI ensures that potential failures are detected and mitigated before causing significant disruptions. This proactive approach to system maintenance enhances uptime and availability, crucial for maintaining business operations continuity in today's digital economy.
The adoption of Generative AI for system resilience not only fortifies IT infrastructure but also supports a strategic shift toward predictive maintenance. This evolution from reactive to predictive maintenance models is instrumental in reducing operational risks and costs, thereby amplifying market growth.
Restraining Factors
Data Privacy Concerns Restrains Market Growth
Data privacy concerns significantly inhibit the expansion of the Generative AI in IT Operations market. The reliance of Generative AI on vast datasets, which often include sensitive customer information for analysis, poses substantial privacy risks. Despite measures like anonymization, exemplified by Anthropic's Claude, apprehensions persist. These concerns deter organizations from adopting Generative AI solutions, fearing breaches of customer trust and regulatory non-compliance.
Lack of Trust in AI Curbs Market Development
Skepticism towards the recommendations made by AI models stems from a lack of familiarity and understanding of their operational mechanisms. Despite efforts to build confidence, and provide explanations for its predictions, overcoming this distrust requires time and accumulated positive experiences. This skepticism not only slows the adoption rate but also limits the potential applications of Generative AI within IT operations. Building trust is essential for broader acceptance and integration of AI technologies, indicating a crucial area for ongoing development and communication.
By Component Analysis
The software segment dominates the market due to its versatile applications.
Generative AI in IT Operations market growth has been driven by software sales. This trend can be explained by the increasing demand for AI-powered solutions that automate complex IT tasks such as predictive maintenance, anomaly detection, and real-time decision-making. Generative AI software platforms and tools serve as essential building blocks for implementing advanced analytics models as well as automating processes within IT operations.
Software solutions are preferred for their scalability, versatility, and efficiency in integrating Generative AI functionalities into existing IT infrastructure. They enable organizations to leverage Generative AI to enhance operational efficiency, reduce downtime, and improve service delivery. The demand for software that can learn and adapt to evolving IT environments without requiring extensive manual input underscores the segment's growth.
The services segment, although not dominant, plays a crucial role in the market's growth. It includes consulting, integration, and support services essential for deploying, managing, and optimizing Generative AI software. Services ensure that organizations can effectively implement Generative AI solutions tailored to their specific operational needs and strategic goals.
By Deployment Mode Analysis
Cloud deployment prevails owing to scalability, flexibility, and cost-effectiveness.
Cloud deployment mode stands out as the dominant subsegment of Generative AI in IT Operations market, due to its inherent advantages such as scalability, flexibility, cost-efficiency, and ability to enable AI model deployment and manage large datasets effectively. Cloud-based Generative AI solutions give organizations the ability to scale operations up or down depending on real-time demands while having access to advanced computing resources with regular updates from providers as well as regular maintenance plans from providers.
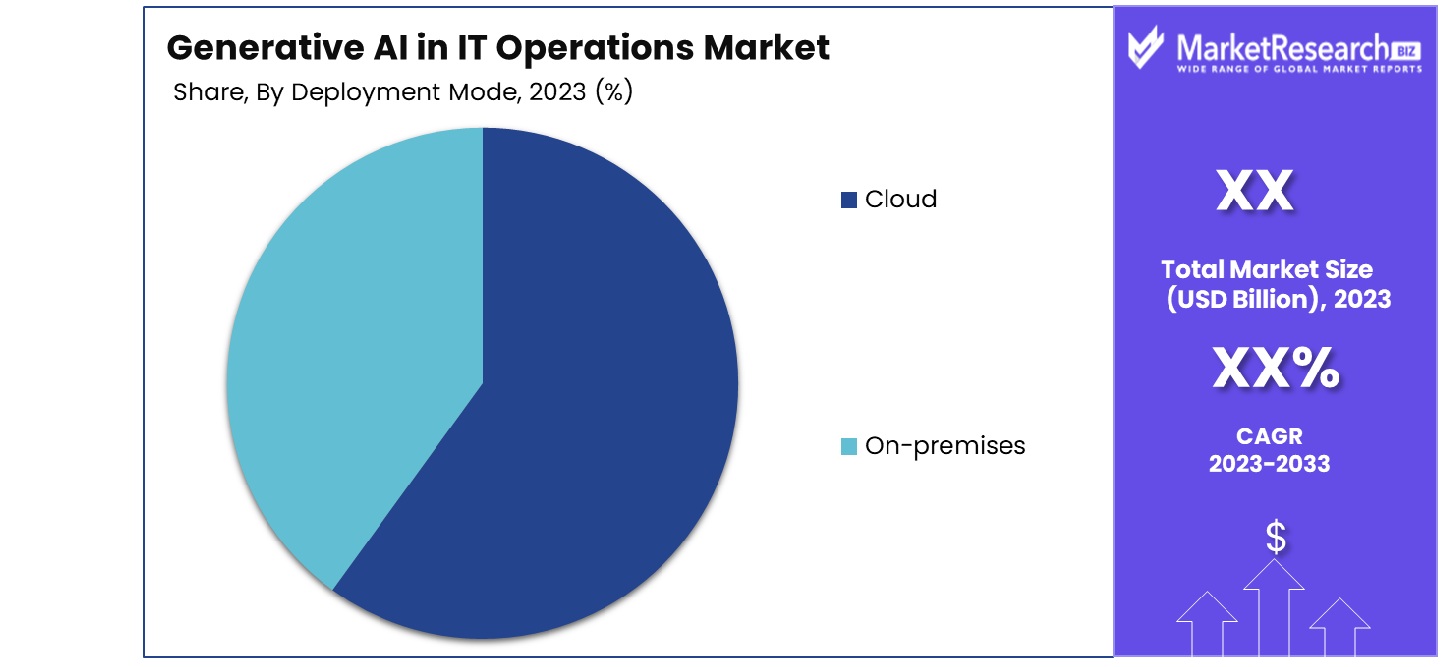
The cloud's capacity for supporting high-performance computing and data analytics is indispensable for running complex Generative AI algorithms. This deployment mode enables seamless integration and collaboration across various IT systems and platforms, making it a preferred choice for business process automation seeking to innovate and enhance their IT operations with AI.
On-premises deployment, while not as prevalent as cloud providers, remains relevant for organizations prioritizing data control, security, and regulatory compliance. This mode is critical for sectors with stringent data handling requirements, offering them the benefits of Generative AI while ensuring that data remains within their controlled environment.
By Organization Size Analysis
Large enterprises lead in adoption, benefiting from resources and infrastructure.
Large enterprises dominate within organization size categories for Generative AI adoption in IT operations, thanks to their ample resources which enable investments in cutting-edge AI technologies and complex and voluminous IT operations that necessitate advanced management solutions. Generative AI provides solutions that address intricate operational issues like scaling IT operations efficiently while upholding robust security postures, as well as efficiently handling large volumes of data.
Generative AI solutions are particularly attractive to large enterprises aiming to maintain competitive advantages through innovation. These organizations are typically at the forefront of adopting technologies that can automate complex processes, enhance decision-making, and optimize performance across sprawling IT infrastructures. Furthermore, the larger the organization, the greater the potential for return on investment (ROI) from efficiencies gained through Generative AI applications, such as predictive maintenance, anomaly detection, and root cause analysis.
While not the dominant segment, SMEs play a vital role in the market's growth. Their agility and willingness to adopt new technologies make them significant adopters of Generative AI solutions, albeit on a smaller scale. SMEs often seek Generative AI tools that offer cost-effective, scalable solutions to enhance operational efficiency and competitiveness without the extensive resource base of their larger counterparts.
By Application Analysis
Predictive maintenance emerges as a crucial application, optimizing operational efficiency.
Predictive maintenance stands out as the go-to application sub-segment in the Generative AI IT Operations market, due to its direct impact on reducing operational costs and improving system reliability by foreseeing failures before they happen. Predictive maintenance uses Generative AI to analyze data from various IT components, looking for patterns or anomalies that precede known issues and taking proactive measures against them before any major player incidents happen - thus providing preemptive solutions.
This capability is crucial for maintaining optimal operation, minimizing downtime, and avoiding the high costs associated with unscheduled maintenance and system failures. The application of Generative AI in predictive maintenance represents a shift towards more proactive IT operations management. By leveraging historical and real-time data, organizations can significantly improve their maintenance strategies, extending the lifespan of critical IT infrastructure and ensuring uninterrupted service delivery.
Performance monitoring and management are vital aspects of IT operations, ensuring that systems and applications meet performance benchmarks and user requirements. While not the most prevalent application, it remains crucial. Anomaly detection is paramount for maintaining security and operational stability by identifying irregular patterns indicative of security breaches or system malfunctions. Root cause analysis is essential for diagnosing IT issues promptly, facilitating quicker resolutions, and lowering the risk of recurrence. Additionally, Generative AI finds diverse applications in IT operations, such as security enhancement and compliance monitoring, expanding the market's scope and versatility.
Key Market Segments
By Component
- Software
- Services
By Deployment Mode
- Cloud
- On-premises
By Organization Size
- Small and Medium Enterprises (SMEs)
- Large Enterprises
By Application
- Performance Monitoring and Management
- Anomaly Detection
- Predictive Maintenance
- Root Cause Analysis
- Other Applications
Growth Opportunity
Automation of IT Process Workflows Offers Growth Opportunities
By streamlining complex and time-consuming tasks such as incident management, change approval, and provisioning, Generative AI solutions not only reduce manual intervention but also enhance efficiency and accuracy. This shift towards automation can significantly cut operational costs and allow IT personnel to focus on more strategic tasks. The potential for cost savings and improved operational efficiency positions this factor as a key driver of market expansion, as organizations seek to optimize their IT operations in the face of increasing demands and complexity.
Expansion into Predictive Maintenance Offers Market Expansion
The adoption of Generative AI for predictive maintenance is reshaping the IT Operations landscape, offering substantial growth opportunities. By leveraging historical telemetry data, Generative AI technologies, such as SambaNova's solutions, can accurately forecast potential outages and prescribe preventative measures. This capability not only minimizes downtime but also contributes to better resource allocation and cost management. The ability of Generative AI to predict and prevent issues before they occur underscores a shift towards more proactive and resilient IT operations.
Latest Trends
Integration with DevOps Tools Spurs Market Innovation
The integration of Generative AI with DevOps tools represents a burgeoning area of growth within the IT Operations Market. By embedding Generative AI into CI/CD pipelines, organizations can accelerate the deployment of AI models, enhancing the agility and efficiency of software development and operational processes. provision of turnkey integration with popular DevOps tools exemplifies this trend, facilitating smoother, faster development cycles and fostering innovation of industry trends.
Rise of Generative AI-as-a-Service Catalyzes Market Accessibility
The emergence of Generative AI-as-a-Service (AIaaS) addresses the complexity of MLOps and lowers the barriers to adoption for companies of all sizes. With providers like SambaNova offering cloud computing-based Generative AI services, organizations can leverage advanced AI capabilities without the need for extensive in-house expertise or cloud infrastructure. This democratization of access to Generative AI technologies enhances market penetration and enables a wider range of business functions to benefit from AI-driven operational improvements of market trends.
Regional Analysis
North America Dominates with 32.50% Market Share
North America's commanding presence in the Generative AI in IT Operations Market, holding a 32.50% share, is a testament to the region's innovative landscape and robust technological infrastructure. This dominance is driven by several key factors including a strong ecosystem of tech giants and startups pioneering in AI, substantial investments in research and development, and a highly skilled workforce.
The region's market dynamics are characterized by rapid adoption of advanced technologies across various sectors, fostering an environment conducive to the growth of Generative AI applications. North America's emphasis on innovation and digital transformation has positioned it as a leader in implementing AI-driven solutions for IT operations.
The forecast for North America suggests that its influence in the market will continue to grow, propelled by ongoing investments in AI technologies and the increasing demand for automation and efficiency in IT operations. The region's established IT infrastructure and commitment to technological advancement are expected to further solidify its dominance in the market.
Europe: A Strong Contender in Generative AI Adoption
Europe stands as a significant player in the Generative AI in IT Operations Market, driven by its progressive regulatory framework and emphasis on digital transformation. The region's focus on data protection and privacy, coupled with substantial investments in AI research, supports a balanced growth of Generative AI applications. Europe's diverse industrial base, from manufacturing to financial services, presents ample opportunities for the application of Generative AI in IT operations, promoting market expansion.
Asia-Pacific: Rapidly Emerging as a Key Market
The Asia-Pacific region is rapidly emerging as a key player in the Generative AI in IT Operations Market, fueled by its fast-growing economies, increasing digitalization, and investment in AI technologies. The region's vast and diverse market, along with a burgeoning startup ecosystem, offers a fertile ground for the adoption and innovation of Generative AI solutions. Asia-Pacific's commitment to technological advancement, particularly in countries like China, Japan, and South Korea, drives the demand for AI-driven IT operations solutions.
Key Regions and Countries
North America
- The US
- Canada
- Rest of North America
Europe
- Germany
- France
- The UK
- Spain
- Netherlands
- Russia
- Italy
- Rest of Europe
Asia-Pacific
- China
- Japan
- Singapore
- Thailand
- South Korea
- Vietnam
- India
- New Zealand
- Rest of Asia Pacific
Latin America
- Mexico
- Brazil
- Rest of Latin America
Middle East & Africa
- Saudi Arabia
- South Africa
- UAE
- Rest of Middle East & Africa
Key Players Analysis
In the Generative AI in IT Operations Market, key players such as IBM Corporation, Microsoft Corporation, VMware, Inc., and Cisco Systems, Inc. (through AppDynamics) are pivotal in shaping the industry's trajectory. These companies leverage their extensive technological expertise and broad market reach to drive innovation and adoption of Generative AI solutions across diverse IT operations.
IBM and Microsoft, with their longstanding presence in the tech industry, bring robust AI frameworks and cloud platforms that facilitate the integration of Generative AI into IT workflows, enhancing efficiency and predictive capabilities.
Companies like Splunk Inc., Dynatrace LLC, and Datadog, Inc., specialize in monitoring and analytics, offering advanced solutions that incorporate Generative AI for real-time data analysis, anomaly detection, and automated incident response. This specialization allows for a more nuanced approach to IT operations, prioritizing system reliability and performance optimization.
Market Key Players
- IBM Corporation
- Splunk Inc.
- Dynatrace LLC
- VMware, Inc.
- Microsoft Corporation
- AppDynamics (Cisco Systems, Inc.)
- New Relic, Inc.
- Datadog, Inc.
- BMC Software, Inc.
- Moogsoft, Inc.
- OpsRamp, Inc.
- LogicMonitor, Inc.
- PagerDuty, Inc.
- Other Key Players
Recent Development
- In January 2024, Netflix raises concerns over generative AI's potential impact on its competitiveness, citing technological advancements in its annual report to the SEC.
- In January 2024, Microsoft pioneers generative AI integration in retail, offering Copilot templates and Retail Media Creative Studio for personalized shopping experiences. The Microsoft Cloud for Retail transforms operations with accessible AI solutions.
- In December 2023, Apple's integration of a private Large Language Model (LLM) into its devices revolutionized AI accessibility, potentially transforming daily interactions and establishing Apple as a dominant AI player.
Report Scope
Report Features Description Market Value (2023) USD XX Billion Forecast Revenue (2033) USD XX Billion CAGR (2024-2032) XX% Base Year for Estimation 2023 Historic Period 2016-2023 Forecast Period 2024-2033 Report Coverage Revenue Forecast, Market Dynamics, COVID-19 Impact, Competitive Landscape, Recent Developments Segments Covered By Component(Software, Services), By Deployment Mode(Cloud, On-premises), By Organization Size(Small and Medium Enterprises (SMEs), Large Enterprises), By Application(Performance Monitoring and Management, Anomaly Detection, Predictive Maintenance, Root Cause Analysis, Other Applications) Regional Analysis North America - The US, Canada, Rest of North America, Europe - Germany, France, The UK, Spain, Italy, Russia, Netherlands, Rest of Europe, Asia-Pacific - China, Japan, South Korea, India, New Zealand, Singapore, Thailand, Vietnam, Rest of Asia Pacific, Latin America - Brazil, Mexico, Rest of Latin America, Middle East & Africa - South Africa, Saudi Arabia, UAE, Rest of Middle East & Africa Competitive Landscape IBM Corporation, Splunk Inc., Dynatrace LLC, VMware, Inc., Microsoft Corporation, AppDynamics (Cisco Systems, Inc.), New Relic, Inc., Datadog, Inc., BMC Software, Inc., Moogsoft, Inc., OpsRamp, Inc., LogicMonitor, Inc., PagerDuty, Inc., Other Key Players Customization Scope Customization for segments, region/country-level will be provided. Moreover, additional customization can be done based on the requirements. Purchase Options We have three licenses to opt for Single User License, Multi-User License (Up to 5 Users), Corporate Use License (Unlimited User and Printable PDF) -
- 1. Executive Summary
- 1.1. Definition
- 1.2. Taxonomy
- 1.3. Research Scope
- 1.4. Key Analysis
- 1.5. Key Findings by Major Segments
- 1.6. Top strategies by Major Players
- 2. Global Generative AI in IT Operations Market Overview
- 2.1. Generative AI in IT Operations Market Dynamics
- 2.1.1. Drivers
- 2.1.2. Opportunities
- 2.1.3. Restraints
- 2.1.4. Challenges
- 2.2. Macro-economic Factors
- 2.3. Regulatory Framework
- 2.4. Market Investment Feasibility Index
- 2.5. PEST Analysis
- 2.6. PORTER’S Five Force Analysis
- 2.7. Drivers & Restraints Impact Analysis
- 2.8. Industry Chain Analysis
- 2.9. Cost Structure Analysis
- 2.10. Marketing Strategy
- 2.11. Russia-Ukraine War Impact Analysis
- 2.12. Opportunity Map Analysis
- 2.13. Market Competition Scenario Analysis
- 2.14. Product Life Cycle Analysis
- 2.15. Opportunity Orbits
- 2.16. Manufacturer Intensity Map
- 2.17. Major Companies sales by Value & Volume
- 2.1. Generative AI in IT Operations Market Dynamics
- 3. Global Generative AI in IT Operations Market Analysis, Opportunity and Forecast, 2016-2032
- 3.1. Global Generative AI in IT Operations Market Analysis, 2016-2021
- 3.2. Global Generative AI in IT Operations Market Opportunity and Forecast, 2023-2032
- 3.3. Global Generative AI in IT Operations Market Analysis, Opportunity and Forecast, By By Component, 2016-2032
- 3.3.1. Global Generative AI in IT Operations Market Analysis by By Component: Introduction
- 3.3.2. Market Size Absolute $ Opportunity Analysis and Forecast, By By Component, 2016-2032
- 3.3.3. Software
- 3.3.4. Services
- 3.4. Global Generative AI in IT Operations Market Analysis, Opportunity and Forecast, By By Deployment Mode, 2016-2032
- 3.4.1. Global Generative AI in IT Operations Market Analysis by By Deployment Mode: Introduction
- 3.4.2. Market Size Absolute $ Opportunity Analysis and Forecast, By By Deployment Mode, 2016-2032
- 3.4.3. Cloud
- 3.4.4. On-premises
- 3.5. Global Generative AI in IT Operations Market Analysis, Opportunity and Forecast, By By Organization Size, 2016-2032
- 3.5.1. Global Generative AI in IT Operations Market Analysis by By Organization Size: Introduction
- 3.5.2. Market Size Absolute $ Opportunity Analysis and Forecast, By By Organization Size, 2016-2032
- 3.5.3. Small and Medium Enterprises (SMEs)
- 3.5.4. Large Enterprises
- 3.6. Global Generative AI in IT Operations Market Analysis, Opportunity and Forecast, By By Application, 2016-2032
- 3.6.1. Global Generative AI in IT Operations Market Analysis by By Application: Introduction
- 3.6.2. Market Size Absolute $ Opportunity Analysis and Forecast, By By Application, 2016-2032
- 3.6.3. Performance Monitoring and Management
- 3.6.4. Anomaly Detection
- 3.6.5. Predictive Maintenance
- 3.6.6. Root Cause Analysis
- 3.6.7. Other Applications
- 4. North America Generative AI in IT Operations Market Analysis, Opportunity and Forecast, 2016-2032
- 4.1. North America Generative AI in IT Operations Market Analysis, 2016-2021
- 4.2. North America Generative AI in IT Operations Market Opportunity and Forecast, 2023-2032
- 4.3. North America Generative AI in IT Operations Market Analysis, Opportunity and Forecast, By By Component, 2016-2032
- 4.3.1. North America Generative AI in IT Operations Market Analysis by By Component: Introduction
- 4.3.2. Market Size Absolute $ Opportunity Analysis and Forecast, By By Component, 2016-2032
- 4.3.3. Software
- 4.3.4. Services
- 4.4. North America Generative AI in IT Operations Market Analysis, Opportunity and Forecast, By By Deployment Mode, 2016-2032
- 4.4.1. North America Generative AI in IT Operations Market Analysis by By Deployment Mode: Introduction
- 4.4.2. Market Size Absolute $ Opportunity Analysis and Forecast, By By Deployment Mode, 2016-2032
- 4.4.3. Cloud
- 4.4.4. On-premises
- 4.5. North America Generative AI in IT Operations Market Analysis, Opportunity and Forecast, By By Organization Size, 2016-2032
- 4.5.1. North America Generative AI in IT Operations Market Analysis by By Organization Size: Introduction
- 4.5.2. Market Size Absolute $ Opportunity Analysis and Forecast, By By Organization Size, 2016-2032
- 4.5.3. Small and Medium Enterprises (SMEs)
- 4.5.4. Large Enterprises
- 4.6. North America Generative AI in IT Operations Market Analysis, Opportunity and Forecast, By By Application, 2016-2032
- 4.6.1. North America Generative AI in IT Operations Market Analysis by By Application: Introduction
- 4.6.2. Market Size Absolute $ Opportunity Analysis and Forecast, By By Application, 2016-2032
- 4.6.3. Performance Monitoring and Management
- 4.6.4. Anomaly Detection
- 4.6.5. Predictive Maintenance
- 4.6.6. Root Cause Analysis
- 4.6.7. Other Applications
- 4.7. North America Generative AI in IT Operations Market Analysis, Opportunity and Forecast, By Country , 2016-2032
- 4.7.1. North America Generative AI in IT Operations Market Analysis by Country : Introduction
- 4.7.2. Market Size Absolute $ Opportunity Analysis and Forecast, Country , 2016-2032
- 4.7.2.1. The US
- 4.7.2.2. Canada
- 4.7.2.3. Mexico
- 5. Western Europe Generative AI in IT Operations Market Analysis, Opportunity and Forecast, 2016-2032
- 5.1. Western Europe Generative AI in IT Operations Market Analysis, 2016-2021
- 5.2. Western Europe Generative AI in IT Operations Market Opportunity and Forecast, 2023-2032
- 5.3. Western Europe Generative AI in IT Operations Market Analysis, Opportunity and Forecast, By By Component, 2016-2032
- 5.3.1. Western Europe Generative AI in IT Operations Market Analysis by By Component: Introduction
- 5.3.2. Market Size Absolute $ Opportunity Analysis and Forecast, By By Component, 2016-2032
- 5.3.3. Software
- 5.3.4. Services
- 5.4. Western Europe Generative AI in IT Operations Market Analysis, Opportunity and Forecast, By By Deployment Mode, 2016-2032
- 5.4.1. Western Europe Generative AI in IT Operations Market Analysis by By Deployment Mode: Introduction
- 5.4.2. Market Size Absolute $ Opportunity Analysis and Forecast, By By Deployment Mode, 2016-2032
- 5.4.3. Cloud
- 5.4.4. On-premises
- 5.5. Western Europe Generative AI in IT Operations Market Analysis, Opportunity and Forecast, By By Organization Size, 2016-2032
- 5.5.1. Western Europe Generative AI in IT Operations Market Analysis by By Organization Size: Introduction
- 5.5.2. Market Size Absolute $ Opportunity Analysis and Forecast, By By Organization Size, 2016-2032
- 5.5.3. Small and Medium Enterprises (SMEs)
- 5.5.4. Large Enterprises
- 5.6. Western Europe Generative AI in IT Operations Market Analysis, Opportunity and Forecast, By By Application, 2016-2032
- 5.6.1. Western Europe Generative AI in IT Operations Market Analysis by By Application: Introduction
- 5.6.2. Market Size Absolute $ Opportunity Analysis and Forecast, By By Application, 2016-2032
- 5.6.3. Performance Monitoring and Management
- 5.6.4. Anomaly Detection
- 5.6.5. Predictive Maintenance
- 5.6.6. Root Cause Analysis
- 5.6.7. Other Applications
- 5.7. Western Europe Generative AI in IT Operations Market Analysis, Opportunity and Forecast, By Country , 2016-2032
- 5.7.1. Western Europe Generative AI in IT Operations Market Analysis by Country : Introduction
- 5.7.2. Market Size Absolute $ Opportunity Analysis and Forecast, Country , 2016-2032
- 5.7.2.1. Germany
- 5.7.2.2. France
- 5.7.2.3. The UK
- 5.7.2.4. Spain
- 5.7.2.5. Italy
- 5.7.2.6. Portugal
- 5.7.2.7. Ireland
- 5.7.2.8. Austria
- 5.7.2.9. Switzerland
- 5.7.2.10. Benelux
- 5.7.2.11. Nordic
- 5.7.2.12. Rest of Western Europe
- 6. Eastern Europe Generative AI in IT Operations Market Analysis, Opportunity and Forecast, 2016-2032
- 6.1. Eastern Europe Generative AI in IT Operations Market Analysis, 2016-2021
- 6.2. Eastern Europe Generative AI in IT Operations Market Opportunity and Forecast, 2023-2032
- 6.3. Eastern Europe Generative AI in IT Operations Market Analysis, Opportunity and Forecast, By By Component, 2016-2032
- 6.3.1. Eastern Europe Generative AI in IT Operations Market Analysis by By Component: Introduction
- 6.3.2. Market Size Absolute $ Opportunity Analysis and Forecast, By By Component, 2016-2032
- 6.3.3. Software
- 6.3.4. Services
- 6.4. Eastern Europe Generative AI in IT Operations Market Analysis, Opportunity and Forecast, By By Deployment Mode, 2016-2032
- 6.4.1. Eastern Europe Generative AI in IT Operations Market Analysis by By Deployment Mode: Introduction
- 6.4.2. Market Size Absolute $ Opportunity Analysis and Forecast, By By Deployment Mode, 2016-2032
- 6.4.3. Cloud
- 6.4.4. On-premises
- 6.5. Eastern Europe Generative AI in IT Operations Market Analysis, Opportunity and Forecast, By By Organization Size, 2016-2032
- 6.5.1. Eastern Europe Generative AI in IT Operations Market Analysis by By Organization Size: Introduction
- 6.5.2. Market Size Absolute $ Opportunity Analysis and Forecast, By By Organization Size, 2016-2032
- 6.5.3. Small and Medium Enterprises (SMEs)
- 6.5.4. Large Enterprises
- 6.6. Eastern Europe Generative AI in IT Operations Market Analysis, Opportunity and Forecast, By By Application, 2016-2032
- 6.6.1. Eastern Europe Generative AI in IT Operations Market Analysis by By Application: Introduction
- 6.6.2. Market Size Absolute $ Opportunity Analysis and Forecast, By By Application, 2016-2032
- 6.6.3. Performance Monitoring and Management
- 6.6.4. Anomaly Detection
- 6.6.5. Predictive Maintenance
- 6.6.6. Root Cause Analysis
- 6.6.7. Other Applications
- 6.7. Eastern Europe Generative AI in IT Operations Market Analysis, Opportunity and Forecast, By Country , 2016-2032
- 6.7.1. Eastern Europe Generative AI in IT Operations Market Analysis by Country : Introduction
- 6.7.2. Market Size Absolute $ Opportunity Analysis and Forecast, Country , 2016-2032
- 6.7.2.1. Russia
- 6.7.2.2. Poland
- 6.7.2.3. The Czech Republic
- 6.7.2.4. Greece
- 6.7.2.5. Rest of Eastern Europe
- 7. APAC Generative AI in IT Operations Market Analysis, Opportunity and Forecast, 2016-2032
- 7.1. APAC Generative AI in IT Operations Market Analysis, 2016-2021
- 7.2. APAC Generative AI in IT Operations Market Opportunity and Forecast, 2023-2032
- 7.3. APAC Generative AI in IT Operations Market Analysis, Opportunity and Forecast, By By Component, 2016-2032
- 7.3.1. APAC Generative AI in IT Operations Market Analysis by By Component: Introduction
- 7.3.2. Market Size Absolute $ Opportunity Analysis and Forecast, By By Component, 2016-2032
- 7.3.3. Software
- 7.3.4. Services
- 7.4. APAC Generative AI in IT Operations Market Analysis, Opportunity and Forecast, By By Deployment Mode, 2016-2032
- 7.4.1. APAC Generative AI in IT Operations Market Analysis by By Deployment Mode: Introduction
- 7.4.2. Market Size Absolute $ Opportunity Analysis and Forecast, By By Deployment Mode, 2016-2032
- 7.4.3. Cloud
- 7.4.4. On-premises
- 7.5. APAC Generative AI in IT Operations Market Analysis, Opportunity and Forecast, By By Organization Size, 2016-2032
- 7.5.1. APAC Generative AI in IT Operations Market Analysis by By Organization Size: Introduction
- 7.5.2. Market Size Absolute $ Opportunity Analysis and Forecast, By By Organization Size, 2016-2032
- 7.5.3. Small and Medium Enterprises (SMEs)
- 7.5.4. Large Enterprises
- 7.6. APAC Generative AI in IT Operations Market Analysis, Opportunity and Forecast, By By Application, 2016-2032
- 7.6.1. APAC Generative AI in IT Operations Market Analysis by By Application: Introduction
- 7.6.2. Market Size Absolute $ Opportunity Analysis and Forecast, By By Application, 2016-2032
- 7.6.3. Performance Monitoring and Management
- 7.6.4. Anomaly Detection
- 7.6.5. Predictive Maintenance
- 7.6.6. Root Cause Analysis
- 7.6.7. Other Applications
- 7.7. APAC Generative AI in IT Operations Market Analysis, Opportunity and Forecast, By Country , 2016-2032
- 7.7.1. APAC Generative AI in IT Operations Market Analysis by Country : Introduction
- 7.7.2. Market Size Absolute $ Opportunity Analysis and Forecast, Country , 2016-2032
- 7.7.2.1. China
- 7.7.2.2. Japan
- 7.7.2.3. South Korea
- 7.7.2.4. India
- 7.7.2.5. Australia & New Zeland
- 7.7.2.6. Indonesia
- 7.7.2.7. Malaysia
- 7.7.2.8. Philippines
- 7.7.2.9. Singapore
- 7.7.2.10. Thailand
- 7.7.2.11. Vietnam
- 7.7.2.12. Rest of APAC
- 8. Latin America Generative AI in IT Operations Market Analysis, Opportunity and Forecast, 2016-2032
- 8.1. Latin America Generative AI in IT Operations Market Analysis, 2016-2021
- 8.2. Latin America Generative AI in IT Operations Market Opportunity and Forecast, 2023-2032
- 8.3. Latin America Generative AI in IT Operations Market Analysis, Opportunity and Forecast, By By Component, 2016-2032
- 8.3.1. Latin America Generative AI in IT Operations Market Analysis by By Component: Introduction
- 8.3.2. Market Size Absolute $ Opportunity Analysis and Forecast, By By Component, 2016-2032
- 8.3.3. Software
- 8.3.4. Services
- 8.4. Latin America Generative AI in IT Operations Market Analysis, Opportunity and Forecast, By By Deployment Mode, 2016-2032
- 8.4.1. Latin America Generative AI in IT Operations Market Analysis by By Deployment Mode: Introduction
- 8.4.2. Market Size Absolute $ Opportunity Analysis and Forecast, By By Deployment Mode, 2016-2032
- 8.4.3. Cloud
- 8.4.4. On-premises
- 8.5. Latin America Generative AI in IT Operations Market Analysis, Opportunity and Forecast, By By Organization Size, 2016-2032
- 8.5.1. Latin America Generative AI in IT Operations Market Analysis by By Organization Size: Introduction
- 8.5.2. Market Size Absolute $ Opportunity Analysis and Forecast, By By Organization Size, 2016-2032
- 8.5.3. Small and Medium Enterprises (SMEs)
- 8.5.4. Large Enterprises
- 8.6. Latin America Generative AI in IT Operations Market Analysis, Opportunity and Forecast, By By Application, 2016-2032
- 8.6.1. Latin America Generative AI in IT Operations Market Analysis by By Application: Introduction
- 8.6.2. Market Size Absolute $ Opportunity Analysis and Forecast, By By Application, 2016-2032
- 8.6.3. Performance Monitoring and Management
- 8.6.4. Anomaly Detection
- 8.6.5. Predictive Maintenance
- 8.6.6. Root Cause Analysis
- 8.6.7. Other Applications
- 8.7. Latin America Generative AI in IT Operations Market Analysis, Opportunity and Forecast, By Country , 2016-2032
- 8.7.1. Latin America Generative AI in IT Operations Market Analysis by Country : Introduction
- 8.7.2. Market Size Absolute $ Opportunity Analysis and Forecast, Country , 2016-2032
- 8.7.2.1. Brazil
- 8.7.2.2. Colombia
- 8.7.2.3. Chile
- 8.7.2.4. Argentina
- 8.7.2.5. Costa Rica
- 8.7.2.6. Rest of Latin America
- 9. Middle East & Africa Generative AI in IT Operations Market Analysis, Opportunity and Forecast, 2016-2032
- 9.1. Middle East & Africa Generative AI in IT Operations Market Analysis, 2016-2021
- 9.2. Middle East & Africa Generative AI in IT Operations Market Opportunity and Forecast, 2023-2032
- 9.3. Middle East & Africa Generative AI in IT Operations Market Analysis, Opportunity and Forecast, By By Component, 2016-2032
- 9.3.1. Middle East & Africa Generative AI in IT Operations Market Analysis by By Component: Introduction
- 9.3.2. Market Size Absolute $ Opportunity Analysis and Forecast, By By Component, 2016-2032
- 9.3.3. Software
- 9.3.4. Services
- 9.4. Middle East & Africa Generative AI in IT Operations Market Analysis, Opportunity and Forecast, By By Deployment Mode, 2016-2032
- 9.4.1. Middle East & Africa Generative AI in IT Operations Market Analysis by By Deployment Mode: Introduction
- 9.4.2. Market Size Absolute $ Opportunity Analysis and Forecast, By By Deployment Mode, 2016-2032
- 9.4.3. Cloud
- 9.4.4. On-premises
- 9.5. Middle East & Africa Generative AI in IT Operations Market Analysis, Opportunity and Forecast, By By Organization Size, 2016-2032
- 9.5.1. Middle East & Africa Generative AI in IT Operations Market Analysis by By Organization Size: Introduction
- 9.5.2. Market Size Absolute $ Opportunity Analysis and Forecast, By By Organization Size, 2016-2032
- 9.5.3. Small and Medium Enterprises (SMEs)
- 9.5.4. Large Enterprises
- 9.6. Middle East & Africa Generative AI in IT Operations Market Analysis, Opportunity and Forecast, By By Application, 2016-2032
- 9.6.1. Middle East & Africa Generative AI in IT Operations Market Analysis by By Application: Introduction
- 9.6.2. Market Size Absolute $ Opportunity Analysis and Forecast, By By Application, 2016-2032
- 9.6.3. Performance Monitoring and Management
- 9.6.4. Anomaly Detection
- 9.6.5. Predictive Maintenance
- 9.6.6. Root Cause Analysis
- 9.6.7. Other Applications
- 9.7. Middle East & Africa Generative AI in IT Operations Market Analysis, Opportunity and Forecast, By Country , 2016-2032
- 9.7.1. Middle East & Africa Generative AI in IT Operations Market Analysis by Country : Introduction
- 9.7.2. Market Size Absolute $ Opportunity Analysis and Forecast, Country , 2016-2032
- 9.7.2.1. Algeria
- 9.7.2.2. Egypt
- 9.7.2.3. Israel
- 9.7.2.4. Kuwait
- 9.7.2.5. Nigeria
- 9.7.2.6. Saudi Arabia
- 9.7.2.7. South Africa
- 9.7.2.8. Turkey
- 9.7.2.9. The UAE
- 9.7.2.10. Rest of MEA
- 10. Global Generative AI in IT Operations Market Analysis, Opportunity and Forecast, By Region , 2016-2032
- 10.1. Global Generative AI in IT Operations Market Analysis by Region : Introduction
- 10.2. Market Size Absolute $ Opportunity Analysis and Forecast, By Region , 2016-2032
- 10.2.1. North America
- 10.2.2. Western Europe
- 10.2.3. Eastern Europe
- 10.2.4. APAC
- 10.2.5. Latin America
- 10.2.6. Middle East & Africa
- 11. Global Generative AI in IT Operations Market Competitive Landscape, Market Share Analysis, and Company Profiles
- 11.1. Market Share Analysis
- 11.2. Company Profiles
- 11.3. IBM Corporation
- 11.3.1. Company Overview
- 11.3.2. Financial Highlights
- 11.3.3. Product Portfolio
- 11.3.4. SWOT Analysis
- 11.3.5. Key Strategies and Developments
- 11.4. Splunk Inc.
- 11.4.1. Company Overview
- 11.4.2. Financial Highlights
- 11.4.3. Product Portfolio
- 11.4.4. SWOT Analysis
- 11.4.5. Key Strategies and Developments
- 11.5. Dynatrace LLC
- 11.5.1. Company Overview
- 11.5.2. Financial Highlights
- 11.5.3. Product Portfolio
- 11.5.4. SWOT Analysis
- 11.5.5. Key Strategies and Developments
- 11.6. VMware, Inc.
- 11.6.1. Company Overview
- 11.6.2. Financial Highlights
- 11.6.3. Product Portfolio
- 11.6.4. SWOT Analysis
- 11.6.5. Key Strategies and Developments
- 11.7. Microsoft Corporation
- 11.7.1. Company Overview
- 11.7.2. Financial Highlights
- 11.7.3. Product Portfolio
- 11.7.4. SWOT Analysis
- 11.7.5. Key Strategies and Developments
- 11.8. AppDynamics (Cisco Systems, Inc.)
- 11.8.1. Company Overview
- 11.8.2. Financial Highlights
- 11.8.3. Product Portfolio
- 11.8.4. SWOT Analysis
- 11.8.5. Key Strategies and Developments
- 11.9. New Relic, Inc.
- 11.9.1. Company Overview
- 11.9.2. Financial Highlights
- 11.9.3. Product Portfolio
- 11.9.4. SWOT Analysis
- 11.9.5. Key Strategies and Developments
- 11.10. Datadog, Inc.
- 11.10.1. Company Overview
- 11.10.2. Financial Highlights
- 11.10.3. Product Portfolio
- 11.10.4. SWOT Analysis
- 11.10.5. Key Strategies and Developments
- 11.11. BMC Software, Inc.
- 11.11.1. Company Overview
- 11.11.2. Financial Highlights
- 11.11.3. Product Portfolio
- 11.11.4. SWOT Analysis
- 11.11.5. Key Strategies and Developments
- 11.12. Moogsoft, Inc.
- 11.12.1. Company Overview
- 11.12.2. Financial Highlights
- 11.12.3. Product Portfolio
- 11.12.4. SWOT Analysis
- 11.12.5. Key Strategies and Developments
- 11.13.1. Company Overview
- 11.13.2. Financial Highlights
- 11.13.3. Product Portfolio
- 11.13.4. SWOT Analysis
- 11.13.5. Key Strategies and Developments
- 11.14. OpsRamp, Inc.
- 11.14.1. Company Overview
- 11.14.2. Financial Highlights
- 11.14.3. Product Portfolio
- 11.14.4. SWOT Analysis
- 11.14.5. Key Strategies and Developments
- 11.15. PagerDuty, Inc.
- 11.15.1. Company Overview
- 11.15.2. Financial Highlights
- 11.15.3. Product Portfolio
- 11.15.4. SWOT Analysis
- 11.15.5. Key Strategies and Developments
- 11.16. Other Key Players
- 11.16.1. Company Overview
- 11.16.2. Financial Highlights
- 11.16.3. Product Portfolio
- 11.16.4. SWOT Analysis
- 11.16.5. Key Strategies and Developments
- 12. Assumptions and Acronyms
- 13. Research Methodology
- 14. Contact
"
- List of Figures
- "
- Figure 1: Global Generative AI in IT Operations Market Revenue (US$ Mn) Market Share by By Component in 2022
- Figure 2: Global Generative AI in IT Operations Market Market Attractiveness Analysis by By Component, 2016-2032
- Figure 3: Global Generative AI in IT Operations Market Revenue (US$ Mn) Market Share by By Deployment Modein 2022
- Figure 4: Global Generative AI in IT Operations Market Market Attractiveness Analysis by By Deployment Mode, 2016-2032
- Figure 5: Global Generative AI in IT Operations Market Revenue (US$ Mn) Market Share by By Organization Sizein 2022
- Figure 6: Global Generative AI in IT Operations Market Market Attractiveness Analysis by By Organization Size, 2016-2032
- Figure 7: Global Generative AI in IT Operations Market Revenue (US$ Mn) Market Share by By Applicationin 2022
- Figure 8: Global Generative AI in IT Operations Market Market Attractiveness Analysis by By Application, 2016-2032
- Figure 9: Global Generative AI in IT Operations Market Revenue (US$ Mn) Market Share by Region in 2022
- Figure 10: Global Generative AI in IT Operations Market Market Attractiveness Analysis by Region, 2016-2032
- Figure 11: Global Generative AI in IT Operations Market Market Revenue (US$ Mn) (2016-2032)
- Figure 12: Global Generative AI in IT Operations Market Market Revenue (US$ Mn) Comparison by Region (2016-2032)
- Figure 13: Global Generative AI in IT Operations Market Market Revenue (US$ Mn) Comparison by By Component (2016-2032)
- Figure 14: Global Generative AI in IT Operations Market Market Revenue (US$ Mn) Comparison by By Deployment Mode (2016-2032)
- Figure 15: Global Generative AI in IT Operations Market Market Revenue (US$ Mn) Comparison by By Organization Size (2016-2032)
- Figure 16: Global Generative AI in IT Operations Market Market Revenue (US$ Mn) Comparison by By Application (2016-2032)
- Figure 17: Global Generative AI in IT Operations Market Market Y-o-Y Growth Rate Comparison by Region (2016-2032)
- Figure 18: Global Generative AI in IT Operations Market Market Y-o-Y Growth Rate Comparison by By Component (2016-2032)
- Figure 19: Global Generative AI in IT Operations Market Market Y-o-Y Growth Rate Comparison by By Deployment Mode (2016-2032)
- Figure 20: Global Generative AI in IT Operations Market Market Y-o-Y Growth Rate Comparison by By Organization Size (2016-2032)
- Figure 21: Global Generative AI in IT Operations Market Market Y-o-Y Growth Rate Comparison by By Application (2016-2032)
- Figure 22: Global Generative AI in IT Operations Market Market Share Comparison by Region (2016-2032)
- Figure 23: Global Generative AI in IT Operations Market Market Share Comparison by By Component (2016-2032)
- Figure 24: Global Generative AI in IT Operations Market Market Share Comparison by By Deployment Mode (2016-2032)
- Figure 25: Global Generative AI in IT Operations Market Market Share Comparison by By Organization Size (2016-2032)
- Figure 26: Global Generative AI in IT Operations Market Market Share Comparison by By Application (2016-2032)
- Figure 27: North America Generative AI in IT Operations Market Revenue (US$ Mn) Market Share by By Componentin 2022
- Figure 28: North America Generative AI in IT Operations Market Market Attractiveness Analysis by By Component, 2016-2032
- Figure 29: North America Generative AI in IT Operations Market Revenue (US$ Mn) Market Share by By Deployment Modein 2022
- Figure 30: North America Generative AI in IT Operations Market Market Attractiveness Analysis by By Deployment Mode, 2016-2032
- Figure 31: North America Generative AI in IT Operations Market Revenue (US$ Mn) Market Share by By Organization Sizein 2022
- Figure 32: North America Generative AI in IT Operations Market Market Attractiveness Analysis by By Organization Size, 2016-2032
- Figure 33: North America Generative AI in IT Operations Market Revenue (US$ Mn) Market Share by By Applicationin 2022
- Figure 34: North America Generative AI in IT Operations Market Market Attractiveness Analysis by By Application, 2016-2032
- Figure 35: North America Generative AI in IT Operations Market Revenue (US$ Mn) Market Share by Country in 2022
- Figure 36: North America Generative AI in IT Operations Market Market Attractiveness Analysis by Country, 2016-2032
- Figure 37: North America Generative AI in IT Operations Market Market Revenue (US$ Mn) (2016-2032)
- Figure 38: North America Generative AI in IT Operations Market Market Revenue (US$ Mn) Comparison by Country (2016-2032)
- Figure 39: North America Generative AI in IT Operations Market Market Revenue (US$ Mn) Comparison by By Component (2016-2032)
- Figure 40: North America Generative AI in IT Operations Market Market Revenue (US$ Mn) Comparison by By Deployment Mode (2016-2032)
- Figure 41: North America Generative AI in IT Operations Market Market Revenue (US$ Mn) Comparison by By Organization Size (2016-2032)
- Figure 42: North America Generative AI in IT Operations Market Market Revenue (US$ Mn) Comparison by By Application (2016-2032)
- Figure 43: North America Generative AI in IT Operations Market Market Y-o-Y Growth Rate Comparison by Country (2016-2032)
- Figure 44: North America Generative AI in IT Operations Market Market Y-o-Y Growth Rate Comparison by By Component (2016-2032)
- Figure 45: North America Generative AI in IT Operations Market Market Y-o-Y Growth Rate Comparison by By Deployment Mode (2016-2032)
- Figure 46: North America Generative AI in IT Operations Market Market Y-o-Y Growth Rate Comparison by By Organization Size (2016-2032)
- Figure 47: North America Generative AI in IT Operations Market Market Y-o-Y Growth Rate Comparison by By Application (2016-2032)
- Figure 48: North America Generative AI in IT Operations Market Market Share Comparison by Country (2016-2032)
- Figure 49: North America Generative AI in IT Operations Market Market Share Comparison by By Component (2016-2032)
- Figure 50: North America Generative AI in IT Operations Market Market Share Comparison by By Deployment Mode (2016-2032)
- Figure 51: North America Generative AI in IT Operations Market Market Share Comparison by By Organization Size (2016-2032)
- Figure 52: North America Generative AI in IT Operations Market Market Share Comparison by By Application (2016-2032)
- Figure 53: Western Europe Generative AI in IT Operations Market Revenue (US$ Mn) Market Share by By Componentin 2022
- Figure 54: Western Europe Generative AI in IT Operations Market Market Attractiveness Analysis by By Component, 2016-2032
- Figure 55: Western Europe Generative AI in IT Operations Market Revenue (US$ Mn) Market Share by By Deployment Modein 2022
- Figure 56: Western Europe Generative AI in IT Operations Market Market Attractiveness Analysis by By Deployment Mode, 2016-2032
- Figure 57: Western Europe Generative AI in IT Operations Market Revenue (US$ Mn) Market Share by By Organization Sizein 2022
- Figure 58: Western Europe Generative AI in IT Operations Market Market Attractiveness Analysis by By Organization Size, 2016-2032
- Figure 59: Western Europe Generative AI in IT Operations Market Revenue (US$ Mn) Market Share by By Applicationin 2022
- Figure 60: Western Europe Generative AI in IT Operations Market Market Attractiveness Analysis by By Application, 2016-2032
- Figure 61: Western Europe Generative AI in IT Operations Market Revenue (US$ Mn) Market Share by Country in 2022
- Figure 62: Western Europe Generative AI in IT Operations Market Market Attractiveness Analysis by Country, 2016-2032
- Figure 63: Western Europe Generative AI in IT Operations Market Market Revenue (US$ Mn) (2016-2032)
- Figure 64: Western Europe Generative AI in IT Operations Market Market Revenue (US$ Mn) Comparison by Country (2016-2032)
- Figure 65: Western Europe Generative AI in IT Operations Market Market Revenue (US$ Mn) Comparison by By Component (2016-2032)
- Figure 66: Western Europe Generative AI in IT Operations Market Market Revenue (US$ Mn) Comparison by By Deployment Mode (2016-2032)
- Figure 67: Western Europe Generative AI in IT Operations Market Market Revenue (US$ Mn) Comparison by By Organization Size (2016-2032)
- Figure 68: Western Europe Generative AI in IT Operations Market Market Revenue (US$ Mn) Comparison by By Application (2016-2032)
- Figure 69: Western Europe Generative AI in IT Operations Market Market Y-o-Y Growth Rate Comparison by Country (2016-2032)
- Figure 70: Western Europe Generative AI in IT Operations Market Market Y-o-Y Growth Rate Comparison by By Component (2016-2032)
- Figure 71: Western Europe Generative AI in IT Operations Market Market Y-o-Y Growth Rate Comparison by By Deployment Mode (2016-2032)
- Figure 72: Western Europe Generative AI in IT Operations Market Market Y-o-Y Growth Rate Comparison by By Organization Size (2016-2032)
- Figure 73: Western Europe Generative AI in IT Operations Market Market Y-o-Y Growth Rate Comparison by By Application (2016-2032)
- Figure 74: Western Europe Generative AI in IT Operations Market Market Share Comparison by Country (2016-2032)
- Figure 75: Western Europe Generative AI in IT Operations Market Market Share Comparison by By Component (2016-2032)
- Figure 76: Western Europe Generative AI in IT Operations Market Market Share Comparison by By Deployment Mode (2016-2032)
- Figure 77: Western Europe Generative AI in IT Operations Market Market Share Comparison by By Organization Size (2016-2032)
- Figure 78: Western Europe Generative AI in IT Operations Market Market Share Comparison by By Application (2016-2032)
- Figure 79: Eastern Europe Generative AI in IT Operations Market Revenue (US$ Mn) Market Share by By Componentin 2022
- Figure 80: Eastern Europe Generative AI in IT Operations Market Market Attractiveness Analysis by By Component, 2016-2032
- Figure 81: Eastern Europe Generative AI in IT Operations Market Revenue (US$ Mn) Market Share by By Deployment Modein 2022
- Figure 82: Eastern Europe Generative AI in IT Operations Market Market Attractiveness Analysis by By Deployment Mode, 2016-2032
- Figure 83: Eastern Europe Generative AI in IT Operations Market Revenue (US$ Mn) Market Share by By Organization Sizein 2022
- Figure 84: Eastern Europe Generative AI in IT Operations Market Market Attractiveness Analysis by By Organization Size, 2016-2032
- Figure 85: Eastern Europe Generative AI in IT Operations Market Revenue (US$ Mn) Market Share by By Applicationin 2022
- Figure 86: Eastern Europe Generative AI in IT Operations Market Market Attractiveness Analysis by By Application, 2016-2032
- Figure 87: Eastern Europe Generative AI in IT Operations Market Revenue (US$ Mn) Market Share by Country in 2022
- Figure 88: Eastern Europe Generative AI in IT Operations Market Market Attractiveness Analysis by Country, 2016-2032
- Figure 89: Eastern Europe Generative AI in IT Operations Market Market Revenue (US$ Mn) (2016-2032)
- Figure 90: Eastern Europe Generative AI in IT Operations Market Market Revenue (US$ Mn) Comparison by Country (2016-2032)
- Figure 91: Eastern Europe Generative AI in IT Operations Market Market Revenue (US$ Mn) Comparison by By Component (2016-2032)
- Figure 92: Eastern Europe Generative AI in IT Operations Market Market Revenue (US$ Mn) Comparison by By Deployment Mode (2016-2032)
- Figure 93: Eastern Europe Generative AI in IT Operations Market Market Revenue (US$ Mn) Comparison by By Organization Size (2016-2032)
- Figure 94: Eastern Europe Generative AI in IT Operations Market Market Revenue (US$ Mn) Comparison by By Application (2016-2032)
- Figure 95: Eastern Europe Generative AI in IT Operations Market Market Y-o-Y Growth Rate Comparison by Country (2016-2032)
- Figure 96: Eastern Europe Generative AI in IT Operations Market Market Y-o-Y Growth Rate Comparison by By Component (2016-2032)
- Figure 97: Eastern Europe Generative AI in IT Operations Market Market Y-o-Y Growth Rate Comparison by By Deployment Mode (2016-2032)
- Figure 98: Eastern Europe Generative AI in IT Operations Market Market Y-o-Y Growth Rate Comparison by By Organization Size (2016-2032)
- Figure 99: Eastern Europe Generative AI in IT Operations Market Market Y-o-Y Growth Rate Comparison by By Application (2016-2032)
- Figure 100: Eastern Europe Generative AI in IT Operations Market Market Share Comparison by Country (2016-2032)
- Figure 101: Eastern Europe Generative AI in IT Operations Market Market Share Comparison by By Component (2016-2032)
- Figure 102: Eastern Europe Generative AI in IT Operations Market Market Share Comparison by By Deployment Mode (2016-2032)
- Figure 103: Eastern Europe Generative AI in IT Operations Market Market Share Comparison by By Organization Size (2016-2032)
- Figure 104: Eastern Europe Generative AI in IT Operations Market Market Share Comparison by By Application (2016-2032)
- Figure 105: APAC Generative AI in IT Operations Market Revenue (US$ Mn) Market Share by By Componentin 2022
- Figure 106: APAC Generative AI in IT Operations Market Market Attractiveness Analysis by By Component, 2016-2032
- Figure 107: APAC Generative AI in IT Operations Market Revenue (US$ Mn) Market Share by By Deployment Modein 2022
- Figure 108: APAC Generative AI in IT Operations Market Market Attractiveness Analysis by By Deployment Mode, 2016-2032
- Figure 109: APAC Generative AI in IT Operations Market Revenue (US$ Mn) Market Share by By Organization Sizein 2022
- Figure 110: APAC Generative AI in IT Operations Market Market Attractiveness Analysis by By Organization Size, 2016-2032
- Figure 111: APAC Generative AI in IT Operations Market Revenue (US$ Mn) Market Share by By Applicationin 2022
- Figure 112: APAC Generative AI in IT Operations Market Market Attractiveness Analysis by By Application, 2016-2032
- Figure 113: APAC Generative AI in IT Operations Market Revenue (US$ Mn) Market Share by Country in 2022
- Figure 114: APAC Generative AI in IT Operations Market Market Attractiveness Analysis by Country, 2016-2032
- Figure 115: APAC Generative AI in IT Operations Market Market Revenue (US$ Mn) (2016-2032)
- Figure 116: APAC Generative AI in IT Operations Market Market Revenue (US$ Mn) Comparison by Country (2016-2032)
- Figure 117: APAC Generative AI in IT Operations Market Market Revenue (US$ Mn) Comparison by By Component (2016-2032)
- Figure 118: APAC Generative AI in IT Operations Market Market Revenue (US$ Mn) Comparison by By Deployment Mode (2016-2032)
- Figure 119: APAC Generative AI in IT Operations Market Market Revenue (US$ Mn) Comparison by By Organization Size (2016-2032)
- Figure 120: APAC Generative AI in IT Operations Market Market Revenue (US$ Mn) Comparison by By Application (2016-2032)
- Figure 121: APAC Generative AI in IT Operations Market Market Y-o-Y Growth Rate Comparison by Country (2016-2032)
- Figure 122: APAC Generative AI in IT Operations Market Market Y-o-Y Growth Rate Comparison by By Component (2016-2032)
- Figure 123: APAC Generative AI in IT Operations Market Market Y-o-Y Growth Rate Comparison by By Deployment Mode (2016-2032)
- Figure 124: APAC Generative AI in IT Operations Market Market Y-o-Y Growth Rate Comparison by By Organization Size (2016-2032)
- Figure 125: APAC Generative AI in IT Operations Market Market Y-o-Y Growth Rate Comparison by By Application (2016-2032)
- Figure 126: APAC Generative AI in IT Operations Market Market Share Comparison by Country (2016-2032)
- Figure 127: APAC Generative AI in IT Operations Market Market Share Comparison by By Component (2016-2032)
- Figure 128: APAC Generative AI in IT Operations Market Market Share Comparison by By Deployment Mode (2016-2032)
- Figure 129: APAC Generative AI in IT Operations Market Market Share Comparison by By Organization Size (2016-2032)
- Figure 130: APAC Generative AI in IT Operations Market Market Share Comparison by By Application (2016-2032)
- Figure 131: Latin America Generative AI in IT Operations Market Revenue (US$ Mn) Market Share by By Componentin 2022
- Figure 132: Latin America Generative AI in IT Operations Market Market Attractiveness Analysis by By Component, 2016-2032
- Figure 133: Latin America Generative AI in IT Operations Market Revenue (US$ Mn) Market Share by By Deployment Modein 2022
- Figure 134: Latin America Generative AI in IT Operations Market Market Attractiveness Analysis by By Deployment Mode, 2016-2032
- Figure 135: Latin America Generative AI in IT Operations Market Revenue (US$ Mn) Market Share by By Organization Sizein 2022
- Figure 136: Latin America Generative AI in IT Operations Market Market Attractiveness Analysis by By Organization Size, 2016-2032
- Figure 137: Latin America Generative AI in IT Operations Market Revenue (US$ Mn) Market Share by By Applicationin 2022
- Figure 138: Latin America Generative AI in IT Operations Market Market Attractiveness Analysis by By Application, 2016-2032
- Figure 139: Latin America Generative AI in IT Operations Market Revenue (US$ Mn) Market Share by Country in 2022
- Figure 140: Latin America Generative AI in IT Operations Market Market Attractiveness Analysis by Country, 2016-2032
- Figure 141: Latin America Generative AI in IT Operations Market Market Revenue (US$ Mn) (2016-2032)
- Figure 142: Latin America Generative AI in IT Operations Market Market Revenue (US$ Mn) Comparison by Country (2016-2032)
- Figure 143: Latin America Generative AI in IT Operations Market Market Revenue (US$ Mn) Comparison by By Component (2016-2032)
- Figure 144: Latin America Generative AI in IT Operations Market Market Revenue (US$ Mn) Comparison by By Deployment Mode (2016-2032)
- Figure 145: Latin America Generative AI in IT Operations Market Market Revenue (US$ Mn) Comparison by By Organization Size (2016-2032)
- Figure 146: Latin America Generative AI in IT Operations Market Market Revenue (US$ Mn) Comparison by By Application (2016-2032)
- Figure 147: Latin America Generative AI in IT Operations Market Market Y-o-Y Growth Rate Comparison by Country (2016-2032)
- Figure 148: Latin America Generative AI in IT Operations Market Market Y-o-Y Growth Rate Comparison by By Component (2016-2032)
- Figure 149: Latin America Generative AI in IT Operations Market Market Y-o-Y Growth Rate Comparison by By Deployment Mode (2016-2032)
- Figure 150: Latin America Generative AI in IT Operations Market Market Y-o-Y Growth Rate Comparison by By Organization Size (2016-2032)
- Figure 151: Latin America Generative AI in IT Operations Market Market Y-o-Y Growth Rate Comparison by By Application (2016-2032)
- Figure 152: Latin America Generative AI in IT Operations Market Market Share Comparison by Country (2016-2032)
- Figure 153: Latin America Generative AI in IT Operations Market Market Share Comparison by By Component (2016-2032)
- Figure 154: Latin America Generative AI in IT Operations Market Market Share Comparison by By Deployment Mode (2016-2032)
- Figure 155: Latin America Generative AI in IT Operations Market Market Share Comparison by By Organization Size (2016-2032)
- Figure 156: Latin America Generative AI in IT Operations Market Market Share Comparison by By Application (2016-2032)
- Figure 157: Middle East & Africa Generative AI in IT Operations Market Revenue (US$ Mn) Market Share by By Componentin 2022
- Figure 158: Middle East & Africa Generative AI in IT Operations Market Market Attractiveness Analysis by By Component, 2016-2032
- Figure 159: Middle East & Africa Generative AI in IT Operations Market Revenue (US$ Mn) Market Share by By Deployment Modein 2022
- Figure 160: Middle East & Africa Generative AI in IT Operations Market Market Attractiveness Analysis by By Deployment Mode, 2016-2032
- Figure 161: Middle East & Africa Generative AI in IT Operations Market Revenue (US$ Mn) Market Share by By Organization Sizein 2022
- Figure 162: Middle East & Africa Generative AI in IT Operations Market Market Attractiveness Analysis by By Organization Size, 2016-2032
- Figure 163: Middle East & Africa Generative AI in IT Operations Market Revenue (US$ Mn) Market Share by By Applicationin 2022
- Figure 164: Middle East & Africa Generative AI in IT Operations Market Market Attractiveness Analysis by By Application, 2016-2032
- Figure 165: Middle East & Africa Generative AI in IT Operations Market Revenue (US$ Mn) Market Share by Country in 2022
- Figure 166: Middle East & Africa Generative AI in IT Operations Market Market Attractiveness Analysis by Country, 2016-2032
- Figure 167: Middle East & Africa Generative AI in IT Operations Market Market Revenue (US$ Mn) (2016-2032)
- Figure 168: Middle East & Africa Generative AI in IT Operations Market Market Revenue (US$ Mn) Comparison by Country (2016-2032)
- Figure 169: Middle East & Africa Generative AI in IT Operations Market Market Revenue (US$ Mn) Comparison by By Component (2016-2032)
- Figure 170: Middle East & Africa Generative AI in IT Operations Market Market Revenue (US$ Mn) Comparison by By Deployment Mode (2016-2032)
- Figure 171: Middle East & Africa Generative AI in IT Operations Market Market Revenue (US$ Mn) Comparison by By Organization Size (2016-2032)
- Figure 172: Middle East & Africa Generative AI in IT Operations Market Market Revenue (US$ Mn) Comparison by By Application (2016-2032)
- Figure 173: Middle East & Africa Generative AI in IT Operations Market Market Y-o-Y Growth Rate Comparison by Country (2016-2032)
- Figure 174: Middle East & Africa Generative AI in IT Operations Market Market Y-o-Y Growth Rate Comparison by By Component (2016-2032)
- Figure 175: Middle East & Africa Generative AI in IT Operations Market Market Y-o-Y Growth Rate Comparison by By Deployment Mode (2016-2032)
- Figure 176: Middle East & Africa Generative AI in IT Operations Market Market Y-o-Y Growth Rate Comparison by By Organization Size (2016-2032)
- Figure 177: Middle East & Africa Generative AI in IT Operations Market Market Y-o-Y Growth Rate Comparison by By Application (2016-2032)
- Figure 178: Middle East & Africa Generative AI in IT Operations Market Market Share Comparison by Country (2016-2032)
- Figure 179: Middle East & Africa Generative AI in IT Operations Market Market Share Comparison by By Component (2016-2032)
- Figure 180: Middle East & Africa Generative AI in IT Operations Market Market Share Comparison by By Deployment Mode (2016-2032)
- Figure 181: Middle East & Africa Generative AI in IT Operations Market Market Share Comparison by By Organization Size (2016-2032)
- Figure 182: Middle East & Africa Generative AI in IT Operations Market Market Share Comparison by By Application (2016-2032)
"
- List of Tables
- "
- Table 1: Global Generative AI in IT Operations Market Market Comparison by By Component (2016-2032)
- Table 2: Global Generative AI in IT Operations Market Market Comparison by By Deployment Mode (2016-2032)
- Table 3: Global Generative AI in IT Operations Market Market Comparison by By Organization Size (2016-2032)
- Table 4: Global Generative AI in IT Operations Market Market Comparison by By Application (2016-2032)
- Table 5: Global Generative AI in IT Operations Market Revenue (US$ Mn) Comparison by Region (2016-2032)
- Table 6: Global Generative AI in IT Operations Market Market Revenue (US$ Mn) (2016-2032)
- Table 7: Global Generative AI in IT Operations Market Market Revenue (US$ Mn) Comparison by Region (2016-2032)
- Table 8: Global Generative AI in IT Operations Market Market Revenue (US$ Mn) Comparison by By Component (2016-2032)
- Table 9: Global Generative AI in IT Operations Market Market Revenue (US$ Mn) Comparison by By Deployment Mode (2016-2032)
- Table 10: Global Generative AI in IT Operations Market Market Revenue (US$ Mn) Comparison by By Organization Size (2016-2032)
- Table 11: Global Generative AI in IT Operations Market Market Revenue (US$ Mn) Comparison by By Application (2016-2032)
- Table 12: Global Generative AI in IT Operations Market Market Y-o-Y Growth Rate Comparison by Region (2016-2032)
- Table 13: Global Generative AI in IT Operations Market Market Y-o-Y Growth Rate Comparison by By Component (2016-2032)
- Table 14: Global Generative AI in IT Operations Market Market Y-o-Y Growth Rate Comparison by By Deployment Mode (2016-2032)
- Table 15: Global Generative AI in IT Operations Market Market Y-o-Y Growth Rate Comparison by By Organization Size (2016-2032)
- Table 16: Global Generative AI in IT Operations Market Market Y-o-Y Growth Rate Comparison by By Application (2016-2032)
- Table 17: Global Generative AI in IT Operations Market Market Share Comparison by Region (2016-2032)
- Table 18: Global Generative AI in IT Operations Market Market Share Comparison by By Component (2016-2032)
- Table 19: Global Generative AI in IT Operations Market Market Share Comparison by By Deployment Mode (2016-2032)
- Table 20: Global Generative AI in IT Operations Market Market Share Comparison by By Organization Size (2016-2032)
- Table 21: Global Generative AI in IT Operations Market Market Share Comparison by By Application (2016-2032)
- Table 22: North America Generative AI in IT Operations Market Market Comparison by By Deployment Mode (2016-2032)
- Table 23: North America Generative AI in IT Operations Market Market Comparison by By Organization Size (2016-2032)
- Table 24: North America Generative AI in IT Operations Market Market Comparison by By Application (2016-2032)
- Table 25: North America Generative AI in IT Operations Market Revenue (US$ Mn) Comparison by Country (2016-2032)
- Table 26: North America Generative AI in IT Operations Market Market Revenue (US$ Mn) (2016-2032)
- Table 27: North America Generative AI in IT Operations Market Market Revenue (US$ Mn) Comparison by Country (2016-2032)
- Table 28: North America Generative AI in IT Operations Market Market Revenue (US$ Mn) Comparison by By Component (2016-2032)
- Table 29: North America Generative AI in IT Operations Market Market Revenue (US$ Mn) Comparison by By Deployment Mode (2016-2032)
- Table 30: North America Generative AI in IT Operations Market Market Revenue (US$ Mn) Comparison by By Organization Size (2016-2032)
- Table 31: North America Generative AI in IT Operations Market Market Revenue (US$ Mn) Comparison by By Application (2016-2032)
- Table 32: North America Generative AI in IT Operations Market Market Y-o-Y Growth Rate Comparison by Country (2016-2032)
- Table 33: North America Generative AI in IT Operations Market Market Y-o-Y Growth Rate Comparison by By Component (2016-2032)
- Table 34: North America Generative AI in IT Operations Market Market Y-o-Y Growth Rate Comparison by By Deployment Mode (2016-2032)
- Table 35: North America Generative AI in IT Operations Market Market Y-o-Y Growth Rate Comparison by By Organization Size (2016-2032)
- Table 36: North America Generative AI in IT Operations Market Market Y-o-Y Growth Rate Comparison by By Application (2016-2032)
- Table 37: North America Generative AI in IT Operations Market Market Share Comparison by Country (2016-2032)
- Table 38: North America Generative AI in IT Operations Market Market Share Comparison by By Component (2016-2032)
- Table 39: North America Generative AI in IT Operations Market Market Share Comparison by By Deployment Mode (2016-2032)
- Table 40: North America Generative AI in IT Operations Market Market Share Comparison by By Organization Size (2016-2032)
- Table 41: North America Generative AI in IT Operations Market Market Share Comparison by By Application (2016-2032)
- Table 42: Western Europe Generative AI in IT Operations Market Market Comparison by By Component (2016-2032)
- Table 43: Western Europe Generative AI in IT Operations Market Market Comparison by By Deployment Mode (2016-2032)
- Table 44: Western Europe Generative AI in IT Operations Market Market Comparison by By Organization Size (2016-2032)
- Table 45: Western Europe Generative AI in IT Operations Market Market Comparison by By Application (2016-2032)
- Table 46: Western Europe Generative AI in IT Operations Market Revenue (US$ Mn) Comparison by Country (2016-2032)
- Table 47: Western Europe Generative AI in IT Operations Market Market Revenue (US$ Mn) (2016-2032)
- Table 48: Western Europe Generative AI in IT Operations Market Market Revenue (US$ Mn) Comparison by Country (2016-2032)
- Table 49: Western Europe Generative AI in IT Operations Market Market Revenue (US$ Mn) Comparison by By Component (2016-2032)
- Table 50: Western Europe Generative AI in IT Operations Market Market Revenue (US$ Mn) Comparison by By Deployment Mode (2016-2032)
- Table 51: Western Europe Generative AI in IT Operations Market Market Revenue (US$ Mn) Comparison by By Organization Size (2016-2032)
- Table 52: Western Europe Generative AI in IT Operations Market Market Revenue (US$ Mn) Comparison by By Application (2016-2032)
- Table 53: Western Europe Generative AI in IT Operations Market Market Y-o-Y Growth Rate Comparison by Country (2016-2032)
- Table 54: Western Europe Generative AI in IT Operations Market Market Y-o-Y Growth Rate Comparison by By Component (2016-2032)
- Table 55: Western Europe Generative AI in IT Operations Market Market Y-o-Y Growth Rate Comparison by By Deployment Mode (2016-2032)
- Table 56: Western Europe Generative AI in IT Operations Market Market Y-o-Y Growth Rate Comparison by By Organization Size (2016-2032)
- Table 57: Western Europe Generative AI in IT Operations Market Market Y-o-Y Growth Rate Comparison by By Application (2016-2032)
- Table 58: Western Europe Generative AI in IT Operations Market Market Share Comparison by Country (2016-2032)
- Table 59: Western Europe Generative AI in IT Operations Market Market Share Comparison by By Component (2016-2032)
- Table 60: Western Europe Generative AI in IT Operations Market Market Share Comparison by By Deployment Mode (2016-2032)
- Table 61: Western Europe Generative AI in IT Operations Market Market Share Comparison by By Organization Size (2016-2032)
- Table 62: Western Europe Generative AI in IT Operations Market Market Share Comparison by By Application (2016-2032)
- Table 63: Eastern Europe Generative AI in IT Operations Market Market Comparison by By Component (2016-2032)
- Table 64: Eastern Europe Generative AI in IT Operations Market Market Comparison by By Deployment Mode (2016-2032)
- Table 65: Eastern Europe Generative AI in IT Operations Market Market Comparison by By Organization Size (2016-2032)
- Table 66: Eastern Europe Generative AI in IT Operations Market Market Comparison by By Application (2016-2032)
- Table 67: Eastern Europe Generative AI in IT Operations Market Revenue (US$ Mn) Comparison by Country (2016-2032)
- Table 68: Eastern Europe Generative AI in IT Operations Market Market Revenue (US$ Mn) (2016-2032)
- Table 69: Eastern Europe Generative AI in IT Operations Market Market Revenue (US$ Mn) Comparison by Country (2016-2032)
- Table 70: Eastern Europe Generative AI in IT Operations Market Market Revenue (US$ Mn) Comparison by By Component (2016-2032)
- Table 71: Eastern Europe Generative AI in IT Operations Market Market Revenue (US$ Mn) Comparison by By Deployment Mode (2016-2032)
- Table 72: Eastern Europe Generative AI in IT Operations Market Market Revenue (US$ Mn) Comparison by By Organization Size (2016-2032)
- Table 73: Eastern Europe Generative AI in IT Operations Market Market Revenue (US$ Mn) Comparison by By Application (2016-2032)
- Table 74: Eastern Europe Generative AI in IT Operations Market Market Y-o-Y Growth Rate Comparison by Country (2016-2032)
- Table 75: Eastern Europe Generative AI in IT Operations Market Market Y-o-Y Growth Rate Comparison by By Component (2016-2032)
- Table 76: Eastern Europe Generative AI in IT Operations Market Market Y-o-Y Growth Rate Comparison by By Deployment Mode (2016-2032)
- Table 77: Eastern Europe Generative AI in IT Operations Market Market Y-o-Y Growth Rate Comparison by By Organization Size (2016-2032)
- Table 78: Eastern Europe Generative AI in IT Operations Market Market Y-o-Y Growth Rate Comparison by By Application (2016-2032)
- Table 79: Eastern Europe Generative AI in IT Operations Market Market Share Comparison by Country (2016-2032)
- Table 80: Eastern Europe Generative AI in IT Operations Market Market Share Comparison by By Component (2016-2032)
- Table 81: Eastern Europe Generative AI in IT Operations Market Market Share Comparison by By Deployment Mode (2016-2032)
- Table 82: Eastern Europe Generative AI in IT Operations Market Market Share Comparison by By Organization Size (2016-2032)
- Table 83: Eastern Europe Generative AI in IT Operations Market Market Share Comparison by By Application (2016-2032)
- Table 84: APAC Generative AI in IT Operations Market Market Comparison by By Component (2016-2032)
- Table 85: APAC Generative AI in IT Operations Market Market Comparison by By Deployment Mode (2016-2032)
- Table 86: APAC Generative AI in IT Operations Market Market Comparison by By Organization Size (2016-2032)
- Table 87: APAC Generative AI in IT Operations Market Market Comparison by By Application (2016-2032)
- Table 88: APAC Generative AI in IT Operations Market Revenue (US$ Mn) Comparison by Country (2016-2032)
- Table 89: APAC Generative AI in IT Operations Market Market Revenue (US$ Mn) (2016-2032)
- Table 90: APAC Generative AI in IT Operations Market Market Revenue (US$ Mn) Comparison by Country (2016-2032)
- Table 91: APAC Generative AI in IT Operations Market Market Revenue (US$ Mn) Comparison by By Component (2016-2032)
- Table 92: APAC Generative AI in IT Operations Market Market Revenue (US$ Mn) Comparison by By Deployment Mode (2016-2032)
- Table 93: APAC Generative AI in IT Operations Market Market Revenue (US$ Mn) Comparison by By Organization Size (2016-2032)
- Table 94: APAC Generative AI in IT Operations Market Market Revenue (US$ Mn) Comparison by By Application (2016-2032)
- Table 95: APAC Generative AI in IT Operations Market Market Y-o-Y Growth Rate Comparison by Country (2016-2032)
- Table 96: APAC Generative AI in IT Operations Market Market Y-o-Y Growth Rate Comparison by By Component (2016-2032)
- Table 97: APAC Generative AI in IT Operations Market Market Y-o-Y Growth Rate Comparison by By Deployment Mode (2016-2032)
- Table 98: APAC Generative AI in IT Operations Market Market Y-o-Y Growth Rate Comparison by By Organization Size (2016-2032)
- Table 99: APAC Generative AI in IT Operations Market Market Y-o-Y Growth Rate Comparison by By Application (2016-2032)
- Table 100: APAC Generative AI in IT Operations Market Market Share Comparison by Country (2016-2032)
- Table 101: APAC Generative AI in IT Operations Market Market Share Comparison by By Component (2016-2032)
- Table 102: APAC Generative AI in IT Operations Market Market Share Comparison by By Deployment Mode (2016-2032)
- Table 103: APAC Generative AI in IT Operations Market Market Share Comparison by By Organization Size (2016-2032)
- Table 104: APAC Generative AI in IT Operations Market Market Share Comparison by By Application (2016-2032)
- Table 105: Latin America Generative AI in IT Operations Market Market Comparison by By Component (2016-2032)
- Table 106: Latin America Generative AI in IT Operations Market Market Comparison by By Deployment Mode (2016-2032)
- Table 107: Latin America Generative AI in IT Operations Market Market Comparison by By Organization Size (2016-2032)
- Table 108: Latin America Generative AI in IT Operations Market Market Comparison by By Application (2016-2032)
- Table 109: Latin America Generative AI in IT Operations Market Revenue (US$ Mn) Comparison by Country (2016-2032)
- Table 110: Latin America Generative AI in IT Operations Market Market Revenue (US$ Mn) (2016-2032)
- Table 111: Latin America Generative AI in IT Operations Market Market Revenue (US$ Mn) Comparison by Country (2016-2032)
- Table 112: Latin America Generative AI in IT Operations Market Market Revenue (US$ Mn) Comparison by By Component (2016-2032)
- Table 113: Latin America Generative AI in IT Operations Market Market Revenue (US$ Mn) Comparison by By Deployment Mode (2016-2032)
- Table 114: Latin America Generative AI in IT Operations Market Market Revenue (US$ Mn) Comparison by By Organization Size (2016-2032)
- Table 115: Latin America Generative AI in IT Operations Market Market Revenue (US$ Mn) Comparison by By Application (2016-2032)
- Table 116: Latin America Generative AI in IT Operations Market Market Y-o-Y Growth Rate Comparison by Country (2016-2032)
- Table 117: Latin America Generative AI in IT Operations Market Market Y-o-Y Growth Rate Comparison by By Component (2016-2032)
- Table 118: Latin America Generative AI in IT Operations Market Market Y-o-Y Growth Rate Comparison by By Deployment Mode (2016-2032)
- Table 119: Latin America Generative AI in IT Operations Market Market Y-o-Y Growth Rate Comparison by By Organization Size (2016-2032)
- Table 120: Latin America Generative AI in IT Operations Market Market Y-o-Y Growth Rate Comparison by By Application (2016-2032)
- Table 121: Latin America Generative AI in IT Operations Market Market Share Comparison by Country (2016-2032)
- Table 122: Latin America Generative AI in IT Operations Market Market Share Comparison by By Component (2016-2032)
- Table 123: Latin America Generative AI in IT Operations Market Market Share Comparison by By Deployment Mode (2016-2032)
- Table 124: Latin America Generative AI in IT Operations Market Market Share Comparison by By Organization Size (2016-2032)
- Table 125: Latin America Generative AI in IT Operations Market Market Share Comparison by By Application (2016-2032)
- Table 126: Middle East & Africa Generative AI in IT Operations Market Market Comparison by By Component (2016-2032)
- Table 127: Middle East & Africa Generative AI in IT Operations Market Market Comparison by By Deployment Mode (2016-2032)
- Table 128: Middle East & Africa Generative AI in IT Operations Market Market Comparison by By Organization Size (2016-2032)
- Table 129: Middle East & Africa Generative AI in IT Operations Market Market Comparison by By Application (2016-2032)
- Table 130: Middle East & Africa Generative AI in IT Operations Market Revenue (US$ Mn) Comparison by Country (2016-2032)
- Table 131: Middle East & Africa Generative AI in IT Operations Market Market Revenue (US$ Mn) (2016-2032)
- Table 132: Middle East & Africa Generative AI in IT Operations Market Market Revenue (US$ Mn) Comparison by Country (2016-2032)
- Table 133: Middle East & Africa Generative AI in IT Operations Market Market Revenue (US$ Mn) Comparison by By Component (2016-2032)
- Table 134: Middle East & Africa Generative AI in IT Operations Market Market Revenue (US$ Mn) Comparison by By Deployment Mode (2016-2032)
- Table 135: Middle East & Africa Generative AI in IT Operations Market Market Revenue (US$ Mn) Comparison by By Organization Size (2016-2032)
- Table 136: Middle East & Africa Generative AI in IT Operations Market Market Revenue (US$ Mn) Comparison by By Application (2016-2032)
- Table 137: Middle East & Africa Generative AI in IT Operations Market Market Y-o-Y Growth Rate Comparison by Country (2016-2032)
- Table 138: Middle East & Africa Generative AI in IT Operations Market Market Y-o-Y Growth Rate Comparison by By Component (2016-2032)
- Table 139: Middle East & Africa Generative AI in IT Operations Market Market Y-o-Y Growth Rate Comparison by By Deployment Mode (2016-2032)
- Table 140: Middle East & Africa Generative AI in IT Operations Market Market Y-o-Y Growth Rate Comparison by By Organization Size (2016-2032)
- Table 141: Middle East & Africa Generative AI in IT Operations Market Market Y-o-Y Growth Rate Comparison by By Application (2016-2032)
- Table 142: Middle East & Africa Generative AI in IT Operations Market Market Share Comparison by Country (2016-2032)
- Table 143: Middle East & Africa Generative AI in IT Operations Market Market Share Comparison by By Component (2016-2032)
- Table 144: Middle East & Africa Generative AI in IT Operations Market Market Share Comparison by By Deployment Mode (2016-2032)
- Table 145: Middle East & Africa Generative AI in IT Operations Market Market Share Comparison by By Organization Size (2016-2032)
- Table 146: Middle East & Africa Generative AI in IT Operations Market Market Share Comparison by By Application (2016-2032)
- 1. Executive Summary
-
- IBM Corporation
- Splunk Inc.
- Dynatrace LLC
- VMware, Inc.
- Microsoft Corporation
- AppDynamics (Cisco Systems, Inc.)
- New Relic, Inc.
- Datadog, Inc.
- BMC Software, Inc.
- Moogsoft, Inc.
- OpsRamp, Inc.
- LogicMonitor, Inc.
- PagerDuty, Inc.
- Other Key Players
Our Clients


View Our Licence Options
