
Generative AI In Conference Market By Component(Software, Services), By Deployment(Cloud-Based, On-Premise), (By End-Use Industry(Media & Entertainment, IT & Telecommunications, Healthcare, Automotive & Transportation, BFSI, Other End-Use Industries), By Region And Companies - Industry Segment Outlook, Market Assessment, Competition Scenario, Trends, And Forecast 2024-2033
-
38868
-
April 2024
-
300
-


-
This report was compiled by Vishwa Gaul Vishwa is an experienced market research and consulting professional with over 8 years of expertise in the ICT industry, contributing to over 700 reports across telecommunications, software, hardware, and digital solutions. Correspondence Team Lead- ICT Linkedin | Detailed Market research Methodology Our methodology involves a mix of primary research, including interviews with leading mental health experts, and secondary research from reputable medical journals and databases. View Detailed Methodology Page
-
Quick Navigation
Report Overview
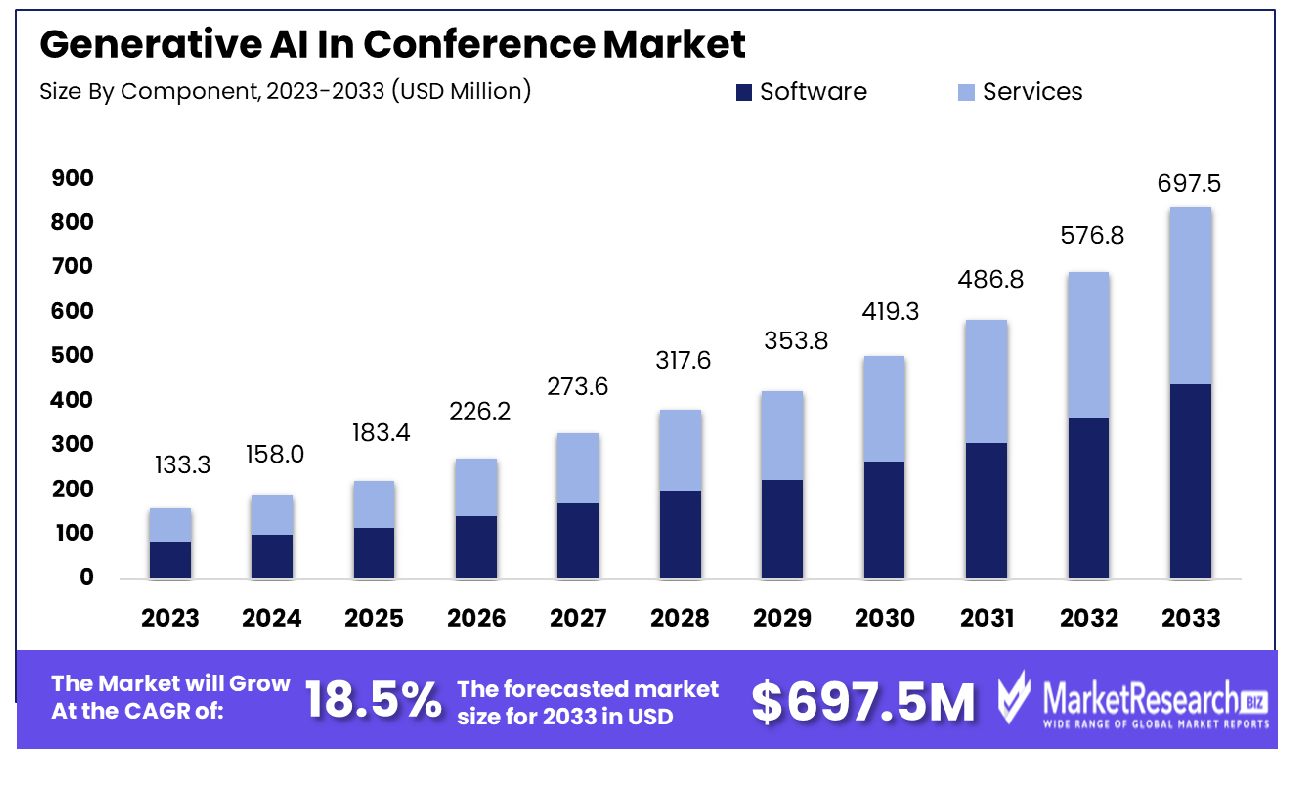
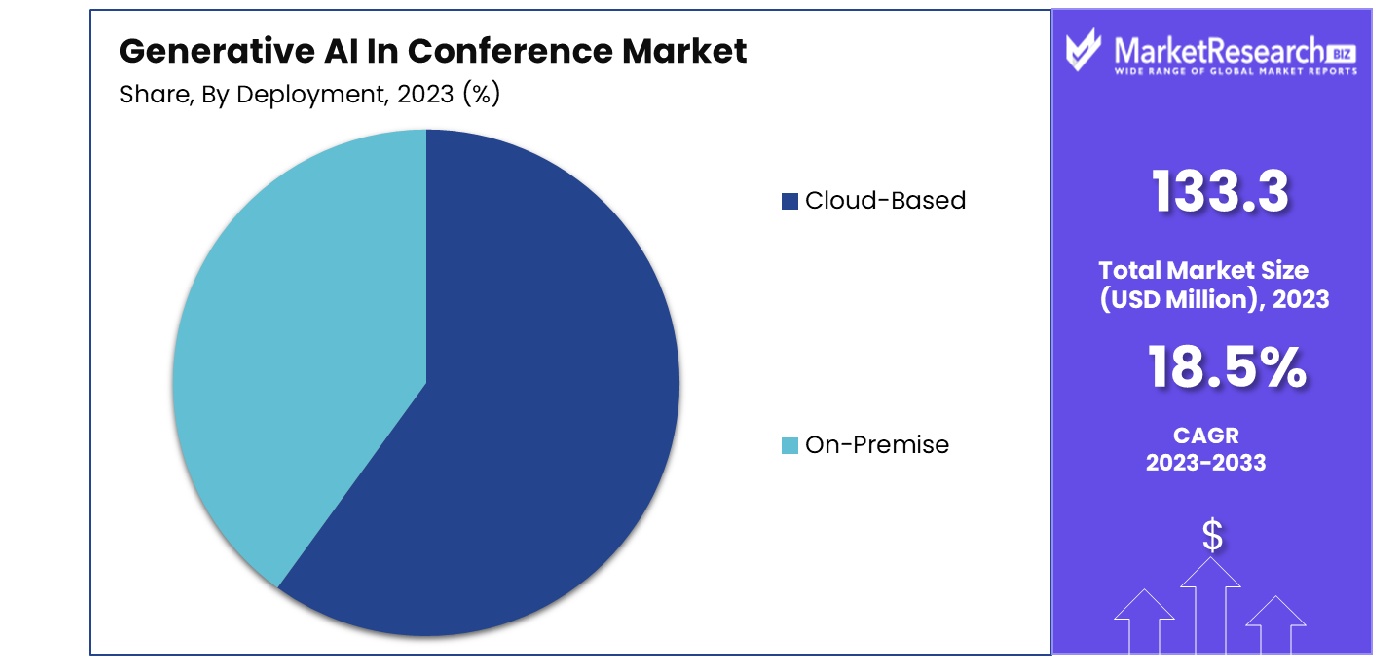
The Generative AI In Conference Market was valued at USD 133.3 Million in 2023. It is expected to reach USD 697.5 Million by 2033, with a CAGR of 18.5% during the forecast period from 2024 to 2033.
The surge in demand for new advanced technologies and the high requirement for video conferencing in every industrial sector are some of the main key driving factors for generative AI in conferences. Generative AI is transforming the way that conferences and events are being planned, organized, and implemented. With its potential to understand large sets of data and produce innovative content, it can develop customized and good experiences for attendees.
Video conferencing plays a vital role in the conference market. Advanced new technologies such as GenAI help to improve the video meeting experiences. In Gen-AI video conferencing, ML is used to regulate ways to boost the meeting experience for attendees like reduction of noise and optimize presentation delivery. It also helps in utilizing to maintain a record and helps meeting details for sharing with non-participates. By using AI potentiality, video conferencing has become more productive and effective in terms of virtual meetings. GenAI also influences the analytics to enhance meeting efficacy over a large period.
The emergence of video conferencing started with the implementation of work-from-home culture in several industries. There are many types of video conferencing platforms like Microsoft Teams, zoom, and Google Workplace. These are some of the commonly used platforms for any kind of video and audio conferencing. According to a ZDNet in January 2022, states that Microsoft Teams has more than 270 million monthly active users. Among that, there are more than 1.4 billion monthly active users integrated with Windows 10 or Windows 11.
Additionally, Microsoft also stated that Windows OEM has a revenue growth of 25% in its second quarter of FY22. Similarly, according to TechRepublic in March 2023, Datanyze, a CRM data company has stated that Zoom video and audio conferencing is the largest market leader which has 72.6% market share, and more than 176,757 firms using it. Cisco Webex is in the second market with an 8.6% market share and more than 20,935 firms are utilizing Webex.
There are several benefits of generative AI in conferences such as it automatically generates meeting summaries by providing images of the main points in the conference so that the attendees and non-attendees can quickly catch up and understand the topic easily, it also helps in providing advanced presentation and engagements. Gen AI technology in conferences also facilitates quick attendance at meetings while eliminating distractions. The demand for generative AI will rapidly grow due to a high surge in video conferencing and work-from-home culture models by several industries that will help in market expansion in the coming years.
Key Takeaways
- Market Growth: The Generative AI In Conference Market was valued at USD 133.3 Million in 2023. It is expected to reach USD 697.5 Million by 2033, with a CAGR of 18.5% during the forecast period from 2024 to 2033.
- By Component: Software dominates the component segment, driving innovation and functionality in generative AI.
- By Deployment: Cloud-based deployment leads, offering scalability and accessibility for AI applications.
- By End-Use Industry: Media & Entertainment is the top end-use industry, leveraging AI for creativity.
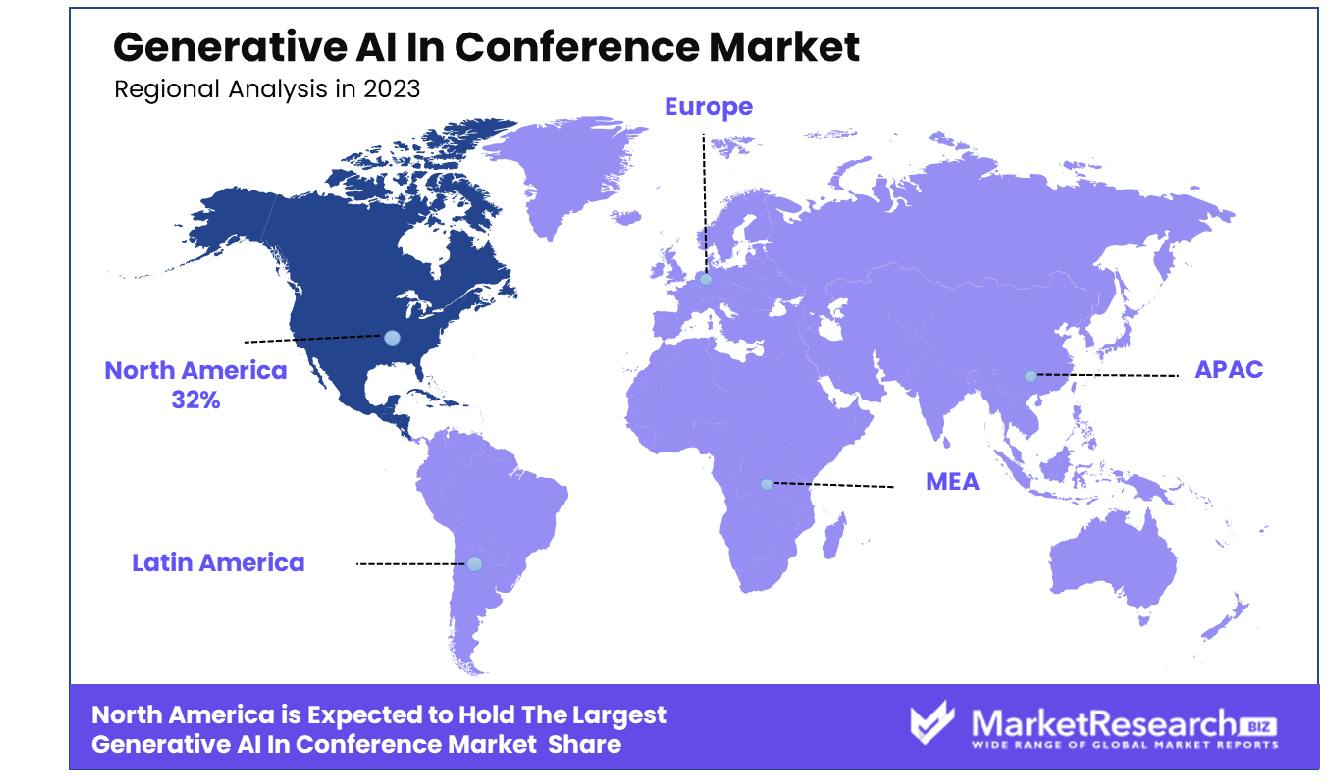
- Regional Dominance: North America holds a 32% share in the Generative AI Conference Market.
- Growth Opportunity: The integration of generative AI into the conference market enables the automation of tasks and the generation of insightful data analytics, transforming event planning and execution while providing a competitive advantage and tailored attendee experiences.
Driving factors
Digital Transformation in Event Management
Digitizing the event management sector serves as a key driver of Generative AI Conference Market's growth. This trend, propelled by a strategic shift towards digital platforms, aims at leveraging data-driven insights and crafting personalized engagement strategies to elevate attendee experiences.
The emphasis on digital transformation facilitates the integration of generative AI technologies, enabling sophisticated data analysis and engagement personalization at scale. This shift not only enhances operational efficiencies but also significantly improves the quality of interactions and experiences for participants, thereby driving the demand for generative AI solutions in the conference realm.
Embracing Hybrid and Virtual Events in the Post-Pandemic Era
The post-pandemic landscape has ushered in a paradigm shift towards hybrid and virtual events, marking a pivotal moment for the Generative AI in Conference Market. The necessity to blend physical presence with digital accessibility has highlighted the importance of advanced AI tools capable of bridging the experiential gap between these two realms.
Generative AI plays a crucial role in creating immersive, interactive, and personalized virtual environments that mimic the dynamism of in-person events. This transformation is not merely a response to immediate challenges but represents a long-term evolution in the way conferences are conceived and delivered, significantly expanding the market for generative AI technologies.
Scaling Solutions for Data Management
Due to increasing demands for scalable solutions to manage rapidly expanding data volumes, generative AI is increasingly popular within the conference industry. As event organizers grapple with the challenge of providing personalized experiences to an increasingly diverse and expanding attendee base, the ability of generative AI to process and analyze large datasets becomes invaluable.
This technology facilitates the delivery of customized content, recommendations, and interactions at an individual level, even in large-scale events. The capacity of generative AI to offer scalable, personalized solutions not only enhances attendee satisfaction but also propels market growth by meeting the critical needs of the modern conference industry.
Restraining Factors
Navigating the Terrain of Bias and Fairness in Generative AI
One of the key restraints on Generative AI market growth is bias and fairness risks associated with AI models. Generative AI, while transformative, carries the potential to perpetuate and amplify existing biases if not meticulously designed and monitored. This challenge can lead to unfair outcomes for certain groups of participants and inflict reputational damage on conference organizers who deploy these technologies.
The intricacies of bias within AI necessitate rigorous ethical frameworks and continuous oversight to ensure equitable treatment of all participants. This requirement for heightened vigilance and ethical consideration may slow adoption rates as organizations grapple with implementing these safeguards. The effort to mitigate bias and ensure fairness is crucial, not only to prevent ethical breaches but also to foster an inclusive environment that reflects the diverse perspectives of the global conference audience.
Ensuring Quality and Accuracy in Generative AI Outputs
Generative AI models in conference settings present another major hurdle. Their potential to produce inaccurate or false information poses a risk that undermines the credibility and trustworthiness of their technology. In the context of conferences, where the dissemination of accurate information is paramount, the repercussions of unreliable AI-generated content can be particularly damaging.
This concern directly impacts the willingness of organizations to integrate generative AI into their event management strategies, as the stakes of disseminating inaccurate information are high. Establishing robust validation mechanisms and enhancing the sophistication of AI models are essential steps toward mitigating this risk. However, the ongoing need for improvement in these areas remains a significant hurdle, slowing the pace at which generative AI can be confidently deployed across the conference industry.
By Component Analysis
Software components lead in enabling generative AI functionalities, reflecting high demand and technological advancements.
Software was the clear leader of Generative AI in Conference Market in 2023, overthrowing Services both in terms of market dominance and impact. This can be attributed to software's pivotal role in providing innovative, cost-efficient conference solutions favored by digital audiences; its superiority lies in providing comprehensive platforms integrating generative AI technologies that offer personalized content creation services such as real-time language translation and automated scheduling systems - further elevating its dominance within this market segment.
Recent conferences have witnessed an upswing in demand for generative AI software, driven by an increase in interactive virtual meeting spaces. Organizations and industries are leveraging these advanced software solutions to host conferences that offer participants a more immersive and participative experience. This shift towards digitalization, accentuated by the global pandemic's lingering effects, has further solidified the software segment's market position.
Moreover, the integration of generative AI into conference software has unlocked new opportunities for customization and accessibility, making conferences more inclusive and tailored to individual preferences. The ability of generative AI to analyze vast amounts of data and generate content in real time has been instrumental in enhancing the value proposition of conference software, thereby attracting a broader user base.
By Deployment Analysis
Cloud-based solutions prevail, offering scalability and accessibility, pivotal for widespread generative AI adoption.
In 2023, the Cloud-Based deployment model held a dominant market position in the By Deployment segment of the Generative AI in Conference Market, outperforming the On-Premise model. This dominance is primarily attributed to the cloud-based model's inherent flexibility, scalability, and cost-effectiveness, which align closely with the evolving needs of the conference industry.
The cloud-based approach enables seamless access to generative AI tools and platforms from any location, facilitating the organization of virtual conferences with participants spread across the globe. This model's adaptability is especially relevant in a landscape where the demand for remote and hybrid conference solutions has seen exponential growth.
The preference for cloud-based solutions is further bolstered by the reduced need for substantial upfront investment in hardware and infrastructure, making it a more accessible option for organizations of all sizes. Additionally, cloud-based generative AI solutions offer the advantage of regular updates and improvements without disrupting the user experience, ensuring that conference organizers have access to the latest technologies.
Despite the cloud-based model's significant advantages, the On-Premise deployment continues to find relevance among organizations with strict data control and security requirements. However, the overall market trend indicates a robust shift towards cloud-based solutions, driven by their ability to offer enhanced flexibility and efficiency.
By End-Use Industry Analysis
The media and entertainment sector emerges as the foremost adopter, leveraging AI for creative processes.
In 2023, the Media & Entertainment sector held a dominant market position in the By End-Use Industry segment of the Generative AI in Conference Market, eclipsing other sectors such as IT & Telecommunications, Healthcare, Automotive & Transportation, BFSI, and other end-use industries.
This preeminence can be largely attributed to the sector's intrinsic need for innovative and engaging content delivery mechanisms, which are effectively enabled by generative AI technologies. The adoption of generative AI in Media & Entertainment has revolutionized the way conferences are conceptualized, planned, and executed, providing unparalleled levels of personalization, interaction, and content generation.
The Media & Entertainment industry's reliance on cutting-edge technology to captivate audiences has made it a fertile ground for the application of generative AI. This technology enhances audience engagement through personalized content creation, real-time translations, and interactive sessions, thereby significantly enriching the conference experience. Furthermore, the seamless integration of generative AI enables the Media & Entertainment sector to host virtual and hybrid events that reach a global audience, breaking geographical barriers and opening up new revenue streams.
While the Media & Entertainment industry leads in the utilization of generative AI in conferences, other sectors such as IT & Telecommunications and Healthcare are also recognizing its potential. These industries are beginning to leverage generative AI for more efficient knowledge dissemination and networking, albeit at a slower pace compared to Media & Entertainment.
The trend underscores a broader shift towards digitalization across industries, with Media & Entertainment at the forefront of adopting generative AI to enhance the conference experience. As technology continues to evolve, its adoption across different end-use industries is expected to increase, further diversifying the application of generative AI in the conference market. However, the Media & Entertainment sector's early and innovative use of this technology sets a high benchmark for its contemporaries, reinforcing its dominant position in the market.
Key Market Segments
By Component
- Software
- Services
By Deployment
- Cloud-Based
- On-Premise
By End-Use Industry
- Media & Entertainment
- IT & Telecommunications
- Healthcare
- Automotive & Transportation
- BFSI
- Other End-Use Industries
Growth Opportunity
Creation of Purpose-Built Tools for Handling Routine or Complex Tasks
The incorporation of generative AI into the conference market presents a significant opportunity for the creation of purpose-built tools designed to automate both routine and complex tasks. This automation capability is poised to transform conference management by streamlining event planning, attendee registration, and content management processes. The deployment of AI-driven tools not only reduces the operational burden on human resources but also minimizes the likelihood of errors, thereby enhancing overall efficiency and participant satisfaction.
Furthermore, the ability of generative AI to handle complex tasks, such as real-time content generation and personalized attendee engagement, introduces a new level of dynamism and interactivity to conferences. This technological advancement is expected to set new benchmarks in the quality and impact of professional gatherings, creating a competitive edge for early adopters.
Enhanced Data Insights and Analytics for Decision-Making
Another significant opportunity lies in the realm of data insights and analytics powered by generative AI. The capability of AI to sift through vast amounts of data and extract meaningful patterns and insights can vastly improve decision-making processes for conference organizers. These insights can inform strategic decisions around content curation, marketing strategies, and attendee engagement tactics, making them more data-driven and targeted. The potential for predictive analytics also emerges, allowing organizers to anticipate future trends, attendee preferences, and potential market shifts.
This proactive approach can facilitate the creation of more relevant and impactful conference experiences, tailored to meet the evolving needs and expectations of participants. As such, the integration of enhanced data analytics represents a critical leverage point for stakeholders in the Generative AI in Conference Market, promising to elevate the strategic planning and execution of events to unprecedented levels.
Latest Trends
Sales Forecasting and Pipeline Optimization
In 2023, the Generative AI in Conference Market has observed a pivotal trend towards leveraging generative AI for sales forecasting and pipeline optimization. This innovative approach allows for the analysis of extensive historical sales data, enabling the generation of accurate forecasts for future sales. Such predictive capabilities are instrumental for sales teams, granting them the insight to fine-tune their sales pipeline and allocate resources with greater precision.
This trend signifies a shift towards a more strategic and data-driven methodology in sales management within the conference sector. By optimizing the sales pipeline, organizations can enhance their operational efficiency, reduce costs, and improve sales outcomes. This application of generative AI embodies a significant technological advancement, providing a competitive edge to those who adopt it, as it aligns with the growing demand for smarter, more responsive sales strategies in the dynamic conference market landscape.
Lead Identification and Qualification
Another notable trend in 2023 is the utilization of generative AI for lead identification and qualification. By harnessing the power of AI to sift through customer data and behavior, businesses can pinpoint potential sales leads with unprecedented accuracy. Beyond mere identification, generative AI excels in qualifying these leads, assessing their likelihood to convert based on a myriad of factors. This level of precision enables the generation of customized sales tactics and campaigns that are tailored to the unique profiles of leads, significantly increasing the chances of conversion.
The strategic application of generative AI in this domain represents a paradigm shift in how leads are generated and nurtured in the conference market. It underscores a broader trend toward personalization and efficiency, powered by advanced analytics and machine learning. As businesses continue to explore these AI-driven methodologies, the landscape of lead generation and sales strategy in the conference industry is set to evolve, promising more targeted, efficient, and effective sales processes.
Regional Analysis
In the Generative AI in Conference Market, North America holds a significant 32% market share.
The proliferation of generative AI in the conference market is distinctly manifested across different regions, each displaying unique growth trajectories and market dynamics. In North America, the adoption of generative AI technologies is at the forefront, constituting approximately 32% of the global market.
This can be attributed to the region's robust technological infrastructure, significant investments in AI research, and a highly digitized corporate sector that readily integrates advanced AI solutions for enhanced conferencing experiences. Europe follows suit, with its market expansion driven by stringent data protection regulations fostering innovative, secure AI applications in the conferencing sector.
The Asia Pacific region is witnessing the fastest growth, spurred by burgeoning tech startups, increasing internet penetration, and governmental support for digital transformations. In this region, generative AI is not only revolutionizing traditional conferencing methods but also bridging geographic and linguistic divides, thus facilitating more inclusive and diversified interactions.
The Middle East & Africa, though nascent, are showing promising signs of growth. The demand for sophisticated AI solutions in conferences is gradually rising, propelled by the digitalization of businesses and the need for efficient, real-time communication platforms. Latin America, on the other hand, is exploring generative AI's potential to transform conference markets by enhancing user engagement through personalized and interactive AI-driven features. Despite facing infrastructure challenges, the region's focus on technological advancement and innovation is paving the way for significant growth.
Key Regions and Countries
North America
- The US
- Canada
- Rest of North America
Europe
- Germany
- France
- The UK
- Spain
- Netherlands
- Russia
- Italy
- Rest of Europe
Asia-Pacific
- China
- Japan
- Singapore
- Thailand
- South Korea
- Vietnam
- India
- New Zealand
- Rest of Asia Pacific
Latin America
- Mexico
- Brazil
- Rest of Latin America
Middle East & Africa
- Saudi Arabia
- South Africa
- UAE
- Rest of Middle East & Africa
Key Players Analysis
In the global Generative AI in Conference Market for 2023, the landscape is dominated by a mix of established tech giants and emerging AI-focused firms, each contributing uniquely to the sector's evolution. Zoom Video Communications Inc. leads with its seamless integration of generative AI to enhance virtual meetings, setting a high standard for user experience. MOSTLY AI Inc. and Synthesis AI, though smaller in scale, are pivotal in driving innovation, especially in creating hyper-realistic virtual avatars and environments for more engaging conferences.
OpenAI, with its groundbreaking AI models, is a critical enabler for startups and established companies alike, democratizing access to advanced AI tools. Genie AI Ltd. stands out for its focus on automating and personalizing meeting notes and follow-ups, thus enhancing productivity. Adobe Inc., with its vast experience in creative software, is innovating at the intersection of AI and user interface design, making conferencing tools more intuitive and feature-rich.
Microsoft Corporation, a behemoth in both AI and software, is leveraging its ecosystem to integrate generative AI across its conferencing solutions, notably Teams, enhancing collaboration and efficiency. IBM Corporation and Google LLC are not far behind, with their extensive research and development in AI contributing to smarter, more adaptive conferencing technologies. Amazon Web Services, Inc., through its cloud infrastructure, is vital in providing the backbone for AI computations, enabling scalable, flexible conferencing solutions.
Market Key Players
- Zoom Video Communications Inc.
- MOSTLY AI Inc.
- Open AI
- Synthesis AI
- Genie AI Ltd.
- Adobe Inc.
- Microsoft Corporation Company Profile
- IBM Corporation
- Google LLC
- Amazon Web Services. Inc.
- Other
Recent Development
- In April 2024, Microsoft introduced innovative AI solutions for cybersecurity at the RSA Conference 2024, including Microsoft Copilot for Security. Sessions covered AI governance, threat intelligence, and cooperation for online rules. Partner awards celebrated security excellence.
- In March 2024, IBM collaborates with Anaconda to integrate enterprise-grade Generative AI into IBM Watson.ai™. Anaconda's open-source Python repository enhances AI development, offering curated access to key packages for data scientists.
- In March 2024, Nvidia Corp. unveiled Blackwell, its most potent GPU architecture, at GTC 2024. Positioned as a monolithic approach, it integrates training and inference, solidifying Nvidia's dominance in the AI industry.
Report Scope
Report Features Description Market Value (2023) USD 133.3 Million Forecast Revenue (2033) USD 697.5 Million CAGR (2024-2032) 18.5% Base Year for Estimation 2023 Historic Period 2016-2023 Forecast Period 2024-2033 Report Coverage Revenue Forecast, Market Dynamics, COVID-19 Impact, Competitive Landscape, Recent Developments Segments Covered By Component(Software, Services), By Deployment(Cloud-Based, On-Premise), (By End-Use Industry(Media & Entertainment, IT & Telecommunications, Healthcare, Automotive & Transportation, BFSI, Other End-Use Industries) Regional Analysis North America - The US, Canada, Rest of North America, Europe - Germany, France, The UK, Spain, Italy, Russia, Netherlands, Rest of Europe, Asia-Pacific - China, Japan, South Korea, India, New Zealand, Singapore, Thailand, Vietnam, Rest of Asia Pacific, Latin America - Brazil, Mexico, Rest of Latin America, Middle East & Africa - South Africa, Saudi Arabia, UAE, Rest of Middle East & Africa Competitive Landscape Zoom Video Communications Inc., MOSTLY AI Inc., Open AI, Synthesis AI, Genie AI Ltd., Adobe Inc., Microsoft Corporation Company Profile, IBM Corporation, Google LLC, Amazon Web Services. Inc., Other Customization Scope Customization for segments, region/country-level will be provided. Moreover, additional customization can be done based on the requirements. Purchase Options We have three licenses to opt for Single User License, Multi-User License (Up to 5 Users), Corporate Use License (Unlimited User and Printable PDF) -
- 1. Executive Summary
- 1.1. Definition
- 1.2. Taxonomy
- 1.3. Research Scope
- 1.4. Key Analysis
- 1.5. Key Findings by Major Segments
- 1.6. Top strategies by Major Players
- 2. Global Generative AI In Conference Market Overview
- 2.1. Generative AI In Conference Market Dynamics
- 2.1.1. Drivers
- 2.1.2. Opportunities
- 2.1.3. Restraints
- 2.1.4. Challenges
- 2.2. Macro-economic Factors
- 2.3. Regulatory Framework
- 2.4. Market Investment Feasibility Index
- 2.5. PEST Analysis
- 2.6. PORTER’S Five Force Analysis
- 2.7. Drivers & Restraints Impact Analysis
- 2.8. Industry Chain Analysis
- 2.9. Cost Structure Analysis
- 2.10. Marketing Strategy
- 2.11. Russia-Ukraine War Impact Analysis
- 2.12. Opportunity Map Analysis
- 2.13. Market Competition Scenario Analysis
- 2.14. Product Life Cycle Analysis
- 2.15. Opportunity Orbits
- 2.16. Manufacturer Intensity Map
- 2.17. Major Companies sales by Value & Volume
- 2.1. Generative AI In Conference Market Dynamics
- 3. Global Generative AI In Conference Market Analysis, Opportunity and Forecast, 2016-2032
- 3.1. Global Generative AI In Conference Market Analysis, 2016-2021
- 3.2. Global Generative AI In Conference Market Opportunity and Forecast, 2023-2032
- 3.3. Global Generative AI In Conference Market Analysis, Opportunity and Forecast, By By Component, 2016-2032
- 3.3.1. Global Generative AI In Conference Market Analysis by By Component: Introduction
- 3.3.2. Market Size Absolute $ Opportunity Analysis and Forecast, By By Component, 2016-2032
- 3.3.3. Software
- 3.3.4. Services
- 3.4. Global Generative AI In Conference Market Analysis, Opportunity and Forecast, By By Deployment, 2016-2032
- 3.4.1. Global Generative AI In Conference Market Analysis by By Deployment: Introduction
- 3.4.2. Market Size Absolute $ Opportunity Analysis and Forecast, By By Deployment, 2016-2032
- 3.4.3. Cloud-Based
- 3.4.4. On-Premise
- 3.5. Global Generative AI In Conference Market Analysis, Opportunity and Forecast, By By End-Use Industry, 2016-2032
- 3.5.1. Global Generative AI In Conference Market Analysis by By End-Use Industry: Introduction
- 3.5.2. Market Size Absolute $ Opportunity Analysis and Forecast, By By End-Use Industry, 2016-2032
- 3.5.3. Media & Entertainment
- 3.5.4. IT & Telecommunications
- 3.5.5. Healthcare
- 3.5.6. Automotive & Transportation
- 3.5.7. BFSI
- 3.5.8. Other End-Use Industries
- 4. North America Generative AI In Conference Market Analysis, Opportunity and Forecast, 2016-2032
- 4.1. North America Generative AI In Conference Market Analysis, 2016-2021
- 4.2. North America Generative AI In Conference Market Opportunity and Forecast, 2023-2032
- 4.3. North America Generative AI In Conference Market Analysis, Opportunity and Forecast, By By Component, 2016-2032
- 4.3.1. North America Generative AI In Conference Market Analysis by By Component: Introduction
- 4.3.2. Market Size Absolute $ Opportunity Analysis and Forecast, By By Component, 2016-2032
- 4.3.3. Software
- 4.3.4. Services
- 4.4. North America Generative AI In Conference Market Analysis, Opportunity and Forecast, By By Deployment, 2016-2032
- 4.4.1. North America Generative AI In Conference Market Analysis by By Deployment: Introduction
- 4.4.2. Market Size Absolute $ Opportunity Analysis and Forecast, By By Deployment, 2016-2032
- 4.4.3. Cloud-Based
- 4.4.4. On-Premise
- 4.5. North America Generative AI In Conference Market Analysis, Opportunity and Forecast, By By End-Use Industry, 2016-2032
- 4.5.1. North America Generative AI In Conference Market Analysis by By End-Use Industry: Introduction
- 4.5.2. Market Size Absolute $ Opportunity Analysis and Forecast, By By End-Use Industry, 2016-2032
- 4.5.3. Media & Entertainment
- 4.5.4. IT & Telecommunications
- 4.5.5. Healthcare
- 4.5.6. Automotive & Transportation
- 4.5.7. BFSI
- 4.5.8. Other End-Use Industries
- 4.6. North America Generative AI In Conference Market Analysis, Opportunity and Forecast, By Country , 2016-2032
- 4.6.1. North America Generative AI In Conference Market Analysis by Country : Introduction
- 4.6.2. Market Size Absolute $ Opportunity Analysis and Forecast, Country , 2016-2032
- 4.6.2.1. The US
- 4.6.2.2. Canada
- 4.6.2.3. Mexico
- 5. Western Europe Generative AI In Conference Market Analysis, Opportunity and Forecast, 2016-2032
- 5.1. Western Europe Generative AI In Conference Market Analysis, 2016-2021
- 5.2. Western Europe Generative AI In Conference Market Opportunity and Forecast, 2023-2032
- 5.3. Western Europe Generative AI In Conference Market Analysis, Opportunity and Forecast, By By Component, 2016-2032
- 5.3.1. Western Europe Generative AI In Conference Market Analysis by By Component: Introduction
- 5.3.2. Market Size Absolute $ Opportunity Analysis and Forecast, By By Component, 2016-2032
- 5.3.3. Software
- 5.3.4. Services
- 5.4. Western Europe Generative AI In Conference Market Analysis, Opportunity and Forecast, By By Deployment, 2016-2032
- 5.4.1. Western Europe Generative AI In Conference Market Analysis by By Deployment: Introduction
- 5.4.2. Market Size Absolute $ Opportunity Analysis and Forecast, By By Deployment, 2016-2032
- 5.4.3. Cloud-Based
- 5.4.4. On-Premise
- 5.5. Western Europe Generative AI In Conference Market Analysis, Opportunity and Forecast, By By End-Use Industry, 2016-2032
- 5.5.1. Western Europe Generative AI In Conference Market Analysis by By End-Use Industry: Introduction
- 5.5.2. Market Size Absolute $ Opportunity Analysis and Forecast, By By End-Use Industry, 2016-2032
- 5.5.3. Media & Entertainment
- 5.5.4. IT & Telecommunications
- 5.5.5. Healthcare
- 5.5.6. Automotive & Transportation
- 5.5.7. BFSI
- 5.5.8. Other End-Use Industries
- 5.6. Western Europe Generative AI In Conference Market Analysis, Opportunity and Forecast, By Country , 2016-2032
- 5.6.1. Western Europe Generative AI In Conference Market Analysis by Country : Introduction
- 5.6.2. Market Size Absolute $ Opportunity Analysis and Forecast, Country , 2016-2032
- 5.6.2.1. Germany
- 5.6.2.2. France
- 5.6.2.3. The UK
- 5.6.2.4. Spain
- 5.6.2.5. Italy
- 5.6.2.6. Portugal
- 5.6.2.7. Ireland
- 5.6.2.8. Austria
- 5.6.2.9. Switzerland
- 5.6.2.10. Benelux
- 5.6.2.11. Nordic
- 5.6.2.12. Rest of Western Europe
- 6. Eastern Europe Generative AI In Conference Market Analysis, Opportunity and Forecast, 2016-2032
- 6.1. Eastern Europe Generative AI In Conference Market Analysis, 2016-2021
- 6.2. Eastern Europe Generative AI In Conference Market Opportunity and Forecast, 2023-2032
- 6.3. Eastern Europe Generative AI In Conference Market Analysis, Opportunity and Forecast, By By Component, 2016-2032
- 6.3.1. Eastern Europe Generative AI In Conference Market Analysis by By Component: Introduction
- 6.3.2. Market Size Absolute $ Opportunity Analysis and Forecast, By By Component, 2016-2032
- 6.3.3. Software
- 6.3.4. Services
- 6.4. Eastern Europe Generative AI In Conference Market Analysis, Opportunity and Forecast, By By Deployment, 2016-2032
- 6.4.1. Eastern Europe Generative AI In Conference Market Analysis by By Deployment: Introduction
- 6.4.2. Market Size Absolute $ Opportunity Analysis and Forecast, By By Deployment, 2016-2032
- 6.4.3. Cloud-Based
- 6.4.4. On-Premise
- 6.5. Eastern Europe Generative AI In Conference Market Analysis, Opportunity and Forecast, By By End-Use Industry, 2016-2032
- 6.5.1. Eastern Europe Generative AI In Conference Market Analysis by By End-Use Industry: Introduction
- 6.5.2. Market Size Absolute $ Opportunity Analysis and Forecast, By By End-Use Industry, 2016-2032
- 6.5.3. Media & Entertainment
- 6.5.4. IT & Telecommunications
- 6.5.5. Healthcare
- 6.5.6. Automotive & Transportation
- 6.5.7. BFSI
- 6.5.8. Other End-Use Industries
- 6.6. Eastern Europe Generative AI In Conference Market Analysis, Opportunity and Forecast, By Country , 2016-2032
- 6.6.1. Eastern Europe Generative AI In Conference Market Analysis by Country : Introduction
- 6.6.2. Market Size Absolute $ Opportunity Analysis and Forecast, Country , 2016-2032
- 6.6.2.1. Russia
- 6.6.2.2. Poland
- 6.6.2.3. The Czech Republic
- 6.6.2.4. Greece
- 6.6.2.5. Rest of Eastern Europe
- 7. APAC Generative AI In Conference Market Analysis, Opportunity and Forecast, 2016-2032
- 7.1. APAC Generative AI In Conference Market Analysis, 2016-2021
- 7.2. APAC Generative AI In Conference Market Opportunity and Forecast, 2023-2032
- 7.3. APAC Generative AI In Conference Market Analysis, Opportunity and Forecast, By By Component, 2016-2032
- 7.3.1. APAC Generative AI In Conference Market Analysis by By Component: Introduction
- 7.3.2. Market Size Absolute $ Opportunity Analysis and Forecast, By By Component, 2016-2032
- 7.3.3. Software
- 7.3.4. Services
- 7.4. APAC Generative AI In Conference Market Analysis, Opportunity and Forecast, By By Deployment, 2016-2032
- 7.4.1. APAC Generative AI In Conference Market Analysis by By Deployment: Introduction
- 7.4.2. Market Size Absolute $ Opportunity Analysis and Forecast, By By Deployment, 2016-2032
- 7.4.3. Cloud-Based
- 7.4.4. On-Premise
- 7.5. APAC Generative AI In Conference Market Analysis, Opportunity and Forecast, By By End-Use Industry, 2016-2032
- 7.5.1. APAC Generative AI In Conference Market Analysis by By End-Use Industry: Introduction
- 7.5.2. Market Size Absolute $ Opportunity Analysis and Forecast, By By End-Use Industry, 2016-2032
- 7.5.3. Media & Entertainment
- 7.5.4. IT & Telecommunications
- 7.5.5. Healthcare
- 7.5.6. Automotive & Transportation
- 7.5.7. BFSI
- 7.5.8. Other End-Use Industries
- 7.6. APAC Generative AI In Conference Market Analysis, Opportunity and Forecast, By Country , 2016-2032
- 7.6.1. APAC Generative AI In Conference Market Analysis by Country : Introduction
- 7.6.2. Market Size Absolute $ Opportunity Analysis and Forecast, Country , 2016-2032
- 7.6.2.1. China
- 7.6.2.2. Japan
- 7.6.2.3. South Korea
- 7.6.2.4. India
- 7.6.2.5. Australia & New Zeland
- 7.6.2.6. Indonesia
- 7.6.2.7. Malaysia
- 7.6.2.8. Philippines
- 7.6.2.9. Singapore
- 7.6.2.10. Thailand
- 7.6.2.11. Vietnam
- 7.6.2.12. Rest of APAC
- 8. Latin America Generative AI In Conference Market Analysis, Opportunity and Forecast, 2016-2032
- 8.1. Latin America Generative AI In Conference Market Analysis, 2016-2021
- 8.2. Latin America Generative AI In Conference Market Opportunity and Forecast, 2023-2032
- 8.3. Latin America Generative AI In Conference Market Analysis, Opportunity and Forecast, By By Component, 2016-2032
- 8.3.1. Latin America Generative AI In Conference Market Analysis by By Component: Introduction
- 8.3.2. Market Size Absolute $ Opportunity Analysis and Forecast, By By Component, 2016-2032
- 8.3.3. Software
- 8.3.4. Services
- 8.4. Latin America Generative AI In Conference Market Analysis, Opportunity and Forecast, By By Deployment, 2016-2032
- 8.4.1. Latin America Generative AI In Conference Market Analysis by By Deployment: Introduction
- 8.4.2. Market Size Absolute $ Opportunity Analysis and Forecast, By By Deployment, 2016-2032
- 8.4.3. Cloud-Based
- 8.4.4. On-Premise
- 8.5. Latin America Generative AI In Conference Market Analysis, Opportunity and Forecast, By By End-Use Industry, 2016-2032
- 8.5.1. Latin America Generative AI In Conference Market Analysis by By End-Use Industry: Introduction
- 8.5.2. Market Size Absolute $ Opportunity Analysis and Forecast, By By End-Use Industry, 2016-2032
- 8.5.3. Media & Entertainment
- 8.5.4. IT & Telecommunications
- 8.5.5. Healthcare
- 8.5.6. Automotive & Transportation
- 8.5.7. BFSI
- 8.5.8. Other End-Use Industries
- 8.6. Latin America Generative AI In Conference Market Analysis, Opportunity and Forecast, By Country , 2016-2032
- 8.6.1. Latin America Generative AI In Conference Market Analysis by Country : Introduction
- 8.6.2. Market Size Absolute $ Opportunity Analysis and Forecast, Country , 2016-2032
- 8.6.2.1. Brazil
- 8.6.2.2. Colombia
- 8.6.2.3. Chile
- 8.6.2.4. Argentina
- 8.6.2.5. Costa Rica
- 8.6.2.6. Rest of Latin America
- 9. Middle East & Africa Generative AI In Conference Market Analysis, Opportunity and Forecast, 2016-2032
- 9.1. Middle East & Africa Generative AI In Conference Market Analysis, 2016-2021
- 9.2. Middle East & Africa Generative AI In Conference Market Opportunity and Forecast, 2023-2032
- 9.3. Middle East & Africa Generative AI In Conference Market Analysis, Opportunity and Forecast, By By Component, 2016-2032
- 9.3.1. Middle East & Africa Generative AI In Conference Market Analysis by By Component: Introduction
- 9.3.2. Market Size Absolute $ Opportunity Analysis and Forecast, By By Component, 2016-2032
- 9.3.3. Software
- 9.3.4. Services
- 9.4. Middle East & Africa Generative AI In Conference Market Analysis, Opportunity and Forecast, By By Deployment, 2016-2032
- 9.4.1. Middle East & Africa Generative AI In Conference Market Analysis by By Deployment: Introduction
- 9.4.2. Market Size Absolute $ Opportunity Analysis and Forecast, By By Deployment, 2016-2032
- 9.4.3. Cloud-Based
- 9.4.4. On-Premise
- 9.5. Middle East & Africa Generative AI In Conference Market Analysis, Opportunity and Forecast, By By End-Use Industry, 2016-2032
- 9.5.1. Middle East & Africa Generative AI In Conference Market Analysis by By End-Use Industry: Introduction
- 9.5.2. Market Size Absolute $ Opportunity Analysis and Forecast, By By End-Use Industry, 2016-2032
- 9.5.3. Media & Entertainment
- 9.5.4. IT & Telecommunications
- 9.5.5. Healthcare
- 9.5.6. Automotive & Transportation
- 9.5.7. BFSI
- 9.5.8. Other End-Use Industries
- 9.6. Middle East & Africa Generative AI In Conference Market Analysis, Opportunity and Forecast, By Country , 2016-2032
- 9.6.1. Middle East & Africa Generative AI In Conference Market Analysis by Country : Introduction
- 9.6.2. Market Size Absolute $ Opportunity Analysis and Forecast, Country , 2016-2032
- 9.6.2.1. Algeria
- 9.6.2.2. Egypt
- 9.6.2.3. Israel
- 9.6.2.4. Kuwait
- 9.6.2.5. Nigeria
- 9.6.2.6. Saudi Arabia
- 9.6.2.7. South Africa
- 9.6.2.8. Turkey
- 9.6.2.9. The UAE
- 9.6.2.10. Rest of MEA
- 10. Global Generative AI In Conference Market Analysis, Opportunity and Forecast, By Region , 2016-2032
- 10.1. Global Generative AI In Conference Market Analysis by Region : Introduction
- 10.2. Market Size Absolute $ Opportunity Analysis and Forecast, By Region , 2016-2032
- 10.2.1. North America
- 10.2.2. Western Europe
- 10.2.3. Eastern Europe
- 10.2.4. APAC
- 10.2.5. Latin America
- 10.2.6. Middle East & Africa
- 11. Global Generative AI In Conference Market Competitive Landscape, Market Share Analysis, and Company Profiles
- 11.1. Market Share Analysis
- 11.2. Company Profiles
- 11.3. Zoom Video Communications Inc.
- 11.3.1. Company Overview
- 11.3.2. Financial Highlights
- 11.3.3. Product Portfolio
- 11.3.4. SWOT Analysis
- 11.3.5. Key Strategies and Developments
- 11.4. MOSTLY AI Inc.
- 11.4.1. Company Overview
- 11.4.2. Financial Highlights
- 11.4.3. Product Portfolio
- 11.4.4. SWOT Analysis
- 11.4.5. Key Strategies and Developments
- 11.5. Open AI
- 11.5.1. Company Overview
- 11.5.2. Financial Highlights
- 11.5.3. Product Portfolio
- 11.5.4. SWOT Analysis
- 11.5.5. Key Strategies and Developments
- 11.6. Synthesis AI
- 11.6.1. Company Overview
- 11.6.2. Financial Highlights
- 11.6.3. Product Portfolio
- 11.6.4. SWOT Analysis
- 11.6.5. Key Strategies and Developments
- 11.7. Genie AI Ltd.
- 11.7.1. Company Overview
- 11.7.2. Financial Highlights
- 11.7.3. Product Portfolio
- 11.7.4. SWOT Analysis
- 11.7.5. Key Strategies and Developments
- 11.8. Adobe Inc.
- 11.8.1. Company Overview
- 11.8.2. Financial Highlights
- 11.8.3. Product Portfolio
- 11.8.4. SWOT Analysis
- 11.8.5. Key Strategies and Developments
- 11.9. Microsoft Corporation Company Profile
- 11.9.1. Company Overview
- 11.9.2. Financial Highlights
- 11.9.3. Product Portfolio
- 11.9.4. SWOT Analysis
- 11.9.5. Key Strategies and Developments
- 11.10. IBM Corporation
- 11.10.1. Company Overview
- 11.10.2. Financial Highlights
- 11.10.3. Product Portfolio
- 11.10.4. SWOT Analysis
- 11.10.5. Key Strategies and Developments
- 11.11. Google LLC
- 11.11.1. Company Overview
- 11.11.2. Financial Highlights
- 11.11.3. Product Portfolio
- 11.11.4. SWOT Analysis
- 11.11.5. Key Strategies and Developments
- 11.12. Amazon Web Services. Inc.
- 11.12.1. Company Overview
- 11.12.2. Financial Highlights
- 11.12.3. Product Portfolio
- 11.12.4. SWOT Analysis
- 11.12.5. Key Strategies and Developments
- 11.13. Other
- 11.13.1. Company Overview
- 11.13.2. Financial Highlights
- 11.13.3. Product Portfolio
- 11.13.4. SWOT Analysis
- 11.13.5. Key Strategies and Developments
- 12. Assumptions and Acronyms
- 13. Research Methodology
- 14. Contact
- List of Figures
- Figure 1: Global Generative AI In Conference Market Revenue (US$ Mn) Market Share by By Component in 2022
- Figure 2: Global Generative AI In Conference Market Attractiveness Analysis by By Component, 2016-2032
- Figure 3: Global Generative AI In Conference Market Revenue (US$ Mn) Market Share by By Deploymentin 2022
- Figure 4: Global Generative AI In Conference Market Attractiveness Analysis by By Deployment, 2016-2032
- Figure 5: Global Generative AI In Conference Market Revenue (US$ Mn) Market Share by By End-Use Industryin 2022
- Figure 6: Global Generative AI In Conference Market Attractiveness Analysis by By End-Use Industry, 2016-2032
- Figure 7: Global Generative AI In Conference Market Revenue (US$ Mn) Market Share by Region in 2022
- Figure 8: Global Generative AI In Conference Market Attractiveness Analysis by Region, 2016-2032
- Figure 9: Global Generative AI In Conference Market Revenue (US$ Mn) (2016-2032)
- Figure 10: Global Generative AI In Conference Market Revenue (US$ Mn) Comparison by Region (2016-2032)
- Figure 11: Global Generative AI In Conference Market Revenue (US$ Mn) Comparison by By Component (2016-2032)
- Figure 12: Global Generative AI In Conference Market Revenue (US$ Mn) Comparison by By Deployment (2016-2032)
- Figure 13: Global Generative AI In Conference Market Revenue (US$ Mn) Comparison by By End-Use Industry (2016-2032)
- Figure 14: Global Generative AI In Conference Market Y-o-Y Growth Rate Comparison by Region (2016-2032)
- Figure 15: Global Generative AI In Conference Market Y-o-Y Growth Rate Comparison by By Component (2016-2032)
- Figure 16: Global Generative AI In Conference Market Y-o-Y Growth Rate Comparison by By Deployment (2016-2032)
- Figure 17: Global Generative AI In Conference Market Y-o-Y Growth Rate Comparison by By End-Use Industry (2016-2032)
- Figure 18: Global Generative AI In Conference Market Share Comparison by Region (2016-2032)
- Figure 19: Global Generative AI In Conference Market Share Comparison by By Component (2016-2032)
- Figure 20: Global Generative AI In Conference Market Share Comparison by By Deployment (2016-2032)
- Figure 21: Global Generative AI In Conference Market Share Comparison by By End-Use Industry (2016-2032)
- Figure 22: North America Generative AI In Conference Market Revenue (US$ Mn) Market Share by By Componentin 2022
- Figure 23: North America Generative AI In Conference Market Attractiveness Analysis by By Component, 2016-2032
- Figure 24: North America Generative AI In Conference Market Revenue (US$ Mn) Market Share by By Deploymentin 2022
- Figure 25: North America Generative AI In Conference Market Attractiveness Analysis by By Deployment, 2016-2032
- Figure 26: North America Generative AI In Conference Market Revenue (US$ Mn) Market Share by By End-Use Industryin 2022
- Figure 27: North America Generative AI In Conference Market Attractiveness Analysis by By End-Use Industry, 2016-2032
- Figure 28: North America Generative AI In Conference Market Revenue (US$ Mn) Market Share by Country in 2022
- Figure 29: North America Generative AI In Conference Market Attractiveness Analysis by Country, 2016-2032
- Figure 30: North America Generative AI In Conference Market Revenue (US$ Mn) (2016-2032)
- Figure 31: North America Generative AI In Conference Market Revenue (US$ Mn) Comparison by Country (2016-2032)
- Figure 32: North America Generative AI In Conference Market Revenue (US$ Mn) Comparison by By Component (2016-2032)
- Figure 33: North America Generative AI In Conference Market Revenue (US$ Mn) Comparison by By Deployment (2016-2032)
- Figure 34: North America Generative AI In Conference Market Revenue (US$ Mn) Comparison by By End-Use Industry (2016-2032)
- Figure 35: North America Generative AI In Conference Market Y-o-Y Growth Rate Comparison by Country (2016-2032)
- Figure 36: North America Generative AI In Conference Market Y-o-Y Growth Rate Comparison by By Component (2016-2032)
- Figure 37: North America Generative AI In Conference Market Y-o-Y Growth Rate Comparison by By Deployment (2016-2032)
- Figure 38: North America Generative AI In Conference Market Y-o-Y Growth Rate Comparison by By End-Use Industry (2016-2032)
- Figure 39: North America Generative AI In Conference Market Share Comparison by Country (2016-2032)
- Figure 40: North America Generative AI In Conference Market Share Comparison by By Component (2016-2032)
- Figure 41: North America Generative AI In Conference Market Share Comparison by By Deployment (2016-2032)
- Figure 42: North America Generative AI In Conference Market Share Comparison by By End-Use Industry (2016-2032)
- Figure 43: Western Europe Generative AI In Conference Market Revenue (US$ Mn) Market Share by By Componentin 2022
- Figure 44: Western Europe Generative AI In Conference Market Attractiveness Analysis by By Component, 2016-2032
- Figure 45: Western Europe Generative AI In Conference Market Revenue (US$ Mn) Market Share by By Deploymentin 2022
- Figure 46: Western Europe Generative AI In Conference Market Attractiveness Analysis by By Deployment, 2016-2032
- Figure 47: Western Europe Generative AI In Conference Market Revenue (US$ Mn) Market Share by By End-Use Industryin 2022
- Figure 48: Western Europe Generative AI In Conference Market Attractiveness Analysis by By End-Use Industry, 2016-2032
- Figure 49: Western Europe Generative AI In Conference Market Revenue (US$ Mn) Market Share by Country in 2022
- Figure 50: Western Europe Generative AI In Conference Market Attractiveness Analysis by Country, 2016-2032
- Figure 51: Western Europe Generative AI In Conference Market Revenue (US$ Mn) (2016-2032)
- Figure 52: Western Europe Generative AI In Conference Market Revenue (US$ Mn) Comparison by Country (2016-2032)
- Figure 53: Western Europe Generative AI In Conference Market Revenue (US$ Mn) Comparison by By Component (2016-2032)
- Figure 54: Western Europe Generative AI In Conference Market Revenue (US$ Mn) Comparison by By Deployment (2016-2032)
- Figure 55: Western Europe Generative AI In Conference Market Revenue (US$ Mn) Comparison by By End-Use Industry (2016-2032)
- Figure 56: Western Europe Generative AI In Conference Market Y-o-Y Growth Rate Comparison by Country (2016-2032)
- Figure 57: Western Europe Generative AI In Conference Market Y-o-Y Growth Rate Comparison by By Component (2016-2032)
- Figure 58: Western Europe Generative AI In Conference Market Y-o-Y Growth Rate Comparison by By Deployment (2016-2032)
- Figure 59: Western Europe Generative AI In Conference Market Y-o-Y Growth Rate Comparison by By End-Use Industry (2016-2032)
- Figure 60: Western Europe Generative AI In Conference Market Share Comparison by Country (2016-2032)
- Figure 61: Western Europe Generative AI In Conference Market Share Comparison by By Component (2016-2032)
- Figure 62: Western Europe Generative AI In Conference Market Share Comparison by By Deployment (2016-2032)
- Figure 63: Western Europe Generative AI In Conference Market Share Comparison by By End-Use Industry (2016-2032)
- Figure 64: Eastern Europe Generative AI In Conference Market Revenue (US$ Mn) Market Share by By Componentin 2022
- Figure 65: Eastern Europe Generative AI In Conference Market Attractiveness Analysis by By Component, 2016-2032
- Figure 66: Eastern Europe Generative AI In Conference Market Revenue (US$ Mn) Market Share by By Deploymentin 2022
- Figure 67: Eastern Europe Generative AI In Conference Market Attractiveness Analysis by By Deployment, 2016-2032
- Figure 68: Eastern Europe Generative AI In Conference Market Revenue (US$ Mn) Market Share by By End-Use Industryin 2022
- Figure 69: Eastern Europe Generative AI In Conference Market Attractiveness Analysis by By End-Use Industry, 2016-2032
- Figure 70: Eastern Europe Generative AI In Conference Market Revenue (US$ Mn) Market Share by Country in 2022
- Figure 71: Eastern Europe Generative AI In Conference Market Attractiveness Analysis by Country, 2016-2032
- Figure 72: Eastern Europe Generative AI In Conference Market Revenue (US$ Mn) (2016-2032)
- Figure 73: Eastern Europe Generative AI In Conference Market Revenue (US$ Mn) Comparison by Country (2016-2032)
- Figure 74: Eastern Europe Generative AI In Conference Market Revenue (US$ Mn) Comparison by By Component (2016-2032)
- Figure 75: Eastern Europe Generative AI In Conference Market Revenue (US$ Mn) Comparison by By Deployment (2016-2032)
- Figure 76: Eastern Europe Generative AI In Conference Market Revenue (US$ Mn) Comparison by By End-Use Industry (2016-2032)
- Figure 77: Eastern Europe Generative AI In Conference Market Y-o-Y Growth Rate Comparison by Country (2016-2032)
- Figure 78: Eastern Europe Generative AI In Conference Market Y-o-Y Growth Rate Comparison by By Component (2016-2032)
- Figure 79: Eastern Europe Generative AI In Conference Market Y-o-Y Growth Rate Comparison by By Deployment (2016-2032)
- Figure 80: Eastern Europe Generative AI In Conference Market Y-o-Y Growth Rate Comparison by By End-Use Industry (2016-2032)
- Figure 81: Eastern Europe Generative AI In Conference Market Share Comparison by Country (2016-2032)
- Figure 82: Eastern Europe Generative AI In Conference Market Share Comparison by By Component (2016-2032)
- Figure 83: Eastern Europe Generative AI In Conference Market Share Comparison by By Deployment (2016-2032)
- Figure 84: Eastern Europe Generative AI In Conference Market Share Comparison by By End-Use Industry (2016-2032)
- Figure 85: APAC Generative AI In Conference Market Revenue (US$ Mn) Market Share by By Componentin 2022
- Figure 86: APAC Generative AI In Conference Market Attractiveness Analysis by By Component, 2016-2032
- Figure 87: APAC Generative AI In Conference Market Revenue (US$ Mn) Market Share by By Deploymentin 2022
- Figure 88: APAC Generative AI In Conference Market Attractiveness Analysis by By Deployment, 2016-2032
- Figure 89: APAC Generative AI In Conference Market Revenue (US$ Mn) Market Share by By End-Use Industryin 2022
- Figure 90: APAC Generative AI In Conference Market Attractiveness Analysis by By End-Use Industry, 2016-2032
- Figure 91: APAC Generative AI In Conference Market Revenue (US$ Mn) Market Share by Country in 2022
- Figure 92: APAC Generative AI In Conference Market Attractiveness Analysis by Country, 2016-2032
- Figure 93: APAC Generative AI In Conference Market Revenue (US$ Mn) (2016-2032)
- Figure 94: APAC Generative AI In Conference Market Revenue (US$ Mn) Comparison by Country (2016-2032)
- Figure 95: APAC Generative AI In Conference Market Revenue (US$ Mn) Comparison by By Component (2016-2032)
- Figure 96: APAC Generative AI In Conference Market Revenue (US$ Mn) Comparison by By Deployment (2016-2032)
- Figure 97: APAC Generative AI In Conference Market Revenue (US$ Mn) Comparison by By End-Use Industry (2016-2032)
- Figure 98: APAC Generative AI In Conference Market Y-o-Y Growth Rate Comparison by Country (2016-2032)
- Figure 99: APAC Generative AI In Conference Market Y-o-Y Growth Rate Comparison by By Component (2016-2032)
- Figure 100: APAC Generative AI In Conference Market Y-o-Y Growth Rate Comparison by By Deployment (2016-2032)
- Figure 101: APAC Generative AI In Conference Market Y-o-Y Growth Rate Comparison by By End-Use Industry (2016-2032)
- Figure 102: APAC Generative AI In Conference Market Share Comparison by Country (2016-2032)
- Figure 103: APAC Generative AI In Conference Market Share Comparison by By Component (2016-2032)
- Figure 104: APAC Generative AI In Conference Market Share Comparison by By Deployment (2016-2032)
- Figure 105: APAC Generative AI In Conference Market Share Comparison by By End-Use Industry (2016-2032)
- Figure 106: Latin America Generative AI In Conference Market Revenue (US$ Mn) Market Share by By Componentin 2022
- Figure 107: Latin America Generative AI In Conference Market Attractiveness Analysis by By Component, 2016-2032
- Figure 108: Latin America Generative AI In Conference Market Revenue (US$ Mn) Market Share by By Deploymentin 2022
- Figure 109: Latin America Generative AI In Conference Market Attractiveness Analysis by By Deployment, 2016-2032
- Figure 110: Latin America Generative AI In Conference Market Revenue (US$ Mn) Market Share by By End-Use Industryin 2022
- Figure 111: Latin America Generative AI In Conference Market Attractiveness Analysis by By End-Use Industry, 2016-2032
- Figure 112: Latin America Generative AI In Conference Market Revenue (US$ Mn) Market Share by Country in 2022
- Figure 113: Latin America Generative AI In Conference Market Attractiveness Analysis by Country, 2016-2032
- Figure 114: Latin America Generative AI In Conference Market Revenue (US$ Mn) (2016-2032)
- Figure 115: Latin America Generative AI In Conference Market Revenue (US$ Mn) Comparison by Country (2016-2032)
- Figure 116: Latin America Generative AI In Conference Market Revenue (US$ Mn) Comparison by By Component (2016-2032)
- Figure 117: Latin America Generative AI In Conference Market Revenue (US$ Mn) Comparison by By Deployment (2016-2032)
- Figure 118: Latin America Generative AI In Conference Market Revenue (US$ Mn) Comparison by By End-Use Industry (2016-2032)
- Figure 119: Latin America Generative AI In Conference Market Y-o-Y Growth Rate Comparison by Country (2016-2032)
- Figure 120: Latin America Generative AI In Conference Market Y-o-Y Growth Rate Comparison by By Component (2016-2032)
- Figure 121: Latin America Generative AI In Conference Market Y-o-Y Growth Rate Comparison by By Deployment (2016-2032)
- Figure 122: Latin America Generative AI In Conference Market Y-o-Y Growth Rate Comparison by By End-Use Industry (2016-2032)
- Figure 123: Latin America Generative AI In Conference Market Share Comparison by Country (2016-2032)
- Figure 124: Latin America Generative AI In Conference Market Share Comparison by By Component (2016-2032)
- Figure 125: Latin America Generative AI In Conference Market Share Comparison by By Deployment (2016-2032)
- Figure 126: Latin America Generative AI In Conference Market Share Comparison by By End-Use Industry (2016-2032)
- Figure 127: Middle East & Africa Generative AI In Conference Market Revenue (US$ Mn) Market Share by By Componentin 2022
- Figure 128: Middle East & Africa Generative AI In Conference Market Attractiveness Analysis by By Component, 2016-2032
- Figure 129: Middle East & Africa Generative AI In Conference Market Revenue (US$ Mn) Market Share by By Deploymentin 2022
- Figure 130: Middle East & Africa Generative AI In Conference Market Attractiveness Analysis by By Deployment, 2016-2032
- Figure 131: Middle East & Africa Generative AI In Conference Market Revenue (US$ Mn) Market Share by By End-Use Industryin 2022
- Figure 132: Middle East & Africa Generative AI In Conference Market Attractiveness Analysis by By End-Use Industry, 2016-2032
- Figure 133: Middle East & Africa Generative AI In Conference Market Revenue (US$ Mn) Market Share by Country in 2022
- Figure 134: Middle East & Africa Generative AI In Conference Market Attractiveness Analysis by Country, 2016-2032
- Figure 135: Middle East & Africa Generative AI In Conference Market Revenue (US$ Mn) (2016-2032)
- Figure 136: Middle East & Africa Generative AI In Conference Market Revenue (US$ Mn) Comparison by Country (2016-2032)
- Figure 137: Middle East & Africa Generative AI In Conference Market Revenue (US$ Mn) Comparison by By Component (2016-2032)
- Figure 138: Middle East & Africa Generative AI In Conference Market Revenue (US$ Mn) Comparison by By Deployment (2016-2032)
- Figure 139: Middle East & Africa Generative AI In Conference Market Revenue (US$ Mn) Comparison by By End-Use Industry (2016-2032)
- Figure 140: Middle East & Africa Generative AI In Conference Market Y-o-Y Growth Rate Comparison by Country (2016-2032)
- Figure 141: Middle East & Africa Generative AI In Conference Market Y-o-Y Growth Rate Comparison by By Component (2016-2032)
- Figure 142: Middle East & Africa Generative AI In Conference Market Y-o-Y Growth Rate Comparison by By Deployment (2016-2032)
- Figure 143: Middle East & Africa Generative AI In Conference Market Y-o-Y Growth Rate Comparison by By End-Use Industry (2016-2032)
- Figure 144: Middle East & Africa Generative AI In Conference Market Share Comparison by Country (2016-2032)
- Figure 145: Middle East & Africa Generative AI In Conference Market Share Comparison by By Component (2016-2032)
- Figure 146: Middle East & Africa Generative AI In Conference Market Share Comparison by By Deployment (2016-2032)
- Figure 147: Middle East & Africa Generative AI In Conference Market Share Comparison by By End-Use Industry (2016-2032)
- List of Tables
- Table 1: Global Generative AI In Conference Market Comparison by By Component (2016-2032)
- Table 2: Global Generative AI In Conference Market Comparison by By Deployment (2016-2032)
- Table 3: Global Generative AI In Conference Market Comparison by By End-Use Industry (2016-2032)
- Table 4: Global Generative AI In Conference Market Revenue (US$ Mn) Comparison by Region (2016-2032)
- Table 5: Global Generative AI In Conference Market Revenue (US$ Mn) (2016-2032)
- Table 6: Global Generative AI In Conference Market Revenue (US$ Mn) Comparison by Region (2016-2032)
- Table 7: Global Generative AI In Conference Market Revenue (US$ Mn) Comparison by By Component (2016-2032)
- Table 8: Global Generative AI In Conference Market Revenue (US$ Mn) Comparison by By Deployment (2016-2032)
- Table 9: Global Generative AI In Conference Market Revenue (US$ Mn) Comparison by By End-Use Industry (2016-2032)
- Table 10: Global Generative AI In Conference Market Y-o-Y Growth Rate Comparison by Region (2016-2032)
- Table 11: Global Generative AI In Conference Market Y-o-Y Growth Rate Comparison by By Component (2016-2032)
- Table 12: Global Generative AI In Conference Market Y-o-Y Growth Rate Comparison by By Deployment (2016-2032)
- Table 13: Global Generative AI In Conference Market Y-o-Y Growth Rate Comparison by By End-Use Industry (2016-2032)
- Table 14: Global Generative AI In Conference Market Share Comparison by Region (2016-2032)
- Table 15: Global Generative AI In Conference Market Share Comparison by By Component (2016-2032)
- Table 16: Global Generative AI In Conference Market Share Comparison by By Deployment (2016-2032)
- Table 17: Global Generative AI In Conference Market Share Comparison by By End-Use Industry (2016-2032)
- Table 18: North America Generative AI In Conference Market Comparison by By Deployment (2016-2032)
- Table 19: North America Generative AI In Conference Market Comparison by By End-Use Industry (2016-2032)
- Table 20: North America Generative AI In Conference Market Revenue (US$ Mn) Comparison by Country (2016-2032)
- Table 21: North America Generative AI In Conference Market Revenue (US$ Mn) (2016-2032)
- Table 22: North America Generative AI In Conference Market Revenue (US$ Mn) Comparison by Country (2016-2032)
- Table 23: North America Generative AI In Conference Market Revenue (US$ Mn) Comparison by By Component (2016-2032)
- Table 24: North America Generative AI In Conference Market Revenue (US$ Mn) Comparison by By Deployment (2016-2032)
- Table 25: North America Generative AI In Conference Market Revenue (US$ Mn) Comparison by By End-Use Industry (2016-2032)
- Table 26: North America Generative AI In Conference Market Y-o-Y Growth Rate Comparison by Country (2016-2032)
- Table 27: North America Generative AI In Conference Market Y-o-Y Growth Rate Comparison by By Component (2016-2032)
- Table 28: North America Generative AI In Conference Market Y-o-Y Growth Rate Comparison by By Deployment (2016-2032)
- Table 29: North America Generative AI In Conference Market Y-o-Y Growth Rate Comparison by By End-Use Industry (2016-2032)
- Table 30: North America Generative AI In Conference Market Share Comparison by Country (2016-2032)
- Table 31: North America Generative AI In Conference Market Share Comparison by By Component (2016-2032)
- Table 32: North America Generative AI In Conference Market Share Comparison by By Deployment (2016-2032)
- Table 33: North America Generative AI In Conference Market Share Comparison by By End-Use Industry (2016-2032)
- Table 34: Western Europe Generative AI In Conference Market Comparison by By Component (2016-2032)
- Table 35: Western Europe Generative AI In Conference Market Comparison by By Deployment (2016-2032)
- Table 36: Western Europe Generative AI In Conference Market Comparison by By End-Use Industry (2016-2032)
- Table 37: Western Europe Generative AI In Conference Market Revenue (US$ Mn) Comparison by Country (2016-2032)
- Table 38: Western Europe Generative AI In Conference Market Revenue (US$ Mn) (2016-2032)
- Table 39: Western Europe Generative AI In Conference Market Revenue (US$ Mn) Comparison by Country (2016-2032)
- Table 40: Western Europe Generative AI In Conference Market Revenue (US$ Mn) Comparison by By Component (2016-2032)
- Table 41: Western Europe Generative AI In Conference Market Revenue (US$ Mn) Comparison by By Deployment (2016-2032)
- Table 42: Western Europe Generative AI In Conference Market Revenue (US$ Mn) Comparison by By End-Use Industry (2016-2032)
- Table 43: Western Europe Generative AI In Conference Market Y-o-Y Growth Rate Comparison by Country (2016-2032)
- Table 44: Western Europe Generative AI In Conference Market Y-o-Y Growth Rate Comparison by By Component (2016-2032)
- Table 45: Western Europe Generative AI In Conference Market Y-o-Y Growth Rate Comparison by By Deployment (2016-2032)
- Table 46: Western Europe Generative AI In Conference Market Y-o-Y Growth Rate Comparison by By End-Use Industry (2016-2032)
- Table 47: Western Europe Generative AI In Conference Market Share Comparison by Country (2016-2032)
- Table 48: Western Europe Generative AI In Conference Market Share Comparison by By Component (2016-2032)
- Table 49: Western Europe Generative AI In Conference Market Share Comparison by By Deployment (2016-2032)
- Table 50: Western Europe Generative AI In Conference Market Share Comparison by By End-Use Industry (2016-2032)
- Table 51: Eastern Europe Generative AI In Conference Market Comparison by By Component (2016-2032)
- Table 52: Eastern Europe Generative AI In Conference Market Comparison by By Deployment (2016-2032)
- Table 53: Eastern Europe Generative AI In Conference Market Comparison by By End-Use Industry (2016-2032)
- Table 54: Eastern Europe Generative AI In Conference Market Revenue (US$ Mn) Comparison by Country (2016-2032)
- Table 55: Eastern Europe Generative AI In Conference Market Revenue (US$ Mn) (2016-2032)
- Table 56: Eastern Europe Generative AI In Conference Market Revenue (US$ Mn) Comparison by Country (2016-2032)
- Table 57: Eastern Europe Generative AI In Conference Market Revenue (US$ Mn) Comparison by By Component (2016-2032)
- Table 58: Eastern Europe Generative AI In Conference Market Revenue (US$ Mn) Comparison by By Deployment (2016-2032)
- Table 59: Eastern Europe Generative AI In Conference Market Revenue (US$ Mn) Comparison by By End-Use Industry (2016-2032)
- Table 60: Eastern Europe Generative AI In Conference Market Y-o-Y Growth Rate Comparison by Country (2016-2032)
- Table 61: Eastern Europe Generative AI In Conference Market Y-o-Y Growth Rate Comparison by By Component (2016-2032)
- Table 62: Eastern Europe Generative AI In Conference Market Y-o-Y Growth Rate Comparison by By Deployment (2016-2032)
- Table 63: Eastern Europe Generative AI In Conference Market Y-o-Y Growth Rate Comparison by By End-Use Industry (2016-2032)
- Table 64: Eastern Europe Generative AI In Conference Market Share Comparison by Country (2016-2032)
- Table 65: Eastern Europe Generative AI In Conference Market Share Comparison by By Component (2016-2032)
- Table 66: Eastern Europe Generative AI In Conference Market Share Comparison by By Deployment (2016-2032)
- Table 67: Eastern Europe Generative AI In Conference Market Share Comparison by By End-Use Industry (2016-2032)
- Table 68: APAC Generative AI In Conference Market Comparison by By Component (2016-2032)
- Table 69: APAC Generative AI In Conference Market Comparison by By Deployment (2016-2032)
- Table 70: APAC Generative AI In Conference Market Comparison by By End-Use Industry (2016-2032)
- Table 71: APAC Generative AI In Conference Market Revenue (US$ Mn) Comparison by Country (2016-2032)
- Table 72: APAC Generative AI In Conference Market Revenue (US$ Mn) (2016-2032)
- Table 73: APAC Generative AI In Conference Market Revenue (US$ Mn) Comparison by Country (2016-2032)
- Table 74: APAC Generative AI In Conference Market Revenue (US$ Mn) Comparison by By Component (2016-2032)
- Table 75: APAC Generative AI In Conference Market Revenue (US$ Mn) Comparison by By Deployment (2016-2032)
- Table 76: APAC Generative AI In Conference Market Revenue (US$ Mn) Comparison by By End-Use Industry (2016-2032)
- Table 77: APAC Generative AI In Conference Market Y-o-Y Growth Rate Comparison by Country (2016-2032)
- Table 78: APAC Generative AI In Conference Market Y-o-Y Growth Rate Comparison by By Component (2016-2032)
- Table 79: APAC Generative AI In Conference Market Y-o-Y Growth Rate Comparison by By Deployment (2016-2032)
- Table 80: APAC Generative AI In Conference Market Y-o-Y Growth Rate Comparison by By End-Use Industry (2016-2032)
- Table 81: APAC Generative AI In Conference Market Share Comparison by Country (2016-2032)
- Table 82: APAC Generative AI In Conference Market Share Comparison by By Component (2016-2032)
- Table 83: APAC Generative AI In Conference Market Share Comparison by By Deployment (2016-2032)
- Table 84: APAC Generative AI In Conference Market Share Comparison by By End-Use Industry (2016-2032)
- Table 85: Latin America Generative AI In Conference Market Comparison by By Component (2016-2032)
- Table 86: Latin America Generative AI In Conference Market Comparison by By Deployment (2016-2032)
- Table 87: Latin America Generative AI In Conference Market Comparison by By End-Use Industry (2016-2032)
- Table 88: Latin America Generative AI In Conference Market Revenue (US$ Mn) Comparison by Country (2016-2032)
- Table 89: Latin America Generative AI In Conference Market Revenue (US$ Mn) (2016-2032)
- Table 90: Latin America Generative AI In Conference Market Revenue (US$ Mn) Comparison by Country (2016-2032)
- Table 91: Latin America Generative AI In Conference Market Revenue (US$ Mn) Comparison by By Component (2016-2032)
- Table 92: Latin America Generative AI In Conference Market Revenue (US$ Mn) Comparison by By Deployment (2016-2032)
- Table 93: Latin America Generative AI In Conference Market Revenue (US$ Mn) Comparison by By End-Use Industry (2016-2032)
- Table 94: Latin America Generative AI In Conference Market Y-o-Y Growth Rate Comparison by Country (2016-2032)
- Table 95: Latin America Generative AI In Conference Market Y-o-Y Growth Rate Comparison by By Component (2016-2032)
- Table 96: Latin America Generative AI In Conference Market Y-o-Y Growth Rate Comparison by By Deployment (2016-2032)
- Table 97: Latin America Generative AI In Conference Market Y-o-Y Growth Rate Comparison by By End-Use Industry (2016-2032)
- Table 98: Latin America Generative AI In Conference Market Share Comparison by Country (2016-2032)
- Table 99: Latin America Generative AI In Conference Market Share Comparison by By Component (2016-2032)
- Table 100: Latin America Generative AI In Conference Market Share Comparison by By Deployment (2016-2032)
- Table 101: Latin America Generative AI In Conference Market Share Comparison by By End-Use Industry (2016-2032)
- Table 102: Middle East & Africa Generative AI In Conference Market Comparison by By Component (2016-2032)
- Table 103: Middle East & Africa Generative AI In Conference Market Comparison by By Deployment (2016-2032)
- Table 104: Middle East & Africa Generative AI In Conference Market Comparison by By End-Use Industry (2016-2032)
- Table 105: Middle East & Africa Generative AI In Conference Market Revenue (US$ Mn) Comparison by Country (2016-2032)
- Table 106: Middle East & Africa Generative AI In Conference Market Revenue (US$ Mn) (2016-2032)
- Table 107: Middle East & Africa Generative AI In Conference Market Revenue (US$ Mn) Comparison by Country (2016-2032)
- Table 108: Middle East & Africa Generative AI In Conference Market Revenue (US$ Mn) Comparison by By Component (2016-2032)
- Table 109: Middle East & Africa Generative AI In Conference Market Revenue (US$ Mn) Comparison by By Deployment (2016-2032)
- Table 110: Middle East & Africa Generative AI In Conference Market Revenue (US$ Mn) Comparison by By End-Use Industry (2016-2032)
- Table 111: Middle East & Africa Generative AI In Conference Market Y-o-Y Growth Rate Comparison by Country (2016-2032)
- Table 112: Middle East & Africa Generative AI In Conference Market Y-o-Y Growth Rate Comparison by By Component (2016-2032)
- Table 113: Middle East & Africa Generative AI In Conference Market Y-o-Y Growth Rate Comparison by By Deployment (2016-2032)
- Table 114: Middle East & Africa Generative AI In Conference Market Y-o-Y Growth Rate Comparison by By End-Use Industry (2016-2032)
- Table 115: Middle East & Africa Generative AI In Conference Market Share Comparison by Country (2016-2032)
- Table 116: Middle East & Africa Generative AI In Conference Market Share Comparison by By Component (2016-2032)
- Table 117: Middle East & Africa Generative AI In Conference Market Share Comparison by By Deployment (2016-2032)
- Table 118: Middle East & Africa Generative AI In Conference Market Share Comparison by By End-Use Industry (2016-2032)
- 1. Executive Summary
-
- Zoom Video Communications Inc.
- MOSTLY AI Inc.
- Open AI
- Synthesis AI
- Genie AI Ltd.
- Adobe Inc.
- Microsoft Corporation Company Profile
- IBM Corporation
- Google LLC
- Amazon Web Services. Inc.
- Other
Our Clients


View Our Licence Options
