Global Frozen Pizza Market By TypeBy Type(Non-vegetarian Frozen Pizza, Vegetarian Frozen Pizza), By Crust Type(Thin Crust, Thick Crust, Stuffed, Other Crust Types), By Toppings(Meat, Vegetables, Cheese, Other Toppings), By Size(Regular, Large, Extra-large), By Distribution Channel(Supermarkets/Hypermarkets, Convenience Stores, Specialty Stores, Online Retail, Others), By Region and Companies - Industry Segment Outlook, Market Assessment, Competition Scenario, Trends and Forecast 2023-2033
-
41276
-
Sep 2023
-
160
-


-
This report was compiled by Shreyas Rokade Shreyas Rokade is a seasoned Research Analyst with CMFE, bringing extensive expertise in market research and consulting, with a strong background in Chemical Engineering. Correspondence Team Lead-CMFE Linkedin | Detailed Market research Methodology Our methodology involves a mix of primary research, including interviews with leading mental health experts, and secondary research from reputable medical journals and databases. View Detailed Methodology Page
-
Quick Navigation
Report Overview
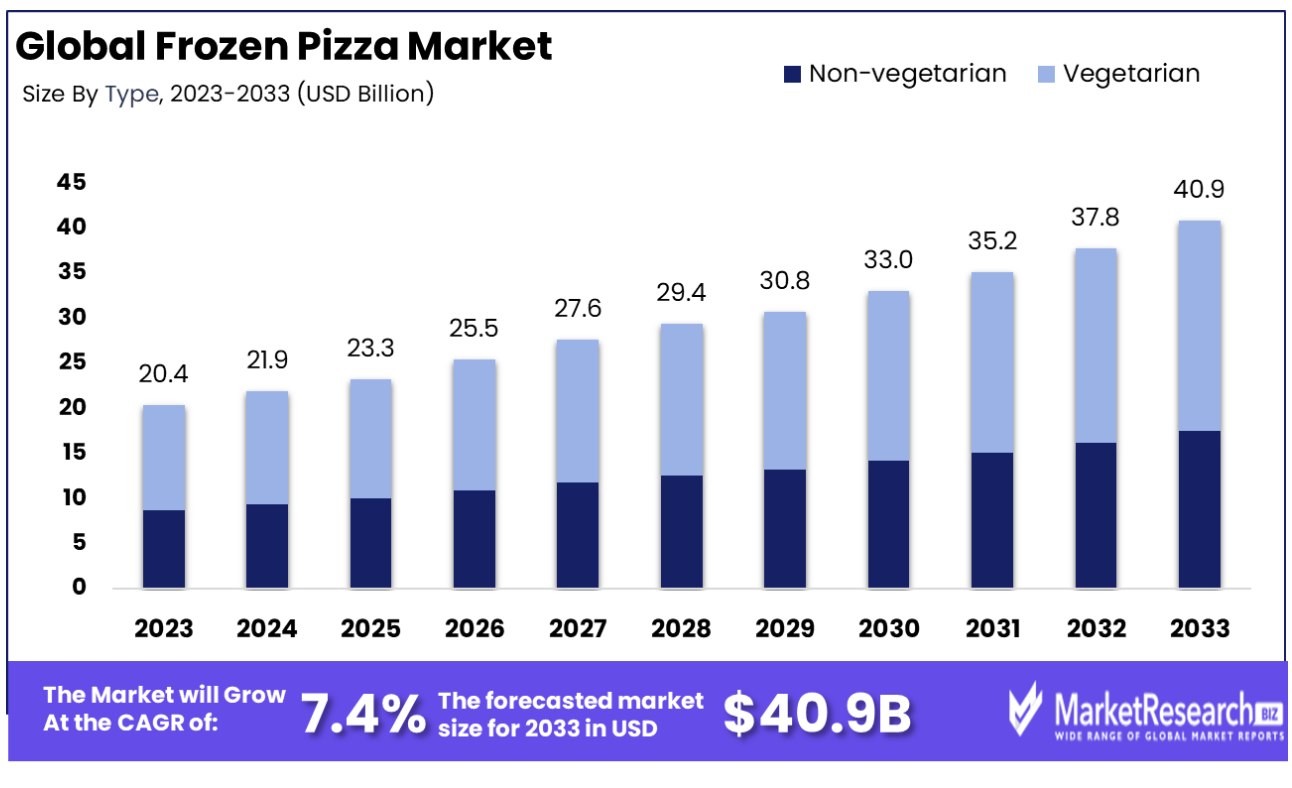
In 2023, the Global Frozen Pizza Market will be valued at US$ 20.4 Billion, and from 2024 and 2033, this market is estimated to register a CAGR of 7.4%.
Frozen pizza is a type of pizza that is pre-made and frozen for later consumption. It is typically made with a crust, sauce, cheese, and toppings, and is partially cooked before being frozen. Frozen pizzas can be found in a variety of flavors and styles, and are a popular convenience food option. Frozen pizza is a convenient and widely popular food product that combines the convenience of pre-prepared meals with the delicious flavors of traditional pizza.
There's a growing demand for healthier alternatives, such as gluten-free and vegan frozen pizzas. These cater to specific dietary needs such as celiac disease, gluten intolerance, and plant-based diets. The market has seen a rise in offerings such as cauliflower crusts and vegan toppings, reflecting the shift towards more health-conscious eating habits.
Actual Numbers Might Vary in the Final Report
Key Takeaways:
- The global frozen pizza market will be valued at US$ 20.4 billion in 2023.
- The global frozen pizza market is projected to reach US$ 40.9 billion by 2033.
- Among crust types, thin-crust type frozen pizza accounted for the majority of the market share with 8%.
- Among types, non-vegetarian frozen pizza accounted for the largest market share of 8%.
- Based on toppings, meat-based toppings are expected to account for the largest market share in 2023 with 4%.
- Among frozen pizza sizes, the large-sized frozen pizza is more popular among consumers, and thus, it holds a 1% revenue share.
- Based on the distribution channel, the supermarkets/hypermarkets segment is anticipated to account market share of 0%.
- 2 out of every 3 households in the United States eat frozen pizza regularly.
Global Frozen Pizza Market Scope:
Crust Type Analysis
Owing to Their Crisp Texture, Thin Crust Frozen Pizzas Are Preferred Over Other Crust Types
The market is segregated into thin crust, thick crust, stuffed, and others based on a crust type. Among these, the thin crust type frozen pizza is more popular and thus accounted for the majority of the market share of 59.9% in 2023. Thin-crust pizzas generally contain fewer calories and less dough than their thick or stuffed counterparts. As health and wellness trends continue to influence consumer choices, many opt for thin crust options as a way to enjoy pizza while consuming fewer calories and less bread. Several consumers prefer the crispy texture of a thin-crust pizza, especially when baked or reheated. The thin base can provide a satisfying crunch that contrasts well with the soft cheese and toppings.
Type Analysis
Non-Vegetarian Frozen Pizza Accounted for The Largest Market Share Owing to Their Higher Popularity
The global frozen pizza market is segmented based on type into non-vegetarian frozen pizza and vegetarian frozen pizza. Among both, non-vegetarian frozen pizza holds the majority of the revenue share of 61.8% in 2023. Non-vegetarian pizzas, often topped with various meats such as pepperoni, sausage, and chicken, are popular in many cultures and are seen as the traditional or standard option in various regions. This popularity drives higher sales volumes. In various Western countries, where frozen pizza consumption is high, meat-inclusive diets are prevalent. These dietary habits influence the demand for non-vegetarian frozen pizzas. There's a wide variety of non-vegetarian frozen pizzas available, featuring different types of meats and combinations, appealing to a broad range of tastes.
Toppings Analysis
The Demand for Meat Based Toppings is Boosting Due to the Availability of Variety of Options
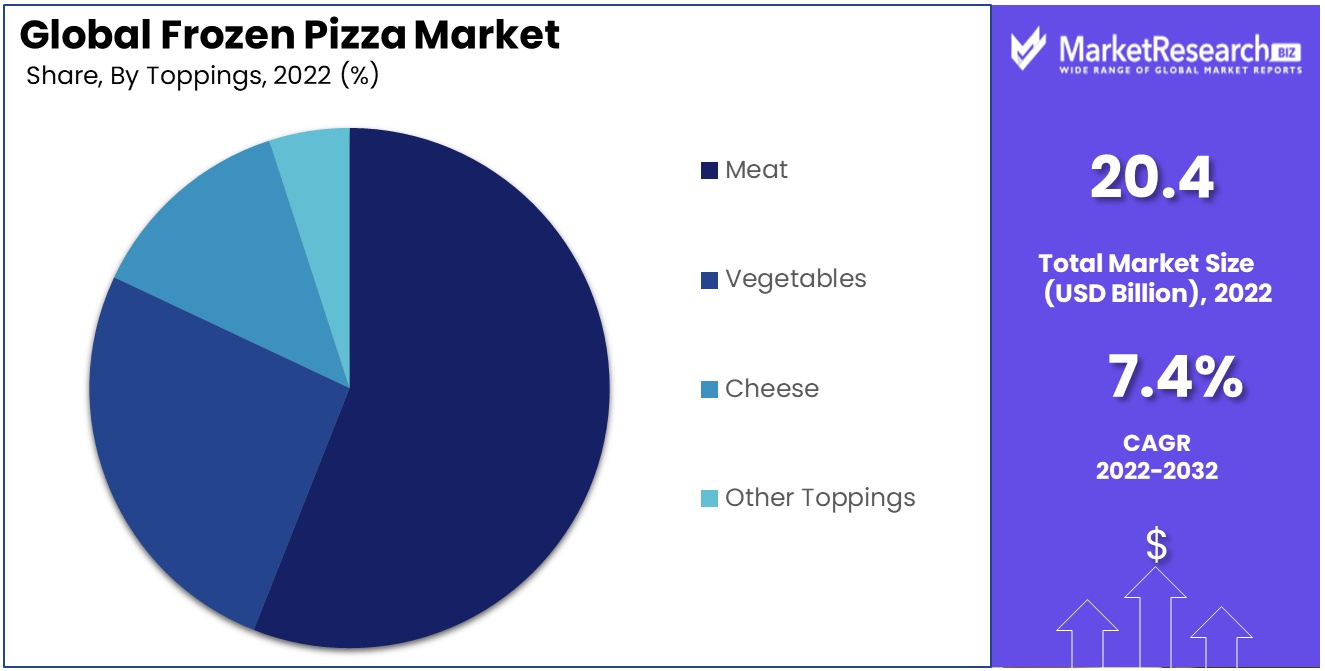
The market is further divided into meat, vegetables, cheese, and others based on toppings. Among these, meat toppings accounted for the largest market share in 2023, with 56.4%. Meat toppings such as pepperoni, sausage, and ham are traditional favorites. They are often associated with a richer flavor and greater satisfaction, appealing to a broad consumer base that enjoys hearty and savory tastes.
The range of meat toppings available is extensive, from common options such as chicken and beef to more gourmet choices such as prosciutto or chorizo. This variety allows consumers to choose from a wide array of flavors and textures, catering to diverse palates. Meat toppings are often perceived as more premium compared to other options. Consumers might associate meat with higher value, making them more willing to pay a premium for meat-topped frozen pizzas.
Size Analysis
Larger Frozen Pizzas Can Accommodate More or A Variety of Toppings, Catering to Diverse Taste References Within a Group; hence, They Are Anticipated to Hold the Majority of Revenue Share.
Based on size global frozen pizza market is segmented into regular, large, and extra-large. Among these, large-size frozen pizza is more popular and holds the majority of the market share at 53.1%. Larger pizzas offer more space for a variety of toppings, allowing for greater diversity in flavors and ingredients in a single pizza. This variety caters to different taste preferences within a household or group, making it a versatile option. Purchasing a large frozen pizza is convenient as it reduces the frequency of cooking or buying meals, fitting well into the busy lifestyles of modern consumers. It also means fewer packaging materials and storage requirements compared to multiple smaller pizzas.
Distribution Channel Analysis
Supermarkets/Hypermarkets Accounted for The Largest Revenue Share In The Frozen Pizza Market Primarily Due To Wide Product Assortment and Availability.
The market is segregated into supermarkets/hypermarkets, convenience stores, specialty stores, online retail, and others. Among these, supermarkets/hypermarkets are estimated to account for the majority of revenue share of 53.0% by 2023. Supermarkets and hypermarkets typically offer a wide range of frozen pizza brands and varieties, from premium to budget options.
Consumers appreciate the ability to choose from an extensive selection under one roof. Due to their size, supermarkets and hypermarkets can often offer more competitive prices compared to smaller retail formats. They benefit from economies of scale and can negotiate better terms with suppliers. These retailers frequently run promotions, discounts, and loyalty programs that attract consumers looking for value deals on frozen pizzas and other products.
Key Market Segments:
By Type
- Non-vegetarian Frozen Pizza
- Vegetarian Frozen Pizza
By Crust Type
- Thin Crust
- Thick Crust
- Stuffed
- Other Crust Types
By Toppings
- Meat
- Vegetables
- Cheese
- Other Toppings
By Size
- Regular
- Large
- Extra-large
By Distribution Channel
- Supermarkets/Hypermarkets
- Convenience Stores
- Specialty Stores
- Online Retail
- Others
Market Dynamics:
Drivers
Rising Demand for Convenience and Time-saving Meal Options Driving the Global Frozen Pizza Market Growth
In today's fast-paced world, people are leading increasingly hectic lives. Balancing work, family, and other commitments leaves limited time and energy for preparing elaborate meals. This is where the convenience of frozen pizza becomes apparent. With frozen pizza, consumers can have a hot and delicious meal on the table in a matter of minutes, sparing them the need to plan and cook a meal from scratch. One of the standout features of frozen pizza is the minimal preparation required.
Unlike making pizza dough and preparing toppings, frozen pizzas come ready-made with crust, sauce, cheese, and toppings. All consumers need to do is preheat the oven and pop the pizza in, reducing the hands-on cooking time to a minimum. This is especially appealing to those who may lack culinary skills or the time to engage in extensive meal preparation. One of the primary drivers of the increasing popularity of frozen pizza is its unmatched convenience. Among busy individuals, such as women aged 35 to 44 and singles, frozen pizza has a large demand because it offers a quick and hassle-free meal option. For instance:
- S. households led by women aged 35 to 44 purchased frozen pizza approximately 8.3 times annually in 2019, indicating a consistent demand for this convenient meal option among this demographic.
Availability of Variety of Flavors and Customization Options Driving the Market Growth
Availability of variety in flavor profiles is a significant factor driving the frozen pizza market growth. Manufacturers in the market recognize that consumers have diverse taste preferences, and they respond by offering an extensive array of flavors. These options can range from classic choices such as pepperoni and supreme to more adventurous combinations such as Mediterranean vegetables or chicken. This breadth of choices means that there is something for everyone, whether consumers prefer traditional flavors or exploring new and exciting tastes. The Pizza Market has seen a surge in demand, driving growth in the Frozen Pizza and Pizza Box markets.
This diversity in flavor profiles keeps consumers engaged and eager to try different pizzas, contributing significantly to the market's growth. Customization is a significant aspect of the frozen pizza market. Many brands in the market provide consumers with the opportunity to create their own unique pizza experiences. This often takes the form of build-your-own pizza kits, which include various crusts, sauces, and an assortment of toppings. Such customization empowers consumers to tailor their pizzas to their specific tastes and dietary needs. It adds a layer of personalization to the dining experience, allowing individuals to craft a pizza that suits their cravings perfectly. This level of flexibility enhances the attractiveness of frozen pizzas as a convenient and customizable meal option.
Restraints
Intense Competition from Fresh Pizza Hinder the Market Growth
Fresh pizza is often perceived as superior in quality and taste compared to frozen pizza. It is prepared with fresh ingredients, including locally sourced produce, premium cheeses, and a variety of toppings. The dough is usually made from scratch, resulting in a fresher, more authentic flavor. In contrast, frozen pizza is pre-cooked, frozen, and reheated by consumers, which can affect its taste and texture. The perception of better quality can lead consumers to choose fresh pizza over frozen options, which can restrain the market growth for frozen pizzas. Fresh Pizza offers a high level of customization. Customers can choose their preferred crust type, sauce, cheese, and toppings, allowing for a personalized dining experience. This level of customization is difficult to replicate with frozen pizzas, which come in pre-set varieties.
Consumers who value customization are more likely to opt for fresh pizza. Fresh pizza dining often includes the experience of eating out or ordering in, which can be social and enjoyable. It is a common choice for gatherings, parties, and family dinners. Frozen pizza lacks this dining experience and is often seen as a more solitary or utilitarian meal option. These factors, along with the restraints affecting the market, contribute to the challenges in the frozen pizza industry's growth and consumer preference.
Opportunity
Growing Demand for Premium and Gourmet Options
The evolving consumer palate and increased willingness to experiment with diverse flavors and ingredients present a significant opportunity for the frozen pizza market. There is a growing demand for premium and gourmet frozen pizzas that offer an elevated eating experience comparable to restaurant quality. The trend of premiumization involves upgrading the quality, ingredients, and overall value proposition of frozen pizzas. This includes using specialty cheeses, hand-tossed crusts, exotic meats and vegetables, and unique flavor combinations.
By positioning these products as premium, companies can attract a segment of consumers willing to pay more for a superior product. Moreover. advancements in freezing and preservation technology have enabled manufacturers to produce higher-quality frozen pizzas that retain taste, texture, and nutritional value. These technological improvements make it possible to offer gourmet-quality pizzas in a frozen format, meeting consumer demands for convenience without compromising on quality.
Trends
Rise of Plant-Based and Health-Conscious Offerings
A major trend in the frozen pizza market is the rise of plant-based and health-conscious offerings. This trend is driven by the increasing number of consumers adopting vegetarian, vegan, and flexitarian diets, as well as the general shift towards healthier eating habits. In addition to plant-based options, there is also a growing demand for frozen pizzas that cater to various health considerations. This includes gluten-free crusts, low-carb options, and pizzas made with whole, unprocessed ingredients.
These health-conscious offerings are designed to appeal to consumers who are mindful of their dietary choices but still seek the convenience and comfort of frozen pizza. Brands are also repositioning their products to highlight the health and ethical benefits of their plant-based and health-conscious offerings. This involves clear labeling, health claims, and marketing campaigns that align with the values and lifestyles of their target consumers.
Geopolitical Impact Analysis
Geopolitical Tensions Significantly Disrupted the Supply Chain Activities Which May Hinder the Growth of the Frozen Pizza Market
Changes in trade policies, including the imposition of tariffs on imported goods or raw materials, can significantly affect the frozen pizza market. For instance, tariffs on cheese, meat, or wheat imported from certain countries can increase production costs for manufacturers, affecting pricing and potentially reducing competitiveness in international markets. Geopolitical tensions or conflicts can disrupt supply chains, affecting the availability of key ingredients for frozen pizza, such as cheese, meats, vegetables, and wheat. Disruptions can lead to increased costs and shortages, impacting production and distribution. Geopolitical events often lead to fluctuations in currency exchange rates. For companies operating in multiple countries, this can have a significant impact on profits, costs, and pricing strategies.
A weaker currency can make imports more expensive, while a stronger currency can make exports less competitive. Geopolitical shifts can lead to changes in regulations affecting food safety, labeling, and quality standards. Companies must adapt to these changes, which can involve additional costs for compliance and modifications to product formulations or packaging. Global and regional efforts to combat climate change can lead to stricter environmental regulations affecting the frozen pizza market, such as requirements for sustainable packaging or emissions reductions.
Regional Analysis
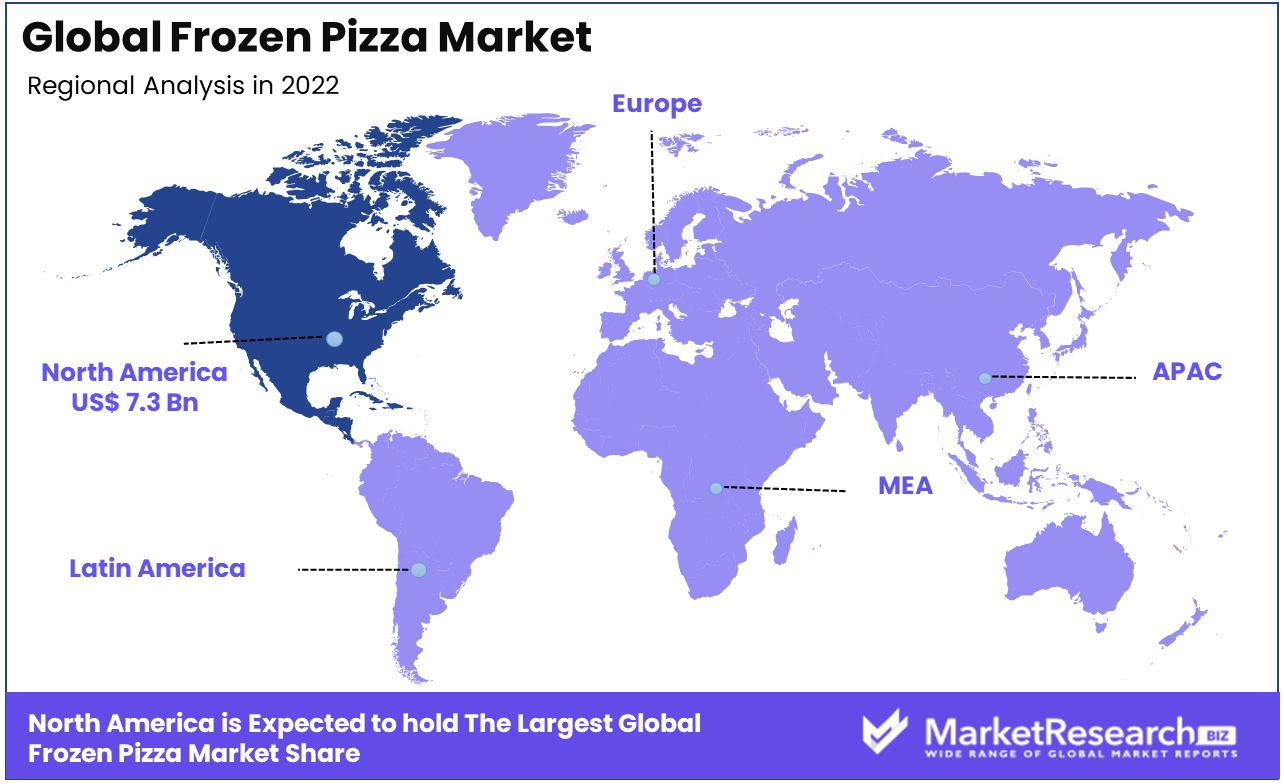
North America is estimated to be the Most Lucrative Market in the Global Frozen Pizza Market.
North America holds the largest market share, with 39.1% in frozen pizza in 2023. North America, particularly the United States, holding the largest market share in the frozen pizza industry can be attributed to various factors that contribute to its dominant position. Frozen pizza is immensely popular in North America, especially in the United States. It is a staple of American cuisine, with a significant portion of the population consuming it regularly. The fast-paced lifestyle of many North American consumers drives the demand for convenient meal solutions.
Frozen pizzas offer a quick, easy, and often cost-effective option for meals, fitting well with the busy lifestyle of many individuals and families. North America has a highly developed retail sector, including supermarkets, hypermarkets, and convenience stores, where frozen pizzas are readily available. This accessibility boosts sales and makes it easy for consumers to purchase these products. While frozen pizza is often considered a convenience food, there's also a growing segment of health-conscious consumers in North America. Manufacturers have responded by offering healthier options, including pizzas with organic ingredients, vegetable toppings, low-carb crusts, and plant-based cheeses.
Key Regions and Countries Covered in this Report:
- North America
- The US
- Canada
- Europe
- Germany
- France
- The UK
- Spain
- Italy
- Russia & CIS
- Rest of Europe
- APAC
- China
- Japan
- South Korea
- India
- ASEAN
- Rest of APAC
- Latin America
- Brazil
- Mexico
- Rest of Latin America
- Middle East & Africa
- GCC
- South Africa
- Rest of MEA
Market Share & Key Players Analysis:
Strong Focus On Product Portfolio Expansion Through Various Strategies. Maintain the Dominance of Industry Leaders
The frozen pizza market, in various sectors of the food industry, is experiencing dynamic changes and growth, driven by evolving consumer preferences, technological advancements, and innovative marketing strategies. Companies are offering healthier alternatives with organic ingredients, gluten-free crusts, and plant-based toppings to cater to health-conscious consumers. The key players in the global frozen pizza market are employing a combination of strategies focused on product innovation, technological advancements, strategic marketing, and sustainability. By adapting to changing consumer preferences and leveraging new technologies, these companies are not only maintaining but also strengthening their positions in the competitive market landscape.
Recent Development
- In April 2023, Nestlé and private equity firm PAI Partners agreed to set up a joint venture for Nestlé's frozen pizza business in Europe. The joint venture will create a dedicated player in a competitive and dynamic category, with the business being headquartered in Germany and led by a strong and experienced management team. The joint venture will operate two manufacturing facilities, in Nonnweiler, Germany, and Benevento, Italy.
- In May 2023, Nestlé's DiGiorno frozen pizza brand introduced two new varieties to its lineup: Loaded Ultra-Thin and Detroit Style.
- In June 2022, Healthy Choice a Conagra Brands, Inc. brand launched three new pizzas turkey pepperoni flatbread pizza, chicken sausage supreme pizza, and BBQ-seasoned chicken flatbread pizza.
Market Key Players:
The frozen pizza market features a mix of well-established brands and emerging players. Dominance in this market is often achieved through brand recognition, product quality, distribution networks, and marketing strategies. Major key players such as Dr. August Oetker AG, Conagra Brands, Bellisio Foods, Inc., Freiberger Lebensmittel GmbH, Newman's Own, Nestlé S.A., etc. continuously innovate with new flavors, crust types, and specialty offerings. These companies dominate the market through a blend of quality products, strong brand presence, effective marketing, and widespread distribution. They keep a close watch on consumer trends and are quick to adapt, ensuring they meet the changing needs and preferences of customers worldwide.
The following are some of the major players in the industry
- August Oetker AG
- Conagra Brands
- Bellisio Foods, Inc.
- Freiberger Lebensmittel GmbH
- Newman's Own
- Nestlé S.A.
- Simply Good Foods Co.
- Monte Pizza International B.V.
- McCain Foods Limited
- Hansen Foods, LLC
- Other Key Players
Report Scope
Report Features Description Market Value (2022) USD 20.4 Billion Forecast Revenue (2032) USD 40.9 Billion CAGR (2023-2032) 7.4% Base Year for Estimation 2022 Historic Period 2016-2022 Forecast Period 2023-2032 Report Coverage Revenue Forecast, Market Dynamics, COVID-19 Impact, Competitive Landscape, Recent Developments Segments Covered By Type(Non-vegetarian Frozen Pizza, Vegetarian Frozen Pizza), By Crust Type(Thin Crust, Thick Crust, Stuffed, Other Crust Types), By Toppings(Meat, Vegetables, Cheese, Other Toppings), By Size(Regular, Large, Extra-large), By Distribution Channel(Supermarkets/Hypermarkets, Convenience Stores, Specialty Stores, Online Retail, Others) Regional Analysis North America – The US, Canada, Mexico, Latin America – Brazil, Colombia, Chile, Argentina, Costa Rica, & Rest of Latin America, Eastern Europe – Russia, Poland, The Czech Republic, Greece, Rest of Eastern Europe, Western Europe – Germany, France, The UK, Spain, Italy, Portugal, Ireland, Austria, Switzerland, Benelux, Nordic, Rest of Western Europe, APAC – China, Japan, South Korea, India, Australia & New Zealand, Indonesia, Malaysia, Philippines, Singapore, Thailand, Vietnam, Rest of APAC, Middle East & Africa – Algeria, Egypt, Israel, Kuwait, Nigeria, Saudi Arabia, South Africa, Turkey, United Arab Emirates, Rest of MEA Competitive Landscape August Oetker AG, Conagra Brands, Bellisio Foods, Inc., Freiberger Lebensmittel GmbH, Newman's Own, Nestlé S.A., Simply Good Foods Co., Monte Pizza International B.V., McCain Foods Limited, Hansen Foods, LLC, Other Key Players Customization Scope Customization for segments, region/country-level will be provided. Moreover, additional customization can be done based on the requirements. Purchase Options We have three licenses to opt for Single User License, Multi-User License (Up to 5 Users), Corporate Use License (Unlimited User and Printable PDF) -
-
- August Oetker AG
- Conagra Brands
- Bellisio Foods, Inc.
- Freiberger Lebensmittel GmbH
- Newman's Own
- Nestlé S.A.
- Simply Good Foods Co.
- Monte Pizza International B.V.
- McCain Foods Limited
- Hansen Foods, LLC
- Other Key Players
Our Clients


View Our Licence Options
