
Fresh Food Market Report By Type (Fruits & Vegetables, Meat & Poultry, Seafood, Dairy Products, Eggs, Grains & Cereals, Others), By Distribution Channel (Online Stores, Offline Stores [Supermarkets/Hypermarkets, Specialty Stores, Convenience Stores, Others]), By End-User (Household, Food Service Industry [Restaurants, Hotels, Catering Services], Food Processing Industry), By Region and Companies - Industry Segment Outlook, Market Assessment, Competition Scenario, Trends and Forecast 2024-2033
-
28451
-
February 2025
-
321
-


-
This report was compiled by Shreyas Rokade Shreyas Rokade is a seasoned Research Analyst with CMFE, bringing extensive expertise in market research and consulting, with a strong background in Chemical Engineering. Correspondence Team Lead-CMFE Linkedin | Detailed Market research Methodology Our methodology involves a mix of primary research, including interviews with leading mental health experts, and secondary research from reputable medical journals and databases. View Detailed Methodology Page
-
Quick Navigation
Report Overview
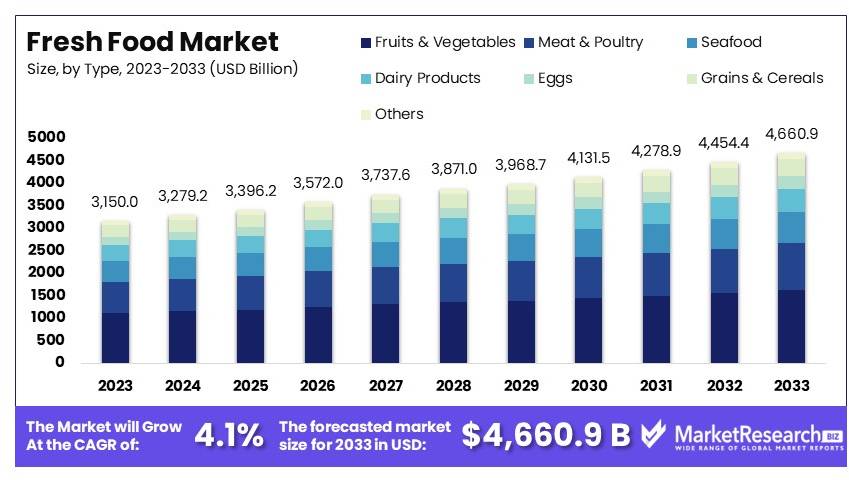
The Global Fresh Food Market size is expected to be worth around USD 4,660.9 Billion by 2033, from USD 3,150 Billion in 2023, growing at a CAGR of 4.1% during the forecast period from 2024 to 2033. APAC dominates with 42.6%; high population growth fuels demand.
Fresh Food refers to food products that are minimally processed and do not undergo preservation methods such as freezing, canning, or drying. These foods are typically consumed soon after harvest or production, retaining most of their natural flavors, nutrients, and texture. Examples of fresh food include fruits, vegetables, meat, dairy, and bakery items.
Fresh foods are often perceived as healthier alternatives to processed foods due to their lower levels of additives, preservatives, and artificial ingredients. The Fresh Food Market encompasses the trade and consumption of fresh food products, which are highly valued for their nutritional content, flavor, and minimal processing.
The market includes a variety of products available through supermarkets, grocery stores, farmers' markets, and online platforms. As health-conscious consumer behavior increases, the fresh food market continues to expand globally, driven by the demand for more natural, whole foods. Key trends include the rising preference for organic fresh foods, locally sourced products, and sustainably produced options.
Several factors are contributing to the growth of the fresh food market. The global shift towards healthier eating habits and increased awareness of the benefits of fresh, natural foods are major drivers. The growing popularity of plant-based diets, with an emphasis on fresh fruits, vegetables, and plant-based proteins, is also accelerating the market’s growth. Additionally, advancements in supply chain and logistics, including improved transportation and refrigeration techniques, are allowing for better distribution and access to fresh foods, even in regions previously underserved.
The demand for fresh food is being driven by an increasing number of health-conscious consumers seeking minimally processed, nutrient-rich foods. Younger generations, in particular, are more likely to prioritize fresh food over processed alternatives, with a focus on clean labels, organic options, and locally sourced ingredients. Moreover, the demand for fresh foods is growing in emerging markets as urbanization and disposable income rise, leading to more access to a variety of fresh food products.
There are significant opportunities in the fresh food market for producers, retailers, and suppliers. As consumer demand for fresh and organic products continues to grow, companies can capitalize on the trend by offering a wider range of organic, locally sourced, and sustainable fresh food options. There are also opportunities in online grocery delivery and direct-to-consumer models, as convenience is becoming a key factor in consumer purchasing behavior. Additionally, innovations in packaging, such as eco-friendly materials that extend shelf life, present new avenues for growth.
Key Takeaways
- Market Value: The Fresh Food Market was valued at USD 3,150 billion in 2023 and is expected to reach USD 4,660.9 billion by 2033, with a CAGR of 4.1%.
- Product Analysis: Fruits & Vegetables dominate at 35%; their diverse demand drives market growth.
- Distribution Channel Analysis: Supermarkets/Hypermarkets lead with 45%; they are primary shopping destinations.
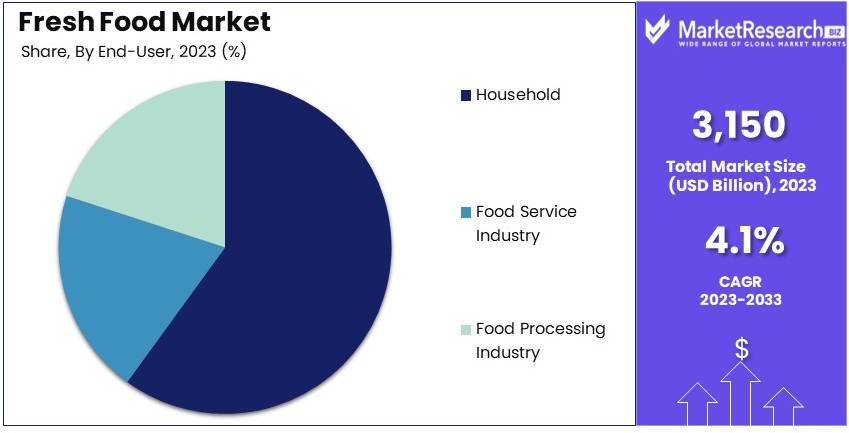
- End User Analysis: Households account for 60%; of high consumer preference for fresh food.
- Dominant Region: APAC dominates with 42.6%; high population growth fuels demand.
- Analyst Viewpoint: The Fresh Food Market is competitive yet growing, with significant expansion expected in Asian markets due to increasing health awareness and urbanization.
Driving Factors
Health and Wellness Trend Drives Market Growth
The increasing focus on health and wellness is significantly driving the fresh food market. Consumers are becoming more health-conscious, seeking nutritious options to enhance their diet and overall well-being. This shift has resulted in a substantial surge in demand for fresh fruits, vegetables, lean meats, and other unprocessed foods. The trend towards healthier eating habits is influenced by growing awareness of the benefits of a balanced diet rich in vitamins, minerals, and antioxidants.
For example, a study by the International Food Information Council in 2023 found that 62% of consumers are actively trying to eat healthier, with a strong preference for fresh and natural foods. This health-conscious mindset has also led to an increased interest in organic and locally sourced produce, further boosting the fresh food market. The global rise in lifestyle diseases such as obesity, diabetes, and heart disease has reinforced the need for healthier eating options, prompting consumers to prioritize fresh foods over processed alternatives.
The health and wellness trend is a critical driver for the fresh food market, as it not only increases consumer demand for nutritious foods but also fosters a broader cultural shift towards sustainable and healthy eating practices.
Rise of Clean Eating Drives Market Growth
The clean eating movement has become a powerful driver of the fresh food market. This trend emphasizes the consumption of whole, minimally processed foods, aligning perfectly with the market's offerings. Consumers increasingly seek products free from artificial additives, preservatives, and excessive processing, driving the demand for fresh and natural foods.
The rise of clean eating is evident in the growing popularity of farmers' markets, farm-to-table restaurants, and dedicated grocery store sections for fresh, local produce. According to the USDA, the number of farmers' markets in the United States has increased from 1,755 in 1994 to over 8,600 in 2019. This growth highlights consumers' increasing preference for fresh, locally sourced foods.
Moreover, the clean eating trend is supported by a broader societal shift towards transparency and sustainability in food production. Consumers are more informed and conscientious about the origins and processing of their food, driving demand for fresh and traceable products. This movement is not only boosting sales but also encouraging retailers and producers to prioritize fresh food options, thereby expanding the market.
Increasing Awareness of Food Safety Drives Market Growth
Food safety concerns are significantly propelling the growth of the fresh food market. Recent foodborne illness outbreaks have heightened consumer awareness of the importance of food safety, leading to a preference for fresh, traceable foods over processed alternatives. Consumers are increasingly willing to pay a premium for fresh foods perceived as safer and of higher quality.
The industry's response to this demand is evident in the adoption of advanced technologies to enhance food traceability and safety. For instance, Walmart and IBM have implemented blockchain technology in their food supply chains to improve traceability, ensuring that consumers can track the journey of their food from farm to table. This technological integration addresses consumer concerns and reinforces trust in fresh food products.
Additionally, regulatory measures and stricter safety standards have further driven the market's growth. Governments and health organizations worldwide are implementing rigorous food safety regulations, compelling producers to adhere to higher standards. This emphasis on safety and quality assurance not only boosts consumer confidence but also promotes the growth of the fresh food market by ensuring that products meet the highest safety criteria.
Restraining Factors
Short Shelf Life and Spoilage Restrains Market Growth
The short shelf life of fresh foods significantly hampers the market's growth. Fresh produce is highly perishable, leading to increased waste and higher costs for both retailers and consumers. According to the FAO, about one-third of all food produced globally is lost or wasted, with fresh fruits and vegetables being major contributors. This spoilage not only reduces profitability but also results in logistical complexities.
Retailers need to manage stock carefully, leading to higher operational costs. Consumers may also be deterred by the quick spoilage, preferring longer-lasting alternatives. Environmental concerns arise from the waste generated, which could further push consumers and businesses to reconsider their fresh food purchases.
Price Volatility Restrains Market Growth
Price volatility in the fresh food market presents a significant challenge. Prices of fresh produce fluctuate due to weather conditions, seasonality, and supply chain disruptions. For instance, the 2021 winter storms in Texas caused extensive crop damage, leading to temporary shortages and price spikes in fresh produce across the United States.
This unpredictability makes fresh foods less accessible to price-sensitive consumers and difficult for businesses to maintain stable profit margins. Consequently, consumers may opt for more stable-priced processed foods, affecting the demand for fresh produce and hindering market growth.
By Type Analysis
Fruits & Vegetables dominate with 35% due to their essential role in a balanced diet and increasing consumer health consciousness.
The fresh food market, distinguished by its variety, is significantly propelled by the Fruits & Vegetables segment. This segment captures about 35% of the market, primarily driven by a growing global focus on health and wellness. Consumers are increasingly favoring fruits and vegetables as essential components of a healthy lifestyle, supported by government initiatives promoting healthier eating habits.
The appeal of fruits and vegetables extends beyond mere nutrition; there is a rising trend towards organic and locally sourced produce, which resonates well with the modern consumer’s preference for sustainability. This segment's growth is also facilitated by innovations in packaging and preservation technologies that extend the shelf life of fresh produce, making them more accessible in urban areas.
Contrastingly, other sub-segments like Meat & Poultry, Seafood, and Dairy Products also play crucial roles but have distinct challenges and drivers. For instance, Meat & Poultry, accounting for about 25% of the market, confronts issues related to ethical farming and meat consumption's environmental impact. However, advancements in ethical farming and the introduction of premium meat products are fostering growth. Similarly, Seafoods like fishmeal and fish oil benefits from a reputation for being a rich source of omega-3 fatty acids, though it faces sustainability challenges. Dairy Products and Eggs, staple components of many diets, are undergoing transformations with increased demand for organic and free-range options, which are perceived as healthier and more humane.
Grains & Cereals and other niche segments like organic or exotic items, while smaller, contribute to market diversity and cater to specific consumer preferences, thereby supporting the overall market growth through targeted offerings.
By Distribution Channel Analysis
Supermarkets/Hypermarkets dominate with 45% due to extensive product range and convenience.
In the distribution of fresh foods, Supermarkets/Hypermarkets are the most significant channels, commanding around 45% of the market. Their dominance is attributed to their ability to offer a wide range of products under one roof, coupled with the convenience of location and operating hours. These stores have adapted to consumer preferences with sections dedicated to organic and specialty foods, meeting the demand for diverse and health-oriented products.
The rise of Online Stores, which now represent approximately 20% of the market, reflects a shift towards digital platforms, driven by consumer convenience and the proliferation of delivery services. These platforms are particularly favored for their ability to provide fresh food products quickly and efficiently, appealing especially to the urban demographic.
Specialty Stores and Convenience Stores, though smaller in market share, cater to specific needs by offering unique product assortments and convenient shopping experiences, particularly in dense urban settings where large supermarkets are less accessible. These stores often focus on high-quality, niche products, attracting a segment of consumers willing to pay a premium for specialty items.
Other outlets, including local farmer’s markets and cooperative groceries, while niche, play an essential role in the distribution ecosystem by fulfilling consumer demand for locally-sourced, sustainable, and artisanal food options, thereby contributing to the market's dynamism and resilience.
By End-User Analysis
Households dominate with 60% due to the fundamental need for daily consumption.
Households represent the largest end-user segment of the fresh food market, accounting for 60% of the overall consumption. This dominance is primarily because fresh food is a daily necessity for home cooking and nutrition, driving consistent demand across various demographics and geographies.
The Food Service Industry, which includes Restaurants, Hotels, and Catering Services, constitutes another significant portion of the market. This sector, driven by the global expansion of the hospitality industry and increasing consumer spending on dining out, demands a steady supply of high-quality fresh foods to cater to diverse culinary preferences and dietary requirements.
Lastly, the Food Processing Industry utilizes fresh foods as raw materials for products like canned goods, frozen foods, and other packaged items. This sector's demand is influenced by consumer trends toward convenience foods that require minimal preparation time, reflecting busy lifestyles.
Each of these end-user segments contributes differently to the growth of the fresh food market. While households provide a steady and broad demand base, the food service and processing industries drive innovation and value addition, making the market both versatile and robust.
Key Market Segments
By Type
- Fruits & Vegetables
- Meat & Poultry
- Seafood
- Dairy Products
- Eggs
- Grains & Cereals
- Others
By Distribution Channel
- Online Stores
- Offline Stores
- Supermarkets/Hypermarkets
- Specialty Stores
- Convenience Stores
- Others
By End-User
- Household
- Food Service Industry
- Restaurants
- Hotels
- Catering Services
- Food Processing Industry
Growth Opportunities
E-commerce and Direct-to-Consumer Models Offer Growth Opportunity
The rapid expansion of e-commerce and direct-to-consumer models provides a substantial growth opportunity for the fresh food market. Online grocery platforms and subscription-based meal kit services are making fresh foods more accessible to consumers. Companies like HelloFresh and Blue Apron have capitalized on this trend by delivering fresh ingredients directly to consumers' doors. This convenience appeals to busy lifestyles and enhances customer reach.
The global online grocery market is expected to reach USD 1.1 trillion by 2027. This trend indicates significant growth potential for fresh food e-commerce. By leveraging these online platforms, fresh food companies can expand their market reach, offer personalized services, and respond quickly to consumer demands.
Vertical Farming and Urban Agriculture Offer Growth Opportunity
The advancement of vertical farming and urban agriculture technologies presents a promising growth opportunity for the fresh food market. Vertical farming allows for the cultivation of fresh produce in controlled, indoor environments, ensuring year-round production regardless of weather conditions. Urban agriculture initiatives bring farming closer to consumers, reducing transportation costs and carbon footprints.
For example, AeroFarms in New Jersey operates large-scale indoor vertical farms that produce fresh greens using significantly less water and land than traditional farming methods. These innovative approaches meet the growing demand for locally-sourced, sustainable produce and support the fresh food market's expansion by providing consistent supply and addressing environmental concerns.
Trending Factors
Plant-based and Alternative Proteins Are Trending Factors
The rising interest in plant-based diets and alternative proteins is a major trend shaping the fresh food market. Consumers are increasingly turning to plant-based options for health, environmental, and ethical reasons. This trend extends beyond traditional fruits and vegetables to include fresh plant-based meat alternatives and dairy substitutes.
Companies like Beyond Meat and Impossible Foods have gained significant market share by offering plant-based meat alternatives that closely mimic the taste and texture of animal products. This appeal to both vegetarians and flexitarians supports the growing demand for fresh, plant-based products, driving market expansion and catering to diverse dietary preferences.
Functional Foods and Superfoods Are Trending Factors
The trend towards functional foods and superfoods is significantly impacting the fresh food market. Consumers are increasingly seeking out foods with specific health benefits, such as immune-boosting properties or anti-inflammatory effects. This demand drives the popularity of fresh produce like kale, berries, and turmeric, as well as innovative products fortified with vitamins, minerals, or probiotics.
The popularity of products like kombucha and kefir has soared due to their perceived health benefits, particularly for gut health. This trend highlights the consumer preference for nutrient-rich, health-enhancing foods, providing opportunities for fresh food producers to innovate and meet the growing demand for functional and superfoods.
Regional Analysis
APAC Dominates with 42.6% Market Share in the Fresh Food Market
APAC's substantial 42.6% market share in the fresh food sector is largely driven by its extensive agricultural activities and large rural populations engaged in farming. The region benefits from diverse climates that are ideal for producing a variety of fresh foods, including fruits, vegetables, and meats. High population density results in strong local demand. Additionally, cultural preferences for fresh over processed foods further amplify consumption rates.
The dynamics of the fresh food market in APAC are shaped by strong local supply chains that facilitate the movement of goods from rural producers to urban markets. Rapid urbanization has also led to the development of modern retail formats, such as supermarkets and hypermarkets, which are increasingly incorporating fresh produce into their offerings. These factors, combined with growing health awareness among consumers, sustain a robust demand for fresh food.
The future influence of APAC in the fresh food market looks promising. As urbanization continues and middle-class populations expand, demand for fresh, high-quality food is expected to grow. Investments in cold storage and improved logistics are likely to enhance distribution efficiency, potentially increasing APAC’s market share further. The region's commitment to sustainable agricultural practices could also attract global consumers looking for responsibly sourced products.
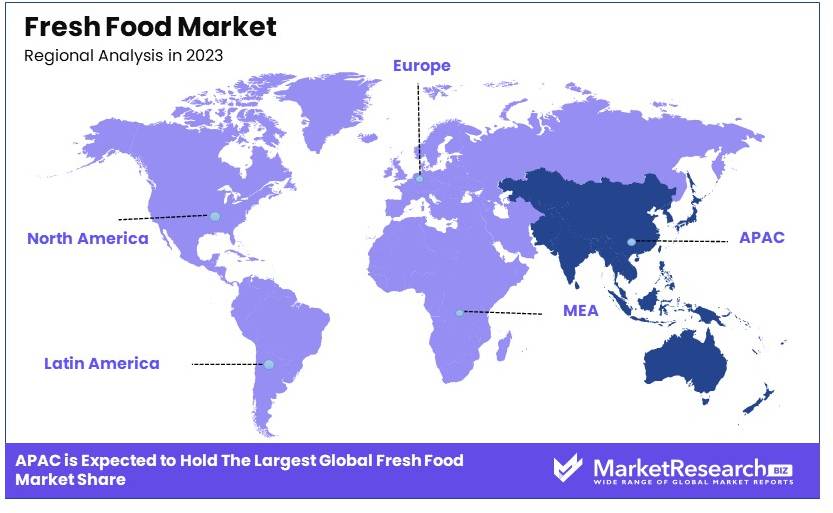
Regional Market Share Analysis- North America: This region holds approximately 15% of the global fresh food market. North America's market is driven by a growing consumer preference for organic and locally sourced food, supported by a well-established agricultural infrastructure.
- Europe: Europe accounts for about 20% of the market. The demand here is bolstered by strong consumer awareness regarding the health benefits of fresh produce and the popularity of Western diets that emphasize fresh fruits, vegetables, and lean meats.
- Middle East & Africa: Holding around 12% of the market, this region sees growth driven by economic diversification efforts away from oil dependence towards sectors like agriculture, coupled with increasing supermarket retailing.
- Latin America: Latin America represents 11% of the market. The region's rich biodiversity and agricultural capabilities support a strong fresh food sector, with significant exports as well as domestic consumption.
Key Regions and Countries
- North America
- The US
- Canada
- Mexico
- Western Europe
- Germany
- France
- The UK
- Spain
- Italy
- Portugal
- Ireland
- Austria
- Switzerland
- Benelux
- Nordic
- Rest of Western Europe
- Eastern Europe
- Russia
- Poland
- The Czech Republic
- Greece
- Rest of Eastern Europe
- APAC
- China
- Japan
- South Korea
- India
- Australia & New Zealand
- Indonesia
- Malaysia
- Philippines
- Singapore
- Thailand
- Vietnam
- Rest of APAC
- Latin America
- Brazil
- Colombia
- Chile
- Argentina
- Costa Rica
- Rest of Latin America
- Middle East & Africa
- Algeria
- Egypt
- Israel
- Kuwait
- Nigeria
- Saudi Arabia
- South Africa
- Turkey
- United Arab Emirates
- Rest of MEA
Key Players Analysis
The Fresh Food Market features several influential companies shaping the industry's landscape. Walmart Inc. stands out as a leading player with extensive global reach and a robust supply chain, enabling competitive pricing and wide product availability. Carrefour SA and Tesco PLC leverage their strong European presence to influence market trends and consumer preferences. Kroger Co. and Albertsons Companies, Inc. dominate the U.S. market through extensive store networks and a focus on fresh, local produce.
Aldi Group and Costco Wholesale Corporation offer distinct models of value and bulk purchasing, respectively, driving consumer loyalty. Ahold Delhaize and Metro AG have significant impacts in Europe, emphasizing high-quality fresh food offerings. Target Corporation and Loblaws Inc. in North America integrate fresh food into their diverse retail operations, enhancing consumer convenience.
Amazon Fresh uses its e-commerce prowess to disrupt traditional fresh food distribution, while J Sainsbury plc and Woolworths Group Limited maintain strong market positions in the UK and Australia, respectively. Koninklijke Ahold Delhaize N.V. underscores its influence through a vast retail network. These companies collectively shape the fresh food market through strategic positioning, extensive reach, and innovative practices.
Market Key Players
- Walmart Inc.
- Carrefour SA
- Tesco PLC
- Kroger Co.
- Albertsons Companies, Inc.
- Aldi Group
- Costco Wholesale Corporation
- Ahold Delhaize
- Metro AG
- Target Corporation
- Loblaws Inc.
- Amazon Fresh
- J Sainsbury plc
- Woolworths Group Limited
- Koninklijke Ahold Delhaize N.V.
Recent Developments
- In July 2024, The USD 24.6 billion merger between Kroger and Albertsons faced significant regulatory challenges, resulting in a temporary block by a Colorado judge.
- In July 2023, Walmart and PepsiCo invested USD 120 million to support regenerative agriculture on over 2 million acres in North America. This initiative aims to reduce greenhouse gas emissions by 4 million metric tons by 2030.
Report Scope
Report Features Description Market Value (2023) USD 3,150 Billion Forecast Revenue (2033) USD 4,660.9 Billion CAGR (2024-2033) 4.1% Base Year for Estimation 2023 Historic Period 2018-2023 Forecast Period 2024-2033 Report Coverage Revenue Forecast, Market Dynamics, Competitive Landscape, Recent Developments Segments Covered By Type (Fruits & Vegetables, Meat & Poultry, Seafood, Dairy Products, Eggs, Grains & Cereals, Others), By Distribution Channel (Online Stores, Offline Stores [Supermarkets/Hypermarkets, Specialty Stores, Convenience Stores, Others]), By End-User (Household, Food Service Industry [Restaurants, Hotels, Catering Services], Food Processing Industry) Regional Analysis North America - The US, Canada, & Mexico; Western Europe - Germany, France, The UK, Spain, Italy, Portugal, Ireland, Austria, Switzerland, Benelux, Nordic, & Rest of Western Europe; Eastern Europe - Russia, Poland, The Czech Republic, Greece, & Rest of Eastern Europe; APAC - China, Japan, South Korea, India, Australia & New Zealand, Indonesia, Malaysia, Philippines, Singapore, Thailand, Vietnam, & Rest of APAC; Latin America - Brazil, Colombia, Chile, Argentina, Costa Rica, & Rest of Latin America; Middle East & Africa - Algeria, Egypt, Israel, Kuwait, Nigeria, Saudi Arabia, South Africa, Turkey, United Arab Emirates, & Rest of MEA Competitive Landscape Walmart Inc., Carrefour SA, Tesco PLC, Kroger Co., Albertsons Companies, Inc., Aldi Group, Costco Wholesale Corporation, Ahold Delhaize, Metro AG, Target Corporation, Loblaws Inc., Amazon Fresh, J Sainsbury plc, Woolworths Group Limited, Koninklijke Ahold Delhaize N.V. Customization Scope Customization for segments, region/country-level will be provided. Moreover, additional customization can be done based on the requirements. Purchase Options We have three licenses to opt for: Single User License, Multi-User License (Up to 5 Users), Corporate Use License (Unlimited User and Printable PDF) -
- 1. Executive Summary
- 1.1. Definition
- 1.2. Taxonomy
- 1.3. Research Scope
- 1.4. Key Analysis
- 1.5. Key Findings by Major Segments
- 1.6. Top strategies by Major Players
- 2. Global Fresh Food Market Overview
- 2.1. Fresh Food Market Dynamics
- 2.1.1. Drivers
- 2.1.2. Opportunities
- 2.1.3. Restraints
- 2.1.4. Challenges
- 2.2. Macro-economic Factors
- 2.3. Regulatory Framework
- 2.4. Market Investment Feasibility Index
- 2.5. PEST Analysis
- 2.6. PORTER’S Five Force Analysis
- 2.7. Drivers & Restraints Impact Analysis
- 2.8. Industry Chain Analysis
- 2.9. Cost Structure Analysis
- 2.10. Marketing Strategy
- 2.11. Russia-Ukraine War Impact Analysis
- 2.12. Opportunity Map Analysis
- 2.13. Market Competition Scenario Analysis
- 2.14. Product Life Cycle Analysis
- 2.15. Opportunity Orbits
- 2.16. Manufacturer Intensity Map
- 2.17. Major Companies sales by Value & Volume
- 2.1. Fresh Food Market Dynamics
- 3. Global Fresh Food Market Analysis, Opportunity and Forecast, 2016-2032
- 3.1. Global Fresh Food Market Analysis, 2016-2021
- 3.2. Global Fresh Food Market Opportunity and Forecast, 2023-2032
- 3.3. Global Fresh Food Market Analysis, Opportunity and Forecast, By By Product Type, 2016-2032
- 3.3.1. Global Fresh Food Market Analysis by By Product Type: Introduction
- 3.3.2. Market Size Absolute $ Opportunity Analysis and Forecast, By By Product Type, 2016-2032
- 3.3.3. fresh food
- 3.3.4. Fruits and Vegetables
- 3.3.5. Meat, Poultry, and Egg
- 3.3.6. Other
- 3.4. Global Fresh Food Market Analysis, Opportunity and Forecast, By By Distribution Channel, 2016-2032
- 3.4.1. Global Fresh Food Market Analysis by By Distribution Channel: Introduction
- 3.4.2. Market Size Absolute $ Opportunity Analysis and Forecast, By By Distribution Channel, 2016-2032
- 3.4.3. Supermarket
- 3.4.4. Online
- 3.4.5. Hypermarket
- 3.4.6. Wet and Open Market
- 4. North America Fresh Food Market Analysis, Opportunity and Forecast, 2016-2032
- 4.1. North America Fresh Food Market Analysis, 2016-2021
- 4.2. North America Fresh Food Market Opportunity and Forecast, 2023-2032
- 4.3. North America Fresh Food Market Analysis, Opportunity and Forecast, By By Product Type, 2016-2032
- 4.3.1. North America Fresh Food Market Analysis by By Product Type: Introduction
- 4.3.2. Market Size Absolute $ Opportunity Analysis and Forecast, By By Product Type, 2016-2032
- 4.3.3. fresh food
- 4.3.4. Fruits and Vegetables
- 4.3.5. Meat, Poultry, and Egg
- 4.3.6. Other
- 4.4. North America Fresh Food Market Analysis, Opportunity and Forecast, By By Distribution Channel, 2016-2032
- 4.4.1. North America Fresh Food Market Analysis by By Distribution Channel: Introduction
- 4.4.2. Market Size Absolute $ Opportunity Analysis and Forecast, By By Distribution Channel, 2016-2032
- 4.4.3. Supermarket
- 4.4.4. Online
- 4.4.5. Hypermarket
- 4.4.6. Wet and Open Market
- 4.5. North America Fresh Food Market Analysis, Opportunity and Forecast, By Country , 2016-2032
- 4.5.1. North America Fresh Food Market Analysis by Country : Introduction
- 4.5.2. Market Size Absolute $ Opportunity Analysis and Forecast, Country , 2016-2032
- 4.5.2.1. The US
- 4.5.2.2. Canada
- 4.5.2.3. Mexico
- 5. Western Europe Fresh Food Market Analysis, Opportunity and Forecast, 2016-2032
- 5.1. Western Europe Fresh Food Market Analysis, 2016-2021
- 5.2. Western Europe Fresh Food Market Opportunity and Forecast, 2023-2032
- 5.3. Western Europe Fresh Food Market Analysis, Opportunity and Forecast, By By Product Type, 2016-2032
- 5.3.1. Western Europe Fresh Food Market Analysis by By Product Type: Introduction
- 5.3.2. Market Size Absolute $ Opportunity Analysis and Forecast, By By Product Type, 2016-2032
- 5.3.3. fresh food
- 5.3.4. Fruits and Vegetables
- 5.3.5. Meat, Poultry, and Egg
- 5.3.6. Other
- 5.4. Western Europe Fresh Food Market Analysis, Opportunity and Forecast, By By Distribution Channel, 2016-2032
- 5.4.1. Western Europe Fresh Food Market Analysis by By Distribution Channel: Introduction
- 5.4.2. Market Size Absolute $ Opportunity Analysis and Forecast, By By Distribution Channel, 2016-2032
- 5.4.3. Supermarket
- 5.4.4. Online
- 5.4.5. Hypermarket
- 5.4.6. Wet and Open Market
- 5.5. Western Europe Fresh Food Market Analysis, Opportunity and Forecast, By Country , 2016-2032
- 5.5.1. Western Europe Fresh Food Market Analysis by Country : Introduction
- 5.5.2. Market Size Absolute $ Opportunity Analysis and Forecast, Country , 2016-2032
- 5.5.2.1. Germany
- 5.5.2.2. France
- 5.5.2.3. The UK
- 5.5.2.4. Spain
- 5.5.2.5. Italy
- 5.5.2.6. Portugal
- 5.5.2.7. Ireland
- 5.5.2.8. Austria
- 5.5.2.9. Switzerland
- 5.5.2.10. Benelux
- 5.5.2.11. Nordic
- 5.5.2.12. Rest of Western Europe
- 6. Eastern Europe Fresh Food Market Analysis, Opportunity and Forecast, 2016-2032
- 6.1. Eastern Europe Fresh Food Market Analysis, 2016-2021
- 6.2. Eastern Europe Fresh Food Market Opportunity and Forecast, 2023-2032
- 6.3. Eastern Europe Fresh Food Market Analysis, Opportunity and Forecast, By By Product Type, 2016-2032
- 6.3.1. Eastern Europe Fresh Food Market Analysis by By Product Type: Introduction
- 6.3.2. Market Size Absolute $ Opportunity Analysis and Forecast, By By Product Type, 2016-2032
- 6.3.3. fresh food
- 6.3.4. Fruits and Vegetables
- 6.3.5. Meat, Poultry, and Egg
- 6.3.6. Other
- 6.4. Eastern Europe Fresh Food Market Analysis, Opportunity and Forecast, By By Distribution Channel, 2016-2032
- 6.4.1. Eastern Europe Fresh Food Market Analysis by By Distribution Channel: Introduction
- 6.4.2. Market Size Absolute $ Opportunity Analysis and Forecast, By By Distribution Channel, 2016-2032
- 6.4.3. Supermarket
- 6.4.4. Online
- 6.4.5. Hypermarket
- 6.4.6. Wet and Open Market
- 6.5. Eastern Europe Fresh Food Market Analysis, Opportunity and Forecast, By Country , 2016-2032
- 6.5.1. Eastern Europe Fresh Food Market Analysis by Country : Introduction
- 6.5.2. Market Size Absolute $ Opportunity Analysis and Forecast, Country , 2016-2032
- 6.5.2.1. Russia
- 6.5.2.2. Poland
- 6.5.2.3. The Czech Republic
- 6.5.2.4. Greece
- 6.5.2.5. Rest of Eastern Europe
- 7. APAC Fresh Food Market Analysis, Opportunity and Forecast, 2016-2032
- 7.1. APAC Fresh Food Market Analysis, 2016-2021
- 7.2. APAC Fresh Food Market Opportunity and Forecast, 2023-2032
- 7.3. APAC Fresh Food Market Analysis, Opportunity and Forecast, By By Product Type, 2016-2032
- 7.3.1. APAC Fresh Food Market Analysis by By Product Type: Introduction
- 7.3.2. Market Size Absolute $ Opportunity Analysis and Forecast, By By Product Type, 2016-2032
- 7.3.3. fresh food
- 7.3.4. Fruits and Vegetables
- 7.3.5. Meat, Poultry, and Egg
- 7.3.6. Other
- 7.4. APAC Fresh Food Market Analysis, Opportunity and Forecast, By By Distribution Channel, 2016-2032
- 7.4.1. APAC Fresh Food Market Analysis by By Distribution Channel: Introduction
- 7.4.2. Market Size Absolute $ Opportunity Analysis and Forecast, By By Distribution Channel, 2016-2032
- 7.4.3. Supermarket
- 7.4.4. Online
- 7.4.5. Hypermarket
- 7.4.6. Wet and Open Market
- 7.5. APAC Fresh Food Market Analysis, Opportunity and Forecast, By Country , 2016-2032
- 7.5.1. APAC Fresh Food Market Analysis by Country : Introduction
- 7.5.2. Market Size Absolute $ Opportunity Analysis and Forecast, Country , 2016-2032
- 7.5.2.1. China
- 7.5.2.2. Japan
- 7.5.2.3. South Korea
- 7.5.2.4. India
- 7.5.2.5. Australia & New Zeland
- 7.5.2.6. Indonesia
- 7.5.2.7. Malaysia
- 7.5.2.8. Philippines
- 7.5.2.9. Singapore
- 7.5.2.10. Thailand
- 7.5.2.11. Vietnam
- 7.5.2.12. Rest of APAC
- 8. Latin America Fresh Food Market Analysis, Opportunity and Forecast, 2016-2032
- 8.1. Latin America Fresh Food Market Analysis, 2016-2021
- 8.2. Latin America Fresh Food Market Opportunity and Forecast, 2023-2032
- 8.3. Latin America Fresh Food Market Analysis, Opportunity and Forecast, By By Product Type, 2016-2032
- 8.3.1. Latin America Fresh Food Market Analysis by By Product Type: Introduction
- 8.3.2. Market Size Absolute $ Opportunity Analysis and Forecast, By By Product Type, 2016-2032
- 8.3.3. fresh food
- 8.3.4. Fruits and Vegetables
- 8.3.5. Meat, Poultry, and Egg
- 8.3.6. Other
- 8.4. Latin America Fresh Food Market Analysis, Opportunity and Forecast, By By Distribution Channel, 2016-2032
- 8.4.1. Latin America Fresh Food Market Analysis by By Distribution Channel: Introduction
- 8.4.2. Market Size Absolute $ Opportunity Analysis and Forecast, By By Distribution Channel, 2016-2032
- 8.4.3. Supermarket
- 8.4.4. Online
- 8.4.5. Hypermarket
- 8.4.6. Wet and Open Market
- 8.5. Latin America Fresh Food Market Analysis, Opportunity and Forecast, By Country , 2016-2032
- 8.5.1. Latin America Fresh Food Market Analysis by Country : Introduction
- 8.5.2. Market Size Absolute $ Opportunity Analysis and Forecast, Country , 2016-2032
- 8.5.2.1. Brazil
- 8.5.2.2. Colombia
- 8.5.2.3. Chile
- 8.5.2.4. Argentina
- 8.5.2.5. Costa Rica
- 8.5.2.6. Rest of Latin America
- 9. Middle East & Africa Fresh Food Market Analysis, Opportunity and Forecast, 2016-2032
- 9.1. Middle East & Africa Fresh Food Market Analysis, 2016-2021
- 9.2. Middle East & Africa Fresh Food Market Opportunity and Forecast, 2023-2032
- 9.3. Middle East & Africa Fresh Food Market Analysis, Opportunity and Forecast, By By Product Type, 2016-2032
- 9.3.1. Middle East & Africa Fresh Food Market Analysis by By Product Type: Introduction
- 9.3.2. Market Size Absolute $ Opportunity Analysis and Forecast, By By Product Type, 2016-2032
- 9.3.3. fresh food
- 9.3.4. Fruits and Vegetables
- 9.3.5. Meat, Poultry, and Egg
- 9.3.6. Other
- 9.4. Middle East & Africa Fresh Food Market Analysis, Opportunity and Forecast, By By Distribution Channel, 2016-2032
- 9.4.1. Middle East & Africa Fresh Food Market Analysis by By Distribution Channel: Introduction
- 9.4.2. Market Size Absolute $ Opportunity Analysis and Forecast, By By Distribution Channel, 2016-2032
- 9.4.3. Supermarket
- 9.4.4. Online
- 9.4.5. Hypermarket
- 9.4.6. Wet and Open Market
- 9.5. Middle East & Africa Fresh Food Market Analysis, Opportunity and Forecast, By Country , 2016-2032
- 9.5.1. Middle East & Africa Fresh Food Market Analysis by Country : Introduction
- 9.5.2. Market Size Absolute $ Opportunity Analysis and Forecast, Country , 2016-2032
- 9.5.2.1. Algeria
- 9.5.2.2. Egypt
- 9.5.2.3. Israel
- 9.5.2.4. Kuwait
- 9.5.2.5. Nigeria
- 9.5.2.6. Saudi Arabia
- 9.5.2.7. South Africa
- 9.5.2.8. Turkey
- 9.5.2.9. The UAE
- 9.5.2.10. Rest of MEA
- 10. Global Fresh Food Market Analysis, Opportunity and Forecast, By Region , 2016-2032
- 10.1. Global Fresh Food Market Analysis by Region : Introduction
- 10.2. Market Size Absolute $ Opportunity Analysis and Forecast, By Region , 2016-2032
- 10.2.1. North America
- 10.2.2. Western Europe
- 10.2.3. Eastern Europe
- 10.2.4. APAC
- 10.2.5. Latin America
- 10.2.6. Middle East & Africa
- 11. Global Fresh Food Market Competitive Landscape, Market Share Analysis, and Company Profiles
- 11.1. Market Share Analysis
- 11.2. Company Profiles
- 11.3. Leverandørselskabet Danish Crown AmbA
- 11.3.1. Company Overview
- 11.3.2. Financial Highlights
- 11.3.3. Product Portfolio
- 11.3.4. SWOT Analysis
- 11.3.5. Key Strategies and Developments
- 11.4. Dole Food Company, Inc.
- 11.4.1. Company Overview
- 11.4.2. Financial Highlights
- 11.4.3. Product Portfolio
- 11.4.4. SWOT Analysis
- 11.4.5. Key Strategies and Developments
- 11.5. Fresh Del Monte Produce Inc.
- 11.5.1. Company Overview
- 11.5.2. Financial Highlights
- 11.5.3. Product Portfolio
- 11.5.4. SWOT Analysis
- 11.5.5. Key Strategies and Developments
- 11.6. Greenyard NV
- 11.6.1. Company Overview
- 11.6.2. Financial Highlights
- 11.6.3. Product Portfolio
- 11.6.4. SWOT Analysis
- 11.6.5. Key Strategies and Developments
- 11.7. Tyson Foods, Inc.
- 11.7.1. Company Overview
- 11.7.2. Financial Highlights
- 11.7.3. Product Portfolio
- 11.7.4. SWOT Analysis
- 11.7.5. Key Strategies and Developments
- 11.8. D'Arrigo Bros. Co. Of California, Inc.
- 11.8.1. Company Overview
- 11.8.2. Financial Highlights
- 11.8.3. Product Portfolio
- 11.8.4. SWOT Analysis
- 11.8.5. Key Strategies and Developments
- 11.9. Chiquita Brands International, Inc.
- 11.9.1. Company Overview
- 11.9.2. Financial Highlights
- 11.9.3. Product Portfolio
- 11.9.4. SWOT Analysis
- 11.9.5. Key Strategies and Developments
- 11.10. Tanimura & Antle Fresh Foods, Inc.
- 11.10.1. Company Overview
- 11.10.2. Financial Highlights
- 11.10.3. Product Portfolio
- 11.10.4. SWOT Analysis
- 11.10.5. Key Strategies and Developments
- 11.11. Taylor Fresh Foods, Inc.
- 11.11.1. Company Overview
- 11.11.2. Financial Highlights
- 11.11.3. Product Portfolio
- 11.11.4. SWOT Analysis
- 11.11.5. Key Strategies and Developments
- 11.12. Naturipe Farms, LLC
- 11.12.1. Company Overview
- 11.12.2. Financial Highlights
- 11.12.3. Product Portfolio
- 11.12.4. SWOT Analysis
- 11.12.5. Key Strategies and Developments
- 11.13. Other
- 11.13.1. Company Overview
- 11.13.2. Financial Highlights
- 11.13.3. Product Portfolio
- 11.13.4. SWOT Analysis
- 11.13.5. Key Strategies and Developments
- 12. Assumptions and Acronyms
- 13. Research Methodology
- 14. Contact
- List of Figures
- Figure 1: Global Fresh Food Market Revenue (US$ Mn) Market Share by By Product Type in 2022
- Figure 2: Global Fresh Food Market Attractiveness Analysis by By Product Type, 2016-2032
- Figure 3: Global Fresh Food Market Revenue (US$ Mn) Market Share by By Distribution Channelin 2022
- Figure 4: Global Fresh Food Market Attractiveness Analysis by By Distribution Channel, 2016-2032
- Figure 5: Global Fresh Food Market Revenue (US$ Mn) Market Share by Region in 2022
- Figure 6: Global Fresh Food Market Attractiveness Analysis by Region, 2016-2032
- Figure 7: Global Fresh Food Market Revenue (US$ Mn) (2016-2032)
- Figure 8: Global Fresh Food Market Revenue (US$ Mn) Comparison by Region (2016-2032)
- Figure 9: Global Fresh Food Market Revenue (US$ Mn) Comparison by By Product Type (2016-2032)
- Figure 10: Global Fresh Food Market Revenue (US$ Mn) Comparison by By Distribution Channel (2016-2032)
- Figure 11: Global Fresh Food Market Y-o-Y Growth Rate Comparison by Region (2016-2032)
- Figure 12: Global Fresh Food Market Y-o-Y Growth Rate Comparison by By Product Type (2016-2032)
- Figure 13: Global Fresh Food Market Y-o-Y Growth Rate Comparison by By Distribution Channel (2016-2032)
- Figure 14: Global Fresh Food Market Share Comparison by Region (2016-2032)
- Figure 15: Global Fresh Food Market Share Comparison by By Product Type (2016-2032)
- Figure 16: Global Fresh Food Market Share Comparison by By Distribution Channel (2016-2032)
- Figure 17: North America Fresh Food Market Revenue (US$ Mn) Market Share by By Product Typein 2022
- Figure 18: North America Fresh Food Market Attractiveness Analysis by By Product Type, 2016-2032
- Figure 19: North America Fresh Food Market Revenue (US$ Mn) Market Share by By Distribution Channelin 2022
- Figure 20: North America Fresh Food Market Attractiveness Analysis by By Distribution Channel, 2016-2032
- Figure 21: North America Fresh Food Market Revenue (US$ Mn) Market Share by Country in 2022
- Figure 22: North America Fresh Food Market Attractiveness Analysis by Country, 2016-2032
- Figure 23: North America Fresh Food Market Revenue (US$ Mn) (2016-2032)
- Figure 24: North America Fresh Food Market Revenue (US$ Mn) Comparison by Country (2016-2032)
- Figure 25: North America Fresh Food Market Revenue (US$ Mn) Comparison by By Product Type (2016-2032)
- Figure 26: North America Fresh Food Market Revenue (US$ Mn) Comparison by By Distribution Channel (2016-2032)
- Figure 27: North America Fresh Food Market Y-o-Y Growth Rate Comparison by Country (2016-2032)
- Figure 28: North America Fresh Food Market Y-o-Y Growth Rate Comparison by By Product Type (2016-2032)
- Figure 29: North America Fresh Food Market Y-o-Y Growth Rate Comparison by By Distribution Channel (2016-2032)
- Figure 30: North America Fresh Food Market Share Comparison by Country (2016-2032)
- Figure 31: North America Fresh Food Market Share Comparison by By Product Type (2016-2032)
- Figure 32: North America Fresh Food Market Share Comparison by By Distribution Channel (2016-2032)
- Figure 33: Western Europe Fresh Food Market Revenue (US$ Mn) Market Share by By Product Typein 2022
- Figure 34: Western Europe Fresh Food Market Attractiveness Analysis by By Product Type, 2016-2032
- Figure 35: Western Europe Fresh Food Market Revenue (US$ Mn) Market Share by By Distribution Channelin 2022
- Figure 36: Western Europe Fresh Food Market Attractiveness Analysis by By Distribution Channel, 2016-2032
- Figure 37: Western Europe Fresh Food Market Revenue (US$ Mn) Market Share by Country in 2022
- Figure 38: Western Europe Fresh Food Market Attractiveness Analysis by Country, 2016-2032
- Figure 39: Western Europe Fresh Food Market Revenue (US$ Mn) (2016-2032)
- Figure 40: Western Europe Fresh Food Market Revenue (US$ Mn) Comparison by Country (2016-2032)
- Figure 41: Western Europe Fresh Food Market Revenue (US$ Mn) Comparison by By Product Type (2016-2032)
- Figure 42: Western Europe Fresh Food Market Revenue (US$ Mn) Comparison by By Distribution Channel (2016-2032)
- Figure 43: Western Europe Fresh Food Market Y-o-Y Growth Rate Comparison by Country (2016-2032)
- Figure 44: Western Europe Fresh Food Market Y-o-Y Growth Rate Comparison by By Product Type (2016-2032)
- Figure 45: Western Europe Fresh Food Market Y-o-Y Growth Rate Comparison by By Distribution Channel (2016-2032)
- Figure 46: Western Europe Fresh Food Market Share Comparison by Country (2016-2032)
- Figure 47: Western Europe Fresh Food Market Share Comparison by By Product Type (2016-2032)
- Figure 48: Western Europe Fresh Food Market Share Comparison by By Distribution Channel (2016-2032)
- Figure 49: Eastern Europe Fresh Food Market Revenue (US$ Mn) Market Share by By Product Typein 2022
- Figure 50: Eastern Europe Fresh Food Market Attractiveness Analysis by By Product Type, 2016-2032
- Figure 51: Eastern Europe Fresh Food Market Revenue (US$ Mn) Market Share by By Distribution Channelin 2022
- Figure 52: Eastern Europe Fresh Food Market Attractiveness Analysis by By Distribution Channel, 2016-2032
- Figure 53: Eastern Europe Fresh Food Market Revenue (US$ Mn) Market Share by Country in 2022
- Figure 54: Eastern Europe Fresh Food Market Attractiveness Analysis by Country, 2016-2032
- Figure 55: Eastern Europe Fresh Food Market Revenue (US$ Mn) (2016-2032)
- Figure 56: Eastern Europe Fresh Food Market Revenue (US$ Mn) Comparison by Country (2016-2032)
- Figure 57: Eastern Europe Fresh Food Market Revenue (US$ Mn) Comparison by By Product Type (2016-2032)
- Figure 58: Eastern Europe Fresh Food Market Revenue (US$ Mn) Comparison by By Distribution Channel (2016-2032)
- Figure 59: Eastern Europe Fresh Food Market Y-o-Y Growth Rate Comparison by Country (2016-2032)
- Figure 60: Eastern Europe Fresh Food Market Y-o-Y Growth Rate Comparison by By Product Type (2016-2032)
- Figure 61: Eastern Europe Fresh Food Market Y-o-Y Growth Rate Comparison by By Distribution Channel (2016-2032)
- Figure 62: Eastern Europe Fresh Food Market Share Comparison by Country (2016-2032)
- Figure 63: Eastern Europe Fresh Food Market Share Comparison by By Product Type (2016-2032)
- Figure 64: Eastern Europe Fresh Food Market Share Comparison by By Distribution Channel (2016-2032)
- Figure 65: APAC Fresh Food Market Revenue (US$ Mn) Market Share by By Product Typein 2022
- Figure 66: APAC Fresh Food Market Attractiveness Analysis by By Product Type, 2016-2032
- Figure 67: APAC Fresh Food Market Revenue (US$ Mn) Market Share by By Distribution Channelin 2022
- Figure 68: APAC Fresh Food Market Attractiveness Analysis by By Distribution Channel, 2016-2032
- Figure 69: APAC Fresh Food Market Revenue (US$ Mn) Market Share by Country in 2022
- Figure 70: APAC Fresh Food Market Attractiveness Analysis by Country, 2016-2032
- Figure 71: APAC Fresh Food Market Revenue (US$ Mn) (2016-2032)
- Figure 72: APAC Fresh Food Market Revenue (US$ Mn) Comparison by Country (2016-2032)
- Figure 73: APAC Fresh Food Market Revenue (US$ Mn) Comparison by By Product Type (2016-2032)
- Figure 74: APAC Fresh Food Market Revenue (US$ Mn) Comparison by By Distribution Channel (2016-2032)
- Figure 75: APAC Fresh Food Market Y-o-Y Growth Rate Comparison by Country (2016-2032)
- Figure 76: APAC Fresh Food Market Y-o-Y Growth Rate Comparison by By Product Type (2016-2032)
- Figure 77: APAC Fresh Food Market Y-o-Y Growth Rate Comparison by By Distribution Channel (2016-2032)
- Figure 78: APAC Fresh Food Market Share Comparison by Country (2016-2032)
- Figure 79: APAC Fresh Food Market Share Comparison by By Product Type (2016-2032)
- Figure 80: APAC Fresh Food Market Share Comparison by By Distribution Channel (2016-2032)
- Figure 81: Latin America Fresh Food Market Revenue (US$ Mn) Market Share by By Product Typein 2022
- Figure 82: Latin America Fresh Food Market Attractiveness Analysis by By Product Type, 2016-2032
- Figure 83: Latin America Fresh Food Market Revenue (US$ Mn) Market Share by By Distribution Channelin 2022
- Figure 84: Latin America Fresh Food Market Attractiveness Analysis by By Distribution Channel, 2016-2032
- Figure 85: Latin America Fresh Food Market Revenue (US$ Mn) Market Share by Country in 2022
- Figure 86: Latin America Fresh Food Market Attractiveness Analysis by Country, 2016-2032
- Figure 87: Latin America Fresh Food Market Revenue (US$ Mn) (2016-2032)
- Figure 88: Latin America Fresh Food Market Revenue (US$ Mn) Comparison by Country (2016-2032)
- Figure 89: Latin America Fresh Food Market Revenue (US$ Mn) Comparison by By Product Type (2016-2032)
- Figure 90: Latin America Fresh Food Market Revenue (US$ Mn) Comparison by By Distribution Channel (2016-2032)
- Figure 91: Latin America Fresh Food Market Y-o-Y Growth Rate Comparison by Country (2016-2032)
- Figure 92: Latin America Fresh Food Market Y-o-Y Growth Rate Comparison by By Product Type (2016-2032)
- Figure 93: Latin America Fresh Food Market Y-o-Y Growth Rate Comparison by By Distribution Channel (2016-2032)
- Figure 94: Latin America Fresh Food Market Share Comparison by Country (2016-2032)
- Figure 95: Latin America Fresh Food Market Share Comparison by By Product Type (2016-2032)
- Figure 96: Latin America Fresh Food Market Share Comparison by By Distribution Channel (2016-2032)
- Figure 97: Middle East & Africa Fresh Food Market Revenue (US$ Mn) Market Share by By Product Typein 2022
- Figure 98: Middle East & Africa Fresh Food Market Attractiveness Analysis by By Product Type, 2016-2032
- Figure 99: Middle East & Africa Fresh Food Market Revenue (US$ Mn) Market Share by By Distribution Channelin 2022
- Figure 100: Middle East & Africa Fresh Food Market Attractiveness Analysis by By Distribution Channel, 2016-2032
- Figure 101: Middle East & Africa Fresh Food Market Revenue (US$ Mn) Market Share by Country in 2022
- Figure 102: Middle East & Africa Fresh Food Market Attractiveness Analysis by Country, 2016-2032
- Figure 103: Middle East & Africa Fresh Food Market Revenue (US$ Mn) (2016-2032)
- Figure 104: Middle East & Africa Fresh Food Market Revenue (US$ Mn) Comparison by Country (2016-2032)
- Figure 105: Middle East & Africa Fresh Food Market Revenue (US$ Mn) Comparison by By Product Type (2016-2032)
- Figure 106: Middle East & Africa Fresh Food Market Revenue (US$ Mn) Comparison by By Distribution Channel (2016-2032)
- Figure 107: Middle East & Africa Fresh Food Market Y-o-Y Growth Rate Comparison by Country (2016-2032)
- Figure 108: Middle East & Africa Fresh Food Market Y-o-Y Growth Rate Comparison by By Product Type (2016-2032)
- Figure 109: Middle East & Africa Fresh Food Market Y-o-Y Growth Rate Comparison by By Distribution Channel (2016-2032)
- Figure 110: Middle East & Africa Fresh Food Market Share Comparison by Country (2016-2032)
- Figure 111: Middle East & Africa Fresh Food Market Share Comparison by By Product Type (2016-2032)
- Figure 112: Middle East & Africa Fresh Food Market Share Comparison by By Distribution Channel (2016-2032)
List of Tables
- Table 1: Global Fresh Food Market Comparison by By Product Type (2016-2032)
- Table 2: Global Fresh Food Market Comparison by By Distribution Channel (2016-2032)
- Table 3: Global Fresh Food Market Revenue (US$ Mn) Comparison by Region (2016-2032)
- Table 4: Global Fresh Food Market Revenue (US$ Mn) (2016-2032)
- Table 5: Global Fresh Food Market Revenue (US$ Mn) Comparison by Region (2016-2032)
- Table 6: Global Fresh Food Market Revenue (US$ Mn) Comparison by By Product Type (2016-2032)
- Table 7: Global Fresh Food Market Revenue (US$ Mn) Comparison by By Distribution Channel (2016-2032)
- Table 8: Global Fresh Food Market Y-o-Y Growth Rate Comparison by Region (2016-2032)
- Table 9: Global Fresh Food Market Y-o-Y Growth Rate Comparison by By Product Type (2016-2032)
- Table 10: Global Fresh Food Market Y-o-Y Growth Rate Comparison by By Distribution Channel (2016-2032)
- Table 11: Global Fresh Food Market Share Comparison by Region (2016-2032)
- Table 12: Global Fresh Food Market Share Comparison by By Product Type (2016-2032)
- Table 13: Global Fresh Food Market Share Comparison by By Distribution Channel (2016-2032)
- Table 14: North America Fresh Food Market Comparison by By Distribution Channel (2016-2032)
- Table 15: North America Fresh Food Market Revenue (US$ Mn) Comparison by Country (2016-2032)
- Table 16: North America Fresh Food Market Revenue (US$ Mn) (2016-2032)
- Table 17: North America Fresh Food Market Revenue (US$ Mn) Comparison by Country (2016-2032)
- Table 18: North America Fresh Food Market Revenue (US$ Mn) Comparison by By Product Type (2016-2032)
- Table 19: North America Fresh Food Market Revenue (US$ Mn) Comparison by By Distribution Channel (2016-2032)
- Table 20: North America Fresh Food Market Y-o-Y Growth Rate Comparison by Country (2016-2032)
- Table 21: North America Fresh Food Market Y-o-Y Growth Rate Comparison by By Product Type (2016-2032)
- Table 22: North America Fresh Food Market Y-o-Y Growth Rate Comparison by By Distribution Channel (2016-2032)
- Table 23: North America Fresh Food Market Share Comparison by Country (2016-2032)
- Table 24: North America Fresh Food Market Share Comparison by By Product Type (2016-2032)
- Table 25: North America Fresh Food Market Share Comparison by By Distribution Channel (2016-2032)
- Table 26: Western Europe Fresh Food Market Comparison by By Product Type (2016-2032)
- Table 27: Western Europe Fresh Food Market Comparison by By Distribution Channel (2016-2032)
- Table 28: Western Europe Fresh Food Market Revenue (US$ Mn) Comparison by Country (2016-2032)
- Table 29: Western Europe Fresh Food Market Revenue (US$ Mn) (2016-2032)
- Table 30: Western Europe Fresh Food Market Revenue (US$ Mn) Comparison by Country (2016-2032)
- Table 31: Western Europe Fresh Food Market Revenue (US$ Mn) Comparison by By Product Type (2016-2032)
- Table 32: Western Europe Fresh Food Market Revenue (US$ Mn) Comparison by By Distribution Channel (2016-2032)
- Table 33: Western Europe Fresh Food Market Y-o-Y Growth Rate Comparison by Country (2016-2032)
- Table 34: Western Europe Fresh Food Market Y-o-Y Growth Rate Comparison by By Product Type (2016-2032)
- Table 35: Western Europe Fresh Food Market Y-o-Y Growth Rate Comparison by By Distribution Channel (2016-2032)
- Table 36: Western Europe Fresh Food Market Share Comparison by Country (2016-2032)
- Table 37: Western Europe Fresh Food Market Share Comparison by By Product Type (2016-2032)
- Table 38: Western Europe Fresh Food Market Share Comparison by By Distribution Channel (2016-2032)
- Table 39: Eastern Europe Fresh Food Market Comparison by By Product Type (2016-2032)
- Table 40: Eastern Europe Fresh Food Market Comparison by By Distribution Channel (2016-2032)
- Table 41: Eastern Europe Fresh Food Market Revenue (US$ Mn) Comparison by Country (2016-2032)
- Table 42: Eastern Europe Fresh Food Market Revenue (US$ Mn) (2016-2032)
- Table 43: Eastern Europe Fresh Food Market Revenue (US$ Mn) Comparison by Country (2016-2032)
- Table 44: Eastern Europe Fresh Food Market Revenue (US$ Mn) Comparison by By Product Type (2016-2032)
- Table 45: Eastern Europe Fresh Food Market Revenue (US$ Mn) Comparison by By Distribution Channel (2016-2032)
- Table 46: Eastern Europe Fresh Food Market Y-o-Y Growth Rate Comparison by Country (2016-2032)
- Table 47: Eastern Europe Fresh Food Market Y-o-Y Growth Rate Comparison by By Product Type (2016-2032)
- Table 48: Eastern Europe Fresh Food Market Y-o-Y Growth Rate Comparison by By Distribution Channel (2016-2032)
- Table 49: Eastern Europe Fresh Food Market Share Comparison by Country (2016-2032)
- Table 50: Eastern Europe Fresh Food Market Share Comparison by By Product Type (2016-2032)
- Table 51: Eastern Europe Fresh Food Market Share Comparison by By Distribution Channel (2016-2032)
- Table 52: APAC Fresh Food Market Comparison by By Product Type (2016-2032)
- Table 53: APAC Fresh Food Market Comparison by By Distribution Channel (2016-2032)
- Table 54: APAC Fresh Food Market Revenue (US$ Mn) Comparison by Country (2016-2032)
- Table 55: APAC Fresh Food Market Revenue (US$ Mn) (2016-2032)
- Table 56: APAC Fresh Food Market Revenue (US$ Mn) Comparison by Country (2016-2032)
- Table 57: APAC Fresh Food Market Revenue (US$ Mn) Comparison by By Product Type (2016-2032)
- Table 58: APAC Fresh Food Market Revenue (US$ Mn) Comparison by By Distribution Channel (2016-2032)
- Table 59: APAC Fresh Food Market Y-o-Y Growth Rate Comparison by Country (2016-2032)
- Table 60: APAC Fresh Food Market Y-o-Y Growth Rate Comparison by By Product Type (2016-2032)
- Table 61: APAC Fresh Food Market Y-o-Y Growth Rate Comparison by By Distribution Channel (2016-2032)
- Table 62: APAC Fresh Food Market Share Comparison by Country (2016-2032)
- Table 63: APAC Fresh Food Market Share Comparison by By Product Type (2016-2032)
- Table 64: APAC Fresh Food Market Share Comparison by By Distribution Channel (2016-2032)
- Table 65: Latin America Fresh Food Market Comparison by By Product Type (2016-2032)
- Table 66: Latin America Fresh Food Market Comparison by By Distribution Channel (2016-2032)
- Table 67: Latin America Fresh Food Market Revenue (US$ Mn) Comparison by Country (2016-2032)
- Table 68: Latin America Fresh Food Market Revenue (US$ Mn) (2016-2032)
- Table 69: Latin America Fresh Food Market Revenue (US$ Mn) Comparison by Country (2016-2032)
- Table 70: Latin America Fresh Food Market Revenue (US$ Mn) Comparison by By Product Type (2016-2032)
- Table 71: Latin America Fresh Food Market Revenue (US$ Mn) Comparison by By Distribution Channel (2016-2032)
- Table 72: Latin America Fresh Food Market Y-o-Y Growth Rate Comparison by Country (2016-2032)
- Table 73: Latin America Fresh Food Market Y-o-Y Growth Rate Comparison by By Product Type (2016-2032)
- Table 74: Latin America Fresh Food Market Y-o-Y Growth Rate Comparison by By Distribution Channel (2016-2032)
- Table 75: Latin America Fresh Food Market Share Comparison by Country (2016-2032)
- Table 76: Latin America Fresh Food Market Share Comparison by By Product Type (2016-2032)
- Table 77: Latin America Fresh Food Market Share Comparison by By Distribution Channel (2016-2032)
- Table 78: Middle East & Africa Fresh Food Market Comparison by By Product Type (2016-2032)
- Table 79: Middle East & Africa Fresh Food Market Comparison by By Distribution Channel (2016-2032)
- Table 80: Middle East & Africa Fresh Food Market Revenue (US$ Mn) Comparison by Country (2016-2032)
- Table 81: Middle East & Africa Fresh Food Market Revenue (US$ Mn) (2016-2032)
- Table 82: Middle East & Africa Fresh Food Market Revenue (US$ Mn) Comparison by Country (2016-2032)
- Table 83: Middle East & Africa Fresh Food Market Revenue (US$ Mn) Comparison by By Product Type (2016-2032)
- Table 84: Middle East & Africa Fresh Food Market Revenue (US$ Mn) Comparison by By Distribution Channel (2016-2032)
- Table 85: Middle East & Africa Fresh Food Market Y-o-Y Growth Rate Comparison by Country (2016-2032)
- Table 86: Middle East & Africa Fresh Food Market Y-o-Y Growth Rate Comparison by By Product Type (2016-2032)
- Table 87: Middle East & Africa Fresh Food Market Y-o-Y Growth Rate Comparison by By Distribution Channel (2016-2032)
- Table 88: Middle East & Africa Fresh Food Market Share Comparison by Country (2016-2032)
- Table 89: Middle East & Africa Fresh Food Market Share Comparison by By Product Type (2016-2032)
- Table 90: Middle East & Africa Fresh Food Market Share Comparison by By Distribution Channel (2016-2032)
- 1. Executive Summary
-
- Walmart Inc.
- Carrefour SA
- Tesco PLC
- Kroger Co.
- Albertsons Companies, Inc.
- Aldi Group
- Costco Wholesale Corporation
- Ahold Delhaize
- Metro AG
- Target Corporation
- Loblaws Inc.
- Amazon Fresh
- J Sainsbury plc
- Woolworths Group Limited
- Koninklijke Ahold Delhaize N.V
Our Clients


View Our Licence Options
