
Fish Protein Market By Type (Fish Protein Hydrolysate, Fish Protein Concentrate and others), By End-Use (Food and Beverages, Sport Nutrition & Dietary Supplements and Others), By Region And Companies - Industry Segment Outlook, Market Assessment, Competition Scenario, Trends, And Forecast 2023-2032
-
37548
-
June 2023
-
160
-


-
This report was compiled by Shreyas Rokade Shreyas Rokade is a seasoned Research Analyst with CMFE, bringing extensive expertise in market research and consulting, with a strong background in Chemical Engineering. Correspondence Team Lead-CMFE Linkedin | Detailed Market research Methodology Our methodology involves a mix of primary research, including interviews with leading mental health experts, and secondary research from reputable medical journals and databases. View Detailed Methodology Page
-
Quick Navigation
Report Overview
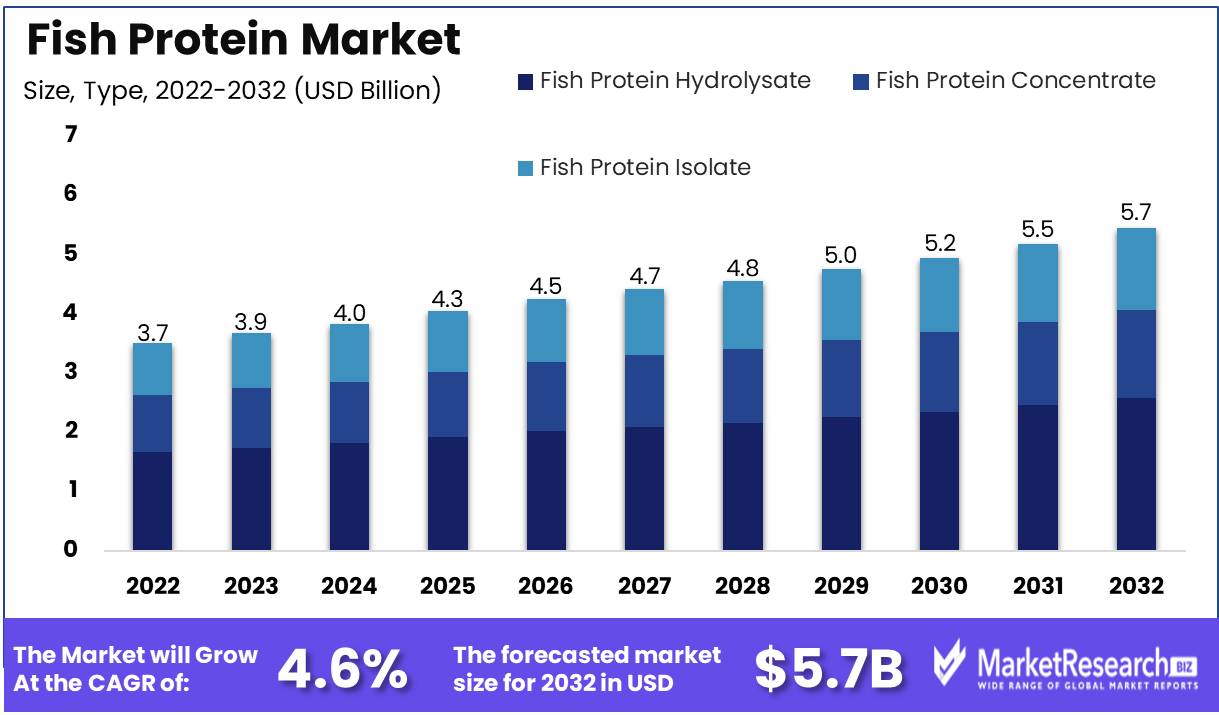
Fish Protein Market size is expected to be worth around USD 5.7 Bn by 2032 from USD 3.7 Bn in 2022, growing at a CAGR of 4.6% during the forecast period from 2023 to 2032.
A fish protein, a highly valuable source of protein derived from fish products such as fish meals and fish oils, comprises a vast multitude of products within the expansive global fish protein market. This market consists of fish protein concentrates, fish protein hydrolysates, and fish protein powders, all of which are packed with unmatched nutritional value. Minerals such as amino acids, omega-3 fatty acids, calcium, and iron are abundant in this nutrient-dense protein.
Fish protein offers a sustainable alternative to conventional animal protein sources such as beef and poultry. Not only does the production of fish protein produce fewer greenhouse gas emissions than conventional livestock husbandry, but it also requires less land and water. Additionally, the easily digestible and allergen-free nature of fish protein makes it optimal for those with food allergies or sensitivities.
In terms of product innovation and production methods, the fish protein market has undergone significant development. Among these innovations, the use of fish protein derived from algae stands out because it employs eco-friendly and sustainable practices. The development of fish-protein-based munchies and ready-to-eat meals in response to the rising demand for convenient and nutrient-dense food options is another noteworthy trend.
The rising demand for fish protein has encouraged major food companies to make substantial investments in the industry. Nestle, for example, has introduced a line of plant-based fish products made from pea protein, and Cargill has developed sustainable fish feed made from plant-based ingredients. In addition, numerous food companies have begun incorporating fish protein into their product offerings to satisfy the soaring demand for healthy and environmentally sustainable food options.
Driving factors
Expansion of the Aquaculture Industry and Technological Innovations
This market is also being driven by the expansion of the aquaculture industry. Aquaculture is a rapidly expanding industry that produces an unprecedented amount of fish protein. As farmers discover new and inventive methods to increase production, the availability of fish protein also increases. Innovations in the extraction and refining of fish protein also contribute to the expansion of this market. New and improved techniques make it simpler to extract proteins from fish, making the production of fish protein products more efficient and cost-effective.
Potential Challenges and Impact of Regulations on the Market
While a number of factors are driving the growth of the Global Fish Protein Market, there are also potential obstacles that could have an effect on this market. Changes in regulations may have an impact on the production and distribution of fish protein products. New regulations may necessitate additional testing or labeling requirements, which could increase costs and have an effect on supply. In the future, emerging technologies like plant-based proteins could disrupt the market and compete with marine proteins.
Emerging Trends and Changes in Consumer Preferences
As consumer preferences continue to change, emergent trends or shifts in consumer behavior may have an effect on the Global Fish Protein Market. Increasing interest in sustainable and locally sourced food products, for instance, is prompting some consumers to seek out alternative protein sources. These behavioral shifts may present new opportunities for producers and suppliers of fish proteins.
Restraining Factors
Changing fish prices and availability
With the rising global demand for fish and seafood, it is unsurprising that the supply is diminishing, especially for wild-caught products. Consequently, fluctuating fish prices and availability remain significant obstacles for the fish protein industry. This trend has a significant impact on fish protein producers, as higher prices and inconsistent supply can result in increased competition among producers and increased distribution and production expenses.
Potential environmental concerns related to overfishing
Globally ubiquitous overfishing has led to severe ecological consequences. These include the devastation of marine ecosystems and the depletion of fish populations. The environmental consequences have sparked significant concern among consumers, leading to an increase in the demand for sustainably harvested, environmentally favorable seafood products. As a result, a number of regulations have been implemented to certify sustainable fishing practices. Enhance your health with Fish Oil, a vital component in the Fish Protein Market and a source of omega-3 fatty acids.
Type Analysis
The fish protein market has become an increasingly vital component of the global protein market. The Fish Protein Hydrolysate (FPH) segment within this market has been dominating the market and is anticipated to continue doing so. This particular segment contains a variety of hydrolyzed products designed to break down proteins into smaller peptides and amino acids. These items are derived from a variety of fish sources, including both wild-caught and domesticated varieties.
The FPH segment currently claims the largest share of the global fish protein market, and this trend is anticipated to continue. This is partially due to the numerous health benefits associated with this form of protein. Fish protein hydrolysate is abundant in essential amino acids, peptides, and nutrients that are advantageous for human nutrition, animal feed, and pet food. In addition, these products are environmentally friendly and inexpensive, making them a popular option among manufacturers.
End Use Analysis
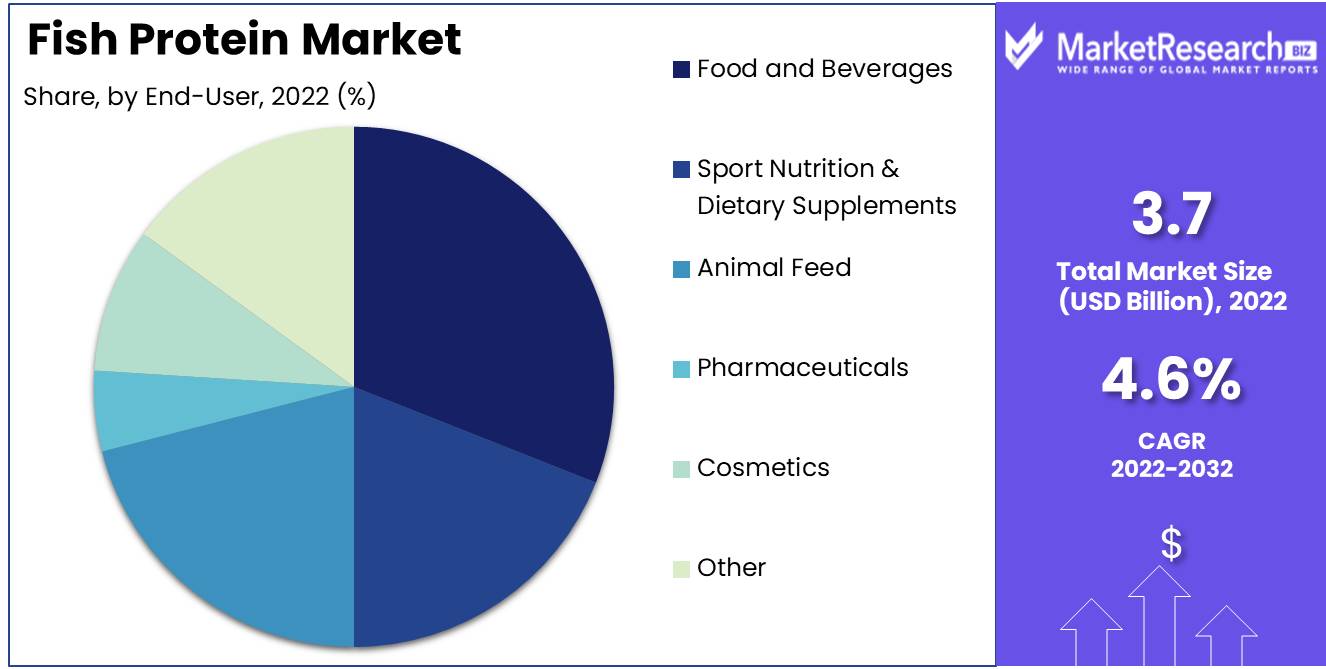
In terms of application, the food and beverages segment claims the largest share of the global fish protein market. This particular segment encompasses a wide variety of food and beverage industry-related products. These items consist of fresh fish, canned fish, frozen fish, fish fillets, and numerous fish products that have been processed. In recent years, the segment of food and beverages has expanded rapidly, propelled in part by the rising demand for protein products in emerging economies.
Similarly to the FPH segment, economic expansion in emerging economies has played a significant role in driving the growth of the food and beverages segment. As these economies continue to expand, there is a growing demand for high-quality protein products to meet the population's requirements. Due to their nutritional value and affordability, fish products have generally been a popular option. Because of this, it is anticipated that the food and beverages segment will continue to expand rapidly over the future years.
Key Market Segments
By Type
- Fish Protein Hydrolysate
- Fish Protein Concentrate
- Fish Protein Isolate
By End-Use
- Food and Beverages
- Sport Nutrition & Dietary Supplements
- Animal Feed
- Pharmaceuticals
- Cosmetics
- Other
Growth Opportunity
Development of Value-added Fish Protein Products
In recent years, the demand for fish protein products with added value, such as fish protein hydrolysates, surimi, and fish protein concentrates, has increased. This trend is primarily attributable to the numerous health benefits of fish protein, such as omega-3 fatty acids, minerals, and vitamins.
Fish protein hydrolysates are produced by hydrolyzing fish proteins into smaller, more easily digestible peptides. Due to their emulsifying and gelling properties, they are used as functional constituents in various food products such as sauces, soups, and nutritional bars.
Surimi, on the other hand, is a processed fish product that is frequently used to make imitation crab flesh. It is produced by washing and refining fish tissue in order to remove fats, bones, and other impurities. The result is then combined with ingredients such as starch, sugar, and sodium.
Expansion of sustainable aquaculture practices
Aquaculture is the world's fastest-growing food-producing industry. The development of the aquaculture industry has been fueled by the rising global demand for seafood and the depletion of wild fish stocks. However, environmental concerns such as pollution, disease outbreaks, and the overuse of antibiotics have accompanied the expansion of the industry.
Aquaculture practices that are sustainable balance economic, social, and environmental factors. Fish farmers are increasingly implementing sustainable aquaculture practices, such as the use of organic feeds, reduced antibiotic use, and eco-friendly water treatment systems. These practices serve to reduce the environmental impact of aquaculture while ensuring a healthy and sustainable fish supply.
Latest Trends
Fish Protein Concentrates and Isolates
Due to their high nutritional value and numerous health benefits, fish protein concentrates and isolates are gaining popularity in the food industry. These items contain an abundance of protein, omega-3 fatty acids, and minerals such as calcium, phosphorus, and iodine. In addition to being low in fat and cholesterol, fish protein concentrates and isolates are ideal for those seeking healthier food options.
Diverse industries, such as the food and beverage, pharmaceutical, and sports nutrition sectors, are experiencing a rise in demand for fish protein concentrates and isolates. These products are used in the food industry to produce high-protein snacks, baked goods, and dairy alternatives. As a natural and effective source of protein for athletes and fitness enthusiasts, fish protein concentrates and isolates are incorporated into protein powders, bars, and smoothies in the sports nutrition industry.
Utilization of Fish Proteins in Sports Nutrition and Dietary Supplements
Because of its high protein content, bioavailability, and low lipid content, fish protein has become a popular ingredient in sports nutrition and dietary supplements. Fish protein is especially advantageous for athletes and fitness enthusiasts because it helps to develop and repair muscles, reduce inflammation and soreness, and boost overall exercise performance.
Fish protein is also abundant in essential amino acids, such as leucine, which is known to promote muscle protein synthesis and growth. Thus, fish protein is a desirable alternative to whey, casein, and soy proteins. In the sports nutrition industry, the demand for natural and sustainable protein sources is driving the development of fish protein.
Regional Analysis
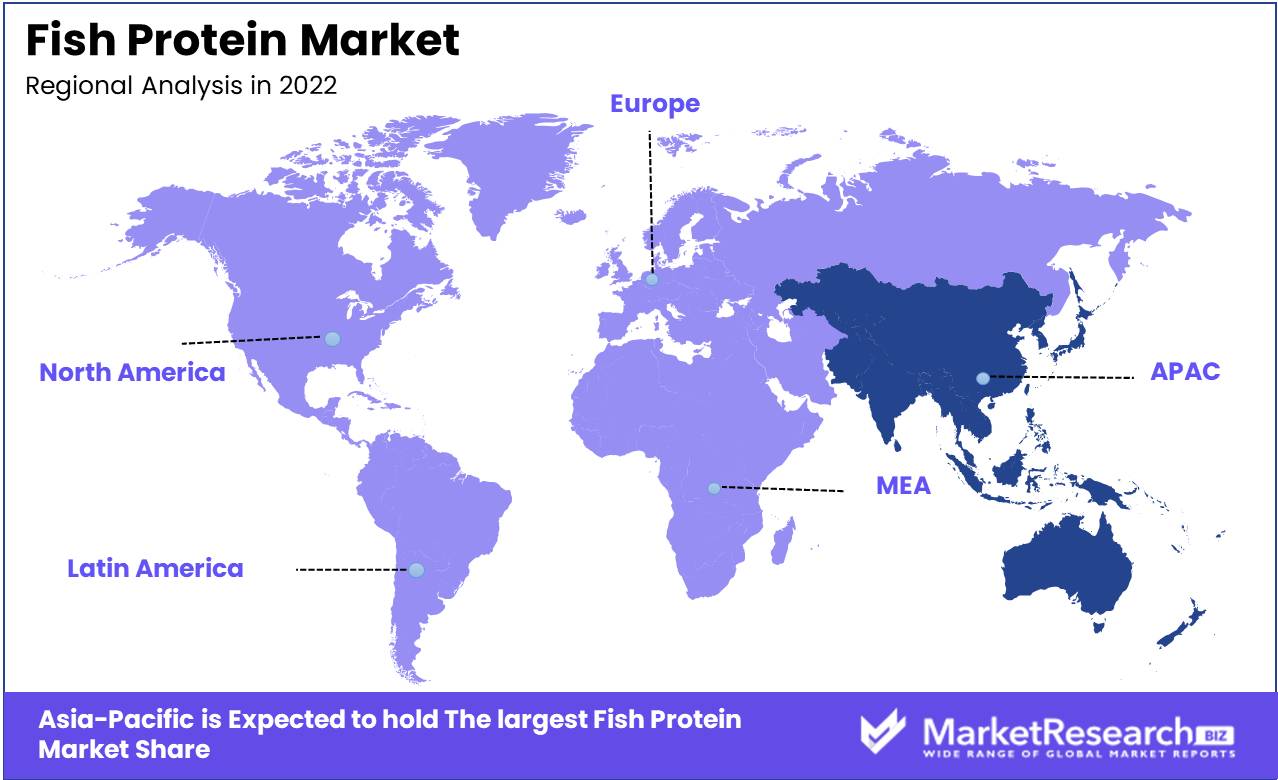
Asia-Pacific has dominated the fish protein market in terms of both production and consumption. Due to their nutritional value, fish products have acquired immense popularity as the global demand for food has increased. The Asia-Pacific region contains some of the world's most populous nations, including China, India, and Japan. Due to the population's high demand for marine products in these nations, fish protein consumption has increased.
Several factors, including government support, technological advancements, and the availability of natural resources, have contributed to the region's dominance in the fish protein market. The Asia-Pacific region has favorable climatic conditions and access to numerous bodies of water, making it simpler for fishermen to catch fish.
China is the region's leading producer of fish protein, making it a significant player on the global market. Numerous fishing fleets in China's littoral regions can harvest vast quantities of fish, supplying both domestic and international markets. In addition, significant progress has been made in the aquaculture industry, allowing producers to produce fish protein without depleting natural resources.
Japan is another Asia-Pacific nation with a significant presence in the fish protein market. The nation has a distinctive culture that regards seafood as a delicacy, making it one of the world's largest importers of fish protein. Japan possesses the technology and expertise necessary to ensure the high quality of the fish protein products it imports.
Key Regions and Countries
North America
- US
- Canada
- Mexico
Western Europe
- Germany
- France
- The UK
- Spain
- Italy
- Portugal
- Ireland
- Austria
- Switzerland
- Benelux
- Nordic
- Rest of Western Europe
Eastern Europe
- Russia
- Poland
- The Czech Republic
- Greece
- Rest of Eastern Europe
APAC
- China
- Japan
- South Korea
- India
- Australia & New Zealand
- Indonesia
- Malaysia
- Philippines
- Singapore
- Thailand
- Vietnam
- Rest of APAC
Latin America
- Brazil
- Colombia
- Chile
- Argentina
- Costa Rica
- Rest of Latin America
Middle East & Africa
- Algeria
- Egypt
- Israel
- Kuwait
- Nigeria
- Saudi Arabia
- South Africa
- Turkey
- United Arab Emirates
- Rest of MEA
Key Players Analysis
Croda International PLC - This UK-based company is one of the industry's top players and offers an extensive selection of fish-based protein ingredients. Their products are utilized in numerous industries, such as the food and beverage, animal feed, and cosmetics sectors.
Omega Protein Corporation - This U.S.-based corporation specializes in producing animal feed and aquaculture protein products derived from fishmeal & fish oil. They conduct business in numerous nations, including the United States, Canada, and South America.
Scanbio AS - This Norwegian company offers high-quality protein products derived from sustainable fishmeal and fish oil. Aquaculture, agriculture, and the pet food industry are among the industries they serve.
Corbion N.V. - This Dutch company provides an array of innovative fish protein constituents derived from a variety of fish sources. Their products are utilized in the food and beverage industry, and they conduct business on a global scale.
Cargill, Incorporated - This U.S.-based company specializes in manufacturing high-quality fishmeal and fish oil-based protein products for the animal feed and aquaculture industries. They conduct business in a variety of nations, including Thailand, India, and Vietnam.
Top Key Players
- DSM
- Bio-Marine Ingredients Ireland Ltd
- QINGDAO FUTURE GROUP
- BioOregon Protein
- Mukka Seafood Industries Limited
- Bevenovo Corporation Limited
- Copalis
- ScanBio Marine Group
- Nutrifish
- Other
Recent Development
- In 2021, Salmon Evolution announced that it intends to construct a new land-based salmon farm in Norway is thrilling news for the global fish protein market. With a strong emphasis on sustainability and eco-friendly practices, the company is committed to providing both cost-effective and environmentally responsible products of the highest quality.
- In 2022, Aquantix will announce a revolutionary new technology that will enable the efficient production of fish protein from waste streams, resulting in even more innovation in the industry. This innovation will not only revolutionize the industry's operations but also eradicate waste and improve resource management.
- In 2023, A new line of plant-based tuna products from Good Catch Foods is set to debut. This new product is set to liven up the market and give consumers even more options in response to the rising demand for sustainable alternatives to traditional seafood.
Report Scope
Report Features Description Market Value (2022) USD 3.7 Bn Forecast Revenue (2032) USD 5.80 Bn CAGR (2023-2032) 4.6% Base Year for Estimation 2022 Historic Period 2016-2022 Forecast Period 2023-2032 Report Coverage Revenue Forecast, Market Dynamics, COVID-19 Impact, Competitive Landscape, Recent Developments Segments Covered By Type - Fish Protein Hydrolysate
- Fish Protein Concentrate
- Fish Protein Isolate
By End-Use
- Food and Beverages
- Sport Nutrition & Dietary Supplements
- Animal Feed
- Pharmaceuticals
- Cosmetics
- Other
Regional Analysis North America – The US, Canada, & Mexico; Western Europe – Germany, France, The UK, Spain, Italy, Portugal, Ireland, Austria, Switzerland, Benelux, Nordic, & Rest of Western Europe; Eastern Europe – Russia, Poland, The Czech Republic, Greece, & Rest of Eastern Europe; APAC – China, Japan, South Korea, India, Australia & New Zealand, Indonesia, Malaysia, Philippines, Singapore, Thailand, Vietnam, & Rest of APAC; Latin America – Brazil, Colombia, Chile, Argentina, Costa Rica, & Rest of Latin America; Middle East & Africa – Algeria, Egypt, Israel, Kuwait, Nigeria, Saudi Arabia, South Africa, Turkey, United Arab Emirates, & Rest of MEA Competitive Landscape DSM, Bio-Marine Ingredients Ireland Ltd, QINGDAO FUTURE GROUP, BioOregon Protein, Mukka Sea food Industries Limited, Bevenovo Corporation Limited, Copalis, ScanBio Marine Group, Nutrifish, Other Customization Scope Customization for segments, region/country-level will be provided. Moreover, additional customization can be done based on the requirements. Purchase Options We have three licenses to opt for: Single User License, Multi-User License (Up to 5 Users), Corporate Use License (Unlimited User and Printable PDF) -
- 1. Executive Summary
- 1.1. Definition
- 1.2. Taxonomy
- 1.3. Research Scope
- 1.4. Key Analysis
- 1.5. Key Findings by Major Segments
- 1.6. Top strategies by Major Players
- 2. Global Fish Protein Market Overview
- 2.1. Fish Protein Market Dynamics
- 2.1.1. Drivers
- 2.1.2. Opportunities
- 2.1.3. Restraints
- 2.1.4. Challenges
- 2.2. Macro-economic Factors
- 2.3. Regulatory Framework
- 2.4. Market Investment Feasibility Index
- 2.5. PEST Analysis
- 2.6. PORTER’S Five Force Analysis
- 2.7. Drivers & Restraints Impact Analysis
- 2.8. Industry Chain Analysis
- 2.9. Cost Structure Analysis
- 2.10. Marketing Strategy
- 2.11. Russia-Ukraine War Impact Analysis
- 2.12. Opportunity Map Analysis
- 2.13. Market Competition Scenario Analysis
- 2.14. Product Life Cycle Analysis
- 2.15. Opportunity Orbits
- 2.16. Manufacturer Intensity Map
- 2.17. Major Companies sales by Value & Volume
- 2.1. Fish Protein Market Dynamics
- 3. Global Fish Protein Market Analysis, Opportunity and Forecast, 2016-2032
- 3.1. Global Fish Protein Market Analysis, 2016-2021
- 3.2. Global Fish Protein Market Opportunity and Forecast, 2023-2032
- 3.3. Global Fish Protein Market Analysis, Opportunity and Forecast, By By Type, 2016-2032
- 3.3.1. Global Fish Protein Market Analysis by By Type: Introduction
- 3.3.2. Market Size Absolute $ Opportunity Analysis and Forecast, By By Type, 2016-2032
- 3.3.3. Fish Protein Hydrolysate
- 3.3.4. Fish Protein Concentrate
- 3.3.5. Fish Protein Isolate
- 3.4. Global Fish Protein Market Analysis, Opportunity and Forecast, By By End-Use, 2016-2032
- 3.4.1. Global Fish Protein Market Analysis by By End-Use: Introduction
- 3.4.2. Market Size Absolute $ Opportunity Analysis and Forecast, By By End-Use, 2016-2032
- 3.4.3. Food and Beverages
- 3.4.4. Sport Nutrition & Dietary Supplements
- 3.4.5. Animal Feed
- 3.4.6. Pharmaceuticals
- 3.4.7. Cosmetics
- 3.4.8. Other
- 4. North America Fish Protein Market Analysis, Opportunity and Forecast, 2016-2032
- 4.1. North America Fish Protein Market Analysis, 2016-2021
- 4.2. North America Fish Protein Market Opportunity and Forecast, 2023-2032
- 4.3. North America Fish Protein Market Analysis, Opportunity and Forecast, By By Type, 2016-2032
- 4.3.1. North America Fish Protein Market Analysis by By Type: Introduction
- 4.3.2. Market Size Absolute $ Opportunity Analysis and Forecast, By By Type, 2016-2032
- 4.3.3. Fish Protein Hydrolysate
- 4.3.4. Fish Protein Concentrate
- 4.3.5. Fish Protein Isolate
- 4.4. North America Fish Protein Market Analysis, Opportunity and Forecast, By By End-Use, 2016-2032
- 4.4.1. North America Fish Protein Market Analysis by By End-Use: Introduction
- 4.4.2. Market Size Absolute $ Opportunity Analysis and Forecast, By By End-Use, 2016-2032
- 4.4.3. Food and Beverages
- 4.4.4. Sport Nutrition & Dietary Supplements
- 4.4.5. Animal Feed
- 4.4.6. Pharmaceuticals
- 4.4.7. Cosmetics
- 4.4.8. Other
- 4.5. North America Fish Protein Market Analysis, Opportunity and Forecast, By Country , 2016-2032
- 4.5.1. North America Fish Protein Market Analysis by Country : Introduction
- 4.5.2. Market Size Absolute $ Opportunity Analysis and Forecast, Country , 2016-2032
- 4.5.2.1. The US
- 4.5.2.2. Canada
- 4.5.2.3. Mexico
- 5. Western Europe Fish Protein Market Analysis, Opportunity and Forecast, 2016-2032
- 5.1. Western Europe Fish Protein Market Analysis, 2016-2021
- 5.2. Western Europe Fish Protein Market Opportunity and Forecast, 2023-2032
- 5.3. Western Europe Fish Protein Market Analysis, Opportunity and Forecast, By By Type, 2016-2032
- 5.3.1. Western Europe Fish Protein Market Analysis by By Type: Introduction
- 5.3.2. Market Size Absolute $ Opportunity Analysis and Forecast, By By Type, 2016-2032
- 5.3.3. Fish Protein Hydrolysate
- 5.3.4. Fish Protein Concentrate
- 5.3.5. Fish Protein Isolate
- 5.4. Western Europe Fish Protein Market Analysis, Opportunity and Forecast, By By End-Use, 2016-2032
- 5.4.1. Western Europe Fish Protein Market Analysis by By End-Use: Introduction
- 5.4.2. Market Size Absolute $ Opportunity Analysis and Forecast, By By End-Use, 2016-2032
- 5.4.3. Food and Beverages
- 5.4.4. Sport Nutrition & Dietary Supplements
- 5.4.5. Animal Feed
- 5.4.6. Pharmaceuticals
- 5.4.7. Cosmetics
- 5.4.8. Other
- 5.5. Western Europe Fish Protein Market Analysis, Opportunity and Forecast, By Country , 2016-2032
- 5.5.1. Western Europe Fish Protein Market Analysis by Country : Introduction
- 5.5.2. Market Size Absolute $ Opportunity Analysis and Forecast, Country , 2016-2032
- 5.5.2.1. Germany
- 5.5.2.2. France
- 5.5.2.3. The UK
- 5.5.2.4. Spain
- 5.5.2.5. Italy
- 5.5.2.6. Portugal
- 5.5.2.7. Ireland
- 5.5.2.8. Austria
- 5.5.2.9. Switzerland
- 5.5.2.10. Benelux
- 5.5.2.11. Nordic
- 5.5.2.12. Rest of Western Europe
- 6. Eastern Europe Fish Protein Market Analysis, Opportunity and Forecast, 2016-2032
- 6.1. Eastern Europe Fish Protein Market Analysis, 2016-2021
- 6.2. Eastern Europe Fish Protein Market Opportunity and Forecast, 2023-2032
- 6.3. Eastern Europe Fish Protein Market Analysis, Opportunity and Forecast, By By Type, 2016-2032
- 6.3.1. Eastern Europe Fish Protein Market Analysis by By Type: Introduction
- 6.3.2. Market Size Absolute $ Opportunity Analysis and Forecast, By By Type, 2016-2032
- 6.3.3. Fish Protein Hydrolysate
- 6.3.4. Fish Protein Concentrate
- 6.3.5. Fish Protein Isolate
- 6.4. Eastern Europe Fish Protein Market Analysis, Opportunity and Forecast, By By End-Use, 2016-2032
- 6.4.1. Eastern Europe Fish Protein Market Analysis by By End-Use: Introduction
- 6.4.2. Market Size Absolute $ Opportunity Analysis and Forecast, By By End-Use, 2016-2032
- 6.4.3. Food and Beverages
- 6.4.4. Sport Nutrition & Dietary Supplements
- 6.4.5. Animal Feed
- 6.4.6. Pharmaceuticals
- 6.4.7. Cosmetics
- 6.4.8. Other
- 6.5. Eastern Europe Fish Protein Market Analysis, Opportunity and Forecast, By Country , 2016-2032
- 6.5.1. Eastern Europe Fish Protein Market Analysis by Country : Introduction
- 6.5.2. Market Size Absolute $ Opportunity Analysis and Forecast, Country , 2016-2032
- 6.5.2.1. Russia
- 6.5.2.2. Poland
- 6.5.2.3. The Czech Republic
- 6.5.2.4. Greece
- 6.5.2.5. Rest of Eastern Europe
- 7. APAC Fish Protein Market Analysis, Opportunity and Forecast, 2016-2032
- 7.1. APAC Fish Protein Market Analysis, 2016-2021
- 7.2. APAC Fish Protein Market Opportunity and Forecast, 2023-2032
- 7.3. APAC Fish Protein Market Analysis, Opportunity and Forecast, By By Type, 2016-2032
- 7.3.1. APAC Fish Protein Market Analysis by By Type: Introduction
- 7.3.2. Market Size Absolute $ Opportunity Analysis and Forecast, By By Type, 2016-2032
- 7.3.3. Fish Protein Hydrolysate
- 7.3.4. Fish Protein Concentrate
- 7.3.5. Fish Protein Isolate
- 7.4. APAC Fish Protein Market Analysis, Opportunity and Forecast, By By End-Use, 2016-2032
- 7.4.1. APAC Fish Protein Market Analysis by By End-Use: Introduction
- 7.4.2. Market Size Absolute $ Opportunity Analysis and Forecast, By By End-Use, 2016-2032
- 7.4.3. Food and Beverages
- 7.4.4. Sport Nutrition & Dietary Supplements
- 7.4.5. Animal Feed
- 7.4.6. Pharmaceuticals
- 7.4.7. Cosmetics
- 7.4.8. Other
- 7.5. APAC Fish Protein Market Analysis, Opportunity and Forecast, By Country , 2016-2032
- 7.5.1. APAC Fish Protein Market Analysis by Country : Introduction
- 7.5.2. Market Size Absolute $ Opportunity Analysis and Forecast, Country , 2016-2032
- 7.5.2.1. China
- 7.5.2.2. Japan
- 7.5.2.3. South Korea
- 7.5.2.4. India
- 7.5.2.5. Australia & New Zeland
- 7.5.2.6. Indonesia
- 7.5.2.7. Malaysia
- 7.5.2.8. Philippines
- 7.5.2.9. Singapore
- 7.5.2.10. Thailand
- 7.5.2.11. Vietnam
- 7.5.2.12. Rest of APAC
- 8. Latin America Fish Protein Market Analysis, Opportunity and Forecast, 2016-2032
- 8.1. Latin America Fish Protein Market Analysis, 2016-2021
- 8.2. Latin America Fish Protein Market Opportunity and Forecast, 2023-2032
- 8.3. Latin America Fish Protein Market Analysis, Opportunity and Forecast, By By Type, 2016-2032
- 8.3.1. Latin America Fish Protein Market Analysis by By Type: Introduction
- 8.3.2. Market Size Absolute $ Opportunity Analysis and Forecast, By By Type, 2016-2032
- 8.3.3. Fish Protein Hydrolysate
- 8.3.4. Fish Protein Concentrate
- 8.3.5. Fish Protein Isolate
- 8.4. Latin America Fish Protein Market Analysis, Opportunity and Forecast, By By End-Use, 2016-2032
- 8.4.1. Latin America Fish Protein Market Analysis by By End-Use: Introduction
- 8.4.2. Market Size Absolute $ Opportunity Analysis and Forecast, By By End-Use, 2016-2032
- 8.4.3. Food and Beverages
- 8.4.4. Sport Nutrition & Dietary Supplements
- 8.4.5. Animal Feed
- 8.4.6. Pharmaceuticals
- 8.4.7. Cosmetics
- 8.4.8. Other
- 8.5. Latin America Fish Protein Market Analysis, Opportunity and Forecast, By Country , 2016-2032
- 8.5.1. Latin America Fish Protein Market Analysis by Country : Introduction
- 8.5.2. Market Size Absolute $ Opportunity Analysis and Forecast, Country , 2016-2032
- 8.5.2.1. Brazil
- 8.5.2.2. Colombia
- 8.5.2.3. Chile
- 8.5.2.4. Argentina
- 8.5.2.5. Costa Rica
- 8.5.2.6. Rest of Latin America
- 9. Middle East & Africa Fish Protein Market Analysis, Opportunity and Forecast, 2016-2032
- 9.1. Middle East & Africa Fish Protein Market Analysis, 2016-2021
- 9.2. Middle East & Africa Fish Protein Market Opportunity and Forecast, 2023-2032
- 9.3. Middle East & Africa Fish Protein Market Analysis, Opportunity and Forecast, By By Type, 2016-2032
- 9.3.1. Middle East & Africa Fish Protein Market Analysis by By Type: Introduction
- 9.3.2. Market Size Absolute $ Opportunity Analysis and Forecast, By By Type, 2016-2032
- 9.3.3. Fish Protein Hydrolysate
- 9.3.4. Fish Protein Concentrate
- 9.3.5. Fish Protein Isolate
- 9.4. Middle East & Africa Fish Protein Market Analysis, Opportunity and Forecast, By By End-Use, 2016-2032
- 9.4.1. Middle East & Africa Fish Protein Market Analysis by By End-Use: Introduction
- 9.4.2. Market Size Absolute $ Opportunity Analysis and Forecast, By By End-Use, 2016-2032
- 9.4.3. Food and Beverages
- 9.4.4. Sport Nutrition & Dietary Supplements
- 9.4.5. Animal Feed
- 9.4.6. Pharmaceuticals
- 9.4.7. Cosmetics
- 9.4.8. Other
- 9.5. Middle East & Africa Fish Protein Market Analysis, Opportunity and Forecast, By Country , 2016-2032
- 9.5.1. Middle East & Africa Fish Protein Market Analysis by Country : Introduction
- 9.5.2. Market Size Absolute $ Opportunity Analysis and Forecast, Country , 2016-2032
- 9.5.2.1. Algeria
- 9.5.2.2. Egypt
- 9.5.2.3. Israel
- 9.5.2.4. Kuwait
- 9.5.2.5. Nigeria
- 9.5.2.6. Saudi Arabia
- 9.5.2.7. South Africa
- 9.5.2.8. Turkey
- 9.5.2.9. The UAE
- 9.5.2.10. Rest of MEA
- 10. Global Fish Protein Market Analysis, Opportunity and Forecast, By Region , 2016-2032
- 10.1. Global Fish Protein Market Analysis by Region : Introduction
- 10.2. Market Size Absolute $ Opportunity Analysis and Forecast, By Region , 2016-2032
- 10.2.1. North America
- 10.2.2. Western Europe
- 10.2.3. Eastern Europe
- 10.2.4. APAC
- 10.2.5. Latin America
- 10.2.6. Middle East & Africa
- 11. Global Fish Protein Market Competitive Landscape, Market Share Analysis, and Company Profiles
- 11.1. Market Share Analysis
- 11.2. Company Profiles
- 11.3. DSM
- 11.3.1. Company Overview
- 11.3.2. Financial Highlights
- 11.3.3. Product Portfolio
- 11.3.4. SWOT Analysis
- 11.3.5. Key Strategies and Developments
- 11.4. Bio-Marine Ingredients Ireland Ltd
- 11.4.1. Company Overview
- 11.4.2. Financial Highlights
- 11.4.3. Product Portfolio
- 11.4.4. SWOT Analysis
- 11.4.5. Key Strategies and Developments
- 11.5. QINGDAO FUTURE GROUP
- 11.5.1. Company Overview
- 11.5.2. Financial Highlights
- 11.5.3. Product Portfolio
- 11.5.4. SWOT Analysis
- 11.5.5. Key Strategies and Developments
- 11.6. BioOregon Protein
- 11.6.1. Company Overview
- 11.6.2. Financial Highlights
- 11.6.3. Product Portfolio
- 11.6.4. SWOT Analysis
- 11.6.5. Key Strategies and Developments
- 11.7. Mukka Seafood Industries Limited
- 11.7.1. Company Overview
- 11.7.2. Financial Highlights
- 11.7.3. Product Portfolio
- 11.7.4. SWOT Analysis
- 11.7.5. Key Strategies and Developments
- 11.8. Bevenovo Corporation Limited
- 11.8.1. Company Overview
- 11.8.2. Financial Highlights
- 11.8.3. Product Portfolio
- 11.8.4. SWOT Analysis
- 11.8.5. Key Strategies and Developments
- 11.9. Copalis
- 11.9.1. Company Overview
- 11.9.2. Financial Highlights
- 11.9.3. Product Portfolio
- 11.9.4. SWOT Analysis
- 11.9.5. Key Strategies and Developments
- 11.10. ScanBio Marine Group
- 11.10.1. Company Overview
- 11.10.2. Financial Highlights
- 11.10.3. Product Portfolio
- 11.10.4. SWOT Analysis
- 11.10.5. Key Strategies and Developments
- 11.11. Nutrifish
- 11.11.1. Company Overview
- 11.11.2. Financial Highlights
- 11.11.3. Product Portfolio
- 11.11.4. SWOT Analysis
- 11.11.5. Key Strategies and Developments
- 11.12. Other
- 11.12.1. Company Overview
- 11.12.2. Financial Highlights
- 11.12.3. Product Portfolio
- 11.12.4. SWOT Analysis
- 11.12.5. Key Strategies and Developments
- 12. Assumptions and Acronyms
- 13. Research Methodology
- 14. Contact
- List of Figures
- Figure 1: Global Fish Protein Market Revenue (US$ Mn) Market Share by By Type in 2022
- Figure 2: Global Fish Protein Market Attractiveness Analysis by By Type, 2016-2032
- Figure 3: Global Fish Protein Market Revenue (US$ Mn) Market Share by By End-Usein 2022
- Figure 4: Global Fish Protein Market Attractiveness Analysis by By End-Use, 2016-2032
- Figure 5: Global Fish Protein Market Revenue (US$ Mn) Market Share by Region in 2022
- Figure 6: Global Fish Protein Market Attractiveness Analysis by Region, 2016-2032
- Figure 7: Global Fish Protein Market Revenue (US$ Mn) (2016-2032)
- Figure 8: Global Fish Protein Market Revenue (US$ Mn) Comparison by Region (2016-2032)
- Figure 9: Global Fish Protein Market Revenue (US$ Mn) Comparison by By Type (2016-2032)
- Figure 10: Global Fish Protein Market Revenue (US$ Mn) Comparison by By End-Use (2016-2032)
- Figure 11: Global Fish Protein Market Y-o-Y Growth Rate Comparison by Region (2016-2032)
- Figure 12: Global Fish Protein Market Y-o-Y Growth Rate Comparison by By Type (2016-2032)
- Figure 13: Global Fish Protein Market Y-o-Y Growth Rate Comparison by By End-Use (2016-2032)
- Figure 14: Global Fish Protein Market Share Comparison by Region (2016-2032)
- Figure 15: Global Fish Protein Market Share Comparison by By Type (2016-2032)
- Figure 16: Global Fish Protein Market Share Comparison by By End-Use (2016-2032)
- Figure 17: North America Fish Protein Market Revenue (US$ Mn) Market Share by By Typein 2022
- Figure 18: North America Fish Protein Market Attractiveness Analysis by By Type, 2016-2032
- Figure 19: North America Fish Protein Market Revenue (US$ Mn) Market Share by By End-Usein 2022
- Figure 20: North America Fish Protein Market Attractiveness Analysis by By End-Use, 2016-2032
- Figure 21: North America Fish Protein Market Revenue (US$ Mn) Market Share by Country in 2022
- Figure 22: North America Fish Protein Market Attractiveness Analysis by Country, 2016-2032
- Figure 23: North America Fish Protein Market Revenue (US$ Mn) (2016-2032)
- Figure 24: North America Fish Protein Market Revenue (US$ Mn) Comparison by Country (2016-2032)
- Figure 25: North America Fish Protein Market Revenue (US$ Mn) Comparison by By Type (2016-2032)
- Figure 26: North America Fish Protein Market Revenue (US$ Mn) Comparison by By End-Use (2016-2032)
- Figure 27: North America Fish Protein Market Y-o-Y Growth Rate Comparison by Country (2016-2032)
- Figure 28: North America Fish Protein Market Y-o-Y Growth Rate Comparison by By Type (2016-2032)
- Figure 29: North America Fish Protein Market Y-o-Y Growth Rate Comparison by By End-Use (2016-2032)
- Figure 30: North America Fish Protein Market Share Comparison by Country (2016-2032)
- Figure 31: North America Fish Protein Market Share Comparison by By Type (2016-2032)
- Figure 32: North America Fish Protein Market Share Comparison by By End-Use (2016-2032)
- Figure 33: Western Europe Fish Protein Market Revenue (US$ Mn) Market Share by By Typein 2022
- Figure 34: Western Europe Fish Protein Market Attractiveness Analysis by By Type, 2016-2032
- Figure 35: Western Europe Fish Protein Market Revenue (US$ Mn) Market Share by By End-Usein 2022
- Figure 36: Western Europe Fish Protein Market Attractiveness Analysis by By End-Use, 2016-2032
- Figure 37: Western Europe Fish Protein Market Revenue (US$ Mn) Market Share by Country in 2022
- Figure 38: Western Europe Fish Protein Market Attractiveness Analysis by Country, 2016-2032
- Figure 39: Western Europe Fish Protein Market Revenue (US$ Mn) (2016-2032)
- Figure 40: Western Europe Fish Protein Market Revenue (US$ Mn) Comparison by Country (2016-2032)
- Figure 41: Western Europe Fish Protein Market Revenue (US$ Mn) Comparison by By Type (2016-2032)
- Figure 42: Western Europe Fish Protein Market Revenue (US$ Mn) Comparison by By End-Use (2016-2032)
- Figure 43: Western Europe Fish Protein Market Y-o-Y Growth Rate Comparison by Country (2016-2032)
- Figure 44: Western Europe Fish Protein Market Y-o-Y Growth Rate Comparison by By Type (2016-2032)
- Figure 45: Western Europe Fish Protein Market Y-o-Y Growth Rate Comparison by By End-Use (2016-2032)
- Figure 46: Western Europe Fish Protein Market Share Comparison by Country (2016-2032)
- Figure 47: Western Europe Fish Protein Market Share Comparison by By Type (2016-2032)
- Figure 48: Western Europe Fish Protein Market Share Comparison by By End-Use (2016-2032)
- Figure 49: Eastern Europe Fish Protein Market Revenue (US$ Mn) Market Share by By Typein 2022
- Figure 50: Eastern Europe Fish Protein Market Attractiveness Analysis by By Type, 2016-2032
- Figure 51: Eastern Europe Fish Protein Market Revenue (US$ Mn) Market Share by By End-Usein 2022
- Figure 52: Eastern Europe Fish Protein Market Attractiveness Analysis by By End-Use, 2016-2032
- Figure 53: Eastern Europe Fish Protein Market Revenue (US$ Mn) Market Share by Country in 2022
- Figure 54: Eastern Europe Fish Protein Market Attractiveness Analysis by Country, 2016-2032
- Figure 55: Eastern Europe Fish Protein Market Revenue (US$ Mn) (2016-2032)
- Figure 56: Eastern Europe Fish Protein Market Revenue (US$ Mn) Comparison by Country (2016-2032)
- Figure 57: Eastern Europe Fish Protein Market Revenue (US$ Mn) Comparison by By Type (2016-2032)
- Figure 58: Eastern Europe Fish Protein Market Revenue (US$ Mn) Comparison by By End-Use (2016-2032)
- Figure 59: Eastern Europe Fish Protein Market Y-o-Y Growth Rate Comparison by Country (2016-2032)
- Figure 60: Eastern Europe Fish Protein Market Y-o-Y Growth Rate Comparison by By Type (2016-2032)
- Figure 61: Eastern Europe Fish Protein Market Y-o-Y Growth Rate Comparison by By End-Use (2016-2032)
- Figure 62: Eastern Europe Fish Protein Market Share Comparison by Country (2016-2032)
- Figure 63: Eastern Europe Fish Protein Market Share Comparison by By Type (2016-2032)
- Figure 64: Eastern Europe Fish Protein Market Share Comparison by By End-Use (2016-2032)
- Figure 65: APAC Fish Protein Market Revenue (US$ Mn) Market Share by By Typein 2022
- Figure 66: APAC Fish Protein Market Attractiveness Analysis by By Type, 2016-2032
- Figure 67: APAC Fish Protein Market Revenue (US$ Mn) Market Share by By End-Usein 2022
- Figure 68: APAC Fish Protein Market Attractiveness Analysis by By End-Use, 2016-2032
- Figure 69: APAC Fish Protein Market Revenue (US$ Mn) Market Share by Country in 2022
- Figure 70: APAC Fish Protein Market Attractiveness Analysis by Country, 2016-2032
- Figure 71: APAC Fish Protein Market Revenue (US$ Mn) (2016-2032)
- Figure 72: APAC Fish Protein Market Revenue (US$ Mn) Comparison by Country (2016-2032)
- Figure 73: APAC Fish Protein Market Revenue (US$ Mn) Comparison by By Type (2016-2032)
- Figure 74: APAC Fish Protein Market Revenue (US$ Mn) Comparison by By End-Use (2016-2032)
- Figure 75: APAC Fish Protein Market Y-o-Y Growth Rate Comparison by Country (2016-2032)
- Figure 76: APAC Fish Protein Market Y-o-Y Growth Rate Comparison by By Type (2016-2032)
- Figure 77: APAC Fish Protein Market Y-o-Y Growth Rate Comparison by By End-Use (2016-2032)
- Figure 78: APAC Fish Protein Market Share Comparison by Country (2016-2032)
- Figure 79: APAC Fish Protein Market Share Comparison by By Type (2016-2032)
- Figure 80: APAC Fish Protein Market Share Comparison by By End-Use (2016-2032)
- Figure 81: Latin America Fish Protein Market Revenue (US$ Mn) Market Share by By Typein 2022
- Figure 82: Latin America Fish Protein Market Attractiveness Analysis by By Type, 2016-2032
- Figure 83: Latin America Fish Protein Market Revenue (US$ Mn) Market Share by By End-Usein 2022
- Figure 84: Latin America Fish Protein Market Attractiveness Analysis by By End-Use, 2016-2032
- Figure 85: Latin America Fish Protein Market Revenue (US$ Mn) Market Share by Country in 2022
- Figure 86: Latin America Fish Protein Market Attractiveness Analysis by Country, 2016-2032
- Figure 87: Latin America Fish Protein Market Revenue (US$ Mn) (2016-2032)
- Figure 88: Latin America Fish Protein Market Revenue (US$ Mn) Comparison by Country (2016-2032)
- Figure 89: Latin America Fish Protein Market Revenue (US$ Mn) Comparison by By Type (2016-2032)
- Figure 90: Latin America Fish Protein Market Revenue (US$ Mn) Comparison by By End-Use (2016-2032)
- Figure 91: Latin America Fish Protein Market Y-o-Y Growth Rate Comparison by Country (2016-2032)
- Figure 92: Latin America Fish Protein Market Y-o-Y Growth Rate Comparison by By Type (2016-2032)
- Figure 93: Latin America Fish Protein Market Y-o-Y Growth Rate Comparison by By End-Use (2016-2032)
- Figure 94: Latin America Fish Protein Market Share Comparison by Country (2016-2032)
- Figure 95: Latin America Fish Protein Market Share Comparison by By Type (2016-2032)
- Figure 96: Latin America Fish Protein Market Share Comparison by By End-Use (2016-2032)
- Figure 97: Middle East & Africa Fish Protein Market Revenue (US$ Mn) Market Share by By Typein 2022
- Figure 98: Middle East & Africa Fish Protein Market Attractiveness Analysis by By Type, 2016-2032
- Figure 99: Middle East & Africa Fish Protein Market Revenue (US$ Mn) Market Share by By End-Usein 2022
- Figure 100: Middle East & Africa Fish Protein Market Attractiveness Analysis by By End-Use, 2016-2032
- Figure 101: Middle East & Africa Fish Protein Market Revenue (US$ Mn) Market Share by Country in 2022
- Figure 102: Middle East & Africa Fish Protein Market Attractiveness Analysis by Country, 2016-2032
- Figure 103: Middle East & Africa Fish Protein Market Revenue (US$ Mn) (2016-2032)
- Figure 104: Middle East & Africa Fish Protein Market Revenue (US$ Mn) Comparison by Country (2016-2032)
- Figure 105: Middle East & Africa Fish Protein Market Revenue (US$ Mn) Comparison by By Type (2016-2032)
- Figure 106: Middle East & Africa Fish Protein Market Revenue (US$ Mn) Comparison by By End-Use (2016-2032)
- Figure 107: Middle East & Africa Fish Protein Market Y-o-Y Growth Rate Comparison by Country (2016-2032)
- Figure 108: Middle East & Africa Fish Protein Market Y-o-Y Growth Rate Comparison by By Type (2016-2032)
- Figure 109: Middle East & Africa Fish Protein Market Y-o-Y Growth Rate Comparison by By End-Use (2016-2032)
- Figure 110: Middle East & Africa Fish Protein Market Share Comparison by Country (2016-2032)
- Figure 111: Middle East & Africa Fish Protein Market Share Comparison by By Type (2016-2032)
- Figure 112: Middle East & Africa Fish Protein Market Share Comparison by By End-Use (2016-2032)
List of Tables
- Table 1: Global Fish Protein Market Comparison by By Type (2016-2032)
- Table 2: Global Fish Protein Market Comparison by By End-Use (2016-2032)
- Table 3: Global Fish Protein Market Revenue (US$ Mn) Comparison by Region (2016-2032)
- Table 4: Global Fish Protein Market Revenue (US$ Mn) (2016-2032)
- Table 5: Global Fish Protein Market Revenue (US$ Mn) Comparison by Region (2016-2032)
- Table 6: Global Fish Protein Market Revenue (US$ Mn) Comparison by By Type (2016-2032)
- Table 7: Global Fish Protein Market Revenue (US$ Mn) Comparison by By End-Use (2016-2032)
- Table 8: Global Fish Protein Market Y-o-Y Growth Rate Comparison by Region (2016-2032)
- Table 9: Global Fish Protein Market Y-o-Y Growth Rate Comparison by By Type (2016-2032)
- Table 10: Global Fish Protein Market Y-o-Y Growth Rate Comparison by By End-Use (2016-2032)
- Table 11: Global Fish Protein Market Share Comparison by Region (2016-2032)
- Table 12: Global Fish Protein Market Share Comparison by By Type (2016-2032)
- Table 13: Global Fish Protein Market Share Comparison by By End-Use (2016-2032)
- Table 14: North America Fish Protein Market Comparison by By End-Use (2016-2032)
- Table 15: North America Fish Protein Market Revenue (US$ Mn) Comparison by Country (2016-2032)
- Table 16: North America Fish Protein Market Revenue (US$ Mn) (2016-2032)
- Table 17: North America Fish Protein Market Revenue (US$ Mn) Comparison by Country (2016-2032)
- Table 18: North America Fish Protein Market Revenue (US$ Mn) Comparison by By Type (2016-2032)
- Table 19: North America Fish Protein Market Revenue (US$ Mn) Comparison by By End-Use (2016-2032)
- Table 20: North America Fish Protein Market Y-o-Y Growth Rate Comparison by Country (2016-2032)
- Table 21: North America Fish Protein Market Y-o-Y Growth Rate Comparison by By Type (2016-2032)
- Table 22: North America Fish Protein Market Y-o-Y Growth Rate Comparison by By End-Use (2016-2032)
- Table 23: North America Fish Protein Market Share Comparison by Country (2016-2032)
- Table 24: North America Fish Protein Market Share Comparison by By Type (2016-2032)
- Table 25: North America Fish Protein Market Share Comparison by By End-Use (2016-2032)
- Table 26: Western Europe Fish Protein Market Comparison by By Type (2016-2032)
- Table 27: Western Europe Fish Protein Market Comparison by By End-Use (2016-2032)
- Table 28: Western Europe Fish Protein Market Revenue (US$ Mn) Comparison by Country (2016-2032)
- Table 29: Western Europe Fish Protein Market Revenue (US$ Mn) (2016-2032)
- Table 30: Western Europe Fish Protein Market Revenue (US$ Mn) Comparison by Country (2016-2032)
- Table 31: Western Europe Fish Protein Market Revenue (US$ Mn) Comparison by By Type (2016-2032)
- Table 32: Western Europe Fish Protein Market Revenue (US$ Mn) Comparison by By End-Use (2016-2032)
- Table 33: Western Europe Fish Protein Market Y-o-Y Growth Rate Comparison by Country (2016-2032)
- Table 34: Western Europe Fish Protein Market Y-o-Y Growth Rate Comparison by By Type (2016-2032)
- Table 35: Western Europe Fish Protein Market Y-o-Y Growth Rate Comparison by By End-Use (2016-2032)
- Table 36: Western Europe Fish Protein Market Share Comparison by Country (2016-2032)
- Table 37: Western Europe Fish Protein Market Share Comparison by By Type (2016-2032)
- Table 38: Western Europe Fish Protein Market Share Comparison by By End-Use (2016-2032)
- Table 39: Eastern Europe Fish Protein Market Comparison by By Type (2016-2032)
- Table 40: Eastern Europe Fish Protein Market Comparison by By End-Use (2016-2032)
- Table 41: Eastern Europe Fish Protein Market Revenue (US$ Mn) Comparison by Country (2016-2032)
- Table 42: Eastern Europe Fish Protein Market Revenue (US$ Mn) (2016-2032)
- Table 43: Eastern Europe Fish Protein Market Revenue (US$ Mn) Comparison by Country (2016-2032)
- Table 44: Eastern Europe Fish Protein Market Revenue (US$ Mn) Comparison by By Type (2016-2032)
- Table 45: Eastern Europe Fish Protein Market Revenue (US$ Mn) Comparison by By End-Use (2016-2032)
- Table 46: Eastern Europe Fish Protein Market Y-o-Y Growth Rate Comparison by Country (2016-2032)
- Table 47: Eastern Europe Fish Protein Market Y-o-Y Growth Rate Comparison by By Type (2016-2032)
- Table 48: Eastern Europe Fish Protein Market Y-o-Y Growth Rate Comparison by By End-Use (2016-2032)
- Table 49: Eastern Europe Fish Protein Market Share Comparison by Country (2016-2032)
- Table 50: Eastern Europe Fish Protein Market Share Comparison by By Type (2016-2032)
- Table 51: Eastern Europe Fish Protein Market Share Comparison by By End-Use (2016-2032)
- Table 52: APAC Fish Protein Market Comparison by By Type (2016-2032)
- Table 53: APAC Fish Protein Market Comparison by By End-Use (2016-2032)
- Table 54: APAC Fish Protein Market Revenue (US$ Mn) Comparison by Country (2016-2032)
- Table 55: APAC Fish Protein Market Revenue (US$ Mn) (2016-2032)
- Table 56: APAC Fish Protein Market Revenue (US$ Mn) Comparison by Country (2016-2032)
- Table 57: APAC Fish Protein Market Revenue (US$ Mn) Comparison by By Type (2016-2032)
- Table 58: APAC Fish Protein Market Revenue (US$ Mn) Comparison by By End-Use (2016-2032)
- Table 59: APAC Fish Protein Market Y-o-Y Growth Rate Comparison by Country (2016-2032)
- Table 60: APAC Fish Protein Market Y-o-Y Growth Rate Comparison by By Type (2016-2032)
- Table 61: APAC Fish Protein Market Y-o-Y Growth Rate Comparison by By End-Use (2016-2032)
- Table 62: APAC Fish Protein Market Share Comparison by Country (2016-2032)
- Table 63: APAC Fish Protein Market Share Comparison by By Type (2016-2032)
- Table 64: APAC Fish Protein Market Share Comparison by By End-Use (2016-2032)
- Table 65: Latin America Fish Protein Market Comparison by By Type (2016-2032)
- Table 66: Latin America Fish Protein Market Comparison by By End-Use (2016-2032)
- Table 67: Latin America Fish Protein Market Revenue (US$ Mn) Comparison by Country (2016-2032)
- Table 68: Latin America Fish Protein Market Revenue (US$ Mn) (2016-2032)
- Table 69: Latin America Fish Protein Market Revenue (US$ Mn) Comparison by Country (2016-2032)
- Table 70: Latin America Fish Protein Market Revenue (US$ Mn) Comparison by By Type (2016-2032)
- Table 71: Latin America Fish Protein Market Revenue (US$ Mn) Comparison by By End-Use (2016-2032)
- Table 72: Latin America Fish Protein Market Y-o-Y Growth Rate Comparison by Country (2016-2032)
- Table 73: Latin America Fish Protein Market Y-o-Y Growth Rate Comparison by By Type (2016-2032)
- Table 74: Latin America Fish Protein Market Y-o-Y Growth Rate Comparison by By End-Use (2016-2032)
- Table 75: Latin America Fish Protein Market Share Comparison by Country (2016-2032)
- Table 76: Latin America Fish Protein Market Share Comparison by By Type (2016-2032)
- Table 77: Latin America Fish Protein Market Share Comparison by By End-Use (2016-2032)
- Table 78: Middle East & Africa Fish Protein Market Comparison by By Type (2016-2032)
- Table 79: Middle East & Africa Fish Protein Market Comparison by By End-Use (2016-2032)
- Table 80: Middle East & Africa Fish Protein Market Revenue (US$ Mn) Comparison by Country (2016-2032)
- Table 81: Middle East & Africa Fish Protein Market Revenue (US$ Mn) (2016-2032)
- Table 82: Middle East & Africa Fish Protein Market Revenue (US$ Mn) Comparison by Country (2016-2032)
- Table 83: Middle East & Africa Fish Protein Market Revenue (US$ Mn) Comparison by By Type (2016-2032)
- Table 84: Middle East & Africa Fish Protein Market Revenue (US$ Mn) Comparison by By End-Use (2016-2032)
- Table 85: Middle East & Africa Fish Protein Market Y-o-Y Growth Rate Comparison by Country (2016-2032)
- Table 86: Middle East & Africa Fish Protein Market Y-o-Y Growth Rate Comparison by By Type (2016-2032)
- Table 87: Middle East & Africa Fish Protein Market Y-o-Y Growth Rate Comparison by By End-Use (2016-2032)
- Table 88: Middle East & Africa Fish Protein Market Share Comparison by Country (2016-2032)
- Table 89: Middle East & Africa Fish Protein Market Share Comparison by By Type (2016-2032)
- Table 90: Middle East & Africa Fish Protein Market Share Comparison by By End-Use (2016-2032)
- 1. Executive Summary
-
- DSM
- Bio-Marine Ingredients Ireland Ltd
- QINGDAO FUTURE GROUP
- BioOregon Protein
- Mukka Seafood Industries Limited
- Bevenovo Corporation Limited
- Copalis
- ScanBio Marine Group
- Nutrifish
- Other
Our Clients


View Our Licence Options
