
Esters Market By Source (Natural, Synthetic), By Product Type (Dibasic Esters, Polyol Esters,Other), By Application (Lubricants, Solvents, Other), By End-Use Industry (Chemicals, Food, Other ), By Region And Companies - Industry Segment Outlook, Market Assessment, Competition Scenario, Trends, And Forecast 2023-2032
-
1809
-
May 2023
-
177
-


-
This report was compiled by Shreyas Rokade Shreyas Rokade is a seasoned Research Analyst with CMFE, bringing extensive expertise in market research and consulting, with a strong background in Chemical Engineering. Correspondence Team Lead-CMFE Linkedin | Detailed Market research Methodology Our methodology involves a mix of primary research, including interviews with leading mental health experts, and secondary research from reputable medical journals and databases. View Detailed Methodology Page
-
Quick Navigation
Report Overview
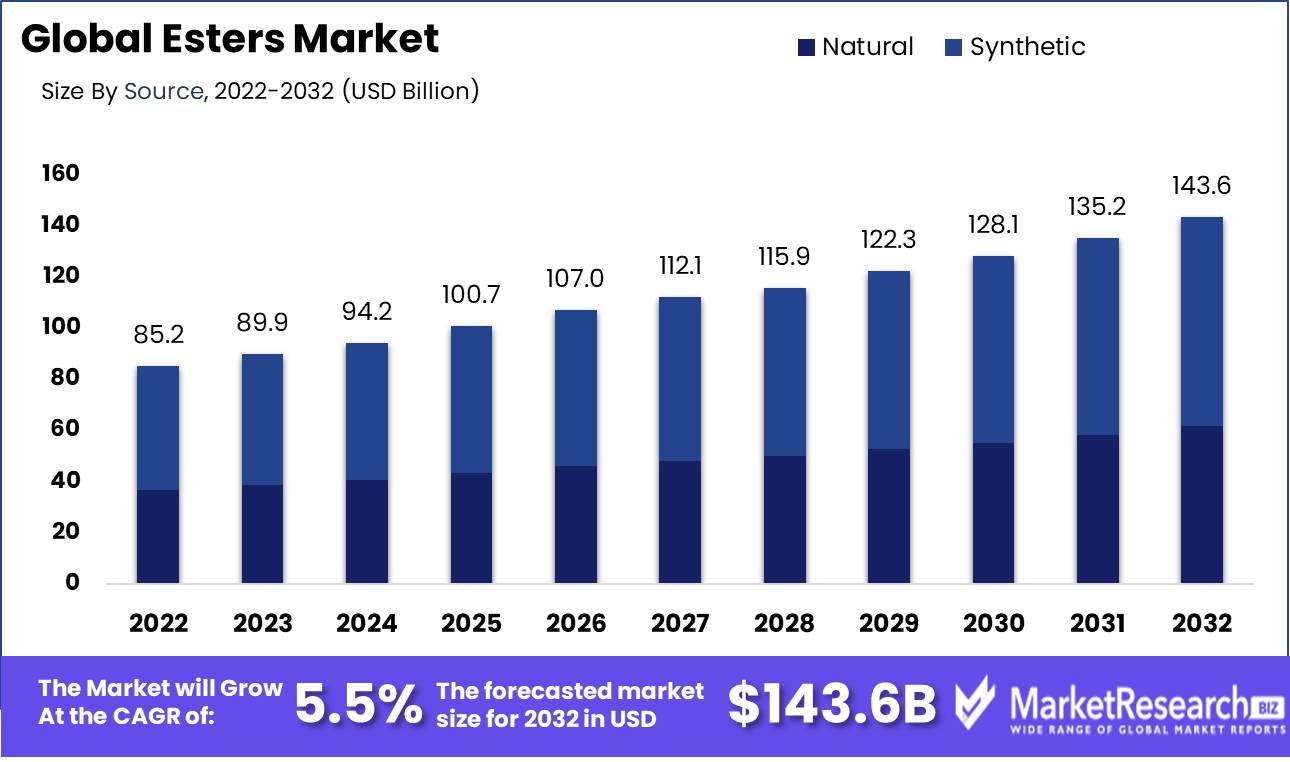
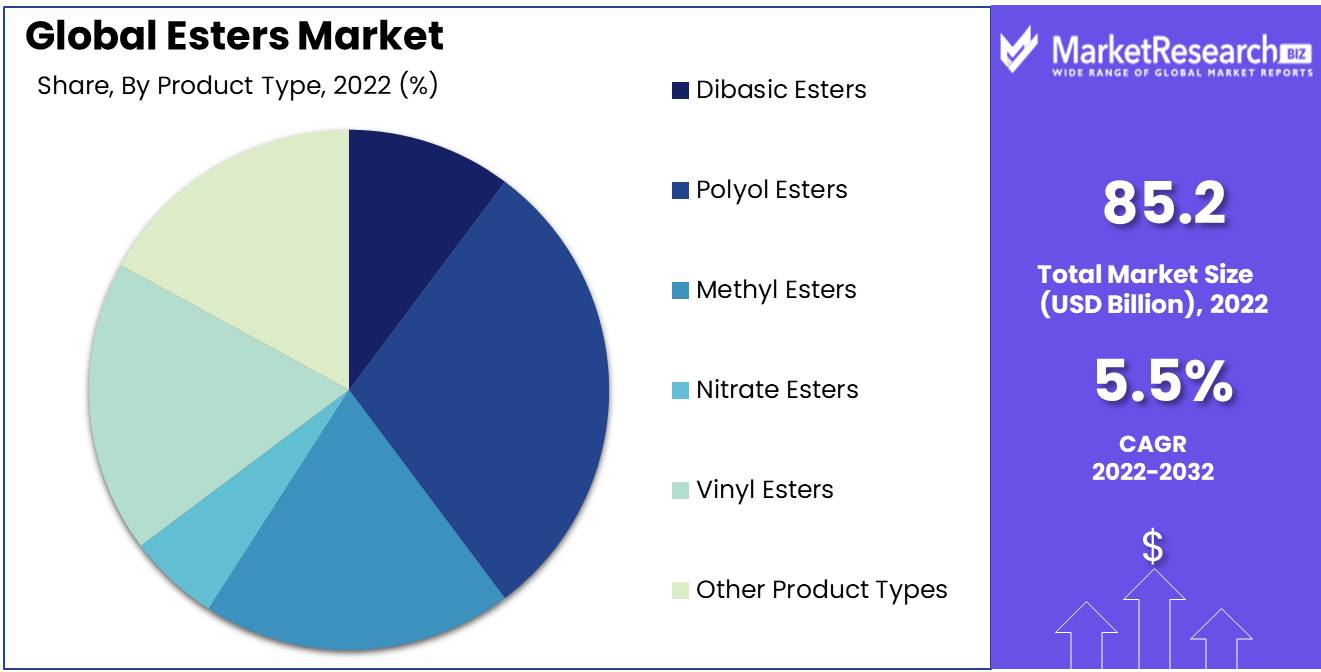
Esters Market size is expected to be worth around USD 143.6 Bn by 2032 from USD 85.2 Bn in 2022, growing at a CAGR of 5.5% during the forecast period from 2023 to 2032.
The significance of the esters market is of utmost importance and cannot be overstated. Esters possess a multitude of advantages that render them indispensable across various sectors. Esters exhibit exceptional solubility in a wide range of solvents, rendering them highly suitable for incorporation into paints, coatings, and adhesives. Furthermore, their low volatility renders them well-suited for applications necessitating the use of stable and durable compounds.
Significant advancements in the esters market have paved the way for enhanced performance and broader utilization. Esters with improved hydrolytic stability have been developed by manufacturers, rendering them suitable for use in personal care products that require resistance to decomposition when exposed to moisture. In addition, the increased recognition of bio-based esters can be attributed to the growing need for environmentally sustainable substitutes for conventional petrochemical-derived esters.
The market investments in esters, made by both established and emerging players, have resulted in significant research and development endeavors. These efforts have successfully incorporated esters into a diverse range of products and services across various industries, including automotive, textiles, pharmaceuticals, and food and beverages. The indispensability of esters in these industries is attributed to their remarkable versatility.
The market growth of esters can be attributed to the diverse range of applications they possess. Esters exhibit a wide range of applications across diverse industries, thereby showcasing their inherent versatility. Esters are utilized as engine lubricants in automotive engines, as well as being essential for the production of plastics due to their advantageous characteristics of flexibility and durability. Moreover, esters play a crucial role in the development of flavors in the context of food and beverage industries, aiming to enhance sensory perceptions and provide heightened experiences for consumers.
Various industries have widely acknowledged the potential of esters and have made significant investments in integrating them into their operations. Pharmaceutical companies employ esters as excipients in drug formulations to regulate the release of medication and promote adherence among patients. The cosmetics industry harnesses the moisturizing and conditioning properties of esters in skincare and haircare products. Similarly, textile factories heavily rely on esters due to their exceptional solubility and compatibility with diverse dyes for dyeing and printing processes.
Driving factors
Versatile Esters Many Uses
The esters market, known for its varied uses in many industries, has seen tremendous growth in recent years. Esters are organic molecules made by reacting acids and alcohols, resulting in a variety of chemical structures with different characteristics. Esters are popular in sectors like food and beverages, personal care, and pharmaceuticals because of these qualities. Esters are flavor enhancers and scent carriers in the food and beverages sector. Fruits contain many esters, which give them their smell and taste.
Sustainable Ester Solutions
End-use industries are driving esters market growth. Esters are in high demand across several sectors due to rapid industrialization, urbanization, and changing consumer preferences. Esters are added to lubricants in the automotive industry to improve viscosity, stability, and wear prevention. Ester-based fluids, recognized for their outstanding lubricity and capacity to withstand extreme temperatures, have become more popular due to the growing demand for fuel-efficient automobiles.
Ester Technology Innovations
The demand for bio-based and sustainable esters is driving the esters market. Industries are looking for alternatives to conventional chemical compounds due to environmental concerns. Bio-esters come from renewable sources such as vegetable oils, waste fats, and greases. Their production uses eco-friendly feedstock and decreases petroleum use. Bio-based esters have a smaller carbon footprint, biodegradability, and environmental impact.
Ester Market Growth
As ester production technology improves, firms can create new esters with improved qualities and functions. Modern ester production techniques manage the esterification process, resulting in enhanced yield, purity, and efficiency. Optimizing catalysts, reaction conditions, and conversion processes has increased the range of esters commercially produced. Modern separation and purification methods ensure the production of high-quality esters for a variety of industries.
Ester Demand Growing Worldwide
Geographically and demographically increasing consumer markets help the esters market. The consumption of ester-based products has expanded globally as a result of expanding populations, rising disposable incomes, and changing lifestyles. Emerging economies, especially in Asia-Pacific and Latin America, offer esters market growth potential. The expanding middle class and urbanization in these regions have increased consumer expenditure on personal care, food and beverages, and other ester-dependent products.
Restraining Factors
Raw Material Prices
The esters market is significantly impacted by fluctuating raw material prices. Fatty acids, alcohols, and organic acids are the raw materials for esters. Global supply and demand, geopolitics, and natural calamities affect raw material prices. These price variations affect esters' production costs, creating a turbulent market. Despite manufacturers' efforts to stabilize prices through long-term contracts and strategic sourcing, the esters market remains sensitive to raw material price swings.
Compliance and Regulatory Restrictions
Regulations and compliance standards also limit the esters market. Esters are regulated by the government to ensure the safety and quality of the products. Global regulatory bodies set production, labeling, and environmental standards. Forester producers and users, especially small and medium-sized businesses, meeting these compliance standards can be time-consuming and expensive. Noncompliance can result in fines and product recalls.
Environmental and Health Risks
The potential environmental and health risks of certain esters further limit the esters market. Esters are safe and eco-friendly. If improperly handled or disposed of, some esters can harm humans and the environment. Ester-based products must be responsibly managed to reduce potential environmental damage. This covers recycling, garbage disposal, and international environmental standards.
Substitute Chemicals' Competition
Substitute compounds with similar qualities and benefits compete heavily in the esters market. Ester makers must differentiate their products since the pharmaceutical, cosmetic, and automobile industries have alternatives to esters. The esters market faces competition from eco-friendly and affordable replacement chemicals. Esters may lose demand if industries choose more sustainable alternatives with equivalent functions.
Limited Awareness and Use in Some Industries
Market expansion is hampered by limited awareness and utilization of esters in some industries. Esters are widely used in industries such as food and beverage, personal care, and lubricants, but their potential is still untapped. A lack of targeted marketing or research and development may explain this lack of awareness. Educating industries about esters' benefits and adaptability is essential to their adoption.
Source Analysis
The synthetic segment dominates the esters market, which has boosted industry growth. Synthetic esters are widely utilized in lubricants, cosmetics, food additives, and medications. Chemically produced esters have high viscosity index, low volatility, and better thermal stability. These benefits have increased the demand for synthetic esters.
Emerging economies are driving synthetic segment adoption in the esters market. The demand for lubricants and other high-performance chemicals is increasing as these economies rapidly industrialize. Synthetic esters meet these industries' requirements with higher lubricity, thermal stability, and anti-wear qualities. Synthetic esters are also used more frequently in emerging economies due to the cheap production costs and availability of raw materials.
Consumer trends and behaviors can influence esters market synthetic segment adoption. Consumers are actively seeking eco-friendly and biodegradable alternatives as they become more conscious of the adverse impacts of petroleum-based products on the environment. Synthetic esters are a sustainable alternative because they are derived from renewable sources. These esters work better and last longer, attracting consumers.
Product Type Analysis
The polyol esters segment dominates the esters market. In applications like lubricants, adhesives, detergents, and plastics, polyol esters are widely employed. Numerous industries favor these esters due to their high lubricity, thermal stability, and material compatibility.
Like the synthetic segment, economic growth in emerging economies is driving Polyol Esters Segment adoption in the esters market. The demand for lubricants, paints, and coatings is rising as a result of the fast industrialization and urbanization of these economies. Polyol esters suit these industries' performance requirements. Polyol esters are also cheaper than other ester kinds, making them more attractive to emerging economies.
Consumer trends and behaviors affect polyol esters segment growth. Consumers care more about product quality and environmental impact. Eco-friendly polyol esters are non-toxic, non-corrosive, and biodegradable. These esters have superior heat resistance and longer equipment life, which appeals to consumers.
Key Market Segments
By Source
- Natural
- Synthetic
By Product Type
- Dibasic Esters
- Polyol Esters
- Methyl Esters
- Nitrate Esters
- Vinyl Esters
- Other Product Types
By Application
- Lubricants
- Solvents
- Plasticizers
- Fuel and Oil Additives
- Other Applications
By End-Use Industry
- Chemicals
- Food
- Automotive and Aviation
- Marine
- Other End-Use Industries
Growth Opportunity
Ester Market's Longevity
Bio-based and renewable ester alternatives have driven recent growth in the esters market. As industries lower their carbon footprint and environmental impact, this shift toward sustainable and eco-friendly solutions has grown. Thus, the ester market is likely to increase, presenting huge growth potential and profitable prospects for ester-related enterprises.
Ester Markets
Ester manufacturers can tap into growth by expanding into emerging markets with rising customer demand. Quality products are becoming increasingly important to these consumers as economies grow and living standards rise. This rising demand gives a perfect opportunity for ester manufacturers to develop their footprint and cater to these emerging markets' evolving demands and tastes.
Ester Customization
Customized ester solutions with manufacturers and end-users offer another route for ester market growth. Customizing ester products and solutions for individual sectors and applications can change the game. Ester makers can build bespoke solutions that provide higher performance and meet particular issues faced by various industries by collaborating with manufacturers and understanding their unique requirements.
Ester Derivatives
Focusing on ester derivatives with unique properties can open new growth opportunities. With advances in technology and research, there is an enormous opportunity to investigate and produce ester derivatives with higher functionality, performance, and versatility. Ester manufacturers can cater to specific markets, differentiate themselves from competitors, and tap into fresh growth and expansion opportunities by relying on their unique properties.
Ester's Green Shift
The implementation of green and sustainable production processes throughout the ester sector is another growth prospect. Customers prefer eco-friendly products as sustainability becomes a priority across industries. Ester manufacturers can meet regulatory standards and attract eco-conscious consumers by adopting green practices like as employing renewable energy, limiting waste, and decreasing emissions.
Latest Trends
Natural and Organic Esters in Cosmetics
Esters are crucial in several industries, including personal care and cosmetics. The demand for esters obtained from natural sources has increased significantly as a result of the rise in environmental consciousness and a preference for organic and natural ingredients. Today's consumers are increasingly aware of skin and hair products. They're increasingly aware of synthetic chemicals' risks and seeking safer alternatives.
Esters in Food and Beverage Fragrances
Esters are used in food and beverage flavorings and fragrances in addition to cosmetics. Esters create mouthwatering scents and flavors. They provide fruity, flowery, and sweet flavors that enhance our meals. In recent years, esters' utilization in food and beverage flavorings and fragrances has increased tremendously. Esters' adaptability allows formulators to experiment with a variety of flavors and fragrances to satisfy various consumer tastes.
Biodegradable and Eco-Friendly Ester-Based Polymers Demand
The demand for biodegradable and eco-friendly products across industries has increased as a result of environmental concerns. Ester-based polymers are more biodegradable and environmentally friendly than petroleum-based polymers. The demand for biodegradable and eco-friendly ester-based polymers is significantly increasing in the esters market. These polymers have applications in packaging, textiles, automotive, and agriculture. Biodegradable ester-based polymers are being used by manufacturers as a result of the requirement to connect their manufacturing operations with sustainable standards.
Bio-Lubricants and Plasticizers
The rise of bio-based lubricants and plasticizers is another important market trend impacting the esters sector. Sustainable solutions favor renewable lubricants and plasticizers. Bio-based esters' exceptional qualities and eco-friendliness are gaining popularity. Bio-based lubricants are good for automotive, industrial, and marine applications due to their lubricity, stability, and viscosity. Bio-based plasticizers give polymer compositions compatibility, flexibility, and thermal stability.
Creating Niche Ester Products
The development of specialty ester compounds for niche applications is rapidly expanding in the esters market. As industries become increasingly specialized, esters must meet certain specifications and performance parameters. These specialty ester compounds find applications in pharmaceuticals, textiles, paints and coatings, and agriculture. Manufacturers can customize and fine-tune ester characteristics to fit industrial demand, improving performance and efficiency.
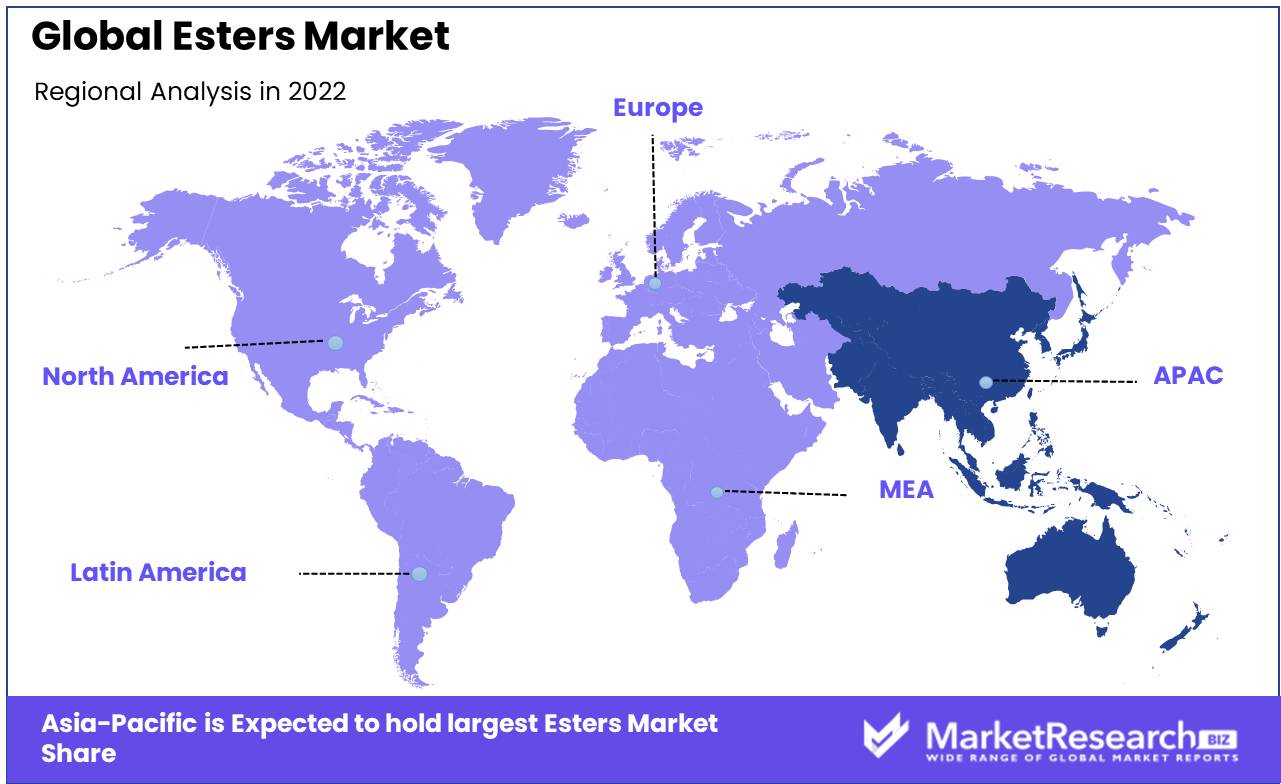
Regional Analysis
In today's fast-paced global economy, Asia Pacific has established itself as a dominant force in different industries. The esters market is one such sector where this dominance is obvious. The Asia Pacific region is a key factor in the production and use of esters. This article examines their dominance and why it will endure.
Ester's demand for cosmetics, lubricants, pharmaceuticals, and food and drinks is driving global esters market expansion. Esters' high solvency, lubricity, and low volatility make them popular. Thus, esters' demand has increased, generating huge prospects for enterprises in this sector.
The Asia Pacific region's vast customer base is a key factor in its dominance in the esters market. Ester producers and suppliers have a huge customer base in this region. Ester-based products have a huge market in countries like China and India due to rising disposable incomes and a burgeoning middle class. Ester-derived cosmetics and pharmaceuticals are in high demand in emerging economies as people grow more health-conscious and aware of personal cleanliness.
The Asia-Pacific region's growing industrial sector drives esters' demand in numerous applications. Rapid industrialization and urbanization have increased the production of industrial machinery, vehicles, and consumer goods, which demand esters-containing lubricants and additives. The region's strong industrial boom has driven esters' demand and market size.
Another key benefit of the Asia Pacific region is manufacturing. Several countries in this region, such as China, Japan, South Korea, and India, have established themselves as global manufacturing hubs. They dominate the esters market due to their manufacturing prowess, which allows them to meet domestic and international ester demand.
Key Regions and Countries
North America
- US
- Canada
- Mexico
Western Europe
- Germany
- France
- The UK
- Spain
- Italy
- Portugal
- Ireland
- Austria
- Switzerland
- Benelux
- Nordic
- Rest of Western Europe
Eastern Europe
- Russia
- Poland
- The Czech Republic
- Greece
- Rest of Eastern Europe
APAC
- China
- Japan
- South Korea
- India
- Australia & New Zealand
- Indonesia
- Malaysia
- Philippines
- Singapore
- Thailand
- Vietnam
- Rest of APAC
Latin America
- Brazil
- Colombia
- Chile
- Argentina
- Costa Rica
- Rest of Latin America
Middle East & Africa
- Algeria
- Egypt
- Israel
- Kuwait
- Nigeria
- Saudi Arabia
- South Africa
- Turkey
- United Arab Emirates
- Rest of MEA
Key Players Analysis
For decades, DuPont has led the esters market. DuPont has a significant focus on esters and has produced breakthrough products and solutions, fueling industry growth. They serve automotive, aerospace, electronics, and other industries. DuPont's commitment to sustainability and quality improves its ester's market position.
Solvay, a Belgian chemical manufacturer, established itself in the esters market. Solvay supplies ester-based products to pharmaceutical, agricultural, and personal care industries worldwide. The company's focus on esters and environmental stewardship has helped its reputation and growth in the esters industry.
Huntsman International LLC, situated in the US, manufactures ester-based products. Huntsman has established a position in the esters market via their commitment to innovation and customer-centric solutions. The company's growth and position as a leading player in the industry have been fueled by its considerable research and development initiatives and strategic partnerships.
Japanese multinational DAIKIN dominates the esters market. DAIKIN manufactures high-quality ester products for numerous purposes with a focus on technology. The company's commitment to research and development has kept it at the forefront of the esters industry. DAIKIN's commitment to sustainability and energy efficiency boosts its market reputation.
The esters industry relies on Dow, an American chemical corporation. Dow serves the construction, automotive, packaging, and textile industries with its varied product line and applications. The company's commitment to quality and sustainability has established it in the esters market.
Ashland, a major American specialty chemicals firm, has contributed to the esters market. Ashland provides industry-specific solutions by focusing on customer demands and technology. The company's focus on sustainability and environmental stewardship distinguishes it in the esters market, bolstering its position as a leading competitor.
Top Key Players in Esters Market
- DuPont (U.S.)
- Solvay (Belgium)
- Huntsman International LLC (U.S.)
- DAIKIN (Japan)
- Dow (U.S.)
- Ashland (U.S.)
- DAK Americas (U.S.)
- Esterchem Ltd. (U.K)
- Sumitomo Chemical Co., Ltd. (Japan)
- ABITEC (U.S.)
- ADM (U.S.)
- BASF SE (Germany)
- IFFCO (Turkey)
- AkzoNobel N.V. (Netherlands)
- Biotage (Sweden)
- Stepan Company (U.S.)
- DSM (Netherlands)
- CEM Corporation (U.S.)
- Fine Organics (India)
- Subhash Chemicals (India)
- Gattefosse (France)
- Croda International (U.K.)
Recent Development
- In 2022, BASF SE expanded its ester production capacity in China, making significant waves in the esters market.
- In 2021, The Dow Chemical Company, another major industry actor, introduced its impressive Velox line of esters.
- In 2020, ExxonMobil Corporation unveiled its Paraplex line of heat-resistant esters revolutionizing the industry.
Report Scope
Report Features Description Market Value (2022) USD 85.2 Bn Forecast Revenue (2032) USD 143.6 Bn CAGR (2023-2032) 5.5% Base Year for Estimation 2022 Historic Period 2016-2022 Forecast Period 2023-2032 Report Coverage Revenue Forecast, Market Dynamics, COVID-19 Impact, Competitive Landscape, Recent Developments Segments Covered By Source (Natural, Synthetic), By Product Type (Dibasic Esters, Polyol Esters, Methyl Esters, Nitrate Esters, Vinyl Esters, Other Product Types), By Application (Lubricants, Solvents, Plasticizers, Fuel and Oil Additives, Other Applications), By End-Use Industry (Chemicals, Food, Automotive and Aviation, Marine, Other End-Use Industries) Regional Analysis North America – The US, Canada, & Mexico; Western Europe – Germany, France, The UK, Spain, Italy, Portugal, Ireland, Austria, Switzerland, Benelux, Nordic, & Rest of Western Europe; Eastern Europe – Russia, Poland, The Czech Republic, Greece, & Rest of Eastern Europe; APAC – China, Japan, South Korea, India, Australia & New Zealand, Indonesia, Malaysia, Philippines, Singapore, Thailand, Vietnam, & Rest of APAC; Latin America – Brazil, Colombia, Chile, Argentina, Costa Rica, & Rest of Latin America; Middle East & Africa – Algeria, Egypt, Israel, Kuwait, Nigeria, Saudi Arabia, South Africa, Turkey, United Arab Emirates, & Rest of MEA Competitive Landscape DuPont (U.S.), Solvay (Belgium), Huntsman International LLC (U.S.), DAIKIN (Japan), Dow (U.S.), Ashland (U.S.), DAK Americas (U.S.), Esterchem Ltd. (U.K), Sumitomo Chemical Co., Ltd. (Japan), ABITEC (U.S.), ADM (U.S.), BASF SE (Germany), IFFCO (Turkey), AkzoNobel N.V. (Netherlands), Biotage (Sweden), Stepan Company (U.S.), DSM (Netherlands), CEM Corporation (U.S.), Fine Organics (India), Subhash Chemicals (India), Gattefosse (France), Croda International (U.K.) Customization Scope Customization for segments, region/country-level will be provided. Moreover, additional customization can be done based on the requirements. Purchase Options We have three licenses to opt for: Single User License, Multi-User License (Up to 5 Users), Corporate Use License (Unlimited User and Printable PDF) -
- 1. Executive Summary
- 1.1. Definition
- 1.2. Taxonomy
- 1.3. Research Scope
- 1.4. Key Analysis
- 1.5. Key Findings by Major Segments
- 1.6. Top strategies by Major Players
- 2. Global Esters Market Overview
- 2.1. Esters Market Dynamics
- 2.1.1. Drivers
- 2.1.2. Opportunities
- 2.1.3. Restraints
- 2.1.4. Challenges
- 2.2. Macro-economic Factors
- 2.3. Regulatory Framework
- 2.4. Market Investment Feasibility Index
- 2.5. PEST Analysis
- 2.6. PORTER’S Five Force Analysis
- 2.7. Drivers & Restraints Impact Analysis
- 2.8. Industry Chain Analysis
- 2.9. Cost Structure Analysis
- 2.10. Marketing Strategy
- 2.11. Russia-Ukraine War Impact Analysis
- 2.12. Opportunity Map Analysis
- 2.13. Market Competition Scenario Analysis
- 2.14. Product Life Cycle Analysis
- 2.15. Opportunity Orbits
- 2.16. Manufacturer Intensity Map
- 2.17. Major Companies sales by Value & Volume
- 2.1. Esters Market Dynamics
- 3. Global Esters Market Analysis, Opportunity and Forecast, 2016-2032
- 3.1. Global Esters Market Analysis, 2016-2021
- 3.2. Global Esters Market Opportunity and Forecast, 2023-2032
- 3.3. Global Esters Market Analysis, Opportunity and Forecast, By By Source, 2016-2032
- 3.3.1. Global Esters Market Analysis by By Source: Introduction
- 3.3.2. Market Size Absolute $ Opportunity Analysis and Forecast, By By Source, 2016-2032
- 3.3.3. Natural
- 3.3.4. Synthetic
- 3.4. Global Esters Market Analysis, Opportunity and Forecast, By By Product Type, 2016-2032
- 3.4.1. Global Esters Market Analysis by By Product Type: Introduction
- 3.4.2. Market Size Absolute $ Opportunity Analysis and Forecast, By By Product Type, 2016-2032
- 3.4.3. Dibasic Esters
- 3.4.4. Polyol Esters
- 3.4.5. Methyl Esters
- 3.4.6. Nitrate Esters
- 3.4.7. Vinyl Esters
- 3.4.8. Other Product Types
- 3.5. Global Esters Market Analysis, Opportunity and Forecast, By By Application, 2016-2032
- 3.5.1. Global Esters Market Analysis by By Application: Introduction
- 3.5.2. Market Size Absolute $ Opportunity Analysis and Forecast, By By Application, 2016-2032
- 3.5.3. Lubricants
- 3.5.4. Solvents
- 3.5.5. Plasticizers
- 3.5.6. Fuel and Oil Additives
- 3.5.7. Other Applications
- 3.6. Global Esters Market Analysis, Opportunity and Forecast, By By End-Use Industry, 2016-2032
- 3.6.1. Global Esters Market Analysis by By End-Use Industry: Introduction
- 3.6.2. Market Size Absolute $ Opportunity Analysis and Forecast, By By End-Use Industry, 2016-2032
- 3.6.3. Chemicals
- 3.6.4. Food
- 3.6.5. Automotive and Aviation
- 3.6.6. Marine
- 3.6.7. Other End-Use Industries
- 4. North America Esters Market Analysis, Opportunity and Forecast, 2016-2032
- 4.1. North America Esters Market Analysis, 2016-2021
- 4.2. North America Esters Market Opportunity and Forecast, 2023-2032
- 4.3. North America Esters Market Analysis, Opportunity and Forecast, By By Source, 2016-2032
- 4.3.1. North America Esters Market Analysis by By Source: Introduction
- 4.3.2. Market Size Absolute $ Opportunity Analysis and Forecast, By By Source, 2016-2032
- 4.3.3. Natural
- 4.3.4. Synthetic
- 4.4. North America Esters Market Analysis, Opportunity and Forecast, By By Product Type, 2016-2032
- 4.4.1. North America Esters Market Analysis by By Product Type: Introduction
- 4.4.2. Market Size Absolute $ Opportunity Analysis and Forecast, By By Product Type, 2016-2032
- 4.4.3. Dibasic Esters
- 4.4.4. Polyol Esters
- 4.4.5. Methyl Esters
- 4.4.6. Nitrate Esters
- 4.4.7. Vinyl Esters
- 4.4.8. Other Product Types
- 4.5. North America Esters Market Analysis, Opportunity and Forecast, By By Application, 2016-2032
- 4.5.1. North America Esters Market Analysis by By Application: Introduction
- 4.5.2. Market Size Absolute $ Opportunity Analysis and Forecast, By By Application, 2016-2032
- 4.5.3. Lubricants
- 4.5.4. Solvents
- 4.5.5. Plasticizers
- 4.5.6. Fuel and Oil Additives
- 4.5.7. Other Applications
- 4.6. North America Esters Market Analysis, Opportunity and Forecast, By By End-Use Industry, 2016-2032
- 4.6.1. North America Esters Market Analysis by By End-Use Industry: Introduction
- 4.6.2. Market Size Absolute $ Opportunity Analysis and Forecast, By By End-Use Industry, 2016-2032
- 4.6.3. Chemicals
- 4.6.4. Food
- 4.6.5. Automotive and Aviation
- 4.6.6. Marine
- 4.6.7. Other End-Use Industries
- 4.7. North America Esters Market Analysis, Opportunity and Forecast, By Country , 2016-2032
- 4.7.1. North America Esters Market Analysis by Country : Introduction
- 4.7.2. Market Size Absolute $ Opportunity Analysis and Forecast, Country , 2016-2032
- 4.7.2.1. The US
- 4.7.2.2. Canada
- 4.7.2.3. Mexico
- 5. Western Europe Esters Market Analysis, Opportunity and Forecast, 2016-2032
- 5.1. Western Europe Esters Market Analysis, 2016-2021
- 5.2. Western Europe Esters Market Opportunity and Forecast, 2023-2032
- 5.3. Western Europe Esters Market Analysis, Opportunity and Forecast, By By Source, 2016-2032
- 5.3.1. Western Europe Esters Market Analysis by By Source: Introduction
- 5.3.2. Market Size Absolute $ Opportunity Analysis and Forecast, By By Source, 2016-2032
- 5.3.3. Natural
- 5.3.4. Synthetic
- 5.4. Western Europe Esters Market Analysis, Opportunity and Forecast, By By Product Type, 2016-2032
- 5.4.1. Western Europe Esters Market Analysis by By Product Type: Introduction
- 5.4.2. Market Size Absolute $ Opportunity Analysis and Forecast, By By Product Type, 2016-2032
- 5.4.3. Dibasic Esters
- 5.4.4. Polyol Esters
- 5.4.5. Methyl Esters
- 5.4.6. Nitrate Esters
- 5.4.7. Vinyl Esters
- 5.4.8. Other Product Types
- 5.5. Western Europe Esters Market Analysis, Opportunity and Forecast, By By Application, 2016-2032
- 5.5.1. Western Europe Esters Market Analysis by By Application: Introduction
- 5.5.2. Market Size Absolute $ Opportunity Analysis and Forecast, By By Application, 2016-2032
- 5.5.3. Lubricants
- 5.5.4. Solvents
- 5.5.5. Plasticizers
- 5.5.6. Fuel and Oil Additives
- 5.5.7. Other Applications
- 5.6. Western Europe Esters Market Analysis, Opportunity and Forecast, By By End-Use Industry, 2016-2032
- 5.6.1. Western Europe Esters Market Analysis by By End-Use Industry: Introduction
- 5.6.2. Market Size Absolute $ Opportunity Analysis and Forecast, By By End-Use Industry, 2016-2032
- 5.6.3. Chemicals
- 5.6.4. Food
- 5.6.5. Automotive and Aviation
- 5.6.6. Marine
- 5.6.7. Other End-Use Industries
- 5.7. Western Europe Esters Market Analysis, Opportunity and Forecast, By Country , 2016-2032
- 5.7.1. Western Europe Esters Market Analysis by Country : Introduction
- 5.7.2. Market Size Absolute $ Opportunity Analysis and Forecast, Country , 2016-2032
- 5.7.2.1. Germany
- 5.7.2.2. France
- 5.7.2.3. The UK
- 5.7.2.4. Spain
- 5.7.2.5. Italy
- 5.7.2.6. Portugal
- 5.7.2.7. Ireland
- 5.7.2.8. Austria
- 5.7.2.9. Switzerland
- 5.7.2.10. Benelux
- 5.7.2.11. Nordic
- 5.7.2.12. Rest of Western Europe
- 6. Eastern Europe Esters Market Analysis, Opportunity and Forecast, 2016-2032
- 6.1. Eastern Europe Esters Market Analysis, 2016-2021
- 6.2. Eastern Europe Esters Market Opportunity and Forecast, 2023-2032
- 6.3. Eastern Europe Esters Market Analysis, Opportunity and Forecast, By By Source, 2016-2032
- 6.3.1. Eastern Europe Esters Market Analysis by By Source: Introduction
- 6.3.2. Market Size Absolute $ Opportunity Analysis and Forecast, By By Source, 2016-2032
- 6.3.3. Natural
- 6.3.4. Synthetic
- 6.4. Eastern Europe Esters Market Analysis, Opportunity and Forecast, By By Product Type, 2016-2032
- 6.4.1. Eastern Europe Esters Market Analysis by By Product Type: Introduction
- 6.4.2. Market Size Absolute $ Opportunity Analysis and Forecast, By By Product Type, 2016-2032
- 6.4.3. Dibasic Esters
- 6.4.4. Polyol Esters
- 6.4.5. Methyl Esters
- 6.4.6. Nitrate Esters
- 6.4.7. Vinyl Esters
- 6.4.8. Other Product Types
- 6.5. Eastern Europe Esters Market Analysis, Opportunity and Forecast, By By Application, 2016-2032
- 6.5.1. Eastern Europe Esters Market Analysis by By Application: Introduction
- 6.5.2. Market Size Absolute $ Opportunity Analysis and Forecast, By By Application, 2016-2032
- 6.5.3. Lubricants
- 6.5.4. Solvents
- 6.5.5. Plasticizers
- 6.5.6. Fuel and Oil Additives
- 6.5.7. Other Applications
- 6.6. Eastern Europe Esters Market Analysis, Opportunity and Forecast, By By End-Use Industry, 2016-2032
- 6.6.1. Eastern Europe Esters Market Analysis by By End-Use Industry: Introduction
- 6.6.2. Market Size Absolute $ Opportunity Analysis and Forecast, By By End-Use Industry, 2016-2032
- 6.6.3. Chemicals
- 6.6.4. Food
- 6.6.5. Automotive and Aviation
- 6.6.6. Marine
- 6.6.7. Other End-Use Industries
- 6.7. Eastern Europe Esters Market Analysis, Opportunity and Forecast, By Country , 2016-2032
- 6.7.1. Eastern Europe Esters Market Analysis by Country : Introduction
- 6.7.2. Market Size Absolute $ Opportunity Analysis and Forecast, Country , 2016-2032
- 6.7.2.1. Russia
- 6.7.2.2. Poland
- 6.7.2.3. The Czech Republic
- 6.7.2.4. Greece
- 6.7.2.5. Rest of Eastern Europe
- 7. APAC Esters Market Analysis, Opportunity and Forecast, 2016-2032
- 7.1. APAC Esters Market Analysis, 2016-2021
- 7.2. APAC Esters Market Opportunity and Forecast, 2023-2032
- 7.3. APAC Esters Market Analysis, Opportunity and Forecast, By By Source, 2016-2032
- 7.3.1. APAC Esters Market Analysis by By Source: Introduction
- 7.3.2. Market Size Absolute $ Opportunity Analysis and Forecast, By By Source, 2016-2032
- 7.3.3. Natural
- 7.3.4. Synthetic
- 7.4. APAC Esters Market Analysis, Opportunity and Forecast, By By Product Type, 2016-2032
- 7.4.1. APAC Esters Market Analysis by By Product Type: Introduction
- 7.4.2. Market Size Absolute $ Opportunity Analysis and Forecast, By By Product Type, 2016-2032
- 7.4.3. Dibasic Esters
- 7.4.4. Polyol Esters
- 7.4.5. Methyl Esters
- 7.4.6. Nitrate Esters
- 7.4.7. Vinyl Esters
- 7.4.8. Other Product Types
- 7.5. APAC Esters Market Analysis, Opportunity and Forecast, By By Application, 2016-2032
- 7.5.1. APAC Esters Market Analysis by By Application: Introduction
- 7.5.2. Market Size Absolute $ Opportunity Analysis and Forecast, By By Application, 2016-2032
- 7.5.3. Lubricants
- 7.5.4. Solvents
- 7.5.5. Plasticizers
- 7.5.6. Fuel and Oil Additives
- 7.5.7. Other Applications
- 7.6. APAC Esters Market Analysis, Opportunity and Forecast, By By End-Use Industry, 2016-2032
- 7.6.1. APAC Esters Market Analysis by By End-Use Industry: Introduction
- 7.6.2. Market Size Absolute $ Opportunity Analysis and Forecast, By By End-Use Industry, 2016-2032
- 7.6.3. Chemicals
- 7.6.4. Food
- 7.6.5. Automotive and Aviation
- 7.6.6. Marine
- 7.6.7. Other End-Use Industries
- 7.7. APAC Esters Market Analysis, Opportunity and Forecast, By Country , 2016-2032
- 7.7.1. APAC Esters Market Analysis by Country : Introduction
- 7.7.2. Market Size Absolute $ Opportunity Analysis and Forecast, Country , 2016-2032
- 7.7.2.1. China
- 7.7.2.2. Japan
- 7.7.2.3. South Korea
- 7.7.2.4. India
- 7.7.2.5. Australia & New Zeland
- 7.7.2.6. Indonesia
- 7.7.2.7. Malaysia
- 7.7.2.8. Philippines
- 7.7.2.9. Singapore
- 7.7.2.10. Thailand
- 7.7.2.11. Vietnam
- 7.7.2.12. Rest of APAC
- 8. Latin America Esters Market Analysis, Opportunity and Forecast, 2016-2032
- 8.1. Latin America Esters Market Analysis, 2016-2021
- 8.2. Latin America Esters Market Opportunity and Forecast, 2023-2032
- 8.3. Latin America Esters Market Analysis, Opportunity and Forecast, By By Source, 2016-2032
- 8.3.1. Latin America Esters Market Analysis by By Source: Introduction
- 8.3.2. Market Size Absolute $ Opportunity Analysis and Forecast, By By Source, 2016-2032
- 8.3.3. Natural
- 8.3.4. Synthetic
- 8.4. Latin America Esters Market Analysis, Opportunity and Forecast, By By Product Type, 2016-2032
- 8.4.1. Latin America Esters Market Analysis by By Product Type: Introduction
- 8.4.2. Market Size Absolute $ Opportunity Analysis and Forecast, By By Product Type, 2016-2032
- 8.4.3. Dibasic Esters
- 8.4.4. Polyol Esters
- 8.4.5. Methyl Esters
- 8.4.6. Nitrate Esters
- 8.4.7. Vinyl Esters
- 8.4.8. Other Product Types
- 8.5. Latin America Esters Market Analysis, Opportunity and Forecast, By By Application, 2016-2032
- 8.5.1. Latin America Esters Market Analysis by By Application: Introduction
- 8.5.2. Market Size Absolute $ Opportunity Analysis and Forecast, By By Application, 2016-2032
- 8.5.3. Lubricants
- 8.5.4. Solvents
- 8.5.5. Plasticizers
- 8.5.6. Fuel and Oil Additives
- 8.5.7. Other Applications
- 8.6. Latin America Esters Market Analysis, Opportunity and Forecast, By By End-Use Industry, 2016-2032
- 8.6.1. Latin America Esters Market Analysis by By End-Use Industry: Introduction
- 8.6.2. Market Size Absolute $ Opportunity Analysis and Forecast, By By End-Use Industry, 2016-2032
- 8.6.3. Chemicals
- 8.6.4. Food
- 8.6.5. Automotive and Aviation
- 8.6.6. Marine
- 8.6.7. Other End-Use Industries
- 8.7. Latin America Esters Market Analysis, Opportunity and Forecast, By Country , 2016-2032
- 8.7.1. Latin America Esters Market Analysis by Country : Introduction
- 8.7.2. Market Size Absolute $ Opportunity Analysis and Forecast, Country , 2016-2032
- 8.7.2.1. Brazil
- 8.7.2.2. Colombia
- 8.7.2.3. Chile
- 8.7.2.4. Argentina
- 8.7.2.5. Costa Rica
- 8.7.2.6. Rest of Latin America
- 9. Middle East & Africa Esters Market Analysis, Opportunity and Forecast, 2016-2032
- 9.1. Middle East & Africa Esters Market Analysis, 2016-2021
- 9.2. Middle East & Africa Esters Market Opportunity and Forecast, 2023-2032
- 9.3. Middle East & Africa Esters Market Analysis, Opportunity and Forecast, By By Source, 2016-2032
- 9.3.1. Middle East & Africa Esters Market Analysis by By Source: Introduction
- 9.3.2. Market Size Absolute $ Opportunity Analysis and Forecast, By By Source, 2016-2032
- 9.3.3. Natural
- 9.3.4. Synthetic
- 9.4. Middle East & Africa Esters Market Analysis, Opportunity and Forecast, By By Product Type, 2016-2032
- 9.4.1. Middle East & Africa Esters Market Analysis by By Product Type: Introduction
- 9.4.2. Market Size Absolute $ Opportunity Analysis and Forecast, By By Product Type, 2016-2032
- 9.4.3. Dibasic Esters
- 9.4.4. Polyol Esters
- 9.4.5. Methyl Esters
- 9.4.6. Nitrate Esters
- 9.4.7. Vinyl Esters
- 9.4.8. Other Product Types
- 9.5. Middle East & Africa Esters Market Analysis, Opportunity and Forecast, By By Application, 2016-2032
- 9.5.1. Middle East & Africa Esters Market Analysis by By Application: Introduction
- 9.5.2. Market Size Absolute $ Opportunity Analysis and Forecast, By By Application, 2016-2032
- 9.5.3. Lubricants
- 9.5.4. Solvents
- 9.5.5. Plasticizers
- 9.5.6. Fuel and Oil Additives
- 9.5.7. Other Applications
- 9.6. Middle East & Africa Esters Market Analysis, Opportunity and Forecast, By By End-Use Industry, 2016-2032
- 9.6.1. Middle East & Africa Esters Market Analysis by By End-Use Industry: Introduction
- 9.6.2. Market Size Absolute $ Opportunity Analysis and Forecast, By By End-Use Industry, 2016-2032
- 9.6.3. Chemicals
- 9.6.4. Food
- 9.6.5. Automotive and Aviation
- 9.6.6. Marine
- 9.6.7. Other End-Use Industries
- 9.7. Middle East & Africa Esters Market Analysis, Opportunity and Forecast, By Country , 2016-2032
- 9.7.1. Middle East & Africa Esters Market Analysis by Country : Introduction
- 9.7.2. Market Size Absolute $ Opportunity Analysis and Forecast, Country , 2016-2032
- 9.7.2.1. Algeria
- 9.7.2.2. Egypt
- 9.7.2.3. Israel
- 9.7.2.4. Kuwait
- 9.7.2.5. Nigeria
- 9.7.2.6. Saudi Arabia
- 9.7.2.7. South Africa
- 9.7.2.8. Turkey
- 9.7.2.9. The UAE
- 9.7.2.10. Rest of MEA
- 10. Global Esters Market Analysis, Opportunity and Forecast, By Region , 2016-2032
- 10.1. Global Esters Market Analysis by Region : Introduction
- 10.2. Market Size Absolute $ Opportunity Analysis and Forecast, By Region , 2016-2032
- 10.2.1. North America
- 10.2.2. Western Europe
- 10.2.3. Eastern Europe
- 10.2.4. APAC
- 10.2.5. Latin America
- 10.2.6. Middle East & Africa
- 11. Global Esters Market Competitive Landscape, Market Share Analysis, and Company Profiles
- 11.1. Market Share Analysis
- 11.2. Company Profiles
- 11.3. DuPont (U.S.)
- 11.3.1. Company Overview
- 11.3.2. Financial Highlights
- 11.3.3. Product Portfolio
- 11.3.4. SWOT Analysis
- 11.3.5. Key Strategies and Developments
- 11.4. Solvay (Belgium)
- 11.4.1. Company Overview
- 11.4.2. Financial Highlights
- 11.4.3. Product Portfolio
- 11.4.4. SWOT Analysis
- 11.4.5. Key Strategies and Developments
- 11.5. Huntsman International LLC (U.S.)
- 11.5.1. Company Overview
- 11.5.2. Financial Highlights
- 11.5.3. Product Portfolio
- 11.5.4. SWOT Analysis
- 11.5.5. Key Strategies and Developments
- 11.6. DAIKIN (Japan)
- 11.6.1. Company Overview
- 11.6.2. Financial Highlights
- 11.6.3. Product Portfolio
- 11.6.4. SWOT Analysis
- 11.6.5. Key Strategies and Developments
- 11.7. Dow (U.S.)
- 11.7.1. Company Overview
- 11.7.2. Financial Highlights
- 11.7.3. Product Portfolio
- 11.7.4. SWOT Analysis
- 11.7.5. Key Strategies and Developments
- 11.8. Ashland (U.S.)
- 11.8.1. Company Overview
- 11.8.2. Financial Highlights
- 11.8.3. Product Portfolio
- 11.8.4. SWOT Analysis
- 11.8.5. Key Strategies and Developments
- 11.9. DAK Americas (U.S.)
- 11.9.1. Company Overview
- 11.9.2. Financial Highlights
- 11.9.3. Product Portfolio
- 11.9.4. SWOT Analysis
- 11.9.5. Key Strategies and Developments
- 11.10. Esterchem Ltd. (U.K)
- 11.10.1. Company Overview
- 11.10.2. Financial Highlights
- 11.10.3. Product Portfolio
- 11.10.4. SWOT Analysis
- 11.10.5. Key Strategies and Developments
- 11.11. Sumitomo Chemical Co., Ltd. (Japan)
- 11.11.1. Company Overview
- 11.11.2. Financial Highlights
- 11.11.3. Product Portfolio
- 11.11.4. SWOT Analysis
- 11.11.5. Key Strategies and Developments
- 11.12. ABITEC (U.S.)
- 11.12.1. Company Overview
- 11.12.2. Financial Highlights
- 11.12.3. Product Portfolio
- 11.12.4. SWOT Analysis
- 11.12.5. Key Strategies and Developments
- 11.13. ADM (U.S.)
- 11.13.1. Company Overview
- 11.13.2. Financial Highlights
- 11.13.3. Product Portfolio
- 11.13.4. SWOT Analysis
- 11.13.5. Key Strategies and Developments
- 11.14. BASF SE (Germany)
- 11.14.1. Company Overview
- 11.14.2. Financial Highlights
- 11.14.3. Product Portfolio
- 11.14.4. SWOT Analysis
- 11.14.5. Key Strategies and Developments
- 11.15. IFFCO (Turkey)
- 11.15.1. Company Overview
- 11.15.2. Financial Highlights
- 11.15.3. Product Portfolio
- 11.15.4. SWOT Analysis
- 11.15.5. Key Strategies and Developments
- 11.16. AkzoNobel N.V. (Netherlands)
- 11.16.1. Company Overview
- 11.16.2. Financial Highlights
- 11.16.3. Product Portfolio
- 11.16.4. SWOT Analysis
- 11.16.5. Key Strategies and Developments
- 11.17. Biotage (Sweden)
- 11.17.1. Company Overview
- 11.17.2. Financial Highlights
- 11.17.3. Product Portfolio
- 11.17.4. SWOT Analysis
- 11.17.5. Key Strategies and Developments
- 11.18. Stepan Company (U.S.)
- 11.18.1. Company Overview
- 11.18.2. Financial Highlights
- 11.18.3. Product Portfolio
- 11.18.4. SWOT Analysis
- 11.18.5. Key Strategies and Developments
- 11.19. DSM (Netherlands)
- 11.19.1. Company Overview
- 11.19.2. Financial Highlights
- 11.19.3. Product Portfolio
- 11.19.4. SWOT Analysis
- 11.19.5. Key Strategies and Developments
- 11.20. CEM Corporation (U.S.)
- 11.20.1. Company Overview
- 11.20.2. Financial Highlights
- 11.20.3. Product Portfolio
- 11.20.4. SWOT Analysis
- 11.20.5. Key Strategies and Developments
- 11.21. Fine Organics (India)
- 11.21.1. Company Overview
- 11.21.2. Financial Highlights
- 11.21.3. Product Portfolio
- 11.21.4. SWOT Analysis
- 11.21.5. Key Strategies and Developments
- 11.22. Subhash Chemicals (India)
- 11.22.1. Company Overview
- 11.22.2. Financial Highlights
- 11.22.3. Product Portfolio
- 11.22.4. SWOT Analysis
- 11.22.5. Key Strategies and Developments
- 12. Assumptions and Acronyms
- 13. Research Methodology
- 14. Contact
"
- List of Figures
- "
- Figure 1: Global Esters Market Revenue (US$ Mn) Market Share by Source in 2022
- Figure 2: Global Esters Market Attractiveness Analysis by Source, 2016-2032
- Figure 3: Global Esters Market Revenue (US$ Mn) Market Share by Product Typein 2022
- Figure 4: Global Esters Market Attractiveness Analysis by Product Type, 2016-2032
- Figure 5: Global Esters Market Revenue (US$ Mn) Market Share by Applicationin 2022
- Figure 6: Global Esters Market Attractiveness Analysis by Application, 2016-2032
- Figure 7: Global Esters Market Revenue (US$ Mn) Market Share by End-Use Industryin 2022
- Figure 8: Global Esters Market Attractiveness Analysis by End-Use Industry, 2016-2032
- Figure 9: Global Esters Market Revenue (US$ Mn) Market Share by Region in 2022
- Figure 10: Global Esters Market Attractiveness Analysis by Region, 2016-2032
- Figure 11: Global Esters Market Revenue (US$ Mn) (2016-2032)
- Figure 12: Global Esters Market Revenue (US$ Mn) Comparison by Region (2016-2032)
- Figure 13: Global Esters Market Revenue (US$ Mn) Comparison by Source (2016-2032)
- Figure 14: Global Esters Market Revenue (US$ Mn) Comparison by Product Type (2016-2032)
- Figure 15: Global Esters Market Revenue (US$ Mn) Comparison by Application (2016-2032)
- Figure 16: Global Esters Market Revenue (US$ Mn) Comparison by End-Use Industry (2016-2032)
- Figure 17: Global Esters Market Y-o-Y Growth Rate Comparison by Region (2016-2032)
- Figure 18: Global Esters Market Y-o-Y Growth Rate Comparison by Source (2016-2032)
- Figure 19: Global Esters Market Y-o-Y Growth Rate Comparison by Product Type (2016-2032)
- Figure 20: Global Esters Market Y-o-Y Growth Rate Comparison by Application (2016-2032)
- Figure 21: Global Esters Market Y-o-Y Growth Rate Comparison by End-Use Industry (2016-2032)
- Figure 22: Global Esters Market Share Comparison by Region (2016-2032)
- Figure 23: Global Esters Market Share Comparison by Source (2016-2032)
- Figure 24: Global Esters Market Share Comparison by Product Type (2016-2032)
- Figure 25: Global Esters Market Share Comparison by Application (2016-2032)
- Figure 26: Global Esters Market Share Comparison by End-Use Industry (2016-2032)
- Figure 27: North America Esters Market Revenue (US$ Mn) Market Share by Sourcein 2022
- Figure 28: North America Esters Market Attractiveness Analysis by Source, 2016-2032
- Figure 29: North America Esters Market Revenue (US$ Mn) Market Share by Product Typein 2022
- Figure 30: North America Esters Market Attractiveness Analysis by Product Type, 2016-2032
- Figure 31: North America Esters Market Revenue (US$ Mn) Market Share by Applicationin 2022
- Figure 32: North America Esters Market Attractiveness Analysis by Application, 2016-2032
- Figure 33: North America Esters Market Revenue (US$ Mn) Market Share by End-Use Industryin 2022
- Figure 34: North America Esters Market Attractiveness Analysis by End-Use Industry, 2016-2032
- Figure 35: North America Esters Market Revenue (US$ Mn) Market Share by Country in 2022
- Figure 36: North America Esters Market Attractiveness Analysis by Country, 2016-2032
- Figure 37: North America Esters Market Revenue (US$ Mn) (2016-2032)
- Figure 38: North America Esters Market Revenue (US$ Mn) Comparison by Country (2016-2032)
- Figure 39: North America Esters Market Revenue (US$ Mn) Comparison by Source (2016-2032)
- Figure 40: North America Esters Market Revenue (US$ Mn) Comparison by Product Type (2016-2032)
- Figure 41: North America Esters Market Revenue (US$ Mn) Comparison by Application (2016-2032)
- Figure 42: North America Esters Market Revenue (US$ Mn) Comparison by End-Use Industry (2016-2032)
- Figure 43: North America Esters Market Y-o-Y Growth Rate Comparison by Country (2016-2032)
- Figure 44: North America Esters Market Y-o-Y Growth Rate Comparison by Source (2016-2032)
- Figure 45: North America Esters Market Y-o-Y Growth Rate Comparison by Product Type (2016-2032)
- Figure 46: North America Esters Market Y-o-Y Growth Rate Comparison by Application (2016-2032)
- Figure 47: North America Esters Market Y-o-Y Growth Rate Comparison by End-Use Industry (2016-2032)
- Figure 48: North America Esters Market Share Comparison by Country (2016-2032)
- Figure 49: North America Esters Market Share Comparison by Source (2016-2032)
- Figure 50: North America Esters Market Share Comparison by Product Type (2016-2032)
- Figure 51: North America Esters Market Share Comparison by Application (2016-2032)
- Figure 52: North America Esters Market Share Comparison by End-Use Industry (2016-2032)
- Figure 53: Western Europe Esters Market Revenue (US$ Mn) Market Share by Sourcein 2022
- Figure 54: Western Europe Esters Market Attractiveness Analysis by Source, 2016-2032
- Figure 55: Western Europe Esters Market Revenue (US$ Mn) Market Share by Product Typein 2022
- Figure 56: Western Europe Esters Market Attractiveness Analysis by Product Type, 2016-2032
- Figure 57: Western Europe Esters Market Revenue (US$ Mn) Market Share by Applicationin 2022
- Figure 58: Western Europe Esters Market Attractiveness Analysis by Application, 2016-2032
- Figure 59: Western Europe Esters Market Revenue (US$ Mn) Market Share by End-Use Industryin 2022
- Figure 60: Western Europe Esters Market Attractiveness Analysis by End-Use Industry, 2016-2032
- Figure 61: Western Europe Esters Market Revenue (US$ Mn) Market Share by Country in 2022
- Figure 62: Western Europe Esters Market Attractiveness Analysis by Country, 2016-2032
- Figure 63: Western Europe Esters Market Revenue (US$ Mn) (2016-2032)
- Figure 64: Western Europe Esters Market Revenue (US$ Mn) Comparison by Country (2016-2032)
- Figure 65: Western Europe Esters Market Revenue (US$ Mn) Comparison by Source (2016-2032)
- Figure 66: Western Europe Esters Market Revenue (US$ Mn) Comparison by Product Type (2016-2032)
- Figure 67: Western Europe Esters Market Revenue (US$ Mn) Comparison by Application (2016-2032)
- Figure 68: Western Europe Esters Market Revenue (US$ Mn) Comparison by End-Use Industry (2016-2032)
- Figure 69: Western Europe Esters Market Y-o-Y Growth Rate Comparison by Country (2016-2032)
- Figure 70: Western Europe Esters Market Y-o-Y Growth Rate Comparison by Source (2016-2032)
- Figure 71: Western Europe Esters Market Y-o-Y Growth Rate Comparison by Product Type (2016-2032)
- Figure 72: Western Europe Esters Market Y-o-Y Growth Rate Comparison by Application (2016-2032)
- Figure 73: Western Europe Esters Market Y-o-Y Growth Rate Comparison by End-Use Industry (2016-2032)
- Figure 74: Western Europe Esters Market Share Comparison by Country (2016-2032)
- Figure 75: Western Europe Esters Market Share Comparison by Source (2016-2032)
- Figure 76: Western Europe Esters Market Share Comparison by Product Type (2016-2032)
- Figure 77: Western Europe Esters Market Share Comparison by Application (2016-2032)
- Figure 78: Western Europe Esters Market Share Comparison by End-Use Industry (2016-2032)
- Figure 79: Eastern Europe Esters Market Revenue (US$ Mn) Market Share by Sourcein 2022
- Figure 80: Eastern Europe Esters Market Attractiveness Analysis by Source, 2016-2032
- Figure 81: Eastern Europe Esters Market Revenue (US$ Mn) Market Share by Product Typein 2022
- Figure 82: Eastern Europe Esters Market Attractiveness Analysis by Product Type, 2016-2032
- Figure 83: Eastern Europe Esters Market Revenue (US$ Mn) Market Share by Applicationin 2022
- Figure 84: Eastern Europe Esters Market Attractiveness Analysis by Application, 2016-2032
- Figure 85: Eastern Europe Esters Market Revenue (US$ Mn) Market Share by End-Use Industryin 2022
- Figure 86: Eastern Europe Esters Market Attractiveness Analysis by End-Use Industry, 2016-2032
- Figure 87: Eastern Europe Esters Market Revenue (US$ Mn) Market Share by Country in 2022
- Figure 88: Eastern Europe Esters Market Attractiveness Analysis by Country, 2016-2032
- Figure 89: Eastern Europe Esters Market Revenue (US$ Mn) (2016-2032)
- Figure 90: Eastern Europe Esters Market Revenue (US$ Mn) Comparison by Country (2016-2032)
- Figure 91: Eastern Europe Esters Market Revenue (US$ Mn) Comparison by Source (2016-2032)
- Figure 92: Eastern Europe Esters Market Revenue (US$ Mn) Comparison by Product Type (2016-2032)
- Figure 93: Eastern Europe Esters Market Revenue (US$ Mn) Comparison by Application (2016-2032)
- Figure 94: Eastern Europe Esters Market Revenue (US$ Mn) Comparison by End-Use Industry (2016-2032)
- Figure 95: Eastern Europe Esters Market Y-o-Y Growth Rate Comparison by Country (2016-2032)
- Figure 96: Eastern Europe Esters Market Y-o-Y Growth Rate Comparison by Source (2016-2032)
- Figure 97: Eastern Europe Esters Market Y-o-Y Growth Rate Comparison by Product Type (2016-2032)
- Figure 98: Eastern Europe Esters Market Y-o-Y Growth Rate Comparison by Application (2016-2032)
- Figure 99: Eastern Europe Esters Market Y-o-Y Growth Rate Comparison by End-Use Industry (2016-2032)
- Figure 100: Eastern Europe Esters Market Share Comparison by Country (2016-2032)
- Figure 101: Eastern Europe Esters Market Share Comparison by Source (2016-2032)
- Figure 102: Eastern Europe Esters Market Share Comparison by Product Type (2016-2032)
- Figure 103: Eastern Europe Esters Market Share Comparison by Application (2016-2032)
- Figure 104: Eastern Europe Esters Market Share Comparison by End-Use Industry (2016-2032)
- Figure 105: APAC Esters Market Revenue (US$ Mn) Market Share by Sourcein 2022
- Figure 106: APAC Esters Market Attractiveness Analysis by Source, 2016-2032
- Figure 107: APAC Esters Market Revenue (US$ Mn) Market Share by Product Typein 2022
- Figure 108: APAC Esters Market Attractiveness Analysis by Product Type, 2016-2032
- Figure 109: APAC Esters Market Revenue (US$ Mn) Market Share by Applicationin 2022
- Figure 110: APAC Esters Market Attractiveness Analysis by Application, 2016-2032
- Figure 111: APAC Esters Market Revenue (US$ Mn) Market Share by End-Use Industryin 2022
- Figure 112: APAC Esters Market Attractiveness Analysis by End-Use Industry, 2016-2032
- Figure 113: APAC Esters Market Revenue (US$ Mn) Market Share by Country in 2022
- Figure 114: APAC Esters Market Attractiveness Analysis by Country, 2016-2032
- Figure 115: APAC Esters Market Revenue (US$ Mn) (2016-2032)
- Figure 116: APAC Esters Market Revenue (US$ Mn) Comparison by Country (2016-2032)
- Figure 117: APAC Esters Market Revenue (US$ Mn) Comparison by Source (2016-2032)
- Figure 118: APAC Esters Market Revenue (US$ Mn) Comparison by Product Type (2016-2032)
- Figure 119: APAC Esters Market Revenue (US$ Mn) Comparison by Application (2016-2032)
- Figure 120: APAC Esters Market Revenue (US$ Mn) Comparison by End-Use Industry (2016-2032)
- Figure 121: APAC Esters Market Y-o-Y Growth Rate Comparison by Country (2016-2032)
- Figure 122: APAC Esters Market Y-o-Y Growth Rate Comparison by Source (2016-2032)
- Figure 123: APAC Esters Market Y-o-Y Growth Rate Comparison by Product Type (2016-2032)
- Figure 124: APAC Esters Market Y-o-Y Growth Rate Comparison by Application (2016-2032)
- Figure 125: APAC Esters Market Y-o-Y Growth Rate Comparison by End-Use Industry (2016-2032)
- Figure 126: APAC Esters Market Share Comparison by Country (2016-2032)
- Figure 127: APAC Esters Market Share Comparison by Source (2016-2032)
- Figure 128: APAC Esters Market Share Comparison by Product Type (2016-2032)
- Figure 129: APAC Esters Market Share Comparison by Application (2016-2032)
- Figure 130: APAC Esters Market Share Comparison by End-Use Industry (2016-2032)
- Figure 131: Latin America Esters Market Revenue (US$ Mn) Market Share by Sourcein 2022
- Figure 132: Latin America Esters Market Attractiveness Analysis by Source, 2016-2032
- Figure 133: Latin America Esters Market Revenue (US$ Mn) Market Share by Product Typein 2022
- Figure 134: Latin America Esters Market Attractiveness Analysis by Product Type, 2016-2032
- Figure 135: Latin America Esters Market Revenue (US$ Mn) Market Share by Applicationin 2022
- Figure 136: Latin America Esters Market Attractiveness Analysis by Application, 2016-2032
- Figure 137: Latin America Esters Market Revenue (US$ Mn) Market Share by End-Use Industryin 2022
- Figure 138: Latin America Esters Market Attractiveness Analysis by End-Use Industry, 2016-2032
- Figure 139: Latin America Esters Market Revenue (US$ Mn) Market Share by Country in 2022
- Figure 140: Latin America Esters Market Attractiveness Analysis by Country, 2016-2032
- Figure 141: Latin America Esters Market Revenue (US$ Mn) (2016-2032)
- Figure 142: Latin America Esters Market Revenue (US$ Mn) Comparison by Country (2016-2032)
- Figure 143: Latin America Esters Market Revenue (US$ Mn) Comparison by Source (2016-2032)
- Figure 144: Latin America Esters Market Revenue (US$ Mn) Comparison by Product Type (2016-2032)
- Figure 145: Latin America Esters Market Revenue (US$ Mn) Comparison by Application (2016-2032)
- Figure 146: Latin America Esters Market Revenue (US$ Mn) Comparison by End-Use Industry (2016-2032)
- Figure 147: Latin America Esters Market Y-o-Y Growth Rate Comparison by Country (2016-2032)
- Figure 148: Latin America Esters Market Y-o-Y Growth Rate Comparison by Source (2016-2032)
- Figure 149: Latin America Esters Market Y-o-Y Growth Rate Comparison by Product Type (2016-2032)
- Figure 150: Latin America Esters Market Y-o-Y Growth Rate Comparison by Application (2016-2032)
- Figure 151: Latin America Esters Market Y-o-Y Growth Rate Comparison by End-Use Industry (2016-2032)
- Figure 152: Latin America Esters Market Share Comparison by Country (2016-2032)
- Figure 153: Latin America Esters Market Share Comparison by Source (2016-2032)
- Figure 154: Latin America Esters Market Share Comparison by Product Type (2016-2032)
- Figure 155: Latin America Esters Market Share Comparison by Application (2016-2032)
- Figure 156: Latin America Esters Market Share Comparison by End-Use Industry (2016-2032)
- Figure 157: Middle East & Africa Esters Market Revenue (US$ Mn) Market Share by Sourcein 2022
- Figure 158: Middle East & Africa Esters Market Attractiveness Analysis by Source, 2016-2032
- Figure 159: Middle East & Africa Esters Market Revenue (US$ Mn) Market Share by Product Typein 2022
- Figure 160: Middle East & Africa Esters Market Attractiveness Analysis by Product Type, 2016-2032
- Figure 161: Middle East & Africa Esters Market Revenue (US$ Mn) Market Share by Applicationin 2022
- Figure 162: Middle East & Africa Esters Market Attractiveness Analysis by Application, 2016-2032
- Figure 163: Middle East & Africa Esters Market Revenue (US$ Mn) Market Share by End-Use Industryin 2022
- Figure 164: Middle East & Africa Esters Market Attractiveness Analysis by End-Use Industry, 2016-2032
- Figure 165: Middle East & Africa Esters Market Revenue (US$ Mn) Market Share by Country in 2022
- Figure 166: Middle East & Africa Esters Market Attractiveness Analysis by Country, 2016-2032
- Figure 167: Middle East & Africa Esters Market Revenue (US$ Mn) (2016-2032)
- Figure 168: Middle East & Africa Esters Market Revenue (US$ Mn) Comparison by Country (2016-2032)
- Figure 169: Middle East & Africa Esters Market Revenue (US$ Mn) Comparison by Source (2016-2032)
- Figure 170: Middle East & Africa Esters Market Revenue (US$ Mn) Comparison by Product Type (2016-2032)
- Figure 171: Middle East & Africa Esters Market Revenue (US$ Mn) Comparison by Application (2016-2032)
- Figure 172: Middle East & Africa Esters Market Revenue (US$ Mn) Comparison by End-Use Industry (2016-2032)
- Figure 173: Middle East & Africa Esters Market Y-o-Y Growth Rate Comparison by Country (2016-2032)
- Figure 174: Middle East & Africa Esters Market Y-o-Y Growth Rate Comparison by Source (2016-2032)
- Figure 175: Middle East & Africa Esters Market Y-o-Y Growth Rate Comparison by Product Type (2016-2032)
- Figure 176: Middle East & Africa Esters Market Y-o-Y Growth Rate Comparison by Application (2016-2032)
- Figure 177: Middle East & Africa Esters Market Y-o-Y Growth Rate Comparison by End-Use Industry (2016-2032)
- Figure 178: Middle East & Africa Esters Market Share Comparison by Country (2016-2032)
- Figure 179: Middle East & Africa Esters Market Share Comparison by Source (2016-2032)
- Figure 180: Middle East & Africa Esters Market Share Comparison by Product Type (2016-2032)
- Figure 181: Middle East & Africa Esters Market Share Comparison by Application (2016-2032)
- Figure 182: Middle East & Africa Esters Market Share Comparison by End-Use Industry (2016-2032)
"
- List of Tables
- "
- Table 1: Global Esters Market Comparison by Source (2016-2032)
- Table 2: Global Esters Market Comparison by Product Type (2016-2032)
- Table 3: Global Esters Market Comparison by Application (2016-2032)
- Table 4: Global Esters Market Comparison by End-Use Industry (2016-2032)
- Table 5: Global Esters Market Revenue (US$ Mn) Comparison by Region (2016-2032)
- Table 6: Global Esters Market Revenue (US$ Mn) (2016-2032)
- Table 7: Global Esters Market Revenue (US$ Mn) Comparison by Region (2016-2032)
- Table 8: Global Esters Market Revenue (US$ Mn) Comparison by Source (2016-2032)
- Table 9: Global Esters Market Revenue (US$ Mn) Comparison by Product Type (2016-2032)
- Table 10: Global Esters Market Revenue (US$ Mn) Comparison by Application (2016-2032)
- Table 11: Global Esters Market Revenue (US$ Mn) Comparison by End-Use Industry (2016-2032)
- Table 12: Global Esters Market Y-o-Y Growth Rate Comparison by Region (2016-2032)
- Table 13: Global Esters Market Y-o-Y Growth Rate Comparison by Source (2016-2032)
- Table 14: Global Esters Market Y-o-Y Growth Rate Comparison by Product Type (2016-2032)
- Table 15: Global Esters Market Y-o-Y Growth Rate Comparison by Application (2016-2032)
- Table 16: Global Esters Market Y-o-Y Growth Rate Comparison by End-Use Industry (2016-2032)
- Table 17: Global Esters Market Share Comparison by Region (2016-2032)
- Table 18: Global Esters Market Share Comparison by Source (2016-2032)
- Table 19: Global Esters Market Share Comparison by Product Type (2016-2032)
- Table 20: Global Esters Market Share Comparison by Application (2016-2032)
- Table 21: Global Esters Market Share Comparison by End-Use Industry (2016-2032)
- Table 22: North America Esters Market Comparison by Product Type (2016-2032)
- Table 23: North America Esters Market Comparison by Application (2016-2032)
- Table 24: North America Esters Market Comparison by End-Use Industry (2016-2032)
- Table 25: North America Esters Market Revenue (US$ Mn) Comparison by Country (2016-2032)
- Table 26: North America Esters Market Revenue (US$ Mn) (2016-2032)
- Table 27: North America Esters Market Revenue (US$ Mn) Comparison by Country (2016-2032)
- Table 28: North America Esters Market Revenue (US$ Mn) Comparison by Source (2016-2032)
- Table 29: North America Esters Market Revenue (US$ Mn) Comparison by Product Type (2016-2032)
- Table 30: North America Esters Market Revenue (US$ Mn) Comparison by Application (2016-2032)
- Table 31: North America Esters Market Revenue (US$ Mn) Comparison by End-Use Industry (2016-2032)
- Table 32: North America Esters Market Y-o-Y Growth Rate Comparison by Country (2016-2032)
- Table 33: North America Esters Market Y-o-Y Growth Rate Comparison by Source (2016-2032)
- Table 34: North America Esters Market Y-o-Y Growth Rate Comparison by Product Type (2016-2032)
- Table 35: North America Esters Market Y-o-Y Growth Rate Comparison by Application (2016-2032)
- Table 36: North America Esters Market Y-o-Y Growth Rate Comparison by End-Use Industry (2016-2032)
- Table 37: North America Esters Market Share Comparison by Country (2016-2032)
- Table 38: North America Esters Market Share Comparison by Source (2016-2032)
- Table 39: North America Esters Market Share Comparison by Product Type (2016-2032)
- Table 40: North America Esters Market Share Comparison by Application (2016-2032)
- Table 41: North America Esters Market Share Comparison by End-Use Industry (2016-2032)
- Table 42: Western Europe Esters Market Comparison by Source (2016-2032)
- Table 43: Western Europe Esters Market Comparison by Product Type (2016-2032)
- Table 44: Western Europe Esters Market Comparison by Application (2016-2032)
- Table 45: Western Europe Esters Market Comparison by End-Use Industry (2016-2032)
- Table 46: Western Europe Esters Market Revenue (US$ Mn) Comparison by Country (2016-2032)
- Table 47: Western Europe Esters Market Revenue (US$ Mn) (2016-2032)
- Table 48: Western Europe Esters Market Revenue (US$ Mn) Comparison by Country (2016-2032)
- Table 49: Western Europe Esters Market Revenue (US$ Mn) Comparison by Source (2016-2032)
- Table 50: Western Europe Esters Market Revenue (US$ Mn) Comparison by Product Type (2016-2032)
- Table 51: Western Europe Esters Market Revenue (US$ Mn) Comparison by Application (2016-2032)
- Table 52: Western Europe Esters Market Revenue (US$ Mn) Comparison by End-Use Industry (2016-2032)
- Table 53: Western Europe Esters Market Y-o-Y Growth Rate Comparison by Country (2016-2032)
- Table 54: Western Europe Esters Market Y-o-Y Growth Rate Comparison by Source (2016-2032)
- Table 55: Western Europe Esters Market Y-o-Y Growth Rate Comparison by Product Type (2016-2032)
- Table 56: Western Europe Esters Market Y-o-Y Growth Rate Comparison by Application (2016-2032)
- Table 57: Western Europe Esters Market Y-o-Y Growth Rate Comparison by End-Use Industry (2016-2032)
- Table 58: Western Europe Esters Market Share Comparison by Country (2016-2032)
- Table 59: Western Europe Esters Market Share Comparison by Source (2016-2032)
- Table 60: Western Europe Esters Market Share Comparison by Product Type (2016-2032)
- Table 61: Western Europe Esters Market Share Comparison by Application (2016-2032)
- Table 62: Western Europe Esters Market Share Comparison by End-Use Industry (2016-2032)
- Table 63: Eastern Europe Esters Market Comparison by Source (2016-2032)
- Table 64: Eastern Europe Esters Market Comparison by Product Type (2016-2032)
- Table 65: Eastern Europe Esters Market Comparison by Application (2016-2032)
- Table 66: Eastern Europe Esters Market Comparison by End-Use Industry (2016-2032)
- Table 67: Eastern Europe Esters Market Revenue (US$ Mn) Comparison by Country (2016-2032)
- Table 68: Eastern Europe Esters Market Revenue (US$ Mn) (2016-2032)
- Table 69: Eastern Europe Esters Market Revenue (US$ Mn) Comparison by Country (2016-2032)
- Table 70: Eastern Europe Esters Market Revenue (US$ Mn) Comparison by Source (2016-2032)
- Table 71: Eastern Europe Esters Market Revenue (US$ Mn) Comparison by Product Type (2016-2032)
- Table 72: Eastern Europe Esters Market Revenue (US$ Mn) Comparison by Application (2016-2032)
- Table 73: Eastern Europe Esters Market Revenue (US$ Mn) Comparison by End-Use Industry (2016-2032)
- Table 74: Eastern Europe Esters Market Y-o-Y Growth Rate Comparison by Country (2016-2032)
- Table 75: Eastern Europe Esters Market Y-o-Y Growth Rate Comparison by Source (2016-2032)
- Table 76: Eastern Europe Esters Market Y-o-Y Growth Rate Comparison by Product Type (2016-2032)
- Table 77: Eastern Europe Esters Market Y-o-Y Growth Rate Comparison by Application (2016-2032)
- Table 78: Eastern Europe Esters Market Y-o-Y Growth Rate Comparison by End-Use Industry (2016-2032)
- Table 79: Eastern Europe Esters Market Share Comparison by Country (2016-2032)
- Table 80: Eastern Europe Esters Market Share Comparison by Source (2016-2032)
- Table 81: Eastern Europe Esters Market Share Comparison by Product Type (2016-2032)
- Table 82: Eastern Europe Esters Market Share Comparison by Application (2016-2032)
- Table 83: Eastern Europe Esters Market Share Comparison by End-Use Industry (2016-2032)
- Table 84: APAC Esters Market Comparison by Source (2016-2032)
- Table 85: APAC Esters Market Comparison by Product Type (2016-2032)
- Table 86: APAC Esters Market Comparison by Application (2016-2032)
- Table 87: APAC Esters Market Comparison by End-Use Industry (2016-2032)
- Table 88: APAC Esters Market Revenue (US$ Mn) Comparison by Country (2016-2032)
- Table 89: APAC Esters Market Revenue (US$ Mn) (2016-2032)
- Table 90: APAC Esters Market Revenue (US$ Mn) Comparison by Country (2016-2032)
- Table 91: APAC Esters Market Revenue (US$ Mn) Comparison by Source (2016-2032)
- Table 92: APAC Esters Market Revenue (US$ Mn) Comparison by Product Type (2016-2032)
- Table 93: APAC Esters Market Revenue (US$ Mn) Comparison by Application (2016-2032)
- Table 94: APAC Esters Market Revenue (US$ Mn) Comparison by End-Use Industry (2016-2032)
- Table 95: APAC Esters Market Y-o-Y Growth Rate Comparison by Country (2016-2032)
- Table 96: APAC Esters Market Y-o-Y Growth Rate Comparison by Source (2016-2032)
- Table 97: APAC Esters Market Y-o-Y Growth Rate Comparison by Product Type (2016-2032)
- Table 98: APAC Esters Market Y-o-Y Growth Rate Comparison by Application (2016-2032)
- Table 99: APAC Esters Market Y-o-Y Growth Rate Comparison by End-Use Industry (2016-2032)
- Table 100: APAC Esters Market Share Comparison by Country (2016-2032)
- Table 101: APAC Esters Market Share Comparison by Source (2016-2032)
- Table 102: APAC Esters Market Share Comparison by Product Type (2016-2032)
- Table 103: APAC Esters Market Share Comparison by Application (2016-2032)
- Table 104: APAC Esters Market Share Comparison by End-Use Industry (2016-2032)
- Table 105: Latin America Esters Market Comparison by Source (2016-2032)
- Table 106: Latin America Esters Market Comparison by Product Type (2016-2032)
- Table 107: Latin America Esters Market Comparison by Application (2016-2032)
- Table 108: Latin America Esters Market Comparison by End-Use Industry (2016-2032)
- Table 109: Latin America Esters Market Revenue (US$ Mn) Comparison by Country (2016-2032)
- Table 110: Latin America Esters Market Revenue (US$ Mn) (2016-2032)
- Table 111: Latin America Esters Market Revenue (US$ Mn) Comparison by Country (2016-2032)
- Table 112: Latin America Esters Market Revenue (US$ Mn) Comparison by Source (2016-2032)
- Table 113: Latin America Esters Market Revenue (US$ Mn) Comparison by Product Type (2016-2032)
- Table 114: Latin America Esters Market Revenue (US$ Mn) Comparison by Application (2016-2032)
- Table 115: Latin America Esters Market Revenue (US$ Mn) Comparison by End-Use Industry (2016-2032)
- Table 116: Latin America Esters Market Y-o-Y Growth Rate Comparison by Country (2016-2032)
- Table 117: Latin America Esters Market Y-o-Y Growth Rate Comparison by Source (2016-2032)
- Table 118: Latin America Esters Market Y-o-Y Growth Rate Comparison by Product Type (2016-2032)
- Table 119: Latin America Esters Market Y-o-Y Growth Rate Comparison by Application (2016-2032)
- Table 120: Latin America Esters Market Y-o-Y Growth Rate Comparison by End-Use Industry (2016-2032)
- Table 121: Latin America Esters Market Share Comparison by Country (2016-2032)
- Table 122: Latin America Esters Market Share Comparison by Source (2016-2032)
- Table 123: Latin America Esters Market Share Comparison by Product Type (2016-2032)
- Table 124: Latin America Esters Market Share Comparison by Application (2016-2032)
- Table 125: Latin America Esters Market Share Comparison by End-Use Industry (2016-2032)
- Table 126: Middle East & Africa Esters Market Comparison by Source (2016-2032)
- Table 127: Middle East & Africa Esters Market Comparison by Product Type (2016-2032)
- Table 128: Middle East & Africa Esters Market Comparison by Application (2016-2032)
- Table 129: Middle East & Africa Esters Market Comparison by End-Use Industry (2016-2032)
- Table 130: Middle East & Africa Esters Market Revenue (US$ Mn) Comparison by Country (2016-2032)
- Table 131: Middle East & Africa Esters Market Revenue (US$ Mn) (2016-2032)
- Table 132: Middle East & Africa Esters Market Revenue (US$ Mn) Comparison by Country (2016-2032)
- Table 133: Middle East & Africa Esters Market Revenue (US$ Mn) Comparison by Source (2016-2032)
- Table 134: Middle East & Africa Esters Market Revenue (US$ Mn) Comparison by Product Type (2016-2032)
- Table 135: Middle East & Africa Esters Market Revenue (US$ Mn) Comparison by Application (2016-2032)
- Table 136: Middle East & Africa Esters Market Revenue (US$ Mn) Comparison by End-Use Industry (2016-2032)
- Table 137: Middle East & Africa Esters Market Y-o-Y Growth Rate Comparison by Country (2016-2032)
- Table 138: Middle East & Africa Esters Market Y-o-Y Growth Rate Comparison by Source (2016-2032)
- Table 139: Middle East & Africa Esters Market Y-o-Y Growth Rate Comparison by Product Type (2016-2032)
- Table 140: Middle East & Africa Esters Market Y-o-Y Growth Rate Comparison by Application (2016-2032)
- Table 141: Middle East & Africa Esters Market Y-o-Y Growth Rate Comparison by End-Use Industry (2016-2032)
- Table 142: Middle East & Africa Esters Market Share Comparison by Country (2016-2032)
- Table 143: Middle East & Africa Esters Market Share Comparison by Source (2016-2032)
- Table 144: Middle East & Africa Esters Market Share Comparison by Product Type (2016-2032)
- Table 145: Middle East & Africa Esters Market Share Comparison by Application (2016-2032)
- Table 146: Middle East & Africa Esters Market Share Comparison by End-Use Industry (2016-2032)
- 1. Executive Summary
-
- DuPont (U.S.)
- Solvay (Belgium)
- Huntsman International LLC (U.S.)
- DAIKIN (Japan)
- Dow (U.S.)
- Ashland (U.S.)
- DAK Americas (U.S.)
- Esterchem Ltd. (U.K)
- Sumitomo Chemical Co., Ltd. (Japan)
- ABITEC (U.S.)
- ADM (U.S.)
- BASF SE (Germany)
- IFFCO (Turkey)
- AkzoNobel N.V. (Netherlands)
- Biotage (Sweden)
- Stepan Company (U.S.)
- DSM (Netherlands)
- CEM Corporation (U.S.)
- Fine Organics (India)
- Subhash Chemicals (India)
- Gattefosse (France)
- Croda International (U.K.)
Our Clients


View Our Licence Options
