
Epidermolysis Bullosa Therapeutics Market Report By Product Type (Antibiotic, Analgesics, Others), By Therapeutic Approach (Wound Care Management, Symptomatic Treatment, Protein Replacement Therapy, Cell-Based Therapies, Immunomodulatory Therapies, Novel Therapeutic Approaches), By Age Group, By Treatment Setting, By Region and Companies - Industry Segment Outlook, Market Assessment, Competition Scenario, Trends and Forecast 2024-2033
-
45197
-
April 2024
-
285
-


-
This report was compiled by Trishita Deb Trishita Deb is an experienced market research and consulting professional with over 7 years of expertise across healthcare, consumer goods, and materials, contributing to over 400 healthcare-related reports. Correspondence Team Lead- Healthcare Linkedin | Detailed Market research Methodology Our methodology involves a mix of primary research, including interviews with leading mental health experts, and secondary research from reputable medical journals and databases. View Detailed Methodology Page
-
Quick Navigation
Report Overview
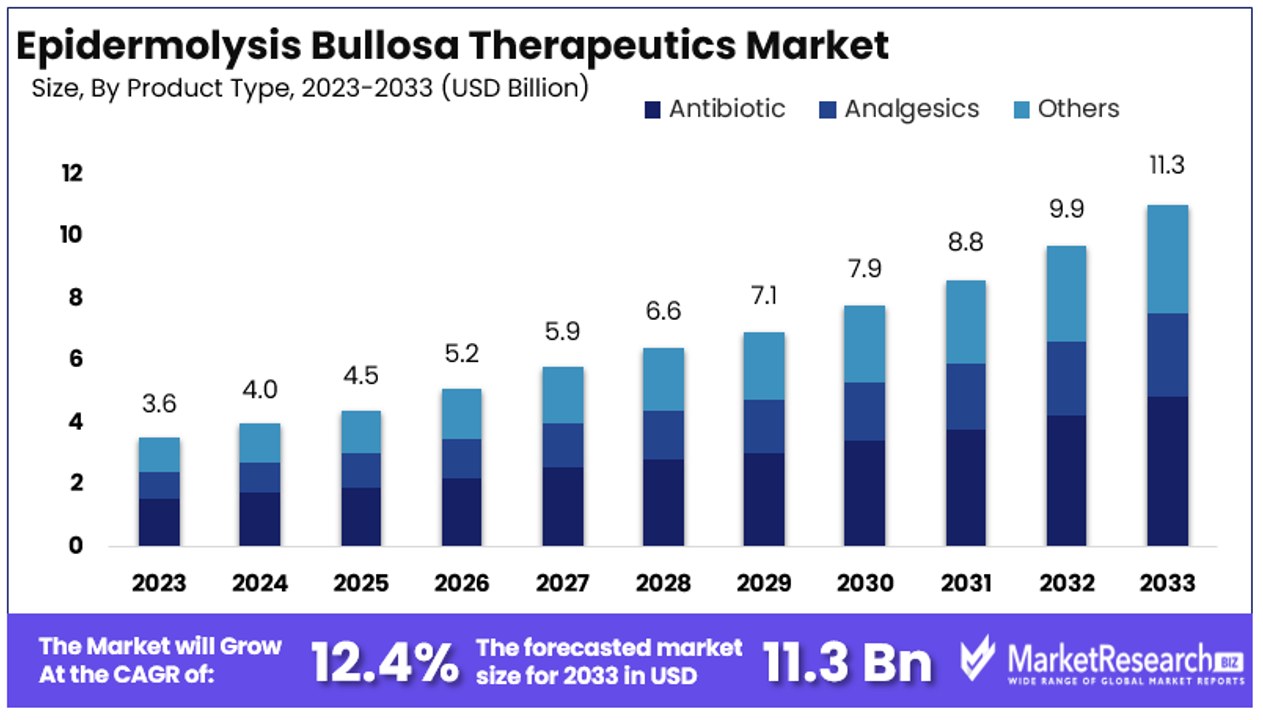
The Global Epidermolysis Bullosa Therapeutics Market size is expected to be worth around USD 11.3 Billion by 2033, from USD 3.6 Billion in 2023, growing at a CAGR of 12.40% during the forecast period from 2024 to 2033.
The Epidermolysis Bullosa Therapeutics Market encompasses a range of treatments aimed at managing and alleviating the symptoms of Epidermolysis Bullosa (EB), a rare genetic skin disorder. This market focuses on the development and distribution of innovative therapies, including gene therapy, protein replacement therapy, and advanced wound care products.
As researchers make progress in understanding the genetic basis of EB, the market is poised for significant growth, driven by increased investment in R&D and a growing pipeline of promising therapeutic candidates. Industry leaders in pharmaceuticals and biotechnology are actively exploring new solutions to improve the quality of life for patients afflicted with this challenging condition.
The Epidermolysis Bullosa (EB) Therapeutics Market is witnessing transformative growth, underpinned by the urgent need for effective treatments for this rare genetic disorder. According to the National Epidermolysis Bullosa Registry, EB occurs in approximately 20 newborns per 1 million live births in the United States, with an estimated 25,000 to 50,000 individuals currently living with the condition nationwide. This prevalence underscores a significant, though niche, market opportunity for pharmaceutical companies specializing in dermatological and rare disease treatments.
Innovation is at the forefront of this market, with advancements in gene and protein therapies presenting promising avenues for groundbreaking treatments. The development pipeline is robust, featuring a mix of emerging biotech firms and established pharmaceutical giants, all vying to address the substantial unmet medical needs associated with EB.
Investment in research and development is critical, as the complexity of EB necessitates a deep understanding of its genetic underpinnings to develop effective therapies. The market is also influenced by regulatory incentives such as orphan drug designations, which provide benefits including market exclusivity periods, tax credits, and waivers for certain regulatory fees, further encouraging investment into research.
The financial outlook for the EB therapeutics market is optimistic, driven by the growing awareness of the disease and the increasing advocacy for patient support. As treatments progress and reach the market, the potential for significant revenue generation is substantial, particularly in regions with advanced healthcare systems capable of supporting high treatment costs.
Key Takeaways
- Market Value: The Global Epidermolysis Bullosa (EB) Therapeutics Market is expected to reach USD 11.3 billion by 2033, showing significant growth from USD 3.6 billion in 2023, with a CAGR of 12.40% during the forecast period from 2024 to 2033.
- Product Type Analysis: Antibiotics dominate the segment with a 43% market share, emphasizing their critical role in preventing infections in EB patients.
- Therapeutic Approach Analysis: Wound care management is the dominant therapeutic approach, reflecting its foundational role in EB treatment strategies.
- Age Group Analysis: Pediatric patients dominate the market due to early diagnosis and the critical need for ongoing management.
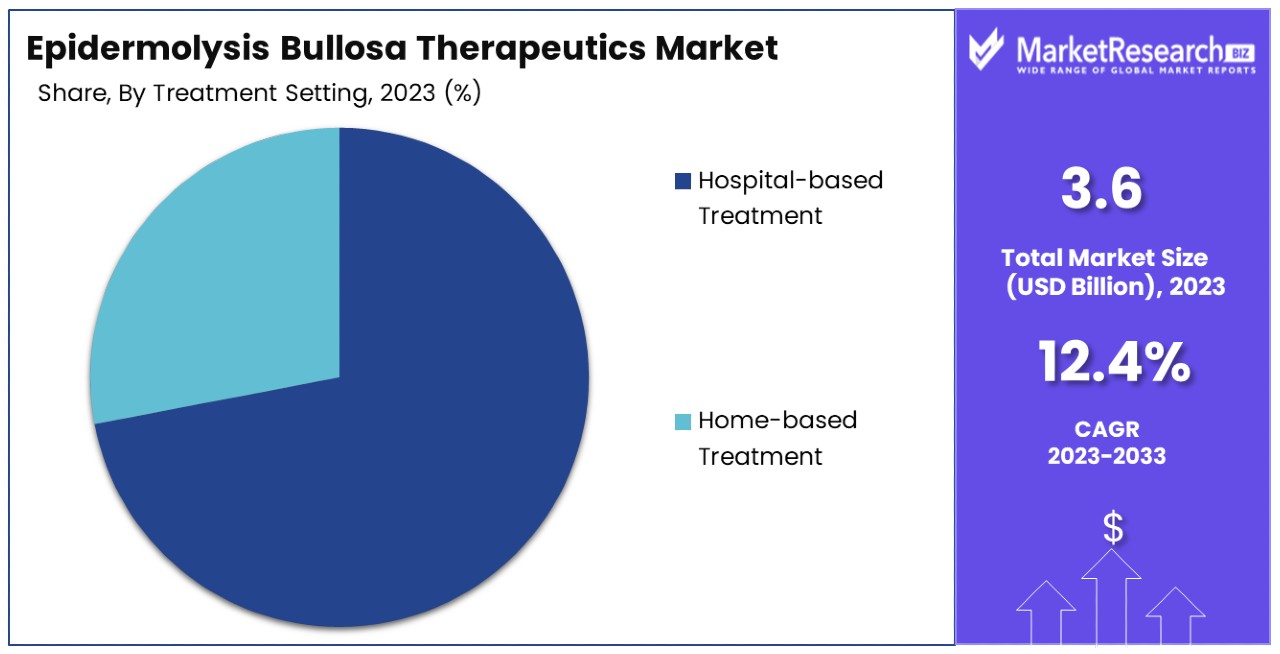
- Treatment Setting Analysis: Hospital-based treatment is the primary choice, capturing 72% of the market, driven by the need for specialized care and advanced treatment options.
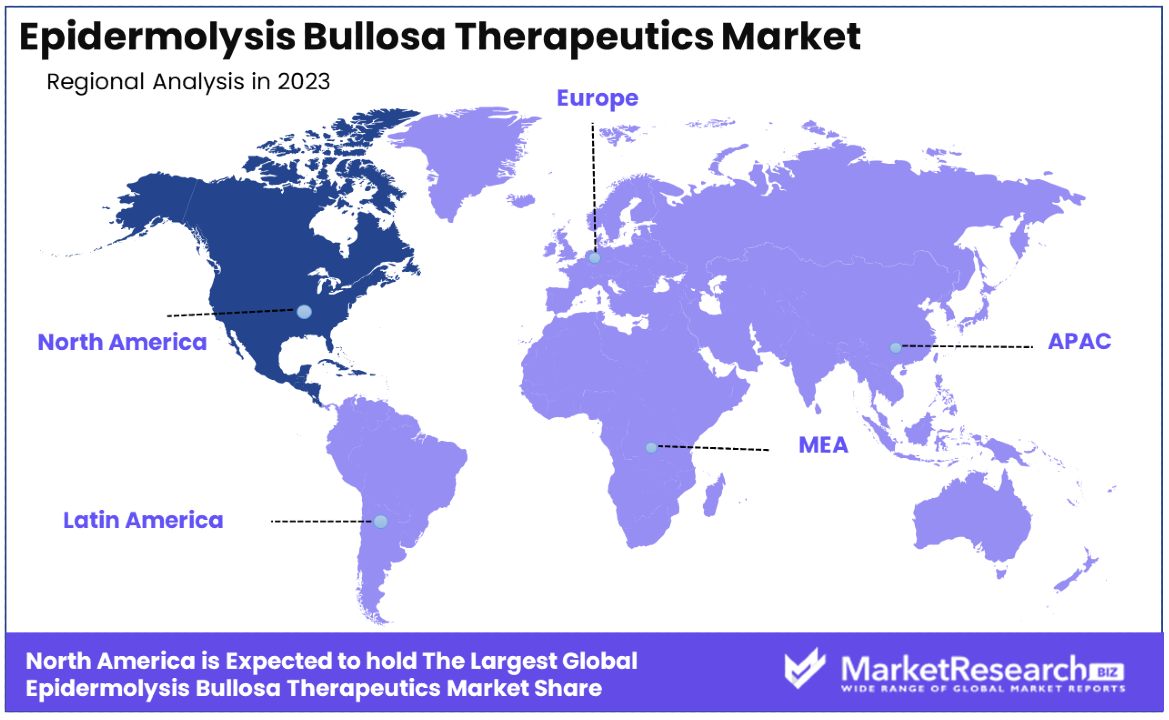
- North America: Dominates the market with a 35% share, supported by strong healthcare systems and active government support for rare disease research.
- Europe: Holds approximately 30% of the market share, driven by factors similar to North America, including robust healthcare systems and government support for rare disease research.
- Analyst Viewpoint: The market is characterized by a growing understanding of EB and advancements in treatment options, leading to significant market growth. The emphasis on pediatric patients and hospital-based treatment reflects the severity and complexity of EB, necessitating comprehensive care approaches in specialized settings.
- Growth Opportunities: Opportunities exist for continued research and development of novel therapies targeting the underlying causes of EB, potentially revolutionizing treatment options. Improved accessibility to specialized care and treatment options, particularly in regions with emerging healthcare infrastructure, can further drive market growth.
Driving Factors
Increasing Prevalence of Epidermolysis Bullosa Drives Market Growth
The growing prevalence of Epidermolysis Bullosa (EB) significantly propels the EB Therapeutics Market. EB, a rare genetic condition, results in extremely fragile skin that blisters and tears from minor friction or trauma. As global awareness of this condition improves and diagnostic capabilities enhance, more cases are identified, amplifying the demand for effective treatments.
The National Epidermolysis Bullosa Registry reports that EB occurs in about 20 newborns per 1 million live births in the United States alone, with an estimated 25,000 to 50,000 Americans living with the condition. This increase in diagnosed cases escalates the urgency for advanced therapeutic solutions, driving pharmaceutical companies to intensify research and development efforts to meet this rising demand.
Orphan Drug Designation and Incentives Drive Market Growth
The designation of EB therapies as orphan drugs catalyzes significant growth within the market. Orphan drug status is granted to medications intended for the treatment of rare diseases, offering benefits like tax credits, market exclusivity, and regulatory assistance. These incentives make investment in the research and development of EB treatments more appealing to pharmaceutical companies.
For instance, Amryt Pharma's Oleogel-S10, designed to treat EB, has received Orphan Drug Designation from both the FDA and EMA. Such incentives not only support the development of new therapies but also ensure a protected market position for successful treatments, thereby enhancing profitability and encouraging continuous innovation in this sector.
Advancements in Gene Therapy and Stem Cell Research Drive Market Growth
The exploration of gene therapy and stem cell research marks a frontier in EB treatment, potentially revolutionizing patient outcomes. These advanced therapeutic strategies are aimed at correcting the fundamental genetic anomalies causing EB, offering the possibility of durable, if not curative, treatments.
For example, Krystal Biotech's gene therapy product, KB407, is currently in clinical trials for the treatment of Dystrophic EB. By directly targeting the genetic root of the disease, these therapies not only promise to improve quality of life but also reduce long-term healthcare costs associated with managing chronic symptoms. The promising results from early clinical trials fuel optimism and investment, driving market growth through potential breakthroughs in treatment efficacy and patient care.
Restraining Factors
Challenges in Clinical Trials and Patient Recruitment Restrains Market Growth
Conducting effective clinical trials for Epidermolysis Bullosa (EB) poses significant barriers to market expansion. The rarity of EB results in a small, geographically dispersed patient base, complicating the recruitment process for clinical studies. This scarcity of participants can lead to extended timelines and increased costs in the development and regulatory approval of new therapies.
For example, Abeona Therapeutics encountered significant delays in their Phase 3 trial of EB-101 for Recessive Dystrophic EB due to difficulties in patient recruitment. These challenges not only delay the introduction of innovative treatments but also deter investment in research efforts, as the high costs and prolonged timelines diminish the appeal of developing treatments for such a limited market.
Lack of Awareness and Understanding Restrains Market Growth
The Epidermolysis Bullosa (EB) Therapeutics Market faces growth limitations due to insufficient awareness and understanding of the disease. This deficiency impacts not only the general public but also healthcare professionals, leading to frequent misdiagnoses and delays in treatment.
A study in the British Journal of Dermatology underscores that many medical professionals are not adequately informed about EB, which hinders proper diagnosis and timely therapeutic intervention. The resulting delay in treatment commencement restricts patient access to available therapies, directly impeding market expansion. To combat this, enhanced educational initiatives targeted at both the public and healthcare providers are crucial for increasing recognition of EB and improving patient outcomes.
Product Type Analysis
Antibiotic dominates with 43% due to its critical role in preventing infections in EB patients.
In the Epidermolysis Bullosa (EB) Therapeutics Market, antibiotics emerge as the dominant product type, accounting for 43% of the segment. This predominance is driven by the crucial role antibiotics play in managing infections, a common and serious complication in EB patients due to their fragile skin. The effective prevention and treatment of infections are paramount in improving survival rates and quality of life, making antibiotics essential in the therapeutic arsenal against EB.
The other sub-segments, analgesics and various supportive care products (grouped under "others"), although vital, do not command as large a market share as antibiotics. Analgesics are primarily used to manage pain associated with skin lesions and have a steady demand within the EB community. However, their impact on the core issue of skin integrity is less direct compared to antibiotics. The "others" category includes a broad range of products from bandages and dressings to moisturizers, all critical for daily management but secondary to the infection control provided by antibiotics.
The combined importance of these segments creates a comprehensive care approach for EB, but the antibiotic segment's critical role in addressing the immediate threat of infections and complications clearly leads the market.
Therapeutic Approach Analysis
Wound Care Management dominates due to its foundational role in EB treatment strategies.
Wound care management is the principal therapeutic approach in the EB Therapeutics Market, driven by the constant necessity to address the chronic, non-healing wounds typical of the disease. This approach is foundational, as proper wound care is essential for preventing infections and further complications, which can significantly affect patient outcomes. The focus on wound care management includes the use of advanced dressings, pain management solutions, and sometimes surgical interventions to manage severe cases.
Other therapeutic approaches such as symptomatic treatment, protein replacement therapy, cell-based therapies, immunomodulatory therapies, and novel therapeutic approaches each play critical roles in the overall management of EB but do not overshadow the essential nature of wound care. Symptomatic treatment supports wound care by alleviating pain and discomfort, thereby improving patient quality of life. Protein replacement and cell-based therapies are emerging as transformative approaches that target the underlying causes of EB, aiming to restore protein function or correct genetic defects.
Immunomodulatory therapies and other novel approaches are still in developmental stages but hold potential to revolutionize the treatment landscape by modifying the disease's clinical course. These innovative treatments, although currently less prominent, are expected to gain traction as research progresses, potentially reshaping future market dynamics.
The dominance of wound care management is thus a reflection of its immediate impact on patient care, but the integration and development of other therapies highlight a dynamic and evolving market landscape geared towards comprehensive and multifaceted EB treatment strategies.
Age Group Analysis
Pediatric Patients dominate due to early diagnosis and the critical need for ongoing management.
In the Epidermolysis Bullosa (EB) Therapeutics Market, pediatric patients constitute the primary focus of treatment efforts. This dominance is due to the fact that EB is typically diagnosed at birth or in early childhood. Children represent a crucial patient group because early intervention can significantly influence the disease's progression and patient quality of life. Managing EB from a young age involves a comprehensive approach that includes both aggressive management of skin lesions and preventative care to mitigate complications as the child grows.
Adult patients, while also receiving EB treatments, often face challenges that stem from long-term management of the disease, including chronic pain and increased risk of skin cancer. Treatments for adults often focus on managing these more complex, long-term complications and improving quality of life. However, the focus on pediatric patients is more intense due to the potential for early interventions to have a profound impact on the disease's long-term management.
The emphasis on pediatric patients is driven by the necessity of addressing the immediate and long-term implications of the disease from an early age, making this segment the largest and most critical in the EB therapeutics market.
Treatment Setting Analysis
Hospital-based Treatment dominates with 72% due to the need for specialized care and advanced treatment options.
Hospital-based treatment settings dominate the Epidermolysis Bullosa (EB) Therapeutics Market, accounting for 72% of the treatment administration. This predominance is largely due to the complex nature of EB, which often requires specialized care that can only be provided in a hospital setting. Hospitals are better equipped with the necessary facilities for advanced wound care, access to a wide range of specialists such as dermatologists, pediatricians, and nutritionists, and the ability to handle complications such as severe infections and surgery.
Home-based treatment, while crucial for the long-term management of EB, typically supports ongoing care after initial and acute treatments have been administered in a hospital. Home care includes daily wound dressing, pain management, and the use of protective bandaging to prevent blister formation and infections. However, the more intensive and complex therapies often cannot be adequately administered at home, necessitating hospital visits.
The substantial lead of hospital-based treatments underscores the severity and complexity of EB, which often makes outpatient treatment or home care insufficient without the foundational interventions that hospitals provide. As advancements in treatment are developed, there may be an increase in the feasibility and effectiveness of home-based treatments, but currently, hospital care remains the cornerstone of EB therapy due to its comprehensive and multidisciplinary approach to managing this challenging condition.
Key Market Segments
By Product Type
- Antibiotic
- Analgesics
- Others
By Therapeutic Approach
- Wound Care Management
- Symptomatic Treatment
- Protein Replacement Therapy
- Cell-Based Therapies
- Immunomodulatory Therapies
- Novel Therapeutic Approaches
By Age Group
- Pediatric Patients
- Adult Patients
By Treatment Setting
- Hospital-based Treatment
- Home-based Treatment
Growth Opportunities
Development of Targeted Therapies Offers Growth Opportunity
The progression in understanding the genetic and molecular aspects of Epidermolysis Bullosa (EB) heralds significant opportunities for the development of targeted therapies. These innovative treatments are designed to directly tackle the genetic roots of EB, offering personalized and more effective management of the disease.
For instance, pioneering work at Stanford University involving CRISPR technology aims to correct the specific genetic mutations in EB, potentially leading to substantial improvements in treatment outcomes. This approach not only promises to enhance the efficacy of therapies but also aligns with the trend towards personalized medicine, increasing the therapeutic options available to patients and potentially reducing side effects by targeting the disease's cause rather than its symptoms.
Combination Therapies and Supportive Care Offers Growth Opportunity
There is a substantial growth opportunity in developing combination therapies and enhancing supportive care for EB patients. These treatments aim to improve patients' overall health and quality of life by addressing multiple aspects of the disease simultaneously. For example, Skylite Bio's specialized wound care products cater specifically to the unique needs of EB patients, filling a critical gap in the market.
Such products, along with pain management solutions and nutritional supplements, form a comprehensive care regimen that supports the primary treatments. The development of these complementary therapies is crucial as they work in synergy with targeted treatments to provide holistic care, thereby broadening the market's scope and enhancing patient outcomes. This integrated approach is increasingly recognized as essential in the treatment of complex diseases like EB, where multiple symptoms and complications need concurrent management.
Trending Factors
Increasing Focus on Rare Diseases Are Trending Factors
The pharmaceutical industry's increasing focus on rare diseases, such as Epidermolysis Bullosa (EB), has become a significant trending factor. This shift is motivated by several key incentives: orphan drug designations provide regulatory and financial advantages, the high potential for return on investment due to less competition, and the pressing need to address the unmet medical needs of these smaller patient populations.
Companies like Krystal Biotech, Abeona Therapeutics, and Amryt Pharma are notably investing in EB, developing specialized therapies that cater specifically to its complexities. This trend not only helps fill a critical gap in healthcare but also fosters innovation and development within the sector, offering hope and potentially life-altering treatments to patients who previously had limited options.
Advancements in Gene Therapy and Precision Medicine Are Trending Factors
The rapid advancements in gene therapy and precision medicine are pivotal trending factors in the EB Therapeutics Market. As understanding of the genetic foundations of EB deepens, targeted therapies that precisely address the unique genetic variations causing the disease are being developed. Abeona Therapeutics' EB-101, a gene-corrected cell therapy for Recessive Dystrophic EB, exemplifies how precise treatments can drastically improve patient outcomes by targeting the disease at its genetic root.
This trend towards highly targeted, mutation-specific therapies aligns with the broader movement in medicine towards customization and precision, ensuring treatments are not only more effective but also come with fewer side effects. The growing efficacy and decreasing costs of gene therapy techniques further fuel this trend, making it a dominant force shaping the future of EB therapeutics.
Regional Analysis
North America Dominates with 35% Market Share
North America's commanding 35% share in the Epidermolysis Bullosa Therapeutics Market is primarily driven by robust healthcare infrastructure, significant investment in research and development, and active patient advocacy groups. The region benefits from a concentrated focus on rare diseases, supported by comprehensive regulatory frameworks such as the Orphan Drug Act, which provides incentives for developing treatments. Additionally, the presence of leading biotech and pharmaceutical companies that are pioneers in novel therapeutic developments contributes to this dominance.
The dynamics of North America’s market are shaped by its advanced healthcare systems and high awareness levels about rare diseases among both healthcare providers and the public. The region's wealth and its healthcare spending per capita far exceed those of many other regions, allowing for greater investment in specialized treatments and research facilities. This environment fosters innovation and accelerates the approval and adoption of new therapies.
North America is expected to maintain or even increase its market share due to ongoing advancements in medical technology and strong pipeline developments in gene and cell therapies. The increasing healthcare expenditure and a growing focus on personalized medicine are likely to further enhance its leading position in the global market.
Other Regions:
- Europe: Holds approximately 30% of the market share, driven by similar factors as North America, including strong healthcare systems and active government support for research on rare diseases.
- Asia Pacific: With about 20% market share, this region is rapidly growing due to improving healthcare infrastructures, increased healthcare spending, and rising awareness of genetic disorders.
- Middle East & Africa: This region accounts for around 10% of the market. Growth is slower due to less developed healthcare systems and lower awareness about rare diseases, though improvements are gradually occurring.
- Latin America: Possesses about 5% of the market share, faced with challenges such as inconsistent access to treatment and economic variability affecting healthcare investment, though efforts to improve healthcare access are in progress.
Key Regions and Countries
- North America
- The US
- Canada
- Mexico
- Western Europe
- Germany
- France
- The UK
- Spain
- Italy
- Portugal
- Ireland
- Austria
- Switzerland
- Benelux
- Nordic
- Rest of Western Europe
- Eastern Europe
- Russia
- Poland
- The Czech Republic
- Greece
- Rest of Eastern Europe
- APAC
- China
- Japan
- South Korea
- India
- Australia & New Zealand
- Indonesia
- Malaysia
- Philippines
- Singapore
- Thailand
- Vietnam
- Rest of APAC
- Latin America
- Brazil
- Colombia
- Chile
- Argentina
- Costa Rica
- Rest of Latin America
- Middle East & Africa
- Algeria
- Egypt
- Israel
- Kuwait
- Nigeria
- Saudi Arabia
- South Africa
- Turkey
- United Arab Emirates
- Rest of MEA
Key Players Analysis
In the Epidermolysis Bullosa Therapeutics Market, several companies stand out due to their strategic roles and contributions. Castle Creek Biosciences and Amryt Pharma plc are at the forefront, with significant impact through their advanced therapeutic solutions and strong market presence. Castle Creek Biosciences is noted for repeated mentions, emphasizing its dominance and active engagement in developing treatments that address the root causes of the disease.
ProQR Therapeutics and Abeona Therapeutics Inc. also play crucial roles, focusing on innovative genetic and RNA-based therapies that promise to revolutionize treatment paradigms. Their strategic positioning highlights a commitment to cutting-edge research and development.
Beremagene Geperpavec and dabocemagene autoficel represent breakthroughs in gene therapy, with potential to provide long-term solutions for patients. Their development underlines the market's shift towards highly specialized therapeutic approaches.
InMed Pharmaceuticals, Inc. diversifies the market approach by integrating cannabinoid science into its treatment strategies, offering novel therapeutic avenues and broadening the scope of potential interventions.
Collectively, these companies drive the Epidermolysis Bullosa therapeutics market towards more effective and personalized medical solutions, highlighting an era of innovation and improved patient outcomes.
Market Key Players
- Castle Creek Biosciences
- Amryt Pharma plc
- ProQR Therapeutics
- Abeona Therapeutics Inc.
- Beremagene Geperpavec
- InMed Pharmaceuticals, Inc.
- Castle Creek Biosciences, Inc.
Recent Developments
- On Dec 2023, the FDA approved a Chiesi Group drug developed to promote faster wound healing in EB patients, marketed as Filsuvez, for the treatment of patients age six months and older.
- On Dec 2023, The Food and Drug Administration (FDA) approved Filsuvez ® (birch triterpenes) topical gel for the treatment of partial thickness wounds in patients 6 months of age and older with junctional epidermolysis bullosa (JEB) and dystrophic epidermolysis bullosa (DEB).
- On May 2023, Krystal Biotech received FDA approval for the first-ever redosable gene therapy, VYJUVEK™ (beremagene geperpavec-svdt), for the treatment of Dystrophic Epidermolysis Bullosa.
Report Scope
Report Features Description Market Value (2023) USD 3.6 Billion Forecast Revenue (2033) USD 11.3 Billion CAGR (2024-2033) 12.40% Base Year for Estimation 2023 Historic Period 2018-2023 Forecast Period 2024-2033 Report Coverage Revenue Forecast, Market Dynamics, Competitive Landscape, Recent Developments Segments Covered By Product Type (Antibiotic, Analgesics, Others), By Therapeutic Approach (Wound Care Management, Symptomatic Treatment, Protein Replacement Therapy, Cell-Based Therapies, Immunomodulatory Therapies, Novel Therapeutic Approaches), By Age Group (Pediatric Patients, Adult Patients), By Treatment Setting (Hospital-based Treatment, Home-based Treatment) Regional Analysis North America - The US, Canada, & Mexico; Western Europe - Germany, France, The UK, Spain, Italy, Portugal, Ireland, Austria, Switzerland, Benelux, Nordic, & Rest of Western Europe; Eastern Europe - Russia, Poland, The Czech Republic, Greece, & Rest of Eastern Europe; APAC - China, Japan, South Korea, India, Australia & New Zealand, Indonesia, Malaysia, Philippines, Singapore, Thailand, Vietnam, & Rest of APAC; Latin America - Brazil, Colombia, Chile, Argentina, Costa Rica, & Rest of Latin America; Middle East & Africa - Algeria, Egypt, Israel, Kuwait, Nigeria, Saudi Arabia, South Africa, Turkey, United Arab Emirates, & Rest of MEA Competitive Landscape Castle Creek Biosciences, Amryt Pharma plc, ProQR Therapeutics, Abeona Therapeutics Inc., Beremagene Geperpavec, InMed Pharmaceuticals, Inc., dabocemagene autoficel, Castle Creek Biosciences, Inc. Customization Scope Customization for segments, region/country-level will be provided. Moreover, additional customization can be done based on the requirements. Purchase Options We have three licenses to opt for: Single User License, Multi-User License (Up to 5 Users), Corporate Use License (Unlimited User and Printable PDF) -
- 1. Executive Summary
- 1.1. Definition
- 1.2. Taxonomy
- 1.3. Research Scope
- 1.4. Key Analysis
- 1.5. Key Findings by Major Segments
- 1.6. Top strategies by Major Players
- 2. Global Epidermolysis Bullosa Therapeutics Market Overview
- 2.1. Epidermolysis Bullosa Therapeutics Market Dynamics
- 2.1.1. Drivers
- 2.1.2. Opportunities
- 2.1.3. Restraints
- 2.1.4. Challenges
- 2.2. Macro-economic Factors
- 2.3. Regulatory Framework
- 2.4. Market Investment Feasibility Index
- 2.5. PEST Analysis
- 2.6. PORTER’S Five Force Analysis
- 2.7. Drivers & Restraints Impact Analysis
- 2.8. Industry Chain Analysis
- 2.9. Cost Structure Analysis
- 2.10. Marketing Strategy
- 2.11. Russia-Ukraine War Impact Analysis
- 2.12. Opportunity Map Analysis
- 2.13. Market Competition Scenario Analysis
- 2.14. Product Life Cycle Analysis
- 2.15. Opportunity Orbits
- 2.16. Manufacturer Intensity Map
- 2.17. Major Companies sales by Value & Volume
- 2.1. Epidermolysis Bullosa Therapeutics Market Dynamics
- 3. Global Epidermolysis Bullosa Therapeutics Market Analysis, Opportunity and Forecast, 2016-2032
- 3.1. Global Epidermolysis Bullosa Therapeutics Market Analysis, 2016-2021
- 3.2. Global Epidermolysis Bullosa Therapeutics Market Opportunity and Forecast, 2023-2032
- 3.3. Global Epidermolysis Bullosa Therapeutics Market Analysis, Opportunity and Forecast, By Therapeutic Approach, 2016-2032
- 3.3.1. Global Epidermolysis Bullosa Therapeutics Market Analysis by Therapeutic Approach: Introduction
- 3.3.2. Market Size Absolute $ Opportunity Analysis and Forecast, By Therapeutic Approach, 2016-2032
- 3.3.3. Wound Care Management
- 3.3.4. Symptomatic Treatment
- 3.3.5. Protein Replacement Therapy
- 3.3.6. Cell-Based Therapies
- 3.3.7. Immunomodulatory Therapies
- 3.3.8. Novel Therapeutic Approaches
- 3.4. Global Epidermolysis Bullosa Therapeutics Market Analysis, Opportunity and Forecast, By Age Group, 2016-2032
- 3.4.1. Global Epidermolysis Bullosa Therapeutics Market Analysis by Age Group: Introduction
- 3.4.2. Market Size Absolute $ Opportunity Analysis and Forecast, By Age Group, 2016-2032
- 3.4.3. Pediatric Patients
- 3.4.4. Adult Patients
- 3.5. Global Epidermolysis Bullosa Therapeutics Market Analysis, Opportunity and Forecast, By Treatment Setting, 2016-2032
- 3.5.1. Global Epidermolysis Bullosa Therapeutics Market Analysis by Treatment Setting: Introduction
- 3.5.2. Market Size Absolute $ Opportunity Analysis and Forecast, By Treatment Setting, 2016-2032
- 3.5.3. Hospital-based Treatment
- 3.5.4. Home-based Treatment
- 4. North America Epidermolysis Bullosa Therapeutics Market Analysis, Opportunity and Forecast, 2016-2032
- 4.1. North America Epidermolysis Bullosa Therapeutics Market Analysis, 2016-2021
- 4.2. North America Epidermolysis Bullosa Therapeutics Market Opportunity and Forecast, 2023-2032
- 4.3. North America Epidermolysis Bullosa Therapeutics Market Analysis, Opportunity and Forecast, By Therapeutic Approach, 2016-2032
- 4.3.1. North America Epidermolysis Bullosa Therapeutics Market Analysis by Therapeutic Approach: Introduction
- 4.3.2. Market Size Absolute $ Opportunity Analysis and Forecast, By Therapeutic Approach, 2016-2032
- 4.3.3. Wound Care Management
- 4.3.4. Symptomatic Treatment
- 4.3.5. Protein Replacement Therapy
- 4.3.6. Cell-Based Therapies
- 4.3.7. Immunomodulatory Therapies
- 4.3.8. Novel Therapeutic Approaches
- 4.4. North America Epidermolysis Bullosa Therapeutics Market Analysis, Opportunity and Forecast, By Age Group, 2016-2032
- 4.4.1. North America Epidermolysis Bullosa Therapeutics Market Analysis by Age Group: Introduction
- 4.4.2. Market Size Absolute $ Opportunity Analysis and Forecast, By Age Group, 2016-2032
- 4.4.3. Pediatric Patients
- 4.4.4. Adult Patients
- 4.5. North America Epidermolysis Bullosa Therapeutics Market Analysis, Opportunity and Forecast, By Treatment Setting, 2016-2032
- 4.5.1. North America Epidermolysis Bullosa Therapeutics Market Analysis by Treatment Setting: Introduction
- 4.5.2. Market Size Absolute $ Opportunity Analysis and Forecast, By Treatment Setting, 2016-2032
- 4.5.3. Hospital-based Treatment
- 4.5.4. Home-based Treatment
- 4.6. North America Epidermolysis Bullosa Therapeutics Market Analysis, Opportunity and Forecast, By Country , 2016-2032
- 4.6.1. North America Epidermolysis Bullosa Therapeutics Market Analysis by Country : Introduction
- 4.6.2. Market Size Absolute $ Opportunity Analysis and Forecast, Country , 2016-2032
- 4.6.2.1. The US
- 4.6.2.2. Canada
- 4.6.2.3. Mexico
- 5. Western Europe Epidermolysis Bullosa Therapeutics Market Analysis, Opportunity and Forecast, 2016-2032
- 5.1. Western Europe Epidermolysis Bullosa Therapeutics Market Analysis, 2016-2021
- 5.2. Western Europe Epidermolysis Bullosa Therapeutics Market Opportunity and Forecast, 2023-2032
- 5.3. Western Europe Epidermolysis Bullosa Therapeutics Market Analysis, Opportunity and Forecast, By Therapeutic Approach, 2016-2032
- 5.3.1. Western Europe Epidermolysis Bullosa Therapeutics Market Analysis by Therapeutic Approach: Introduction
- 5.3.2. Market Size Absolute $ Opportunity Analysis and Forecast, By Therapeutic Approach, 2016-2032
- 5.3.3. Wound Care Management
- 5.3.4. Symptomatic Treatment
- 5.3.5. Protein Replacement Therapy
- 5.3.6. Cell-Based Therapies
- 5.3.7. Immunomodulatory Therapies
- 5.3.8. Novel Therapeutic Approaches
- 5.4. Western Europe Epidermolysis Bullosa Therapeutics Market Analysis, Opportunity and Forecast, By Age Group, 2016-2032
- 5.4.1. Western Europe Epidermolysis Bullosa Therapeutics Market Analysis by Age Group: Introduction
- 5.4.2. Market Size Absolute $ Opportunity Analysis and Forecast, By Age Group, 2016-2032
- 5.4.3. Pediatric Patients
- 5.4.4. Adult Patients
- 5.5. Western Europe Epidermolysis Bullosa Therapeutics Market Analysis, Opportunity and Forecast, By Treatment Setting, 2016-2032
- 5.5.1. Western Europe Epidermolysis Bullosa Therapeutics Market Analysis by Treatment Setting: Introduction
- 5.5.2. Market Size Absolute $ Opportunity Analysis and Forecast, By Treatment Setting, 2016-2032
- 5.5.3. Hospital-based Treatment
- 5.5.4. Home-based Treatment
- 5.6. Western Europe Epidermolysis Bullosa Therapeutics Market Analysis, Opportunity and Forecast, By Country , 2016-2032
- 5.6.1. Western Europe Epidermolysis Bullosa Therapeutics Market Analysis by Country : Introduction
- 5.6.2. Market Size Absolute $ Opportunity Analysis and Forecast, Country , 2016-2032
- 5.6.2.1. Germany
- 5.6.2.2. France
- 5.6.2.3. The UK
- 5.6.2.4. Spain
- 5.6.2.5. Italy
- 5.6.2.6. Portugal
- 5.6.2.7. Ireland
- 5.6.2.8. Austria
- 5.6.2.9. Switzerland
- 5.6.2.10. Benelux
- 5.6.2.11. Nordic
- 5.6.2.12. Rest of Western Europe
- 6. Eastern Europe Epidermolysis Bullosa Therapeutics Market Analysis, Opportunity and Forecast, 2016-2032
- 6.1. Eastern Europe Epidermolysis Bullosa Therapeutics Market Analysis, 2016-2021
- 6.2. Eastern Europe Epidermolysis Bullosa Therapeutics Market Opportunity and Forecast, 2023-2032
- 6.3. Eastern Europe Epidermolysis Bullosa Therapeutics Market Analysis, Opportunity and Forecast, By Therapeutic Approach, 2016-2032
- 6.3.1. Eastern Europe Epidermolysis Bullosa Therapeutics Market Analysis by Therapeutic Approach: Introduction
- 6.3.2. Market Size Absolute $ Opportunity Analysis and Forecast, By Therapeutic Approach, 2016-2032
- 6.3.3. Wound Care Management
- 6.3.4. Symptomatic Treatment
- 6.3.5. Protein Replacement Therapy
- 6.3.6. Cell-Based Therapies
- 6.3.7. Immunomodulatory Therapies
- 6.3.8. Novel Therapeutic Approaches
- 6.4. Eastern Europe Epidermolysis Bullosa Therapeutics Market Analysis, Opportunity and Forecast, By Age Group, 2016-2032
- 6.4.1. Eastern Europe Epidermolysis Bullosa Therapeutics Market Analysis by Age Group: Introduction
- 6.4.2. Market Size Absolute $ Opportunity Analysis and Forecast, By Age Group, 2016-2032
- 6.4.3. Pediatric Patients
- 6.4.4. Adult Patients
- 6.5. Eastern Europe Epidermolysis Bullosa Therapeutics Market Analysis, Opportunity and Forecast, By Treatment Setting, 2016-2032
- 6.5.1. Eastern Europe Epidermolysis Bullosa Therapeutics Market Analysis by Treatment Setting: Introduction
- 6.5.2. Market Size Absolute $ Opportunity Analysis and Forecast, By Treatment Setting, 2016-2032
- 6.5.3. Hospital-based Treatment
- 6.5.4. Home-based Treatment
- 6.6. Eastern Europe Epidermolysis Bullosa Therapeutics Market Analysis, Opportunity and Forecast, By Country , 2016-2032
- 6.6.1. Eastern Europe Epidermolysis Bullosa Therapeutics Market Analysis by Country : Introduction
- 6.6.2. Market Size Absolute $ Opportunity Analysis and Forecast, Country , 2016-2032
- 6.6.2.1. Russia
- 6.6.2.2. Poland
- 6.6.2.3. The Czech Republic
- 6.6.2.4. Greece
- 6.6.2.5. Rest of Eastern Europe
- 7. APAC Epidermolysis Bullosa Therapeutics Market Analysis, Opportunity and Forecast, 2016-2032
- 7.1. APAC Epidermolysis Bullosa Therapeutics Market Analysis, 2016-2021
- 7.2. APAC Epidermolysis Bullosa Therapeutics Market Opportunity and Forecast, 2023-2032
- 7.3. APAC Epidermolysis Bullosa Therapeutics Market Analysis, Opportunity and Forecast, By Therapeutic Approach, 2016-2032
- 7.3.1. APAC Epidermolysis Bullosa Therapeutics Market Analysis by Therapeutic Approach: Introduction
- 7.3.2. Market Size Absolute $ Opportunity Analysis and Forecast, By Therapeutic Approach, 2016-2032
- 7.3.3. Wound Care Management
- 7.3.4. Symptomatic Treatment
- 7.3.5. Protein Replacement Therapy
- 7.3.6. Cell-Based Therapies
- 7.3.7. Immunomodulatory Therapies
- 7.3.8. Novel Therapeutic Approaches
- 7.4. APAC Epidermolysis Bullosa Therapeutics Market Analysis, Opportunity and Forecast, By Age Group, 2016-2032
- 7.4.1. APAC Epidermolysis Bullosa Therapeutics Market Analysis by Age Group: Introduction
- 7.4.2. Market Size Absolute $ Opportunity Analysis and Forecast, By Age Group, 2016-2032
- 7.4.3. Pediatric Patients
- 7.4.4. Adult Patients
- 7.5. APAC Epidermolysis Bullosa Therapeutics Market Analysis, Opportunity and Forecast, By Treatment Setting, 2016-2032
- 7.5.1. APAC Epidermolysis Bullosa Therapeutics Market Analysis by Treatment Setting: Introduction
- 7.5.2. Market Size Absolute $ Opportunity Analysis and Forecast, By Treatment Setting, 2016-2032
- 7.5.3. Hospital-based Treatment
- 7.5.4. Home-based Treatment
- 7.6. APAC Epidermolysis Bullosa Therapeutics Market Analysis, Opportunity and Forecast, By Country , 2016-2032
- 7.6.1. APAC Epidermolysis Bullosa Therapeutics Market Analysis by Country : Introduction
- 7.6.2. Market Size Absolute $ Opportunity Analysis and Forecast, Country , 2016-2032
- 7.6.2.1. China
- 7.6.2.2. Japan
- 7.6.2.3. South Korea
- 7.6.2.4. India
- 7.6.2.5. Australia & New Zeland
- 7.6.2.6. Indonesia
- 7.6.2.7. Malaysia
- 7.6.2.8. Philippines
- 7.6.2.9. Singapore
- 7.6.2.10. Thailand
- 7.6.2.11. Vietnam
- 7.6.2.12. Rest of APAC
- 8. Latin America Epidermolysis Bullosa Therapeutics Market Analysis, Opportunity and Forecast, 2016-2032
- 8.1. Latin America Epidermolysis Bullosa Therapeutics Market Analysis, 2016-2021
- 8.2. Latin America Epidermolysis Bullosa Therapeutics Market Opportunity and Forecast, 2023-2032
- 8.3. Latin America Epidermolysis Bullosa Therapeutics Market Analysis, Opportunity and Forecast, By Therapeutic Approach, 2016-2032
- 8.3.1. Latin America Epidermolysis Bullosa Therapeutics Market Analysis by Therapeutic Approach: Introduction
- 8.3.2. Market Size Absolute $ Opportunity Analysis and Forecast, By Therapeutic Approach, 2016-2032
- 8.3.3. Wound Care Management
- 8.3.4. Symptomatic Treatment
- 8.3.5. Protein Replacement Therapy
- 8.3.6. Cell-Based Therapies
- 8.3.7. Immunomodulatory Therapies
- 8.3.8. Novel Therapeutic Approaches
- 8.4. Latin America Epidermolysis Bullosa Therapeutics Market Analysis, Opportunity and Forecast, By Age Group, 2016-2032
- 8.4.1. Latin America Epidermolysis Bullosa Therapeutics Market Analysis by Age Group: Introduction
- 8.4.2. Market Size Absolute $ Opportunity Analysis and Forecast, By Age Group, 2016-2032
- 8.4.3. Pediatric Patients
- 8.4.4. Adult Patients
- 8.5. Latin America Epidermolysis Bullosa Therapeutics Market Analysis, Opportunity and Forecast, By Treatment Setting, 2016-2032
- 8.5.1. Latin America Epidermolysis Bullosa Therapeutics Market Analysis by Treatment Setting: Introduction
- 8.5.2. Market Size Absolute $ Opportunity Analysis and Forecast, By Treatment Setting, 2016-2032
- 8.5.3. Hospital-based Treatment
- 8.5.4. Home-based Treatment
- 8.6. Latin America Epidermolysis Bullosa Therapeutics Market Analysis, Opportunity and Forecast, By Country , 2016-2032
- 8.6.1. Latin America Epidermolysis Bullosa Therapeutics Market Analysis by Country : Introduction
- 8.6.2. Market Size Absolute $ Opportunity Analysis and Forecast, Country , 2016-2032
- 8.6.2.1. Brazil
- 8.6.2.2. Colombia
- 8.6.2.3. Chile
- 8.6.2.4. Argentina
- 8.6.2.5. Costa Rica
- 8.6.2.6. Rest of Latin America
- 9. Middle East & Africa Epidermolysis Bullosa Therapeutics Market Analysis, Opportunity and Forecast, 2016-2032
- 9.1. Middle East & Africa Epidermolysis Bullosa Therapeutics Market Analysis, 2016-2021
- 9.2. Middle East & Africa Epidermolysis Bullosa Therapeutics Market Opportunity and Forecast, 2023-2032
- 9.3. Middle East & Africa Epidermolysis Bullosa Therapeutics Market Analysis, Opportunity and Forecast, By Therapeutic Approach, 2016-2032
- 9.3.1. Middle East & Africa Epidermolysis Bullosa Therapeutics Market Analysis by Therapeutic Approach: Introduction
- 9.3.2. Market Size Absolute $ Opportunity Analysis and Forecast, By Therapeutic Approach, 2016-2032
- 9.3.3. Wound Care Management
- 9.3.4. Symptomatic Treatment
- 9.3.5. Protein Replacement Therapy
- 9.3.6. Cell-Based Therapies
- 9.3.7. Immunomodulatory Therapies
- 9.3.8. Novel Therapeutic Approaches
- 9.4. Middle East & Africa Epidermolysis Bullosa Therapeutics Market Analysis, Opportunity and Forecast, By Age Group, 2016-2032
- 9.4.1. Middle East & Africa Epidermolysis Bullosa Therapeutics Market Analysis by Age Group: Introduction
- 9.4.2. Market Size Absolute $ Opportunity Analysis and Forecast, By Age Group, 2016-2032
- 9.4.3. Pediatric Patients
- 9.4.4. Adult Patients
- 9.5. Middle East & Africa Epidermolysis Bullosa Therapeutics Market Analysis, Opportunity and Forecast, By Treatment Setting, 2016-2032
- 9.5.1. Middle East & Africa Epidermolysis Bullosa Therapeutics Market Analysis by Treatment Setting: Introduction
- 9.5.2. Market Size Absolute $ Opportunity Analysis and Forecast, By Treatment Setting, 2016-2032
- 9.5.3. Hospital-based Treatment
- 9.5.4. Home-based Treatment
- 9.6. Middle East & Africa Epidermolysis Bullosa Therapeutics Market Analysis, Opportunity and Forecast, By Country , 2016-2032
- 9.6.1. Middle East & Africa Epidermolysis Bullosa Therapeutics Market Analysis by Country : Introduction
- 9.6.2. Market Size Absolute $ Opportunity Analysis and Forecast, Country , 2016-2032
- 9.6.2.1. Algeria
- 9.6.2.2. Egypt
- 9.6.2.3. Israel
- 9.6.2.4. Kuwait
- 9.6.2.5. Nigeria
- 9.6.2.6. Saudi Arabia
- 9.6.2.7. South Africa
- 9.6.2.8. Turkey
- 9.6.2.9. The UAE
- 9.6.2.10. Rest of MEA
- 10. Global Epidermolysis Bullosa Therapeutics Market Analysis, Opportunity and Forecast, By Region , 2016-2032
- 10.1. Global Epidermolysis Bullosa Therapeutics Market Analysis by Region : Introduction
- 10.2. Market Size Absolute $ Opportunity Analysis and Forecast, By Region , 2016-2032
- 10.2.1. North America
- 10.2.2. Western Europe
- 10.2.3. Eastern Europe
- 10.2.4. APAC
- 10.2.5. Latin America
- 10.2.6. Middle East & Africa
- 11. Global Epidermolysis Bullosa Therapeutics Market Competitive Landscape, Market Share Analysis, and Company Profiles
- 11.1. Market Share Analysis
- 11.2. Company Profiles
- 11.3. Castle Creek Biosciences
- 11.3.1. Company Overview
- 11.3.2. Financial Highlights
- 11.3.3. Product Portfolio
- 11.3.4. SWOT Analysis
- 11.3.5. Key Strategies and Developments
- 11.4. Amryt Pharma plc
- 11.4.1. Company Overview
- 11.4.2. Financial Highlights
- 11.4.3. Product Portfolio
- 11.4.4. SWOT Analysis
- 11.4.5. Key Strategies and Developments
- 11.5. ProQR Therapeutics
- 11.5.1. Company Overview
- 11.5.2. Financial Highlights
- 11.5.3. Product Portfolio
- 11.5.4. SWOT Analysis
- 11.5.5. Key Strategies and Developments
- 11.6. Abeona Therapeutics Inc.
- 11.6.1. Company Overview
- 11.6.2. Financial Highlights
- 11.6.3. Product Portfolio
- 11.6.4. SWOT Analysis
- 11.6.5. Key Strategies and Developments
- 11.7. Beremagene Geperpavec
- 11.7.1. Company Overview
- 11.7.2. Financial Highlights
- 11.7.3. Product Portfolio
- 11.7.4. SWOT Analysis
- 11.7.5. Key Strategies and Developments
- 11.8. InMed Pharmaceuticals, Inc.
- 11.8.1. Company Overview
- 11.8.2. Financial Highlights
- 11.8.3. Product Portfolio
- 11.8.4. SWOT Analysis
- 11.8.5. Key Strategies and Developments
- 11.9. dabocemagene autoficel
- 11.9.1. Company Overview
- 11.9.2. Financial Highlights
- 11.9.3. Product Portfolio
- 11.9.4. SWOT Analysis
- 11.9.5. Key Strategies and Developments
- 11.10. Castle Creek Biosciences, Inc.
- 11.10.1. Company Overview
- 11.10.2. Financial Highlights
- 11.10.3. Product Portfolio
- 11.10.4. SWOT Analysis
- 11.10.5. Key Strategies and Developments
- 11.13.1. Company Overview
- 11.13.2. Financial Highlights
- 11.13.3. Product Portfolio
- 11.13.4. SWOT Analysis
- 11.13.5. Key Strategies and Developments
- 12. Assumptions and Acronyms
- 13. Research Methodology
- 14. Contact
- List of Figures
- Figure 1: Global Epidermolysis Bullosa Therapeutics Market Revenue (US$ Mn) Market Share by Therapeutic Approach in 2022
- Figure 2: Global Epidermolysis Bullosa Therapeutics Market Attractiveness Analysis by Therapeutic Approach, 2016-2032
- Figure 3: Global Epidermolysis Bullosa Therapeutics Market Revenue (US$ Mn) Market Share by Age Groupin 2022
- Figure 4: Global Epidermolysis Bullosa Therapeutics Market Attractiveness Analysis by Age Group, 2016-2032
- Figure 5: Global Epidermolysis Bullosa Therapeutics Market Revenue (US$ Mn) Market Share by Treatment Settingin 2022
- Figure 6: Global Epidermolysis Bullosa Therapeutics Market Attractiveness Analysis by Treatment Setting, 2016-2032
- Figure 7: Global Epidermolysis Bullosa Therapeutics Market Revenue (US$ Mn) Market Share by Region in 2022
- Figure 8: Global Epidermolysis Bullosa Therapeutics Market Attractiveness Analysis by Region, 2016-2032
- Figure 9: Global Epidermolysis Bullosa Therapeutics Market Revenue (US$ Mn) (2016-2032)
- Figure 10: Global Epidermolysis Bullosa Therapeutics Market Revenue (US$ Mn) Comparison by Region (2016-2032)
- Figure 11: Global Epidermolysis Bullosa Therapeutics Market Revenue (US$ Mn) Comparison by Therapeutic Approach (2016-2032)
- Figure 12: Global Epidermolysis Bullosa Therapeutics Market Revenue (US$ Mn) Comparison by Age Group (2016-2032)
- Figure 13: Global Epidermolysis Bullosa Therapeutics Market Revenue (US$ Mn) Comparison by Treatment Setting (2016-2032)
- Figure 14: Global Epidermolysis Bullosa Therapeutics Market Y-o-Y Growth Rate Comparison by Region (2016-2032)
- Figure 15: Global Epidermolysis Bullosa Therapeutics Market Y-o-Y Growth Rate Comparison by Therapeutic Approach (2016-2032)
- Figure 16: Global Epidermolysis Bullosa Therapeutics Market Y-o-Y Growth Rate Comparison by Age Group (2016-2032)
- Figure 17: Global Epidermolysis Bullosa Therapeutics Market Y-o-Y Growth Rate Comparison by Treatment Setting (2016-2032)
- Figure 18: Global Epidermolysis Bullosa Therapeutics Market Share Comparison by Region (2016-2032)
- Figure 19: Global Epidermolysis Bullosa Therapeutics Market Share Comparison by Therapeutic Approach (2016-2032)
- Figure 20: Global Epidermolysis Bullosa Therapeutics Market Share Comparison by Age Group (2016-2032)
- Figure 21: Global Epidermolysis Bullosa Therapeutics Market Share Comparison by Treatment Setting (2016-2032)
- Figure 22: North America Epidermolysis Bullosa Therapeutics Market Revenue (US$ Mn) Market Share by Therapeutic Approachin 2022
- Figure 23: North America Epidermolysis Bullosa Therapeutics Market Attractiveness Analysis by Therapeutic Approach, 2016-2032
- Figure 24: North America Epidermolysis Bullosa Therapeutics Market Revenue (US$ Mn) Market Share by Age Groupin 2022
- Figure 25: North America Epidermolysis Bullosa Therapeutics Market Attractiveness Analysis by Age Group, 2016-2032
- Figure 26: North America Epidermolysis Bullosa Therapeutics Market Revenue (US$ Mn) Market Share by Treatment Settingin 2022
- Figure 27: North America Epidermolysis Bullosa Therapeutics Market Attractiveness Analysis by Treatment Setting, 2016-2032
- Figure 28: North America Epidermolysis Bullosa Therapeutics Market Revenue (US$ Mn) Market Share by Country in 2022
- Figure 29: North America Epidermolysis Bullosa Therapeutics Market Attractiveness Analysis by Country, 2016-2032
- Figure 30: North America Epidermolysis Bullosa Therapeutics Market Revenue (US$ Mn) (2016-2032)
- Figure 31: North America Epidermolysis Bullosa Therapeutics Market Revenue (US$ Mn) Comparison by Country (2016-2032)
- Figure 32: North America Epidermolysis Bullosa Therapeutics Market Revenue (US$ Mn) Comparison by Therapeutic Approach (2016-2032)
- Figure 33: North America Epidermolysis Bullosa Therapeutics Market Revenue (US$ Mn) Comparison by Age Group (2016-2032)
- Figure 34: North America Epidermolysis Bullosa Therapeutics Market Revenue (US$ Mn) Comparison by Treatment Setting (2016-2032)
- Figure 35: North America Epidermolysis Bullosa Therapeutics Market Y-o-Y Growth Rate Comparison by Country (2016-2032)
- Figure 36: North America Epidermolysis Bullosa Therapeutics Market Y-o-Y Growth Rate Comparison by Therapeutic Approach (2016-2032)
- Figure 37: North America Epidermolysis Bullosa Therapeutics Market Y-o-Y Growth Rate Comparison by Age Group (2016-2032)
- Figure 38: North America Epidermolysis Bullosa Therapeutics Market Y-o-Y Growth Rate Comparison by Treatment Setting (2016-2032)
- Figure 39: North America Epidermolysis Bullosa Therapeutics Market Share Comparison by Country (2016-2032)
- Figure 40: North America Epidermolysis Bullosa Therapeutics Market Share Comparison by Therapeutic Approach (2016-2032)
- Figure 41: North America Epidermolysis Bullosa Therapeutics Market Share Comparison by Age Group (2016-2032)
- Figure 42: North America Epidermolysis Bullosa Therapeutics Market Share Comparison by Treatment Setting (2016-2032)
- Figure 43: Western Europe Epidermolysis Bullosa Therapeutics Market Revenue (US$ Mn) Market Share by Therapeutic Approachin 2022
- Figure 44: Western Europe Epidermolysis Bullosa Therapeutics Market Attractiveness Analysis by Therapeutic Approach, 2016-2032
- Figure 45: Western Europe Epidermolysis Bullosa Therapeutics Market Revenue (US$ Mn) Market Share by Age Groupin 2022
- Figure 46: Western Europe Epidermolysis Bullosa Therapeutics Market Attractiveness Analysis by Age Group, 2016-2032
- Figure 47: Western Europe Epidermolysis Bullosa Therapeutics Market Revenue (US$ Mn) Market Share by Treatment Settingin 2022
- Figure 48: Western Europe Epidermolysis Bullosa Therapeutics Market Attractiveness Analysis by Treatment Setting, 2016-2032
- Figure 49: Western Europe Epidermolysis Bullosa Therapeutics Market Revenue (US$ Mn) Market Share by Country in 2022
- Figure 50: Western Europe Epidermolysis Bullosa Therapeutics Market Attractiveness Analysis by Country, 2016-2032
- Figure 51: Western Europe Epidermolysis Bullosa Therapeutics Market Revenue (US$ Mn) (2016-2032)
- Figure 52: Western Europe Epidermolysis Bullosa Therapeutics Market Revenue (US$ Mn) Comparison by Country (2016-2032)
- Figure 53: Western Europe Epidermolysis Bullosa Therapeutics Market Revenue (US$ Mn) Comparison by Therapeutic Approach (2016-2032)
- Figure 54: Western Europe Epidermolysis Bullosa Therapeutics Market Revenue (US$ Mn) Comparison by Age Group (2016-2032)
- Figure 55: Western Europe Epidermolysis Bullosa Therapeutics Market Revenue (US$ Mn) Comparison by Treatment Setting (2016-2032)
- Figure 56: Western Europe Epidermolysis Bullosa Therapeutics Market Y-o-Y Growth Rate Comparison by Country (2016-2032)
- Figure 57: Western Europe Epidermolysis Bullosa Therapeutics Market Y-o-Y Growth Rate Comparison by Therapeutic Approach (2016-2032)
- Figure 58: Western Europe Epidermolysis Bullosa Therapeutics Market Y-o-Y Growth Rate Comparison by Age Group (2016-2032)
- Figure 59: Western Europe Epidermolysis Bullosa Therapeutics Market Y-o-Y Growth Rate Comparison by Treatment Setting (2016-2032)
- Figure 60: Western Europe Epidermolysis Bullosa Therapeutics Market Share Comparison by Country (2016-2032)
- Figure 61: Western Europe Epidermolysis Bullosa Therapeutics Market Share Comparison by Therapeutic Approach (2016-2032)
- Figure 62: Western Europe Epidermolysis Bullosa Therapeutics Market Share Comparison by Age Group (2016-2032)
- Figure 63: Western Europe Epidermolysis Bullosa Therapeutics Market Share Comparison by Treatment Setting (2016-2032)
- Figure 64: Eastern Europe Epidermolysis Bullosa Therapeutics Market Revenue (US$ Mn) Market Share by Therapeutic Approachin 2022
- Figure 65: Eastern Europe Epidermolysis Bullosa Therapeutics Market Attractiveness Analysis by Therapeutic Approach, 2016-2032
- Figure 66: Eastern Europe Epidermolysis Bullosa Therapeutics Market Revenue (US$ Mn) Market Share by Age Groupin 2022
- Figure 67: Eastern Europe Epidermolysis Bullosa Therapeutics Market Attractiveness Analysis by Age Group, 2016-2032
- Figure 68: Eastern Europe Epidermolysis Bullosa Therapeutics Market Revenue (US$ Mn) Market Share by Treatment Settingin 2022
- Figure 69: Eastern Europe Epidermolysis Bullosa Therapeutics Market Attractiveness Analysis by Treatment Setting, 2016-2032
- Figure 70: Eastern Europe Epidermolysis Bullosa Therapeutics Market Revenue (US$ Mn) Market Share by Country in 2022
- Figure 71: Eastern Europe Epidermolysis Bullosa Therapeutics Market Attractiveness Analysis by Country, 2016-2032
- Figure 72: Eastern Europe Epidermolysis Bullosa Therapeutics Market Revenue (US$ Mn) (2016-2032)
- Figure 73: Eastern Europe Epidermolysis Bullosa Therapeutics Market Revenue (US$ Mn) Comparison by Country (2016-2032)
- Figure 74: Eastern Europe Epidermolysis Bullosa Therapeutics Market Revenue (US$ Mn) Comparison by Therapeutic Approach (2016-2032)
- Figure 75: Eastern Europe Epidermolysis Bullosa Therapeutics Market Revenue (US$ Mn) Comparison by Age Group (2016-2032)
- Figure 76: Eastern Europe Epidermolysis Bullosa Therapeutics Market Revenue (US$ Mn) Comparison by Treatment Setting (2016-2032)
- Figure 77: Eastern Europe Epidermolysis Bullosa Therapeutics Market Y-o-Y Growth Rate Comparison by Country (2016-2032)
- Figure 78: Eastern Europe Epidermolysis Bullosa Therapeutics Market Y-o-Y Growth Rate Comparison by Therapeutic Approach (2016-2032)
- Figure 79: Eastern Europe Epidermolysis Bullosa Therapeutics Market Y-o-Y Growth Rate Comparison by Age Group (2016-2032)
- Figure 80: Eastern Europe Epidermolysis Bullosa Therapeutics Market Y-o-Y Growth Rate Comparison by Treatment Setting (2016-2032)
- Figure 81: Eastern Europe Epidermolysis Bullosa Therapeutics Market Share Comparison by Country (2016-2032)
- Figure 82: Eastern Europe Epidermolysis Bullosa Therapeutics Market Share Comparison by Therapeutic Approach (2016-2032)
- Figure 83: Eastern Europe Epidermolysis Bullosa Therapeutics Market Share Comparison by Age Group (2016-2032)
- Figure 84: Eastern Europe Epidermolysis Bullosa Therapeutics Market Share Comparison by Treatment Setting (2016-2032)
- Figure 85: APAC Epidermolysis Bullosa Therapeutics Market Revenue (US$ Mn) Market Share by Therapeutic Approachin 2022
- Figure 86: APAC Epidermolysis Bullosa Therapeutics Market Attractiveness Analysis by Therapeutic Approach, 2016-2032
- Figure 87: APAC Epidermolysis Bullosa Therapeutics Market Revenue (US$ Mn) Market Share by Age Groupin 2022
- Figure 88: APAC Epidermolysis Bullosa Therapeutics Market Attractiveness Analysis by Age Group, 2016-2032
- Figure 89: APAC Epidermolysis Bullosa Therapeutics Market Revenue (US$ Mn) Market Share by Treatment Settingin 2022
- Figure 90: APAC Epidermolysis Bullosa Therapeutics Market Attractiveness Analysis by Treatment Setting, 2016-2032
- Figure 91: APAC Epidermolysis Bullosa Therapeutics Market Revenue (US$ Mn) Market Share by Country in 2022
- Figure 92: APAC Epidermolysis Bullosa Therapeutics Market Attractiveness Analysis by Country, 2016-2032
- Figure 93: APAC Epidermolysis Bullosa Therapeutics Market Revenue (US$ Mn) (2016-2032)
- Figure 94: APAC Epidermolysis Bullosa Therapeutics Market Revenue (US$ Mn) Comparison by Country (2016-2032)
- Figure 95: APAC Epidermolysis Bullosa Therapeutics Market Revenue (US$ Mn) Comparison by Therapeutic Approach (2016-2032)
- Figure 96: APAC Epidermolysis Bullosa Therapeutics Market Revenue (US$ Mn) Comparison by Age Group (2016-2032)
- Figure 97: APAC Epidermolysis Bullosa Therapeutics Market Revenue (US$ Mn) Comparison by Treatment Setting (2016-2032)
- Figure 98: APAC Epidermolysis Bullosa Therapeutics Market Y-o-Y Growth Rate Comparison by Country (2016-2032)
- Figure 99: APAC Epidermolysis Bullosa Therapeutics Market Y-o-Y Growth Rate Comparison by Therapeutic Approach (2016-2032)
- Figure 100: APAC Epidermolysis Bullosa Therapeutics Market Y-o-Y Growth Rate Comparison by Age Group (2016-2032)
- Figure 101: APAC Epidermolysis Bullosa Therapeutics Market Y-o-Y Growth Rate Comparison by Treatment Setting (2016-2032)
- Figure 102: APAC Epidermolysis Bullosa Therapeutics Market Share Comparison by Country (2016-2032)
- Figure 103: APAC Epidermolysis Bullosa Therapeutics Market Share Comparison by Therapeutic Approach (2016-2032)
- Figure 104: APAC Epidermolysis Bullosa Therapeutics Market Share Comparison by Age Group (2016-2032)
- Figure 105: APAC Epidermolysis Bullosa Therapeutics Market Share Comparison by Treatment Setting (2016-2032)
- Figure 106: Latin America Epidermolysis Bullosa Therapeutics Market Revenue (US$ Mn) Market Share by Therapeutic Approachin 2022
- Figure 107: Latin America Epidermolysis Bullosa Therapeutics Market Attractiveness Analysis by Therapeutic Approach, 2016-2032
- Figure 108: Latin America Epidermolysis Bullosa Therapeutics Market Revenue (US$ Mn) Market Share by Age Groupin 2022
- Figure 109: Latin America Epidermolysis Bullosa Therapeutics Market Attractiveness Analysis by Age Group, 2016-2032
- Figure 110: Latin America Epidermolysis Bullosa Therapeutics Market Revenue (US$ Mn) Market Share by Treatment Settingin 2022
- Figure 111: Latin America Epidermolysis Bullosa Therapeutics Market Attractiveness Analysis by Treatment Setting, 2016-2032
- Figure 112: Latin America Epidermolysis Bullosa Therapeutics Market Revenue (US$ Mn) Market Share by Country in 2022
- Figure 113: Latin America Epidermolysis Bullosa Therapeutics Market Attractiveness Analysis by Country, 2016-2032
- Figure 114: Latin America Epidermolysis Bullosa Therapeutics Market Revenue (US$ Mn) (2016-2032)
- Figure 115: Latin America Epidermolysis Bullosa Therapeutics Market Revenue (US$ Mn) Comparison by Country (2016-2032)
- Figure 116: Latin America Epidermolysis Bullosa Therapeutics Market Revenue (US$ Mn) Comparison by Therapeutic Approach (2016-2032)
- Figure 117: Latin America Epidermolysis Bullosa Therapeutics Market Revenue (US$ Mn) Comparison by Age Group (2016-2032)
- Figure 118: Latin America Epidermolysis Bullosa Therapeutics Market Revenue (US$ Mn) Comparison by Treatment Setting (2016-2032)
- Figure 119: Latin America Epidermolysis Bullosa Therapeutics Market Y-o-Y Growth Rate Comparison by Country (2016-2032)
- Figure 120: Latin America Epidermolysis Bullosa Therapeutics Market Y-o-Y Growth Rate Comparison by Therapeutic Approach (2016-2032)
- Figure 121: Latin America Epidermolysis Bullosa Therapeutics Market Y-o-Y Growth Rate Comparison by Age Group (2016-2032)
- Figure 122: Latin America Epidermolysis Bullosa Therapeutics Market Y-o-Y Growth Rate Comparison by Treatment Setting (2016-2032)
- Figure 123: Latin America Epidermolysis Bullosa Therapeutics Market Share Comparison by Country (2016-2032)
- Figure 124: Latin America Epidermolysis Bullosa Therapeutics Market Share Comparison by Therapeutic Approach (2016-2032)
- Figure 125: Latin America Epidermolysis Bullosa Therapeutics Market Share Comparison by Age Group (2016-2032)
- Figure 126: Latin America Epidermolysis Bullosa Therapeutics Market Share Comparison by Treatment Setting (2016-2032)
- Figure 127: Middle East & Africa Epidermolysis Bullosa Therapeutics Market Revenue (US$ Mn) Market Share by Therapeutic Approachin 2022
- Figure 128: Middle East & Africa Epidermolysis Bullosa Therapeutics Market Attractiveness Analysis by Therapeutic Approach, 2016-2032
- Figure 129: Middle East & Africa Epidermolysis Bullosa Therapeutics Market Revenue (US$ Mn) Market Share by Age Groupin 2022
- Figure 130: Middle East & Africa Epidermolysis Bullosa Therapeutics Market Attractiveness Analysis by Age Group, 2016-2032
- Figure 131: Middle East & Africa Epidermolysis Bullosa Therapeutics Market Revenue (US$ Mn) Market Share by Treatment Settingin 2022
- Figure 132: Middle East & Africa Epidermolysis Bullosa Therapeutics Market Attractiveness Analysis by Treatment Setting, 2016-2032
- Figure 133: Middle East & Africa Epidermolysis Bullosa Therapeutics Market Revenue (US$ Mn) Market Share by Country in 2022
- Figure 134: Middle East & Africa Epidermolysis Bullosa Therapeutics Market Attractiveness Analysis by Country, 2016-2032
- Figure 135: Middle East & Africa Epidermolysis Bullosa Therapeutics Market Revenue (US$ Mn) (2016-2032)
- Figure 136: Middle East & Africa Epidermolysis Bullosa Therapeutics Market Revenue (US$ Mn) Comparison by Country (2016-2032)
- Figure 137: Middle East & Africa Epidermolysis Bullosa Therapeutics Market Revenue (US$ Mn) Comparison by Therapeutic Approach (2016-2032)
- Figure 138: Middle East & Africa Epidermolysis Bullosa Therapeutics Market Revenue (US$ Mn) Comparison by Age Group (2016-2032)
- Figure 139: Middle East & Africa Epidermolysis Bullosa Therapeutics Market Revenue (US$ Mn) Comparison by Treatment Setting (2016-2032)
- Figure 140: Middle East & Africa Epidermolysis Bullosa Therapeutics Market Y-o-Y Growth Rate Comparison by Country (2016-2032)
- Figure 141: Middle East & Africa Epidermolysis Bullosa Therapeutics Market Y-o-Y Growth Rate Comparison by Therapeutic Approach (2016-2032)
- Figure 142: Middle East & Africa Epidermolysis Bullosa Therapeutics Market Y-o-Y Growth Rate Comparison by Age Group (2016-2032)
- Figure 143: Middle East & Africa Epidermolysis Bullosa Therapeutics Market Y-o-Y Growth Rate Comparison by Treatment Setting (2016-2032)
- Figure 144: Middle East & Africa Epidermolysis Bullosa Therapeutics Market Share Comparison by Country (2016-2032)
- Figure 145: Middle East & Africa Epidermolysis Bullosa Therapeutics Market Share Comparison by Therapeutic Approach (2016-2032)
- Figure 146: Middle East & Africa Epidermolysis Bullosa Therapeutics Market Share Comparison by Age Group (2016-2032)
- Figure 147: Middle East & Africa Epidermolysis Bullosa Therapeutics Market Share Comparison by Treatment Setting (2016-2032)
- List of Tables
- Table 1: Global Epidermolysis Bullosa Therapeutics Market Comparison by Therapeutic Approach (2016-2032)
- Table 2: Global Epidermolysis Bullosa Therapeutics Market Comparison by Age Group (2016-2032)
- Table 3: Global Epidermolysis Bullosa Therapeutics Market Comparison by Treatment Setting (2016-2032)
- Table 4: Global Epidermolysis Bullosa Therapeutics Market Revenue (US$ Mn) Comparison by Region (2016-2032)
- Table 5: Global Epidermolysis Bullosa Therapeutics Market Revenue (US$ Mn) (2016-2032)
- Table 6: Global Epidermolysis Bullosa Therapeutics Market Revenue (US$ Mn) Comparison by Region (2016-2032)
- Table 7: Global Epidermolysis Bullosa Therapeutics Market Revenue (US$ Mn) Comparison by Therapeutic Approach (2016-2032)
- Table 8: Global Epidermolysis Bullosa Therapeutics Market Revenue (US$ Mn) Comparison by Age Group (2016-2032)
- Table 9: Global Epidermolysis Bullosa Therapeutics Market Revenue (US$ Mn) Comparison by Treatment Setting (2016-2032)
- Table 10: Global Epidermolysis Bullosa Therapeutics Market Y-o-Y Growth Rate Comparison by Region (2016-2032)
- Table 11: Global Epidermolysis Bullosa Therapeutics Market Y-o-Y Growth Rate Comparison by Therapeutic Approach (2016-2032)
- Table 12: Global Epidermolysis Bullosa Therapeutics Market Y-o-Y Growth Rate Comparison by Age Group (2016-2032)
- Table 13: Global Epidermolysis Bullosa Therapeutics Market Y-o-Y Growth Rate Comparison by Treatment Setting (2016-2032)
- Table 14: Global Epidermolysis Bullosa Therapeutics Market Share Comparison by Region (2016-2032)
- Table 15: Global Epidermolysis Bullosa Therapeutics Market Share Comparison by Therapeutic Approach (2016-2032)
- Table 16: Global Epidermolysis Bullosa Therapeutics Market Share Comparison by Age Group (2016-2032)
- Table 17: Global Epidermolysis Bullosa Therapeutics Market Share Comparison by Treatment Setting (2016-2032)
- Table 18: North America Epidermolysis Bullosa Therapeutics Market Comparison by Age Group (2016-2032)
- Table 19: North America Epidermolysis Bullosa Therapeutics Market Comparison by Treatment Setting (2016-2032)
- Table 20: North America Epidermolysis Bullosa Therapeutics Market Revenue (US$ Mn) Comparison by Country (2016-2032)
- Table 21: North America Epidermolysis Bullosa Therapeutics Market Revenue (US$ Mn) (2016-2032)
- Table 22: North America Epidermolysis Bullosa Therapeutics Market Revenue (US$ Mn) Comparison by Country (2016-2032)
- Table 23: North America Epidermolysis Bullosa Therapeutics Market Revenue (US$ Mn) Comparison by Therapeutic Approach (2016-2032)
- Table 24: North America Epidermolysis Bullosa Therapeutics Market Revenue (US$ Mn) Comparison by Age Group (2016-2032)
- Table 25: North America Epidermolysis Bullosa Therapeutics Market Revenue (US$ Mn) Comparison by Treatment Setting (2016-2032)
- Table 26: North America Epidermolysis Bullosa Therapeutics Market Y-o-Y Growth Rate Comparison by Country (2016-2032)
- Table 27: North America Epidermolysis Bullosa Therapeutics Market Y-o-Y Growth Rate Comparison by Therapeutic Approach (2016-2032)
- Table 28: North America Epidermolysis Bullosa Therapeutics Market Y-o-Y Growth Rate Comparison by Age Group (2016-2032)
- Table 29: North America Epidermolysis Bullosa Therapeutics Market Y-o-Y Growth Rate Comparison by Treatment Setting (2016-2032)
- Table 30: North America Epidermolysis Bullosa Therapeutics Market Share Comparison by Country (2016-2032)
- Table 31: North America Epidermolysis Bullosa Therapeutics Market Share Comparison by Therapeutic Approach (2016-2032)
- Table 32: North America Epidermolysis Bullosa Therapeutics Market Share Comparison by Age Group (2016-2032)
- Table 33: North America Epidermolysis Bullosa Therapeutics Market Share Comparison by Treatment Setting (2016-2032)
- Table 34: Western Europe Epidermolysis Bullosa Therapeutics Market Comparison by Therapeutic Approach (2016-2032)
- Table 35: Western Europe Epidermolysis Bullosa Therapeutics Market Comparison by Age Group (2016-2032)
- Table 36: Western Europe Epidermolysis Bullosa Therapeutics Market Comparison by Treatment Setting (2016-2032)
- Table 37: Western Europe Epidermolysis Bullosa Therapeutics Market Revenue (US$ Mn) Comparison by Country (2016-2032)
- Table 38: Western Europe Epidermolysis Bullosa Therapeutics Market Revenue (US$ Mn) (2016-2032)
- Table 39: Western Europe Epidermolysis Bullosa Therapeutics Market Revenue (US$ Mn) Comparison by Country (2016-2032)
- Table 40: Western Europe Epidermolysis Bullosa Therapeutics Market Revenue (US$ Mn) Comparison by Therapeutic Approach (2016-2032)
- Table 41: Western Europe Epidermolysis Bullosa Therapeutics Market Revenue (US$ Mn) Comparison by Age Group (2016-2032)
- Table 42: Western Europe Epidermolysis Bullosa Therapeutics Market Revenue (US$ Mn) Comparison by Treatment Setting (2016-2032)
- Table 43: Western Europe Epidermolysis Bullosa Therapeutics Market Y-o-Y Growth Rate Comparison by Country (2016-2032)
- Table 44: Western Europe Epidermolysis Bullosa Therapeutics Market Y-o-Y Growth Rate Comparison by Therapeutic Approach (2016-2032)
- Table 45: Western Europe Epidermolysis Bullosa Therapeutics Market Y-o-Y Growth Rate Comparison by Age Group (2016-2032)
- Table 46: Western Europe Epidermolysis Bullosa Therapeutics Market Y-o-Y Growth Rate Comparison by Treatment Setting (2016-2032)
- Table 47: Western Europe Epidermolysis Bullosa Therapeutics Market Share Comparison by Country (2016-2032)
- Table 48: Western Europe Epidermolysis Bullosa Therapeutics Market Share Comparison by Therapeutic Approach (2016-2032)
- Table 49: Western Europe Epidermolysis Bullosa Therapeutics Market Share Comparison by Age Group (2016-2032)
- Table 50: Western Europe Epidermolysis Bullosa Therapeutics Market Share Comparison by Treatment Setting (2016-2032)
- Table 51: Eastern Europe Epidermolysis Bullosa Therapeutics Market Comparison by Therapeutic Approach (2016-2032)
- Table 52: Eastern Europe Epidermolysis Bullosa Therapeutics Market Comparison by Age Group (2016-2032)
- Table 53: Eastern Europe Epidermolysis Bullosa Therapeutics Market Comparison by Treatment Setting (2016-2032)
- Table 54: Eastern Europe Epidermolysis Bullosa Therapeutics Market Revenue (US$ Mn) Comparison by Country (2016-2032)
- Table 55: Eastern Europe Epidermolysis Bullosa Therapeutics Market Revenue (US$ Mn) (2016-2032)
- Table 56: Eastern Europe Epidermolysis Bullosa Therapeutics Market Revenue (US$ Mn) Comparison by Country (2016-2032)
- Table 57: Eastern Europe Epidermolysis Bullosa Therapeutics Market Revenue (US$ Mn) Comparison by Therapeutic Approach (2016-2032)
- Table 58: Eastern Europe Epidermolysis Bullosa Therapeutics Market Revenue (US$ Mn) Comparison by Age Group (2016-2032)
- Table 59: Eastern Europe Epidermolysis Bullosa Therapeutics Market Revenue (US$ Mn) Comparison by Treatment Setting (2016-2032)
- Table 60: Eastern Europe Epidermolysis Bullosa Therapeutics Market Y-o-Y Growth Rate Comparison by Country (2016-2032)
- Table 61: Eastern Europe Epidermolysis Bullosa Therapeutics Market Y-o-Y Growth Rate Comparison by Therapeutic Approach (2016-2032)
- Table 62: Eastern Europe Epidermolysis Bullosa Therapeutics Market Y-o-Y Growth Rate Comparison by Age Group (2016-2032)
- Table 63: Eastern Europe Epidermolysis Bullosa Therapeutics Market Y-o-Y Growth Rate Comparison by Treatment Setting (2016-2032)
- Table 64: Eastern Europe Epidermolysis Bullosa Therapeutics Market Share Comparison by Country (2016-2032)
- Table 65: Eastern Europe Epidermolysis Bullosa Therapeutics Market Share Comparison by Therapeutic Approach (2016-2032)
- Table 66: Eastern Europe Epidermolysis Bullosa Therapeutics Market Share Comparison by Age Group (2016-2032)
- Table 67: Eastern Europe Epidermolysis Bullosa Therapeutics Market Share Comparison by Treatment Setting (2016-2032)
- Table 68: APAC Epidermolysis Bullosa Therapeutics Market Comparison by Therapeutic Approach (2016-2032)
- Table 69: APAC Epidermolysis Bullosa Therapeutics Market Comparison by Age Group (2016-2032)
- Table 70: APAC Epidermolysis Bullosa Therapeutics Market Comparison by Treatment Setting (2016-2032)
- Table 71: APAC Epidermolysis Bullosa Therapeutics Market Revenue (US$ Mn) Comparison by Country (2016-2032)
- Table 72: APAC Epidermolysis Bullosa Therapeutics Market Revenue (US$ Mn) (2016-2032)
- Table 73: APAC Epidermolysis Bullosa Therapeutics Market Revenue (US$ Mn) Comparison by Country (2016-2032)
- Table 74: APAC Epidermolysis Bullosa Therapeutics Market Revenue (US$ Mn) Comparison by Therapeutic Approach (2016-2032)
- Table 75: APAC Epidermolysis Bullosa Therapeutics Market Revenue (US$ Mn) Comparison by Age Group (2016-2032)
- Table 76: APAC Epidermolysis Bullosa Therapeutics Market Revenue (US$ Mn) Comparison by Treatment Setting (2016-2032)
- Table 77: APAC Epidermolysis Bullosa Therapeutics Market Y-o-Y Growth Rate Comparison by Country (2016-2032)
- Table 78: APAC Epidermolysis Bullosa Therapeutics Market Y-o-Y Growth Rate Comparison by Therapeutic Approach (2016-2032)
- Table 79: APAC Epidermolysis Bullosa Therapeutics Market Y-o-Y Growth Rate Comparison by Age Group (2016-2032)
- Table 80: APAC Epidermolysis Bullosa Therapeutics Market Y-o-Y Growth Rate Comparison by Treatment Setting (2016-2032)
- Table 81: APAC Epidermolysis Bullosa Therapeutics Market Share Comparison by Country (2016-2032)
- Table 82: APAC Epidermolysis Bullosa Therapeutics Market Share Comparison by Therapeutic Approach (2016-2032)
- Table 83: APAC Epidermolysis Bullosa Therapeutics Market Share Comparison by Age Group (2016-2032)
- Table 84: APAC Epidermolysis Bullosa Therapeutics Market Share Comparison by Treatment Setting (2016-2032)
- Table 85: Latin America Epidermolysis Bullosa Therapeutics Market Comparison by Therapeutic Approach (2016-2032)
- Table 86: Latin America Epidermolysis Bullosa Therapeutics Market Comparison by Age Group (2016-2032)
- Table 87: Latin America Epidermolysis Bullosa Therapeutics Market Comparison by Treatment Setting (2016-2032)
- Table 88: Latin America Epidermolysis Bullosa Therapeutics Market Revenue (US$ Mn) Comparison by Country (2016-2032)
- Table 89: Latin America Epidermolysis Bullosa Therapeutics Market Revenue (US$ Mn) (2016-2032)
- Table 90: Latin America Epidermolysis Bullosa Therapeutics Market Revenue (US$ Mn) Comparison by Country (2016-2032)
- Table 91: Latin America Epidermolysis Bullosa Therapeutics Market Revenue (US$ Mn) Comparison by Therapeutic Approach (2016-2032)
- Table 92: Latin America Epidermolysis Bullosa Therapeutics Market Revenue (US$ Mn) Comparison by Age Group (2016-2032)
- Table 93: Latin America Epidermolysis Bullosa Therapeutics Market Revenue (US$ Mn) Comparison by Treatment Setting (2016-2032)
- Table 94: Latin America Epidermolysis Bullosa Therapeutics Market Y-o-Y Growth Rate Comparison by Country (2016-2032)
- Table 95: Latin America Epidermolysis Bullosa Therapeutics Market Y-o-Y Growth Rate Comparison by Therapeutic Approach (2016-2032)
- Table 96: Latin America Epidermolysis Bullosa Therapeutics Market Y-o-Y Growth Rate Comparison by Age Group (2016-2032)
- Table 97: Latin America Epidermolysis Bullosa Therapeutics Market Y-o-Y Growth Rate Comparison by Treatment Setting (2016-2032)
- Table 98: Latin America Epidermolysis Bullosa Therapeutics Market Share Comparison by Country (2016-2032)
- Table 99: Latin America Epidermolysis Bullosa Therapeutics Market Share Comparison by Therapeutic Approach (2016-2032)
- Table 100: Latin America Epidermolysis Bullosa Therapeutics Market Share Comparison by Age Group (2016-2032)
- Table 101: Latin America Epidermolysis Bullosa Therapeutics Market Share Comparison by Treatment Setting (2016-2032)
- Table 102: Middle East & Africa Epidermolysis Bullosa Therapeutics Market Comparison by Therapeutic Approach (2016-2032)
- Table 103: Middle East & Africa Epidermolysis Bullosa Therapeutics Market Comparison by Age Group (2016-2032)
- Table 104: Middle East & Africa Epidermolysis Bullosa Therapeutics Market Comparison by Treatment Setting (2016-2032)
- Table 105: Middle East & Africa Epidermolysis Bullosa Therapeutics Market Revenue (US$ Mn) Comparison by Country (2016-2032)
- Table 106: Middle East & Africa Epidermolysis Bullosa Therapeutics Market Revenue (US$ Mn) (2016-2032)
- Table 107: Middle East & Africa Epidermolysis Bullosa Therapeutics Market Revenue (US$ Mn) Comparison by Country (2016-2032)
- Table 108: Middle East & Africa Epidermolysis Bullosa Therapeutics Market Revenue (US$ Mn) Comparison by Therapeutic Approach (2016-2032)
- Table 109: Middle East & Africa Epidermolysis Bullosa Therapeutics Market Revenue (US$ Mn) Comparison by Age Group (2016-2032)
- Table 110: Middle East & Africa Epidermolysis Bullosa Therapeutics Market Revenue (US$ Mn) Comparison by Treatment Setting (2016-2032)
- Table 111: Middle East & Africa Epidermolysis Bullosa Therapeutics Market Y-o-Y Growth Rate Comparison by Country (2016-2032)
- Table 112: Middle East & Africa Epidermolysis Bullosa Therapeutics Market Y-o-Y Growth Rate Comparison by Therapeutic Approach (2016-2032)
- Table 113: Middle East & Africa Epidermolysis Bullosa Therapeutics Market Y-o-Y Growth Rate Comparison by Age Group (2016-2032)
- Table 114: Middle East & Africa Epidermolysis Bullosa Therapeutics Market Y-o-Y Growth Rate Comparison by Treatment Setting (2016-2032)
- Table 115: Middle East & Africa Epidermolysis Bullosa Therapeutics Market Share Comparison by Country (2016-2032)
- Table 116: Middle East & Africa Epidermolysis Bullosa Therapeutics Market Share Comparison by Therapeutic Approach (2016-2032)
- Table 117: Middle East & Africa Epidermolysis Bullosa Therapeutics Market Share Comparison by Age Group (2016-2032)
- Table 118: Middle East & Africa Epidermolysis Bullosa Therapeutics Market Share Comparison by Treatment Setting (2016-2032)
- 1. Executive Summary
-
- Castle Creek Biosciences
- Amryt Pharma plc
- ProQR Therapeutics
- Abeona Therapeutics Inc.
- Beremagene Geperpavec
- InMed Pharmaceuticals, Inc.
- Castle Creek Biosciences, Inc.
Our Clients


View Our Licence Options
