
Enterprise Asset Management Market By Applications Analysis (Predictive Maintenance, Asset Lifecycle Management, Others), By Deployment Models Analysis (On-premise, Cloud), By Verticals Analysis (Transportation and Logistics, IT and Telecom, Others), By Region And Companies - Industry Segment Outlook, Market Assessment, Competition Scenario, Trends, And Forecast 2023-2032
-
25170
-
March 2023
-
157
-


-
This report was compiled by Vishwa Gaul Vishwa is an experienced market research and consulting professional with over 8 years of expertise in the ICT industry, contributing to over 700 reports across telecommunications, software, hardware, and digital solutions. Correspondence Team Lead- ICT Linkedin | Detailed Market research Methodology Our methodology involves a mix of primary research, including interviews with leading mental health experts, and secondary research from reputable medical journals and databases. View Detailed Methodology Page
-
Quick Navigation
Report Overview
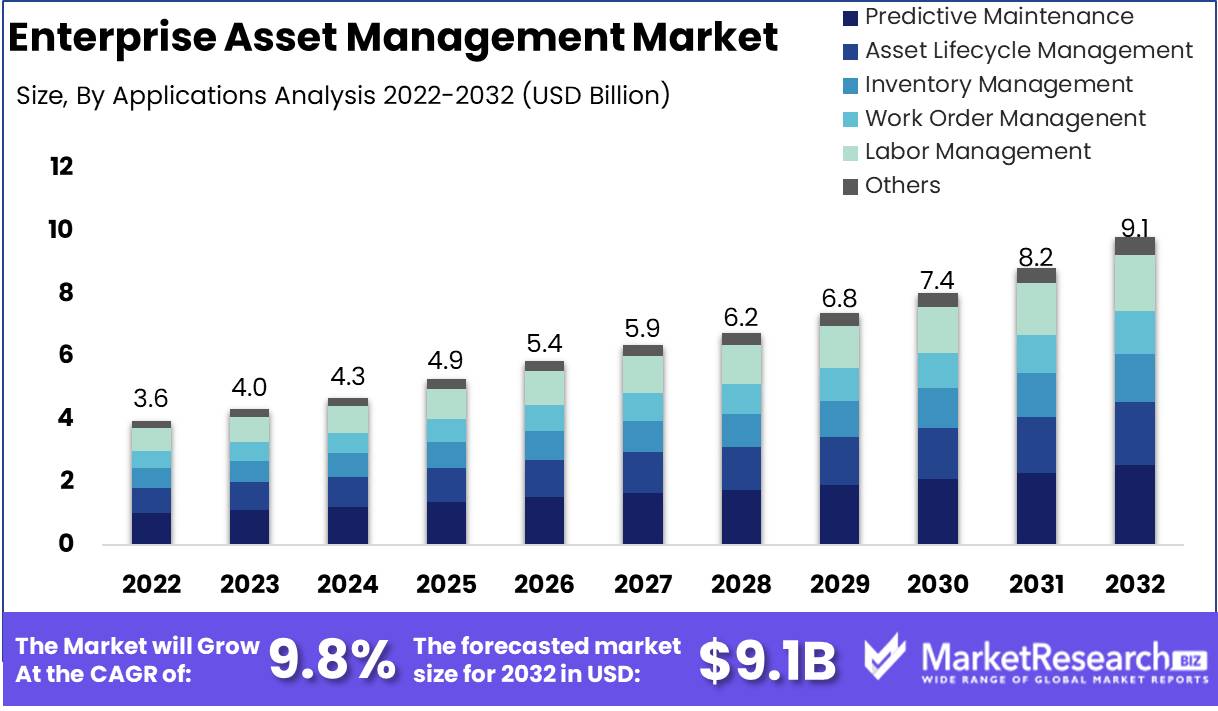
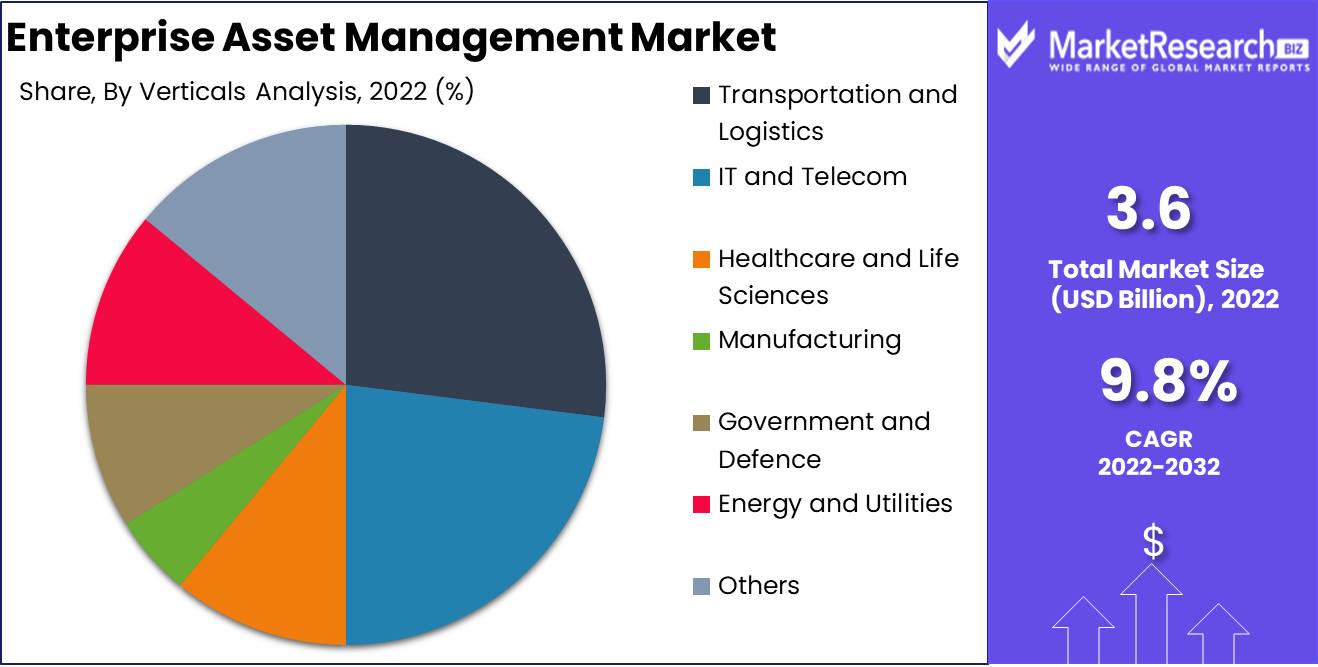
Enterprise Asset Management Market size is expected to be worth around USD 9.1 Bn by 2032 from USD 3.6 Bn in 2022, growing at a CAGR of 9.8% during the forecast period from 2023 to 2032.
The enterprise asset management market is booming as more companies adopt this cutting-edge technology to streamline operations, decrease costs, and boost productivity. In this meticulously crafted report, we will delve deeply into the very essence of enterprise asset management, attempting to unravel its multifaceted dimensions, including its definition and goals, its momentous strides in the realm of innovation, its resplendent growth trajectory, and diverse applications.
The overarching goal of enterprise asset management is to meticulously optimize the employment and maintenance of these invaluable assets, ingeniously cauterizing costs and debilitating downtime while ushering in an era of unprecedented performance and efficiency. enterprise asset management systems, the lifeblood of this massive undertaking, have an extensive repertoire of functionalities.
Enterprise asset management covers the entire spectrum of commerce and industry and is a crucial tool for any company that uses the power of transportation to proudly generate revenue, whether it be the imperious machinery on a busy factory floor, the brave fleets of vehicles that bravely travel the world's highways, or even the ethereal assets of IT infrastructure peacefully nestled in the cloud.
With the indomitable power of enterprise asset management coursing through their corporate veins, enterprises achieve the invaluable boon of reduced maintenance costs, effectively breathing new life into the very essence of their assets, deftly prolonging their lifespan, and seamlessly minimizing the nightmare of downtime caused by distressing breakdowns and other issues.
In the ever-evolving tapestry of enterprise asset management market, awe-inspiring breakthroughs have sprouted, painting the canvas of progress with technological power. Enterprise Asset Management has embraced transformative technology like the Internet of Things (IoT) and the ethereal realm of artificial intelligence.
The sacred sensors of this ethereal realm have been used to ingeniously acquire real-time data on the captivating performance of varied assets, making IoT crucial. In perfect harmony, AI algorithms, fearsome in their prowess, study this treasure trove of data, audaciously looking into the hidden fabric of time itself, unfurling prophetic insights that delicately forecast the hour of reckoning, heralding maintenance, or repairs.
In a similar vein, synergistic advancements have given birth to the sublime fusion of enterprise asset management software and the ubiquitous realm of enterprise resource planning (ERP) systems, artfully unveiling new vistas of integrated efficiency, while the omnipotent mantle of mobile applications has democratized the pursuit of asset management, empowering users to wield the might of enterprise asset management in the palm of their hands as they traverse uncharted territory.
Driving factors
Demand Rising EAM Optimizes Assets
The EAM market is driven by asset maintenance and repair. As enterprises aim to optimize their operations, they realize the necessity of asset maintenance. This has led to a spike in demand for EAM solutions that can help enterprises track the health of their assets and schedule maintenance and repairs in advance.
Tech-Driven Growth IoT, AI, and EAM Solutions
Increasing reliance on modern technologies drives the EAM market. Enterprises are turning to new technologies like IoT and AI to better manage their assets as they compete to remain ahead of the competition. This has led to a rise in demand for EAM solutions that integrate with these technologies and analyze real-time data. EAM market growth is also driven by demand for optimized asset use. EAM solutions help companies maximize their assets.
Flexibility, Efficiency Cloud-Based EAM Solutions Soar
The EAM market is also adopting cloud-based solutions. Cloud-based EAM solutions are flexible, scalable, and user-friendly, which enterprises want. They offer decreased infrastructure expenses and data access from anywhere, anytime. Finally, IoT and AI in asset management are driving EAM market innovation. These technologies help enterprises manage their assets more efficiently and proactively, improving asset uptime, maintenance costs, and operational efficiency.
IoT & AI Transform EAM Market
No major regulatory changes are expected in the EAM market. However, data privacy and security restrictions can impact cloud-based EAM solutions. Blockchain technology could impact the EAM market by easing asset management and data security. It may produce a tamper-proof asset history, maintenance, and ownership record for all stakeholders.
Self-Service Adaptation EAM Solutions Rise
Startups and fresh entrants with unique solutions can disrupt markets. Disruptors can compel incumbents to adjust to market changes. Consumers are favoring self-service solutions that offer more control and visibility into asset management operations. EAM solutions that offer a user-friendly interface and self-service will certainly become more popular.
Restraining Factors
IT Challenges
Limited IT resources are a major enterprise asset management concern for businesses. Most organizations in this industry have obsolete technology, insufficient staff, or lack the necessary experience. This might make it difficult to implement asset management solutions, leading to lost production and profitability. To overcome this difficulty, businesses need to identify their IT limitations and choose the best solutions for them. IoT, cloud, and AI can automate asset management and reduce IT workload.
Cost-Effective Asset Management
Enterprise asset management solutions are also expensive to implement and maintain. To implement needed solutions, businesses must invest in infrastructure, equipment, software, and employees. Businesses need to analyze their vendor options in order to reduce expenses and choose a solution that meets their budget and operational needs. Cloud-based solutions simply need an internet connection and reduce hardware and maintenance costs, making them cost-effective.
Overcoming Change Resistance
Any organization introducing a new system or procedure faces resistance to change. Enterprise asset management solutions follow the same pattern. Senior management to frontline staff may resist. Businesses must identify the fundamental cause of resistance and communicate the benefits of the new system to all employees in order to overcome resistance. Change management methods like training and incentives can overcome resistance and boost acceptance.
Managing Assets
Enterprise asset management is a complex business with many stakeholders, including manufacturers, asset managers, and customers. A lack of consistency across various stakeholders can make asset management difficult, leading to inefficiency and productivity loss. Businesses need an SOP to standardize processes across all stakeholders. The SOP should explain asset management operations, including data management and regulatory compliance.
Integrating Data
It can be complex and time-consuming to integrate new enterprise asset management solutions with an existing system. Most organizations have outdated systems. This can make it difficult to maintain data accuracy and reduce asset management efficiency. Businesses should select enterprise asset management solutions that offer data integration with existing systems in order to overcome this challenge. Modern cloud-based solutions make data integration and management easier.
Applications Analysis
The predictive maintenance segment is the dominant force in the enterprise asset management market. Predictive analytics that predicts equipment failure and saves downtime are driving predictive maintenance. Predictive maintenance helps plant managers avoid problems and save money.
Rapid economic growth drives predictive maintenance in emerging economies. Asset management is needed when firms grow and use new technology. Equipment downtime can cost manufacturers and transporters a lot of money.
Consumer trends and behaviors are helping the predictive maintenance segment flourish. Predictive maintenance helps organizations satisfy customer demand for predictability. Predictive maintenance technology helps customers stand out.
Due to its capacity to save costs and increase efficiency, the predictive maintenance segment is expected to grow at the fastest rate in the future years. Predictive maintenance is predicted to grow in the enterprise asset management market due to the Internet of Things (IoT) and the deployment of machine learning technology.
Deployment Models Analysis
The cloud deployment model is dominant in the enterprise asset management market. Deployment of enterprise asset management solutions via cloud services reduces hardware costs, improves scalability, and simplifies information access. Cloud deployment speeds implementation and improves data backup and recovery.
Emerging economies need cost-effective and scalable technological solutions, driving cloud deployment paradigms. Cloud deployment options allow transportation, industrial, and logistics organizations to grow without IT infrastructure costs.
The expansion of cloud deployment strategies is also influenced by consumer trends and behaviors. Businesses need efficient data management and storage as data volumes rise. Cloud deployment approaches provide secure, efficient data storage and global access.
Due to its affordability and scalability, cloud deployment is expected to rise fastest. Businesses in the enterprise asset management market are finding cloud deployment strategies trustworthy and efficient.
Verticals Analysis
In the enterprise asset management market, the transportation and logistics segment is dominant. Transportation and logistics depend on efficient asset management. Asset management reduces operational costs and downtime, improving efficiency and customer satisfaction.
Enterprise asset management solutions in emerging economies are driven by optimization and efficiency. Rapid economic growth in emerging economies is making the transportation and logistics industry more competitive, requiring businesses to find innovative methods to cut costs and boost efficiency.
Enterprise asset management systems are being adopted in the transportation and logistics sector due to consumer trends and behaviors. E-commerce and the desire for rapid, dependable delivery services are driving organizations to improve asset management and reduce downtime. Enterprise asset management solutions optimize operations and meet consumer demands.
Due to the need for efficient and cost-effective asset management, the transportation and logistics segment is expected to grow the fastest. E-commerce and autonomous vehicles are boosting the transportation and logistics industry. Enterprise asset management solutions are essential to this industry's success.
Key Market Segments
By Applications Analysis
- Predictive Maintenance
- Asset Lifecycle Management
- Inventory Management
- Work Order Managenent
- Labor Management
- Others
By Deployment Models Analysis
- On-premise
- Cloud
By Verticals Analysis
- Transportation and Logistics
- IT and Telecom
- Healthcare and Life Sciences
- Manufacturing
- Government and Defence
- Energy and Utilities
- Others
Growth Opportunity
Cloud-Based EAM Solutions Transform Asset Management
Cloud-based EAM solutions for remote management and scalability fuel enterprise asset management market growth. Machine learning-based predictive maintenance technologies, Real-time asset monitoring with IoT devices Blockchain for safe asset monitoring and data sharing EAM solutions expansion into new markets.
EAM Predictive Maintenance Uses Machine Learning
EAM manages a company's physical and digital assets. These assets include manufacturing equipment, facilities, and software. EAM optimizes these assets' use, maintenance, and disposal to boost firm efficiency and profitability.
Real-Time Asset Monitoring Improves EAM
In recent years, the EAM market has seen tremendous growth, driven by a number of factors. Cloud-based EAM solutions have spurred growth. These solutions provide remote management and scalability, making it easier for companies to manage assets worldwide. Cloud-based EAM solutions have a number of advantages, including cheaper costs, higher efficiency, and enhanced data security.
Blockchain Secures EAM Asset Tracking
The adoption of predictive maintenance systems backed by machine learning algorithms has driven EAM market growth. These solutions help companies predict equipment failure and arrange maintenance before it breaks down. This saves downtime, equipment life, and maintenance expenses.
Emerging Markets for EAM
EAM market growth is also driven by real-time asset performance monitoring with IoT devices. IoT devices track equipment performance and offer real-time data. This data helps companies improve maintenance schedules and spot possible problems before they become serious concerns.
EAM Market Grows Exponentially
The adoption of blockchain technology for secure asset tracking and data exchange has also driven EAM market growth. Blockchain provides a secure, distributed record for asset ownership and maintenance tracking. This can help companies in compliance-driven industries.
Latest Trends
EAM Solutions Improve Efficiency
For businesses aiming to improve operational efficiency, save costs, and boost profits, enterprise asset management (EAM) has become essential. The adoption of EAM solutions has become essential for businesses across industries due to the increasing complexity of industrial equipment and the increasing need to offer maximum performance.
Optimizing Industrial Assets APM Integration
Asset performance management (APM) has gained popularity among businesses seeking to improve the performance of their industrial assets. APM solutions monitor asset health, predict breakdowns, and prevent maintenance issues using advanced analytics and machine learning. APM solutions have become essential to EAM plans due to the increasing requirement for data-driven decision-making.
Asset Maintenance and Regulation
To protect workers and the public, governments worldwide have tightened asset maintenance requirements in recent years. With the increasing emphasis on compliance, businesses must develop maintenance practices. Failure to follow these rules might result in heavy fines and reputational damage.
Green Asset Management EAM's Role
Sustainable solutions are in demand in today's fast-paced society. By identifying inefficiencies, increasing asset use, and decreasing energy waste, EAM solutions can boost energy efficiency. Businesses may cut carbon emissions and improve revenue by deploying energy-efficient solutions.
Enterprise Asset Management Insights
Today's businesses use real-time data, including EAM. Asset management requires real-time asset health, consumption, and efficiency data. Real-time data analytics and reporting in EAM solutions provide businesses an edge. Real-time data helps businesses make informed decisions, prevent maintenance issues, and enhance asset utilization.
EAM Mobile Revolution
Mobile technology has transformed businesses, including EAM. Maintenance technicians may now access asset information, execute maintenance activities, and update asset records while on the road thanks to the adoption of mobile apps and technology. This improved asset dependability, efficiency, and downtime.
Regional Analysis
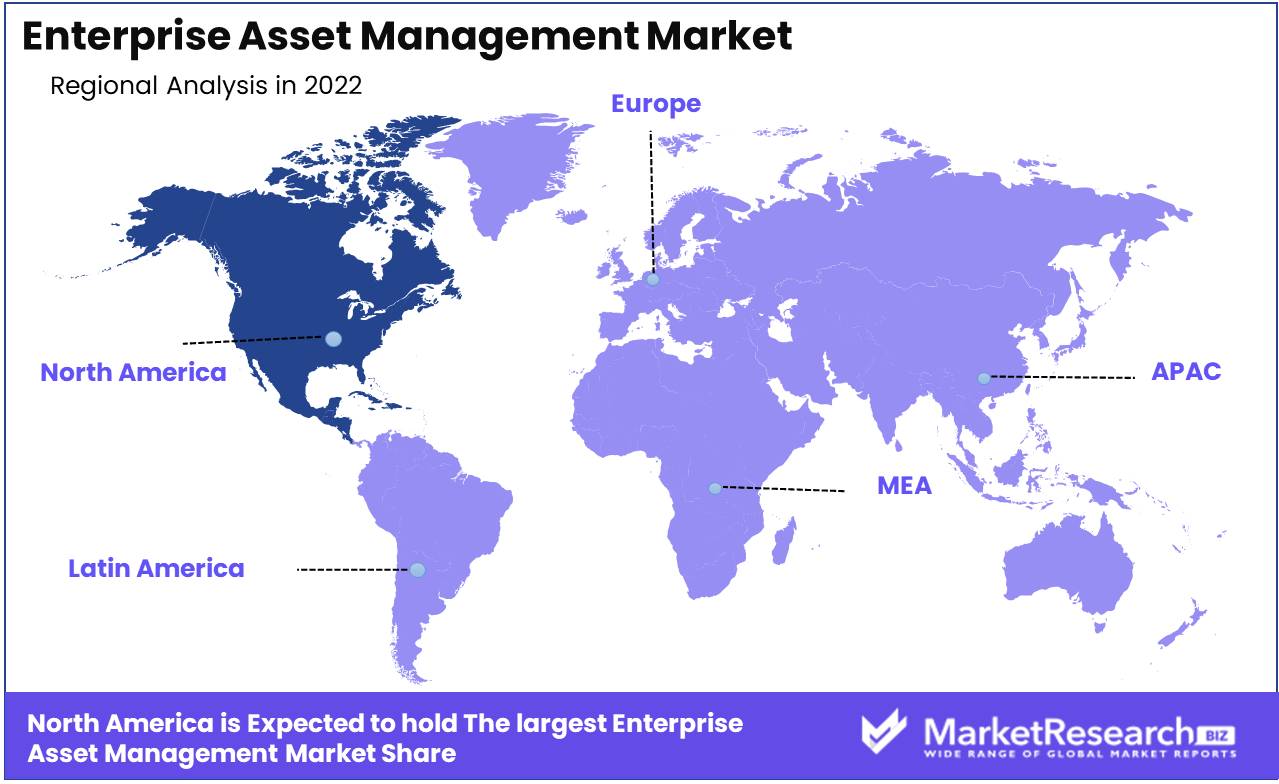
North America's dominance in the Enterprise Asset Management (EAM) market is due to various factors. Innovation and modern technology are hallmarks of North America. Using IoT, AI, ML, and cloud computing, the region has pioneered cutting-edge EAM solutions. In the EAM market, North American enterprises have a technological advantage.
North America has well-established manufacturing, oil and gas, utilities, transportation, and healthcare industries. These industries have large, complex asset portfolios, needing comprehensive EAM solutions to improve asset performance, maintenance, and lifecycle management. North America's large-scale operations and asset-intensive industries necessitate EAM solutions.
North America has strict regulatory frameworks and compliance standards, especially in healthcare (HIPAA), utilities (NERC CIP), and environmental (EPA) industries. EAM solutions ensure correct paperwork, maintenance history, safety practices, and audits to meet these laws. North America adopts EAM solutions for regulatory compliance.
North American companies prioritize operational efficiency and cost reductions. EAM systems improve asset management, preventative maintenance, downtime, and asset lifespan. North American organizations can boost production and cut costs by increasing asset usage and reducing operational disruptions.
EAM software companies, system integrators, and service providers dominate the North American market. This competitive landscape encourages innovation, market expansion, and EAM solutions for various industries and organizations. Numerous skilled vendors help North America dominate the EAM market.
North America adopted cloud-based EAM solutions early. Cloud computing enables asset data centralization, remote access, and real-time monitoring and analysis. North American cloud-based EAM solutions have propelled asset management digitalization.
Key Regions and Countries
North America
- US
- Canada
- Mexico
Western Europe
- Germany
- France
- The UK
- Spain
- Italy
- Portugal
- Ireland
- Austria
- Switzerland
- Benelux
- Nordic
- Rest of Western Europe
Eastern Europe
- Russia
- Poland
- The Czech Republic
- Greece
- Rest of Eastern Europe
APAC
- China
- Japan
- South Korea
- India
- Australia & New Zealand
- Indonesia
- Malaysia
- Philippines
- Singapore
- Thailand
- Vietnam
- Rest of APAC
Latin America
- Brazil
- Colombia
- Chile
- Argentina
- Costa Rica
- Rest of Latin America
Middle East & Africa
- Algeria
- Egypt
- Israel
- Kuwait
- Nigeria
- Saudi Arabia
- South Africa
- Turkey
- United Arab Emirates
- Rest of MEA
Key Players Analysis
Key players in the EAM market innovate and introduce innovative solutions to meet consumers' changing needs. IBM, Oracle, SAP, Infor, and ABB are industry leaders. These organizations have developed a significant presence in the EAM market by offering a broad suite of solutions that meet the different demands of businesses.
IBM's EAM solution enables enterprises to streamline asset management operations while saving expenses. Maximo Asset Management software provides real-time visibility into an asset's performance and enables proactive asset maintenance.
Oracle's powerful EAM solution helps businesses cut maintenance costs and optimize asset lifecycles. Asset Lifecycle Management (ALM) features asset tracking, work order management, and maintenance planning.
SAP, a leading business software provider, offers an EAM solution that integrates with its ERP and CRM systems. The company's Intelligent Asset Management suite enables predictive maintenance and real-time asset visibility.
The cloud-based Infor EAM solution includes asset tracking, work order management, and maintenance planning. The company's EAM suite scales and adapts to businesses' changing demands.
ABB's powerful EAM solution integrates with its other automation systems. Asset Suite EAM software from the company delivers real-time insights into asset performance and enables predictive maintenance to avert breakdowns.
Top Key Players in Enterprise Asset Management Market
- Oracle
- IBM
- SAP
- IFS
- ABB
- Infor
- CGI
- Aptean
- Maintenance Connection
- IPS
- AssetWorks
- AVEVA
Recent Development
- In October 2022, By introducing a new asset-based service solution as part of its Oracle Fusion Cloud Applications Suite Oracle made a significant advancement in the enterprise asset management space.
- In September 2022, IBM made a significant announcement that it had acquired Dialexa, a US-based digital product engineering company.
- In February 2021, By introducing the SAP Learning HubSAP made a significant effort to support its partners.
Report Scope:
Report Features Description Market Value (2022) USD 3.6 Bn Forecast Revenue (2032) USD 9.1 Bn CAGR (2023-2032) 9.8% Base Year for Estimation 2022 Historic Period 2016-2022 Forecast Period 2023-2032 Report Coverage Revenue Forecast, Market Dynamics, COVID-19 Impact, Competitive Landscape, Recent Developments Segments Covered By Applications Analysis (Predictive Maintenance, Asset Lifecycle Management, Inventory Management, Work Order management, Labor Management, Others), By Deployment Models Analysis (On-premise, Cloud), By Verticals Analysis (Transportation and Logistics, IT and Telecom, Healthcare and Life Sciences, Manufacturing, Government and Defence, Energy, and Utilities, Others) Regional Analysis North America – The US, Canada, & Mexico; Western Europe – Germany, France, The UK, Spain, Italy, Portugal, Ireland, Austria, Switzerland, Benelux, Nordic, & Rest of Western Europe; Eastern Europe – Russia, Poland, The Czech Republic, Greece, & Rest of Eastern Europe; APAC – China, Japan, South Korea, India, Australia & New Zealand, Indonesia, Malaysia, Philippines, Singapore, Thailand, Vietnam, & Rest of APAC; Latin America – Brazil, Colombia, Chile, Argentina, Costa Rica, & Rest of Latin America; Middle East & Africa – Algeria, Egypt, Israel, Kuwait, Nigeria, Saudi Arabia, South Africa, Turkey, United Arab Emirates, & Rest of MEA Competitive Landscape Oracle, IBM, SAP, IFS, ABB, Infor, CGI, Aptean, Maintenance Connection, IPS, AssetWorks, AVEVA Customization Scope Customization for segments, region/country-level will be provided. Moreover, additional customization can be done based on the requirements. Purchase Options We have three licenses to opt for: Single User License, Multi-User License (Up to 5 Users), Corporate Use License (Unlimited User and Printable PDF) -
- 1. Executive Summary
- 1.1. Definition
- 1.2. Taxonomy
- 1.3. Research Scope
- 1.4. Key Analysis
- 1.5. Key Findings by Major Segments
- 1.6. Top strategies by Major Players
- 2. Global Enterprise Asset Management Market Overview
- 2.1. Enterprise Asset Management Market Dynamics
- 2.1.1. Drivers
- 2.1.2. Opportunities
- 2.1.3. Restraints
- 2.1.4. Challenges
- 2.2. Macro-economic Factors
- 2.3. Regulatory Framework
- 2.4. Market Investment Feasibility Index
- 2.5. PEST Analysis
- 2.6. PORTER’S Five Force Analysis
- 2.7. Drivers & Restraints Impact Analysis
- 2.8. Industry Chain Analysis
- 2.9. Cost Structure Analysis
- 2.10. Marketing Strategy
- 2.11. Russia-Ukraine War Impact Analysis
- 2.12. Opportunity Map Analysis
- 2.13. Market Competition Scenario Analysis
- 2.14. Product Life Cycle Analysis
- 2.15. Opportunity Orbits
- 2.16. Manufacturer Intensity Map
- 2.17. Major Companies sales by Value & Volume
- 2.1. Enterprise Asset Management Market Dynamics
- 3. Global Enterprise Asset Management Market Analysis, Opportunity and Forecast, 2016-2032
- 3.1. Global Enterprise Asset Management Market Analysis, 2016-2021
- 3.2. Global Enterprise Asset Management Market Opportunity and Forecast, 2023-2032
- 3.3. Global Enterprise Asset Management Market Analysis, Opportunity and Forecast, By By Applications Analysis, 2016-2032
- 3.3.1. Global Enterprise Asset Management Market Analysis by By Applications Analysis: Introduction
- 3.3.2. Market Size Absolute $ Opportunity Analysis and Forecast, By By Applications Analysis, 2016-2032
- 3.3.3. Predictive Maintenance
- 3.3.4. Asset Lifecycle Management
- 3.3.5. Inventory Management
- 3.3.6. Work Order Managenent
- 3.3.7. Labor Management
- 3.3.8. Others
- 3.4. Global Enterprise Asset Management Market Analysis, Opportunity and Forecast, By By Deployment Models Analysis, 2016-2032
- 3.4.1. Global Enterprise Asset Management Market Analysis by By Deployment Models Analysis: Introduction
- 3.4.2. Market Size Absolute $ Opportunity Analysis and Forecast, By By Deployment Models Analysis, 2016-2032
- 3.4.3. On-premise
- 3.4.4. Cloud
- 3.5. Global Enterprise Asset Management Market Analysis, Opportunity and Forecast, By By Verticals Analysis, 2016-2032
- 3.5.1. Global Enterprise Asset Management Market Analysis by By Verticals Analysis: Introduction
- 3.5.2. Market Size Absolute $ Opportunity Analysis and Forecast, By By Verticals Analysis, 2016-2032
- 3.5.3. Transportation and Logistics
- 3.5.4. IT and Telecom
- 3.5.5. Healthcare and Life Sciences
- 3.5.6. Manufacturing
- 3.5.7. Government and Defence
- 3.5.8. Energy and Utilities
- 3.5.9. Others
- 4. North America Enterprise Asset Management Market Analysis, Opportunity and Forecast, 2016-2032
- 4.1. North America Enterprise Asset Management Market Analysis, 2016-2021
- 4.2. North America Enterprise Asset Management Market Opportunity and Forecast, 2023-2032
- 4.3. North America Enterprise Asset Management Market Analysis, Opportunity and Forecast, By By Applications Analysis, 2016-2032
- 4.3.1. North America Enterprise Asset Management Market Analysis by By Applications Analysis: Introduction
- 4.3.2. Market Size Absolute $ Opportunity Analysis and Forecast, By By Applications Analysis, 2016-2032
- 4.3.3. Predictive Maintenance
- 4.3.4. Asset Lifecycle Management
- 4.3.5. Inventory Management
- 4.3.6. Work Order Managenent
- 4.3.7. Labor Management
- 4.3.8. Others
- 4.4. North America Enterprise Asset Management Market Analysis, Opportunity and Forecast, By By Deployment Models Analysis, 2016-2032
- 4.4.1. North America Enterprise Asset Management Market Analysis by By Deployment Models Analysis: Introduction
- 4.4.2. Market Size Absolute $ Opportunity Analysis and Forecast, By By Deployment Models Analysis, 2016-2032
- 4.4.3. On-premise
- 4.4.4. Cloud
- 4.5. North America Enterprise Asset Management Market Analysis, Opportunity and Forecast, By By Verticals Analysis, 2016-2032
- 4.5.1. North America Enterprise Asset Management Market Analysis by By Verticals Analysis: Introduction
- 4.5.2. Market Size Absolute $ Opportunity Analysis and Forecast, By By Verticals Analysis, 2016-2032
- 4.5.3. Transportation and Logistics
- 4.5.4. IT and Telecom
- 4.5.5. Healthcare and Life Sciences
- 4.5.6. Manufacturing
- 4.5.7. Government and Defence
- 4.5.8. Energy and Utilities
- 4.5.9. Others
- 4.6. North America Enterprise Asset Management Market Analysis, Opportunity and Forecast, By Country , 2016-2032
- 4.6.1. North America Enterprise Asset Management Market Analysis by Country : Introduction
- 4.6.2. Market Size Absolute $ Opportunity Analysis and Forecast, Country , 2016-2032
- 4.6.2.1. The US
- 4.6.2.2. Canada
- 4.6.2.3. Mexico
- 5. Western Europe Enterprise Asset Management Market Analysis, Opportunity and Forecast, 2016-2032
- 5.1. Western Europe Enterprise Asset Management Market Analysis, 2016-2021
- 5.2. Western Europe Enterprise Asset Management Market Opportunity and Forecast, 2023-2032
- 5.3. Western Europe Enterprise Asset Management Market Analysis, Opportunity and Forecast, By By Applications Analysis, 2016-2032
- 5.3.1. Western Europe Enterprise Asset Management Market Analysis by By Applications Analysis: Introduction
- 5.3.2. Market Size Absolute $ Opportunity Analysis and Forecast, By By Applications Analysis, 2016-2032
- 5.3.3. Predictive Maintenance
- 5.3.4. Asset Lifecycle Management
- 5.3.5. Inventory Management
- 5.3.6. Work Order Managenent
- 5.3.7. Labor Management
- 5.3.8. Others
- 5.4. Western Europe Enterprise Asset Management Market Analysis, Opportunity and Forecast, By By Deployment Models Analysis, 2016-2032
- 5.4.1. Western Europe Enterprise Asset Management Market Analysis by By Deployment Models Analysis: Introduction
- 5.4.2. Market Size Absolute $ Opportunity Analysis and Forecast, By By Deployment Models Analysis, 2016-2032
- 5.4.3. On-premise
- 5.4.4. Cloud
- 5.5. Western Europe Enterprise Asset Management Market Analysis, Opportunity and Forecast, By By Verticals Analysis, 2016-2032
- 5.5.1. Western Europe Enterprise Asset Management Market Analysis by By Verticals Analysis: Introduction
- 5.5.2. Market Size Absolute $ Opportunity Analysis and Forecast, By By Verticals Analysis, 2016-2032
- 5.5.3. Transportation and Logistics
- 5.5.4. IT and Telecom
- 5.5.5. Healthcare and Life Sciences
- 5.5.6. Manufacturing
- 5.5.7. Government and Defence
- 5.5.8. Energy and Utilities
- 5.5.9. Others
- 5.6. Western Europe Enterprise Asset Management Market Analysis, Opportunity and Forecast, By Country , 2016-2032
- 5.6.1. Western Europe Enterprise Asset Management Market Analysis by Country : Introduction
- 5.6.2. Market Size Absolute $ Opportunity Analysis and Forecast, Country , 2016-2032
- 5.6.2.1. Germany
- 5.6.2.2. France
- 5.6.2.3. The UK
- 5.6.2.4. Spain
- 5.6.2.5. Italy
- 5.6.2.6. Portugal
- 5.6.2.7. Ireland
- 5.6.2.8. Austria
- 5.6.2.9. Switzerland
- 5.6.2.10. Benelux
- 5.6.2.11. Nordic
- 5.6.2.12. Rest of Western Europe
- 6. Eastern Europe Enterprise Asset Management Market Analysis, Opportunity and Forecast, 2016-2032
- 6.1. Eastern Europe Enterprise Asset Management Market Analysis, 2016-2021
- 6.2. Eastern Europe Enterprise Asset Management Market Opportunity and Forecast, 2023-2032
- 6.3. Eastern Europe Enterprise Asset Management Market Analysis, Opportunity and Forecast, By By Applications Analysis, 2016-2032
- 6.3.1. Eastern Europe Enterprise Asset Management Market Analysis by By Applications Analysis: Introduction
- 6.3.2. Market Size Absolute $ Opportunity Analysis and Forecast, By By Applications Analysis, 2016-2032
- 6.3.3. Predictive Maintenance
- 6.3.4. Asset Lifecycle Management
- 6.3.5. Inventory Management
- 6.3.6. Work Order Managenent
- 6.3.7. Labor Management
- 6.3.8. Others
- 6.4. Eastern Europe Enterprise Asset Management Market Analysis, Opportunity and Forecast, By By Deployment Models Analysis, 2016-2032
- 6.4.1. Eastern Europe Enterprise Asset Management Market Analysis by By Deployment Models Analysis: Introduction
- 6.4.2. Market Size Absolute $ Opportunity Analysis and Forecast, By By Deployment Models Analysis, 2016-2032
- 6.4.3. On-premise
- 6.4.4. Cloud
- 6.5. Eastern Europe Enterprise Asset Management Market Analysis, Opportunity and Forecast, By By Verticals Analysis, 2016-2032
- 6.5.1. Eastern Europe Enterprise Asset Management Market Analysis by By Verticals Analysis: Introduction
- 6.5.2. Market Size Absolute $ Opportunity Analysis and Forecast, By By Verticals Analysis, 2016-2032
- 6.5.3. Transportation and Logistics
- 6.5.4. IT and Telecom
- 6.5.5. Healthcare and Life Sciences
- 6.5.6. Manufacturing
- 6.5.7. Government and Defence
- 6.5.8. Energy and Utilities
- 6.5.9. Others
- 6.6. Eastern Europe Enterprise Asset Management Market Analysis, Opportunity and Forecast, By Country , 2016-2032
- 6.6.1. Eastern Europe Enterprise Asset Management Market Analysis by Country : Introduction
- 6.6.2. Market Size Absolute $ Opportunity Analysis and Forecast, Country , 2016-2032
- 6.6.2.1. Russia
- 6.6.2.2. Poland
- 6.6.2.3. The Czech Republic
- 6.6.2.4. Greece
- 6.6.2.5. Rest of Eastern Europe
- 7. APAC Enterprise Asset Management Market Analysis, Opportunity and Forecast, 2016-2032
- 7.1. APAC Enterprise Asset Management Market Analysis, 2016-2021
- 7.2. APAC Enterprise Asset Management Market Opportunity and Forecast, 2023-2032
- 7.3. APAC Enterprise Asset Management Market Analysis, Opportunity and Forecast, By By Applications Analysis, 2016-2032
- 7.3.1. APAC Enterprise Asset Management Market Analysis by By Applications Analysis: Introduction
- 7.3.2. Market Size Absolute $ Opportunity Analysis and Forecast, By By Applications Analysis, 2016-2032
- 7.3.3. Predictive Maintenance
- 7.3.4. Asset Lifecycle Management
- 7.3.5. Inventory Management
- 7.3.6. Work Order Managenent
- 7.3.7. Labor Management
- 7.3.8. Others
- 7.4. APAC Enterprise Asset Management Market Analysis, Opportunity and Forecast, By By Deployment Models Analysis, 2016-2032
- 7.4.1. APAC Enterprise Asset Management Market Analysis by By Deployment Models Analysis: Introduction
- 7.4.2. Market Size Absolute $ Opportunity Analysis and Forecast, By By Deployment Models Analysis, 2016-2032
- 7.4.3. On-premise
- 7.4.4. Cloud
- 7.5. APAC Enterprise Asset Management Market Analysis, Opportunity and Forecast, By By Verticals Analysis, 2016-2032
- 7.5.1. APAC Enterprise Asset Management Market Analysis by By Verticals Analysis: Introduction
- 7.5.2. Market Size Absolute $ Opportunity Analysis and Forecast, By By Verticals Analysis, 2016-2032
- 7.5.3. Transportation and Logistics
- 7.5.4. IT and Telecom
- 7.5.5. Healthcare and Life Sciences
- 7.5.6. Manufacturing
- 7.5.7. Government and Defence
- 7.5.8. Energy and Utilities
- 7.5.9. Others
- 7.6. APAC Enterprise Asset Management Market Analysis, Opportunity and Forecast, By Country , 2016-2032
- 7.6.1. APAC Enterprise Asset Management Market Analysis by Country : Introduction
- 7.6.2. Market Size Absolute $ Opportunity Analysis and Forecast, Country , 2016-2032
- 7.6.2.1. China
- 7.6.2.2. Japan
- 7.6.2.3. South Korea
- 7.6.2.4. India
- 7.6.2.5. Australia & New Zeland
- 7.6.2.6. Indonesia
- 7.6.2.7. Malaysia
- 7.6.2.8. Philippines
- 7.6.2.9. Singapore
- 7.6.2.10. Thailand
- 7.6.2.11. Vietnam
- 7.6.2.12. Rest of APAC
- 8. Latin America Enterprise Asset Management Market Analysis, Opportunity and Forecast, 2016-2032
- 8.1. Latin America Enterprise Asset Management Market Analysis, 2016-2021
- 8.2. Latin America Enterprise Asset Management Market Opportunity and Forecast, 2023-2032
- 8.3. Latin America Enterprise Asset Management Market Analysis, Opportunity and Forecast, By By Applications Analysis, 2016-2032
- 8.3.1. Latin America Enterprise Asset Management Market Analysis by By Applications Analysis: Introduction
- 8.3.2. Market Size Absolute $ Opportunity Analysis and Forecast, By By Applications Analysis, 2016-2032
- 8.3.3. Predictive Maintenance
- 8.3.4. Asset Lifecycle Management
- 8.3.5. Inventory Management
- 8.3.6. Work Order Managenent
- 8.3.7. Labor Management
- 8.3.8. Others
- 8.4. Latin America Enterprise Asset Management Market Analysis, Opportunity and Forecast, By By Deployment Models Analysis, 2016-2032
- 8.4.1. Latin America Enterprise Asset Management Market Analysis by By Deployment Models Analysis: Introduction
- 8.4.2. Market Size Absolute $ Opportunity Analysis and Forecast, By By Deployment Models Analysis, 2016-2032
- 8.4.3. On-premise
- 8.4.4. Cloud
- 8.5. Latin America Enterprise Asset Management Market Analysis, Opportunity and Forecast, By By Verticals Analysis, 2016-2032
- 8.5.1. Latin America Enterprise Asset Management Market Analysis by By Verticals Analysis: Introduction
- 8.5.2. Market Size Absolute $ Opportunity Analysis and Forecast, By By Verticals Analysis, 2016-2032
- 8.5.3. Transportation and Logistics
- 8.5.4. IT and Telecom
- 8.5.5. Healthcare and Life Sciences
- 8.5.6. Manufacturing
- 8.5.7. Government and Defence
- 8.5.8. Energy and Utilities
- 8.5.9. Others
- 8.6. Latin America Enterprise Asset Management Market Analysis, Opportunity and Forecast, By Country , 2016-2032
- 8.6.1. Latin America Enterprise Asset Management Market Analysis by Country : Introduction
- 8.6.2. Market Size Absolute $ Opportunity Analysis and Forecast, Country , 2016-2032
- 8.6.2.1. Brazil
- 8.6.2.2. Colombia
- 8.6.2.3. Chile
- 8.6.2.4. Argentina
- 8.6.2.5. Costa Rica
- 8.6.2.6. Rest of Latin America
- 9. Middle East & Africa Enterprise Asset Management Market Analysis, Opportunity and Forecast, 2016-2032
- 9.1. Middle East & Africa Enterprise Asset Management Market Analysis, 2016-2021
- 9.2. Middle East & Africa Enterprise Asset Management Market Opportunity and Forecast, 2023-2032
- 9.3. Middle East & Africa Enterprise Asset Management Market Analysis, Opportunity and Forecast, By By Applications Analysis, 2016-2032
- 9.3.1. Middle East & Africa Enterprise Asset Management Market Analysis by By Applications Analysis: Introduction
- 9.3.2. Market Size Absolute $ Opportunity Analysis and Forecast, By By Applications Analysis, 2016-2032
- 9.3.3. Predictive Maintenance
- 9.3.4. Asset Lifecycle Management
- 9.3.5. Inventory Management
- 9.3.6. Work Order Managenent
- 9.3.7. Labor Management
- 9.3.8. Others
- 9.4. Middle East & Africa Enterprise Asset Management Market Analysis, Opportunity and Forecast, By By Deployment Models Analysis, 2016-2032
- 9.4.1. Middle East & Africa Enterprise Asset Management Market Analysis by By Deployment Models Analysis: Introduction
- 9.4.2. Market Size Absolute $ Opportunity Analysis and Forecast, By By Deployment Models Analysis, 2016-2032
- 9.4.3. On-premise
- 9.4.4. Cloud
- 9.5. Middle East & Africa Enterprise Asset Management Market Analysis, Opportunity and Forecast, By By Verticals Analysis, 2016-2032
- 9.5.1. Middle East & Africa Enterprise Asset Management Market Analysis by By Verticals Analysis: Introduction
- 9.5.2. Market Size Absolute $ Opportunity Analysis and Forecast, By By Verticals Analysis, 2016-2032
- 9.5.3. Transportation and Logistics
- 9.5.4. IT and Telecom
- 9.5.5. Healthcare and Life Sciences
- 9.5.6. Manufacturing
- 9.5.7. Government and Defence
- 9.5.8. Energy and Utilities
- 9.5.9. Others
- 9.6. Middle East & Africa Enterprise Asset Management Market Analysis, Opportunity and Forecast, By Country , 2016-2032
- 9.6.1. Middle East & Africa Enterprise Asset Management Market Analysis by Country : Introduction
- 9.6.2. Market Size Absolute $ Opportunity Analysis and Forecast, Country , 2016-2032
- 9.6.2.1. Algeria
- 9.6.2.2. Egypt
- 9.6.2.3. Israel
- 9.6.2.4. Kuwait
- 9.6.2.5. Nigeria
- 9.6.2.6. Saudi Arabia
- 9.6.2.7. South Africa
- 9.6.2.8. Turkey
- 9.6.2.9. The UAE
- 9.6.2.10. Rest of MEA
- 10. Global Enterprise Asset Management Market Analysis, Opportunity and Forecast, By Region , 2016-2032
- 10.1. Global Enterprise Asset Management Market Analysis by Region : Introduction
- 10.2. Market Size Absolute $ Opportunity Analysis and Forecast, By Region , 2016-2032
- 10.2.1. North America
- 10.2.2. Western Europe
- 10.2.3. Eastern Europe
- 10.2.4. APAC
- 10.2.5. Latin America
- 10.2.6. Middle East & Africa
- 11. Global Enterprise Asset Management Market Competitive Landscape, Market Share Analysis, and Company Profiles
- 11.1. Market Share Analysis
- 11.2. Company Profiles
- 11.3. Oracle
- 11.3.1. Company Overview
- 11.3.2. Financial Highlights
- 11.3.3. Product Portfolio
- 11.3.4. SWOT Analysis
- 11.3.5. Key Strategies and Developments
- 11.4. IBM
- 11.4.1. Company Overview
- 11.4.2. Financial Highlights
- 11.4.3. Product Portfolio
- 11.4.4. SWOT Analysis
- 11.4.5. Key Strategies and Developments
- 11.5. SAP
- 11.5.1. Company Overview
- 11.5.2. Financial Highlights
- 11.5.3. Product Portfolio
- 11.5.4. SWOT Analysis
- 11.5.5. Key Strategies and Developments
- 11.6. IFS
- 11.6.1. Company Overview
- 11.6.2. Financial Highlights
- 11.6.3. Product Portfolio
- 11.6.4. SWOT Analysis
- 11.6.5. Key Strategies and Developments
- 11.7. ABB
- 11.7.1. Company Overview
- 11.7.2. Financial Highlights
- 11.7.3. Product Portfolio
- 11.7.4. SWOT Analysis
- 11.7.5. Key Strategies and Developments
- 11.8. Infor
- 11.8.1. Company Overview
- 11.8.2. Financial Highlights
- 11.8.3. Product Portfolio
- 11.8.4. SWOT Analysis
- 11.8.5. Key Strategies and Developments
- 11.9. CGI
- 11.9.1. Company Overview
- 11.9.2. Financial Highlights
- 11.9.3. Product Portfolio
- 11.9.4. SWOT Analysis
- 11.9.5. Key Strategies and Developments
- 11.10. Aptean
- 11.10.1. Company Overview
- 11.10.2. Financial Highlights
- 11.10.3. Product Portfolio
- 11.10.4. SWOT Analysis
- 11.10.5. Key Strategies and Developments
- 11.11. Maintenance Connection
- 11.11.1. Company Overview
- 11.11.2. Financial Highlights
- 11.11.3. Product Portfolio
- 11.11.4. SWOT Analysis
- 11.11.5. Key Strategies and Developments
- 11.12. IPS
- 11.12.1. Company Overview
- 11.12.2. Financial Highlights
- 11.12.3. Product Portfolio
- 11.12.4. SWOT Analysis
- 11.12.5. Key Strategies and Developments
- 11.13. AssetWorks
- 11.13.1. Company Overview
- 11.13.2. Financial Highlights
- 11.13.3. Product Portfolio
- 11.13.4. SWOT Analysis
- 11.13.5. Key Strategies and Developments
- 11.14. AVEVA
- 11.14.1. Company Overview
- 11.14.2. Financial Highlights
- 11.14.3. Product Portfolio
- 11.14.4. SWOT Analysis
- 11.14.5. Key Strategies and Developments
- 12. Assumptions and Acronyms
- 13. Research Methodology
- 14. Contact
List of Figures
-
- Figure 1: Global Enterprise Asset Management Market Revenue (US$ Mn) Market Share by By Applications Analysis in 2022
- Figure 2: Global Enterprise Asset Management Market Attractiveness Analysis by By Applications Analysis, 2016-2032
- Figure 3: Global Enterprise Asset Management Market Revenue (US$ Mn) Market Share by By Deployment Models Analysisin 2022
- Figure 4: Global Enterprise Asset Management Market Attractiveness Analysis by By Deployment Models Analysis, 2016-2032
- Figure 5: Global Enterprise Asset Management Market Revenue (US$ Mn) Market Share by By Verticals Analysisin 2022
- Figure 6: Global Enterprise Asset Management Market Attractiveness Analysis by By Verticals Analysis, 2016-2032
- Figure 7: Global Enterprise Asset Management Market Revenue (US$ Mn) Market Share by Region in 2022
- Figure 8: Global Enterprise Asset Management Market Attractiveness Analysis by Region, 2016-2032
- Figure 9: Global Enterprise Asset Management Market Revenue (US$ Mn) (2016-2032)
- Figure 10: Global Enterprise Asset Management Market Revenue (US$ Mn) Comparison by Region (2016-2032)
- Figure 11: Global Enterprise Asset Management Market Revenue (US$ Mn) Comparison by By Applications Analysis (2016-2032)
- Figure 12: Global Enterprise Asset Management Market Revenue (US$ Mn) Comparison by By Deployment Models Analysis (2016-2032)
- Figure 13: Global Enterprise Asset Management Market Revenue (US$ Mn) Comparison by By Verticals Analysis (2016-2032)
- Figure 14: Global Enterprise Asset Management Market Y-o-Y Growth Rate Comparison by Region (2016-2032)
- Figure 15: Global Enterprise Asset Management Market Y-o-Y Growth Rate Comparison by By Applications Analysis (2016-2032)
- Figure 16: Global Enterprise Asset Management Market Y-o-Y Growth Rate Comparison by By Deployment Models Analysis (2016-2032)
- Figure 17: Global Enterprise Asset Management Market Y-o-Y Growth Rate Comparison by By Verticals Analysis (2016-2032)
- Figure 18: Global Enterprise Asset Management Market Share Comparison by Region (2016-2032)
- Figure 19: Global Enterprise Asset Management Market Share Comparison by By Applications Analysis (2016-2032)
- Figure 20: Global Enterprise Asset Management Market Share Comparison by By Deployment Models Analysis (2016-2032)
- Figure 21: Global Enterprise Asset Management Market Share Comparison by By Verticals Analysis (2016-2032)
- Figure 22: North America Enterprise Asset Management Market Revenue (US$ Mn) Market Share by By Applications Analysisin 2022
- Figure 23: North America Enterprise Asset Management Market Attractiveness Analysis by By Applications Analysis, 2016-2032
- Figure 24: North America Enterprise Asset Management Market Revenue (US$ Mn) Market Share by By Deployment Models Analysisin 2022
- Figure 25: North America Enterprise Asset Management Market Attractiveness Analysis by By Deployment Models Analysis, 2016-2032
- Figure 26: North America Enterprise Asset Management Market Revenue (US$ Mn) Market Share by By Verticals Analysisin 2022
- Figure 27: North America Enterprise Asset Management Market Attractiveness Analysis by By Verticals Analysis, 2016-2032
- Figure 28: North America Enterprise Asset Management Market Revenue (US$ Mn) Market Share by Country in 2022
- Figure 29: North America Enterprise Asset Management Market Attractiveness Analysis by Country, 2016-2032
- Figure 30: North America Enterprise Asset Management Market Revenue (US$ Mn) (2016-2032)
- Figure 31: North America Enterprise Asset Management Market Revenue (US$ Mn) Comparison by Country (2016-2032)
- Figure 32: North America Enterprise Asset Management Market Revenue (US$ Mn) Comparison by By Applications Analysis (2016-2032)
- Figure 33: North America Enterprise Asset Management Market Revenue (US$ Mn) Comparison by By Deployment Models Analysis (2016-2032)
- Figure 34: North America Enterprise Asset Management Market Revenue (US$ Mn) Comparison by By Verticals Analysis (2016-2032)
- Figure 35: North America Enterprise Asset Management Market Y-o-Y Growth Rate Comparison by Country (2016-2032)
- Figure 36: North America Enterprise Asset Management Market Y-o-Y Growth Rate Comparison by By Applications Analysis (2016-2032)
- Figure 37: North America Enterprise Asset Management Market Y-o-Y Growth Rate Comparison by By Deployment Models Analysis (2016-2032)
- Figure 38: North America Enterprise Asset Management Market Y-o-Y Growth Rate Comparison by By Verticals Analysis (2016-2032)
- Figure 39: North America Enterprise Asset Management Market Share Comparison by Country (2016-2032)
- Figure 40: North America Enterprise Asset Management Market Share Comparison by By Applications Analysis (2016-2032)
- Figure 41: North America Enterprise Asset Management Market Share Comparison by By Deployment Models Analysis (2016-2032)
- Figure 42: North America Enterprise Asset Management Market Share Comparison by By Verticals Analysis (2016-2032)
- Figure 43: Western Europe Enterprise Asset Management Market Revenue (US$ Mn) Market Share by By Applications Analysisin 2022
- Figure 44: Western Europe Enterprise Asset Management Market Attractiveness Analysis by By Applications Analysis, 2016-2032
- Figure 45: Western Europe Enterprise Asset Management Market Revenue (US$ Mn) Market Share by By Deployment Models Analysisin 2022
- Figure 46: Western Europe Enterprise Asset Management Market Attractiveness Analysis by By Deployment Models Analysis, 2016-2032
- Figure 47: Western Europe Enterprise Asset Management Market Revenue (US$ Mn) Market Share by By Verticals Analysisin 2022
- Figure 48: Western Europe Enterprise Asset Management Market Attractiveness Analysis by By Verticals Analysis, 2016-2032
- Figure 49: Western Europe Enterprise Asset Management Market Revenue (US$ Mn) Market Share by Country in 2022
- Figure 50: Western Europe Enterprise Asset Management Market Attractiveness Analysis by Country, 2016-2032
- Figure 51: Western Europe Enterprise Asset Management Market Revenue (US$ Mn) (2016-2032)
- Figure 52: Western Europe Enterprise Asset Management Market Revenue (US$ Mn) Comparison by Country (2016-2032)
- Figure 53: Western Europe Enterprise Asset Management Market Revenue (US$ Mn) Comparison by By Applications Analysis (2016-2032)
- Figure 54: Western Europe Enterprise Asset Management Market Revenue (US$ Mn) Comparison by By Deployment Models Analysis (2016-2032)
- Figure 55: Western Europe Enterprise Asset Management Market Revenue (US$ Mn) Comparison by By Verticals Analysis (2016-2032)
- Figure 56: Western Europe Enterprise Asset Management Market Y-o-Y Growth Rate Comparison by Country (2016-2032)
- Figure 57: Western Europe Enterprise Asset Management Market Y-o-Y Growth Rate Comparison by By Applications Analysis (2016-2032)
- Figure 58: Western Europe Enterprise Asset Management Market Y-o-Y Growth Rate Comparison by By Deployment Models Analysis (2016-2032)
- Figure 59: Western Europe Enterprise Asset Management Market Y-o-Y Growth Rate Comparison by By Verticals Analysis (2016-2032)
- Figure 60: Western Europe Enterprise Asset Management Market Share Comparison by Country (2016-2032)
- Figure 61: Western Europe Enterprise Asset Management Market Share Comparison by By Applications Analysis (2016-2032)
- Figure 62: Western Europe Enterprise Asset Management Market Share Comparison by By Deployment Models Analysis (2016-2032)
- Figure 63: Western Europe Enterprise Asset Management Market Share Comparison by By Verticals Analysis (2016-2032)
- Figure 64: Eastern Europe Enterprise Asset Management Market Revenue (US$ Mn) Market Share by By Applications Analysisin 2022
- Figure 65: Eastern Europe Enterprise Asset Management Market Attractiveness Analysis by By Applications Analysis, 2016-2032
- Figure 66: Eastern Europe Enterprise Asset Management Market Revenue (US$ Mn) Market Share by By Deployment Models Analysisin 2022
- Figure 67: Eastern Europe Enterprise Asset Management Market Attractiveness Analysis by By Deployment Models Analysis, 2016-2032
- Figure 68: Eastern Europe Enterprise Asset Management Market Revenue (US$ Mn) Market Share by By Verticals Analysisin 2022
- Figure 69: Eastern Europe Enterprise Asset Management Market Attractiveness Analysis by By Verticals Analysis, 2016-2032
- Figure 70: Eastern Europe Enterprise Asset Management Market Revenue (US$ Mn) Market Share by Country in 2022
- Figure 71: Eastern Europe Enterprise Asset Management Market Attractiveness Analysis by Country, 2016-2032
- Figure 72: Eastern Europe Enterprise Asset Management Market Revenue (US$ Mn) (2016-2032)
- Figure 73: Eastern Europe Enterprise Asset Management Market Revenue (US$ Mn) Comparison by Country (2016-2032)
- Figure 74: Eastern Europe Enterprise Asset Management Market Revenue (US$ Mn) Comparison by By Applications Analysis (2016-2032)
- Figure 75: Eastern Europe Enterprise Asset Management Market Revenue (US$ Mn) Comparison by By Deployment Models Analysis (2016-2032)
- Figure 76: Eastern Europe Enterprise Asset Management Market Revenue (US$ Mn) Comparison by By Verticals Analysis (2016-2032)
- Figure 77: Eastern Europe Enterprise Asset Management Market Y-o-Y Growth Rate Comparison by Country (2016-2032)
- Figure 78: Eastern Europe Enterprise Asset Management Market Y-o-Y Growth Rate Comparison by By Applications Analysis (2016-2032)
- Figure 79: Eastern Europe Enterprise Asset Management Market Y-o-Y Growth Rate Comparison by By Deployment Models Analysis (2016-2032)
- Figure 80: Eastern Europe Enterprise Asset Management Market Y-o-Y Growth Rate Comparison by By Verticals Analysis (2016-2032)
- Figure 81: Eastern Europe Enterprise Asset Management Market Share Comparison by Country (2016-2032)
- Figure 82: Eastern Europe Enterprise Asset Management Market Share Comparison by By Applications Analysis (2016-2032)
- Figure 83: Eastern Europe Enterprise Asset Management Market Share Comparison by By Deployment Models Analysis (2016-2032)
- Figure 84: Eastern Europe Enterprise Asset Management Market Share Comparison by By Verticals Analysis (2016-2032)
- Figure 85: APAC Enterprise Asset Management Market Revenue (US$ Mn) Market Share by By Applications Analysisin 2022
- Figure 86: APAC Enterprise Asset Management Market Attractiveness Analysis by By Applications Analysis, 2016-2032
- Figure 87: APAC Enterprise Asset Management Market Revenue (US$ Mn) Market Share by By Deployment Models Analysisin 2022
- Figure 88: APAC Enterprise Asset Management Market Attractiveness Analysis by By Deployment Models Analysis, 2016-2032
- Figure 89: APAC Enterprise Asset Management Market Revenue (US$ Mn) Market Share by By Verticals Analysisin 2022
- Figure 90: APAC Enterprise Asset Management Market Attractiveness Analysis by By Verticals Analysis, 2016-2032
- Figure 91: APAC Enterprise Asset Management Market Revenue (US$ Mn) Market Share by Country in 2022
- Figure 92: APAC Enterprise Asset Management Market Attractiveness Analysis by Country, 2016-2032
- Figure 93: APAC Enterprise Asset Management Market Revenue (US$ Mn) (2016-2032)
- Figure 94: APAC Enterprise Asset Management Market Revenue (US$ Mn) Comparison by Country (2016-2032)
- Figure 95: APAC Enterprise Asset Management Market Revenue (US$ Mn) Comparison by By Applications Analysis (2016-2032)
- Figure 96: APAC Enterprise Asset Management Market Revenue (US$ Mn) Comparison by By Deployment Models Analysis (2016-2032)
- Figure 97: APAC Enterprise Asset Management Market Revenue (US$ Mn) Comparison by By Verticals Analysis (2016-2032)
- Figure 98: APAC Enterprise Asset Management Market Y-o-Y Growth Rate Comparison by Country (2016-2032)
- Figure 99: APAC Enterprise Asset Management Market Y-o-Y Growth Rate Comparison by By Applications Analysis (2016-2032)
- Figure 100: APAC Enterprise Asset Management Market Y-o-Y Growth Rate Comparison by By Deployment Models Analysis (2016-2032)
- Figure 101: APAC Enterprise Asset Management Market Y-o-Y Growth Rate Comparison by By Verticals Analysis (2016-2032)
- Figure 102: APAC Enterprise Asset Management Market Share Comparison by Country (2016-2032)
- Figure 103: APAC Enterprise Asset Management Market Share Comparison by By Applications Analysis (2016-2032)
- Figure 104: APAC Enterprise Asset Management Market Share Comparison by By Deployment Models Analysis (2016-2032)
- Figure 105: APAC Enterprise Asset Management Market Share Comparison by By Verticals Analysis (2016-2032)
- Figure 106: Latin America Enterprise Asset Management Market Revenue (US$ Mn) Market Share by By Applications Analysisin 2022
- Figure 107: Latin America Enterprise Asset Management Market Attractiveness Analysis by By Applications Analysis, 2016-2032
- Figure 108: Latin America Enterprise Asset Management Market Revenue (US$ Mn) Market Share by By Deployment Models Analysisin 2022
- Figure 109: Latin America Enterprise Asset Management Market Attractiveness Analysis by By Deployment Models Analysis, 2016-2032
- Figure 110: Latin America Enterprise Asset Management Market Revenue (US$ Mn) Market Share by By Verticals Analysisin 2022
- Figure 111: Latin America Enterprise Asset Management Market Attractiveness Analysis by By Verticals Analysis, 2016-2032
- Figure 112: Latin America Enterprise Asset Management Market Revenue (US$ Mn) Market Share by Country in 2022
- Figure 113: Latin America Enterprise Asset Management Market Attractiveness Analysis by Country, 2016-2032
- Figure 114: Latin America Enterprise Asset Management Market Revenue (US$ Mn) (2016-2032)
- Figure 115: Latin America Enterprise Asset Management Market Revenue (US$ Mn) Comparison by Country (2016-2032)
- Figure 116: Latin America Enterprise Asset Management Market Revenue (US$ Mn) Comparison by By Applications Analysis (2016-2032)
- Figure 117: Latin America Enterprise Asset Management Market Revenue (US$ Mn) Comparison by By Deployment Models Analysis (2016-2032)
- Figure 118: Latin America Enterprise Asset Management Market Revenue (US$ Mn) Comparison by By Verticals Analysis (2016-2032)
- Figure 119: Latin America Enterprise Asset Management Market Y-o-Y Growth Rate Comparison by Country (2016-2032)
- Figure 120: Latin America Enterprise Asset Management Market Y-o-Y Growth Rate Comparison by By Applications Analysis (2016-2032)
- Figure 121: Latin America Enterprise Asset Management Market Y-o-Y Growth Rate Comparison by By Deployment Models Analysis (2016-2032)
- Figure 122: Latin America Enterprise Asset Management Market Y-o-Y Growth Rate Comparison by By Verticals Analysis (2016-2032)
- Figure 123: Latin America Enterprise Asset Management Market Share Comparison by Country (2016-2032)
- Figure 124: Latin America Enterprise Asset Management Market Share Comparison by By Applications Analysis (2016-2032)
- Figure 125: Latin America Enterprise Asset Management Market Share Comparison by By Deployment Models Analysis (2016-2032)
- Figure 126: Latin America Enterprise Asset Management Market Share Comparison by By Verticals Analysis (2016-2032)
- Figure 127: Middle East & Africa Enterprise Asset Management Market Revenue (US$ Mn) Market Share by By Applications Analysisin 2022
- Figure 128: Middle East & Africa Enterprise Asset Management Market Attractiveness Analysis by By Applications Analysis, 2016-2032
- Figure 129: Middle East & Africa Enterprise Asset Management Market Revenue (US$ Mn) Market Share by By Deployment Models Analysisin 2022
- Figure 130: Middle East & Africa Enterprise Asset Management Market Attractiveness Analysis by By Deployment Models Analysis, 2016-2032
- Figure 131: Middle East & Africa Enterprise Asset Management Market Revenue (US$ Mn) Market Share by By Verticals Analysisin 2022
- Figure 132: Middle East & Africa Enterprise Asset Management Market Attractiveness Analysis by By Verticals Analysis, 2016-2032
- Figure 133: Middle East & Africa Enterprise Asset Management Market Revenue (US$ Mn) Market Share by Country in 2022
- Figure 134: Middle East & Africa Enterprise Asset Management Market Attractiveness Analysis by Country, 2016-2032
- Figure 135: Middle East & Africa Enterprise Asset Management Market Revenue (US$ Mn) (2016-2032)
- Figure 136: Middle East & Africa Enterprise Asset Management Market Revenue (US$ Mn) Comparison by Country (2016-2032)
- Figure 137: Middle East & Africa Enterprise Asset Management Market Revenue (US$ Mn) Comparison by By Applications Analysis (2016-2032)
- Figure 138: Middle East & Africa Enterprise Asset Management Market Revenue (US$ Mn) Comparison by By Deployment Models Analysis (2016-2032)
- Figure 139: Middle East & Africa Enterprise Asset Management Market Revenue (US$ Mn) Comparison by By Verticals Analysis (2016-2032)
- Figure 140: Middle East & Africa Enterprise Asset Management Market Y-o-Y Growth Rate Comparison by Country (2016-2032)
- Figure 141: Middle East & Africa Enterprise Asset Management Market Y-o-Y Growth Rate Comparison by By Applications Analysis (2016-2032)
- Figure 142: Middle East & Africa Enterprise Asset Management Market Y-o-Y Growth Rate Comparison by By Deployment Models Analysis (2016-2032)
- Figure 143: Middle East & Africa Enterprise Asset Management Market Y-o-Y Growth Rate Comparison by By Verticals Analysis (2016-2032)
- Figure 144: Middle East & Africa Enterprise Asset Management Market Share Comparison by Country (2016-2032)
- Figure 145: Middle East & Africa Enterprise Asset Management Market Share Comparison by By Applications Analysis (2016-2032)
- Figure 146: Middle East & Africa Enterprise Asset Management Market Share Comparison by By Deployment Models Analysis (2016-2032)
- Figure 147: Middle East & Africa Enterprise Asset Management Market Share Comparison by By Verticals Analysis (2016-2032)
List of Tables
- Table 1: Global Enterprise Asset Management Market Comparison by By Applications Analysis (2016-2032)
- Table 2: Global Enterprise Asset Management Market Comparison by By Deployment Models Analysis (2016-2032)
- Table 3: Global Enterprise Asset Management Market Comparison by By Verticals Analysis (2016-2032)
- Table 4: Global Enterprise Asset Management Market Revenue (US$ Mn) Comparison by Region (2016-2032)
- Table 5: Global Enterprise Asset Management Market Revenue (US$ Mn) (2016-2032)
- Table 6: Global Enterprise Asset Management Market Revenue (US$ Mn) Comparison by Region (2016-2032)
- Table 7: Global Enterprise Asset Management Market Revenue (US$ Mn) Comparison by By Applications Analysis (2016-2032)
- Table 8: Global Enterprise Asset Management Market Revenue (US$ Mn) Comparison by By Deployment Models Analysis (2016-2032)
- Table 9: Global Enterprise Asset Management Market Revenue (US$ Mn) Comparison by By Verticals Analysis (2016-2032)
- Table 10: Global Enterprise Asset Management Market Y-o-Y Growth Rate Comparison by Region (2016-2032)
- Table 11: Global Enterprise Asset Management Market Y-o-Y Growth Rate Comparison by By Applications Analysis (2016-2032)
- Table 12: Global Enterprise Asset Management Market Y-o-Y Growth Rate Comparison by By Deployment Models Analysis (2016-2032)
- Table 13: Global Enterprise Asset Management Market Y-o-Y Growth Rate Comparison by By Verticals Analysis (2016-2032)
- Table 14: Global Enterprise Asset Management Market Share Comparison by Region (2016-2032)
- Table 15: Global Enterprise Asset Management Market Share Comparison by By Applications Analysis (2016-2032)
- Table 16: Global Enterprise Asset Management Market Share Comparison by By Deployment Models Analysis (2016-2032)
- Table 17: Global Enterprise Asset Management Market Share Comparison by By Verticals Analysis (2016-2032)
- Table 18: North America Enterprise Asset Management Market Comparison by By Deployment Models Analysis (2016-2032)
- Table 19: North America Enterprise Asset Management Market Comparison by By Verticals Analysis (2016-2032)
- Table 20: North America Enterprise Asset Management Market Revenue (US$ Mn) Comparison by Country (2016-2032)
- Table 21: North America Enterprise Asset Management Market Revenue (US$ Mn) (2016-2032)
- Table 22: North America Enterprise Asset Management Market Revenue (US$ Mn) Comparison by Country (2016-2032)
- Table 23: North America Enterprise Asset Management Market Revenue (US$ Mn) Comparison by By Applications Analysis (2016-2032)
- Table 24: North America Enterprise Asset Management Market Revenue (US$ Mn) Comparison by By Deployment Models Analysis (2016-2032)
- Table 25: North America Enterprise Asset Management Market Revenue (US$ Mn) Comparison by By Verticals Analysis (2016-2032)
- Table 26: North America Enterprise Asset Management Market Y-o-Y Growth Rate Comparison by Country (2016-2032)
- Table 27: North America Enterprise Asset Management Market Y-o-Y Growth Rate Comparison by By Applications Analysis (2016-2032)
- Table 28: North America Enterprise Asset Management Market Y-o-Y Growth Rate Comparison by By Deployment Models Analysis (2016-2032)
- Table 29: North America Enterprise Asset Management Market Y-o-Y Growth Rate Comparison by By Verticals Analysis (2016-2032)
- Table 30: North America Enterprise Asset Management Market Share Comparison by Country (2016-2032)
- Table 31: North America Enterprise Asset Management Market Share Comparison by By Applications Analysis (2016-2032)
- Table 32: North America Enterprise Asset Management Market Share Comparison by By Deployment Models Analysis (2016-2032)
- Table 33: North America Enterprise Asset Management Market Share Comparison by By Verticals Analysis (2016-2032)
- Table 34: Western Europe Enterprise Asset Management Market Comparison by By Applications Analysis (2016-2032)
- Table 35: Western Europe Enterprise Asset Management Market Comparison by By Deployment Models Analysis (2016-2032)
- Table 36: Western Europe Enterprise Asset Management Market Comparison by By Verticals Analysis (2016-2032)
- Table 37: Western Europe Enterprise Asset Management Market Revenue (US$ Mn) Comparison by Country (2016-2032)
- Table 38: Western Europe Enterprise Asset Management Market Revenue (US$ Mn) (2016-2032)
- Table 39: Western Europe Enterprise Asset Management Market Revenue (US$ Mn) Comparison by Country (2016-2032)
- Table 40: Western Europe Enterprise Asset Management Market Revenue (US$ Mn) Comparison by By Applications Analysis (2016-2032)
- Table 41: Western Europe Enterprise Asset Management Market Revenue (US$ Mn) Comparison by By Deployment Models Analysis (2016-2032)
- Table 42: Western Europe Enterprise Asset Management Market Revenue (US$ Mn) Comparison by By Verticals Analysis (2016-2032)
- Table 43: Western Europe Enterprise Asset Management Market Y-o-Y Growth Rate Comparison by Country (2016-2032)
- Table 44: Western Europe Enterprise Asset Management Market Y-o-Y Growth Rate Comparison by By Applications Analysis (2016-2032)
- Table 45: Western Europe Enterprise Asset Management Market Y-o-Y Growth Rate Comparison by By Deployment Models Analysis (2016-2032)
- Table 46: Western Europe Enterprise Asset Management Market Y-o-Y Growth Rate Comparison by By Verticals Analysis (2016-2032)
- Table 47: Western Europe Enterprise Asset Management Market Share Comparison by Country (2016-2032)
- Table 48: Western Europe Enterprise Asset Management Market Share Comparison by By Applications Analysis (2016-2032)
- Table 49: Western Europe Enterprise Asset Management Market Share Comparison by By Deployment Models Analysis (2016-2032)
- Table 50: Western Europe Enterprise Asset Management Market Share Comparison by By Verticals Analysis (2016-2032)
- Table 51: Eastern Europe Enterprise Asset Management Market Comparison by By Applications Analysis (2016-2032)
- Table 52: Eastern Europe Enterprise Asset Management Market Comparison by By Deployment Models Analysis (2016-2032)
- Table 53: Eastern Europe Enterprise Asset Management Market Comparison by By Verticals Analysis (2016-2032)
- Table 54: Eastern Europe Enterprise Asset Management Market Revenue (US$ Mn) Comparison by Country (2016-2032)
- Table 55: Eastern Europe Enterprise Asset Management Market Revenue (US$ Mn) (2016-2032)
- Table 56: Eastern Europe Enterprise Asset Management Market Revenue (US$ Mn) Comparison by Country (2016-2032)
- Table 57: Eastern Europe Enterprise Asset Management Market Revenue (US$ Mn) Comparison by By Applications Analysis (2016-2032)
- Table 58: Eastern Europe Enterprise Asset Management Market Revenue (US$ Mn) Comparison by By Deployment Models Analysis (2016-2032)
- Table 59: Eastern Europe Enterprise Asset Management Market Revenue (US$ Mn) Comparison by By Verticals Analysis (2016-2032)
- Table 60: Eastern Europe Enterprise Asset Management Market Y-o-Y Growth Rate Comparison by Country (2016-2032)
- Table 61: Eastern Europe Enterprise Asset Management Market Y-o-Y Growth Rate Comparison by By Applications Analysis (2016-2032)
- Table 62: Eastern Europe Enterprise Asset Management Market Y-o-Y Growth Rate Comparison by By Deployment Models Analysis (2016-2032)
- Table 63: Eastern Europe Enterprise Asset Management Market Y-o-Y Growth Rate Comparison by By Verticals Analysis (2016-2032)
- Table 64: Eastern Europe Enterprise Asset Management Market Share Comparison by Country (2016-2032)
- Table 65: Eastern Europe Enterprise Asset Management Market Share Comparison by By Applications Analysis (2016-2032)
- Table 66: Eastern Europe Enterprise Asset Management Market Share Comparison by By Deployment Models Analysis (2016-2032)
- Table 67: Eastern Europe Enterprise Asset Management Market Share Comparison by By Verticals Analysis (2016-2032)
- Table 68: APAC Enterprise Asset Management Market Comparison by By Applications Analysis (2016-2032)
- Table 69: APAC Enterprise Asset Management Market Comparison by By Deployment Models Analysis (2016-2032)
- Table 70: APAC Enterprise Asset Management Market Comparison by By Verticals Analysis (2016-2032)
- Table 71: APAC Enterprise Asset Management Market Revenue (US$ Mn) Comparison by Country (2016-2032)
- Table 72: APAC Enterprise Asset Management Market Revenue (US$ Mn) (2016-2032)
- Table 73: APAC Enterprise Asset Management Market Revenue (US$ Mn) Comparison by Country (2016-2032)
- Table 74: APAC Enterprise Asset Management Market Revenue (US$ Mn) Comparison by By Applications Analysis (2016-2032)
- Table 75: APAC Enterprise Asset Management Market Revenue (US$ Mn) Comparison by By Deployment Models Analysis (2016-2032)
- Table 76: APAC Enterprise Asset Management Market Revenue (US$ Mn) Comparison by By Verticals Analysis (2016-2032)
- Table 77: APAC Enterprise Asset Management Market Y-o-Y Growth Rate Comparison by Country (2016-2032)
- Table 78: APAC Enterprise Asset Management Market Y-o-Y Growth Rate Comparison by By Applications Analysis (2016-2032)
- Table 79: APAC Enterprise Asset Management Market Y-o-Y Growth Rate Comparison by By Deployment Models Analysis (2016-2032)
- Table 80: APAC Enterprise Asset Management Market Y-o-Y Growth Rate Comparison by By Verticals Analysis (2016-2032)
- Table 81: APAC Enterprise Asset Management Market Share Comparison by Country (2016-2032)
- Table 82: APAC Enterprise Asset Management Market Share Comparison by By Applications Analysis (2016-2032)
- Table 83: APAC Enterprise Asset Management Market Share Comparison by By Deployment Models Analysis (2016-2032)
- Table 84: APAC Enterprise Asset Management Market Share Comparison by By Verticals Analysis (2016-2032)
- Table 85: Latin America Enterprise Asset Management Market Comparison by By Applications Analysis (2016-2032)
- Table 86: Latin America Enterprise Asset Management Market Comparison by By Deployment Models Analysis (2016-2032)
- Table 87: Latin America Enterprise Asset Management Market Comparison by By Verticals Analysis (2016-2032)
- Table 88: Latin America Enterprise Asset Management Market Revenue (US$ Mn) Comparison by Country (2016-2032)
- Table 89: Latin America Enterprise Asset Management Market Revenue (US$ Mn) (2016-2032)
- Table 90: Latin America Enterprise Asset Management Market Revenue (US$ Mn) Comparison by Country (2016-2032)
- Table 91: Latin America Enterprise Asset Management Market Revenue (US$ Mn) Comparison by By Applications Analysis (2016-2032)
- Table 92: Latin America Enterprise Asset Management Market Revenue (US$ Mn) Comparison by By Deployment Models Analysis (2016-2032)
- Table 93: Latin America Enterprise Asset Management Market Revenue (US$ Mn) Comparison by By Verticals Analysis (2016-2032)
- Table 94: Latin America Enterprise Asset Management Market Y-o-Y Growth Rate Comparison by Country (2016-2032)
- Table 95: Latin America Enterprise Asset Management Market Y-o-Y Growth Rate Comparison by By Applications Analysis (2016-2032)
- Table 96: Latin America Enterprise Asset Management Market Y-o-Y Growth Rate Comparison by By Deployment Models Analysis (2016-2032)
- Table 97: Latin America Enterprise Asset Management Market Y-o-Y Growth Rate Comparison by By Verticals Analysis (2016-2032)
- Table 98: Latin America Enterprise Asset Management Market Share Comparison by Country (2016-2032)
- Table 99: Latin America Enterprise Asset Management Market Share Comparison by By Applications Analysis (2016-2032)
- Table 100: Latin America Enterprise Asset Management Market Share Comparison by By Deployment Models Analysis (2016-2032)
- Table 101: Latin America Enterprise Asset Management Market Share Comparison by By Verticals Analysis (2016-2032)
- Table 102: Middle East & Africa Enterprise Asset Management Market Comparison by By Applications Analysis (2016-2032)
- Table 103: Middle East & Africa Enterprise Asset Management Market Comparison by By Deployment Models Analysis (2016-2032)
- Table 104: Middle East & Africa Enterprise Asset Management Market Comparison by By Verticals Analysis (2016-2032)
- Table 105: Middle East & Africa Enterprise Asset Management Market Revenue (US$ Mn) Comparison by Country (2016-2032)
- Table 106: Middle East & Africa Enterprise Asset Management Market Revenue (US$ Mn) (2016-2032)
- Table 107: Middle East & Africa Enterprise Asset Management Market Revenue (US$ Mn) Comparison by Country (2016-2032)
- Table 108: Middle East & Africa Enterprise Asset Management Market Revenue (US$ Mn) Comparison by By Applications Analysis (2016-2032)
- Table 109: Middle East & Africa Enterprise Asset Management Market Revenue (US$ Mn) Comparison by By Deployment Models Analysis (2016-2032)
- Table 110: Middle East & Africa Enterprise Asset Management Market Revenue (US$ Mn) Comparison by By Verticals Analysis (2016-2032)
- Table 111: Middle East & Africa Enterprise Asset Management Market Y-o-Y Growth Rate Comparison by Country (2016-2032)
- Table 112: Middle East & Africa Enterprise Asset Management Market Y-o-Y Growth Rate Comparison by By Applications Analysis (2016-2032)
- Table 113: Middle East & Africa Enterprise Asset Management Market Y-o-Y Growth Rate Comparison by By Deployment Models Analysis (2016-2032)
- Table 114: Middle East & Africa Enterprise Asset Management Market Y-o-Y Growth Rate Comparison by By Verticals Analysis (2016-2032)
- Table 115: Middle East & Africa Enterprise Asset Management Market Share Comparison by Country (2016-2032)
- Table 116: Middle East & Africa Enterprise Asset Management Market Share Comparison by By Applications Analysis (2016-2032)
- Table 117: Middle East & Africa Enterprise Asset Management Market Share Comparison by By Deployment Models Analysis (2016-2032)
- Table 118: Middle East & Africa Enterprise Asset Management Market Share Comparison by By Verticals Analysis (2016-2032)
- 1. Executive Summary
-
- Oracle
- IBM
- SAP
- IFS
- ABB
- Infor
- CGI
- Aptean
- Maintenance Connection
- IPS
- AssetWorks
- AVEVA
Our Clients


View Our Licence Options
