
Energy Engineering Services Outsourcing (ESO) Market By Service(R&D and Designing, Structuring & Layout, Digitization, Implementation & Maintenance), By Location(Onshore, Offshore), By Energy Source(Renewable, Non-renewable, Chemical Processing), By Region And Companies - Industry Segment Outlook, Market Assessment, Competition Scenario, Trends, And Forecast 2023-2032
-
42448
-
Dec 2023
-
179
-


-
This report was compiled by Shreyas Rokade Shreyas Rokade is a seasoned Research Analyst with CMFE, bringing extensive expertise in market research and consulting, with a strong background in Chemical Engineering. Correspondence Team Lead-CMFE Linkedin | Detailed Market research Methodology Our methodology involves a mix of primary research, including interviews with leading mental health experts, and secondary research from reputable medical journals and databases. View Detailed Methodology Page
-
Quick Navigation
- Energy Engineering Services Outsourcing (ESO) Market Size, Share, Trends Analysis
- Energy Engineering Services Outsourcing (ESO) Market Dynamics
- Energy Engineering Services Outsourcing (ESO) Market Segmentation Analysis
- Energy Engineering Services Outsourcing (ESO) Industry Segments
- Energy Engineering Services Outsourcing (ESO) Market Regional Analysis
- Energy Engineering Services Outsourcing (ESO) Industry By Region
- Energy Engineering Services Outsourcing (ESO) Market Share Analysis
- Energy Engineering Services Outsourcing (ESO) Industry Key Players
- Energy Engineering Services Outsourcing (ESO) Market Recent Development
- Report Scope
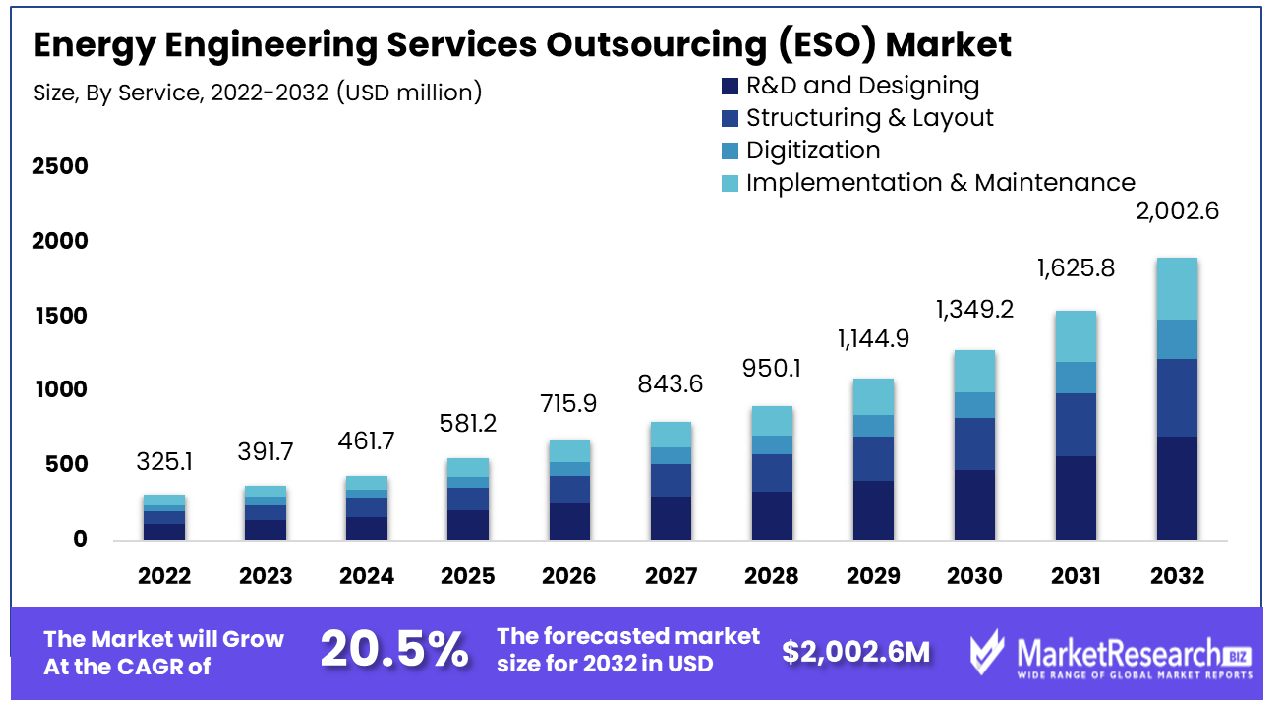
The Energy Engineering Services Outsourcing (ESO) Market was valued at USD 325.1 Million in 2022. It is expected to reach USD 2,002.6 Million by 2032, with a CAGR of 20.5% during the forecast period from 2023 to 2032.
Energy Engineering Services Outsourcing (ESO) is the process of delegating a variety of tasks in engineering associated with the production of energy and management to service providers outside of the company. It covers a broad range of services, such as designing, planning, installation maintenance, and operation in energy systems.
ESO lets companies, especially those working in the energy industry, access experts' expertise, modern technologies, and cost-effective solutions without needing in-house capabilities. This method is becoming increasingly sought-after in the fields of renewable energy including oil and gas or power generation. These areas are where technology advances and regulatory challenges require specialist expertise. ESO lets companies focus on their core tasks while optimizing their energy projects by utilizing external knowledge.
According to a report by the International Energy Agency, implementing data analytics techniques in energy management could result in energy savings of up to 15% by 2040. The Energy Engineering Services Outsourcing (ESO) Market is positioned for healthy growth in the coming years owing to several supportive trends.
Introducing technologies for smart grid plant digitization and virtual prototyping can significantly propel the digital transformation in the energy sector. Engineering Service Providers (ESPs) that adopt these technologies are well-positioned to meet the growing demand for digital solutions in energy management and distribution. Market trends indicate a surge in investments in smart grid technologies, emphasizing efficiency, resilience, and integration of renewable sources.
Expanding into renewable energy engineering services, including wind, solar power, geothermal, and hydrogen fuel cells, aligns with the global shift towards sustainable energy sources. The renewable energy market is witnessing exponential growth, driven by governmental policies and a societal push for sustainable practices. ESPs venturing into this realm can capitalize on this burgeoning demand, offering specialized services in an industry poised for significant expansion.
Providing comprehensive end-to-end services, from design to construction, addresses a critical market gap in the Energy Engineering Services Outsourcing (ESO) market. Current industry analyses highlight a preference for holistic solutions over fragmented services. By offering a full spectrum of services, ESPs can attract a wider range of clients, including those seeking streamlined, integrated project management. This approach enhances client satisfaction, fosters long-term relationships, and positions providers as one-stop solutions, thus driving market expansion and client retention.
Energy Engineering Services Outsourcing (ESO) Market Dynamics
Cost Savings and Operational Efficiency Drive ESO Market Growth
Cost savings and operational efficiency are pivotal in driving the Energy Engineering Services Outsourcing (ESO) Market. In an increasingly competitive energy sector, companies are seeking ways to reduce expenses while enhancing operational productivity. Outsourcing engineering services enables these companies to achieve cost efficiencies by reducing the need for in-house resources and tapping into the expertise of specialized firms.
This approach not only cuts operational costs but also improves efficiency through the adoption of best practices and innovative solutions provided by ESO providers. The ongoing focus on cost optimization and operational excellence in the energy sector indicates a sustained demand for ESO, positioning it as a strategic tool for companies aiming to remain competitive and profitable.
Skilled Labor and Advanced Tools Enhance ESO Market
The availability of skilled labor and advanced engineering tools is a key factor contributing to the growth of the Energy Engineering Services Outsourcing Market. The ESO sector benefits from a pool of highly skilled professionals who possess specialized knowledge in energy engineering.
Coupled with advanced engineering tools and technologies, these professionals can offer high-quality services that meet the complex demands of the energy sector. Combining skilled labor and cutting-edge tools enables ESO providers to deliver innovative, efficient solutions, making them attractive partners for energy companies. The increasing reliance on specialized skills and advanced technology in the energy sector suggests continued market growth, driven by the need for expertise and technological proficiency in energy engineering.
Digitization in the Energy Sector Spurs ESO Demand
Growing digitization in the energy sector significantly fuels the demand for Energy Engineering Services Outsourcing. As the energy industry embraces digital transformation, there is an increased need for specialized services that can support this transition. ESO providers offer expertise in areas like digital infrastructure, smart grid technology, and data analytics, which are essential for digitizing energy operations.
This shift towards a more digital, data-driven energy sector necessitates external engineering expertise, driving the growth of the ESO market. The trend towards digitization is expected to continue, further amplifying the demand for ESO services that can facilitate this digital evolution in the energy industry.
Uninterrupted Power Supply Necessitates Efficient ESO Solutions
Efficiency and uninterrupted power supply are crucial factors driving the Energy Engineering Services Outsourcing Market. With the growing global demand for reliable energy, companies are focusing on ensuring efficient and uninterrupted power supply. ESO providers play a vital role in this regard by offering services that optimize power generation, transmission, and distribution.
These services include the design and implementation of efficient energy systems, maintenance of existing infrastructure, and integration of renewable energy sources. The emphasis on uninterrupted power and efficiency highlights the importance of ESO in maintaining and enhancing energy systems. The ongoing need for a reliable energy supply suggests a sustained market growth for ESO, underpinned by the continuous quest for energy efficiency and reliability.
Language and Communication Barriers in Offshore Outsourcing Restrain Energy ESO Market Growth
Language and communication barriers in offshore outsourcing significantly limit the growth of the Energy Engineering Services Outsourcing (ESO) market. When ESO services are outsourced to countries with different primary languages and cultural contexts, misunderstandings and misinterpretations can occur, leading to errors or delays in project completion.
Effective communication is vital in energy engineering projects where complex technical details need to be accurately conveyed and understood. These language barriers can result in reduced efficiency and increased costs, making clients hesitant to outsource to providers in different linguistic and cultural regions, thereby restraining the market's expansion.
Concerns About Information Security and Data Protection Limit Energy ESO Market Growth
Information security and data protection concerns are major players' restraints in the growth of the Energy ESO market. Clients in the energy sector often deal with sensitive information, including proprietary data and critical infrastructure details. Outsourcing engineering services introduces risks regarding data breaches and unauthorized access to confidential information.
Clients may be hesitant to share sensitive data with third-party service providers, especially if the providers are in countries with different data protection laws or are perceived as having inadequate cybersecurity measures. These concerns can lead to reluctance to adopt ESO, limiting market growth as data security and privacy remain paramount in the energy industry.
Energy Engineering Services Outsourcing (ESO) Market Segmentation Analysis
By Service Analysis
R&D and Design services dominate the Energy Engineering Services Outsourcing (ESO) Market, accounting for 45% of the market share. The dominance of this sector is fueled by the sector's growing emphasis on efficiency, innovation, and sustainability. Companies are constantly investing in research and development to develop innovative energy solutions, enhance existing technologies, and ensure compliance with environmental laws. outsourcing R&D or designing solutions can allow energy companies to tap into external expertise, cut costs, and speed up the development of innovative technologies. This trend is particularly evident in areas like renewable energy, where rapid technological advancements are crucial.
Structuring and layout services are essential for optimizing energy production and distribution. Digitization services are growing rapidly, as the energy industry embraces digital transformation for better data management and operational efficiency. Implementation and maintenance services ensure the smooth operation and longevity of energy infrastructure.
By Location Analysis
The onshore services segment, representing 72% of the market, leads in ESO services. The majority of energy infrastructures which includes grids, power plants, and facilities for energy processing, are situated onshore. The dominant position of this sector results from the vast and diverse nature of projects that are onshore and require a variety and variety of services for engineering. The development of the onshore energy sector as compared to offshore is also a contributing factor to its higher market share.
Offshore segment ESO services, while smaller in market share, are significant, particularly in the oil and gas and offshore wind sectors. Offshore projects often require specialized engineering services due to the challenging environment and unique technological needs.
By Energy Source Analysis
Renewable energy sources make up the largest portion of the ESO market, with a 50 percent share. This is a reflection of the worldwide shift toward renewable energy sources such as wind, solar, and hydroelectric energy. The rapid growth of renewable energy is driven by the growing environmental issues, incentives from governments as well as technological advances. The outsourcing of engineering services in this field allows businesses to benefit from specialized knowledge in renewable technologies and to manage the challenges for sustainable energy-related projects.
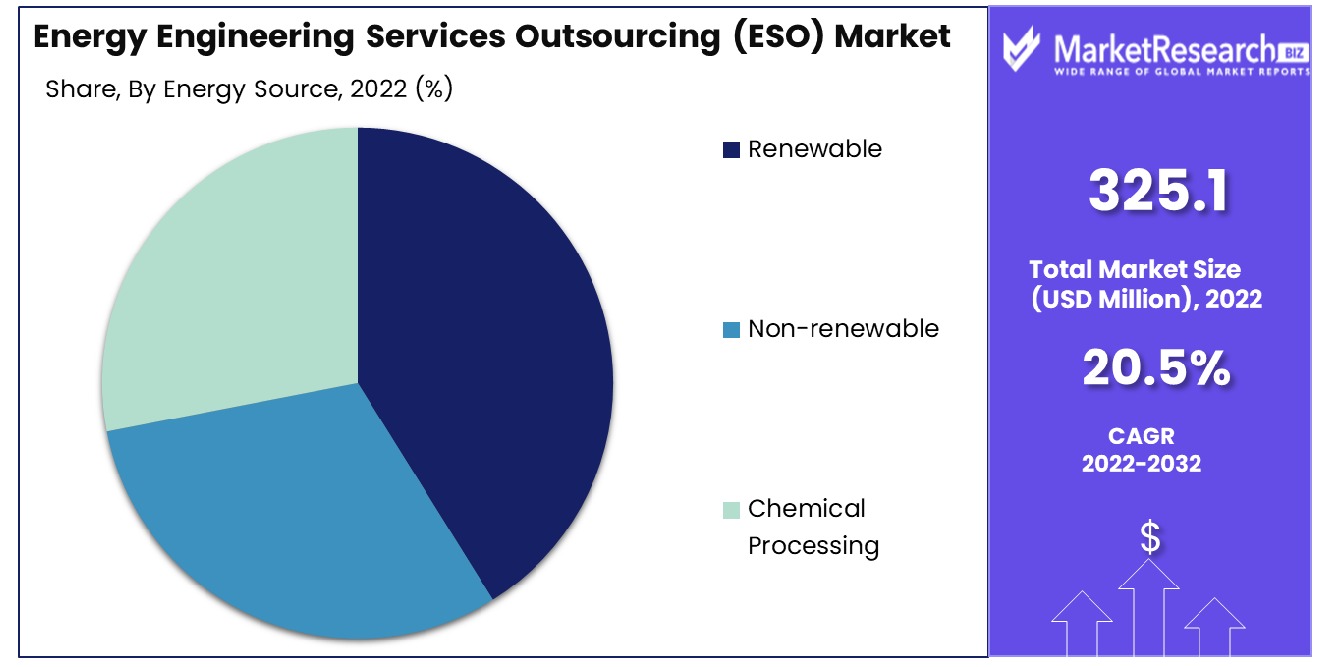
Non-renewable energy sources like gas, oil, and coal, will require engineering services to explore, extract, and process. Chemical processing is the process of converting raw materials into energy-producing products, which requires highly specialized engineering services that are secure and efficient processes.
Energy Engineering Services Outsourcing (ESO) Industry Segments
By Service
- R&D and Designing
- Structuring & Layout
- Digitization
- Implementation & Maintenance
By Location
- Onshore
- Offshore
By Energy Source
- Renewable
- Non-renewable
- Chemical Processing
Energy Engineering Services Outsourcing (ESO) Market Regional Analysis
Asia Pacific Dominates with 37.0% Market Share
Asia Pacific’s significant 37.0% share in the Energy Engineering Services Outsourcing (ESO) Market is largely attributed to the region’s rapid industrialization and the consequent surge in energy demand. Countries like China, India, and Japan, with their expansive industrial sectors, require extensive energy engineering services. The availability of cost-effective labor and the presence of skilled engineering talent in the region also play crucial roles. Furthermore, Asia Pacific's push towards renewable energy sources and sustainable energy solutions has increased the demand for specialized ESO services.
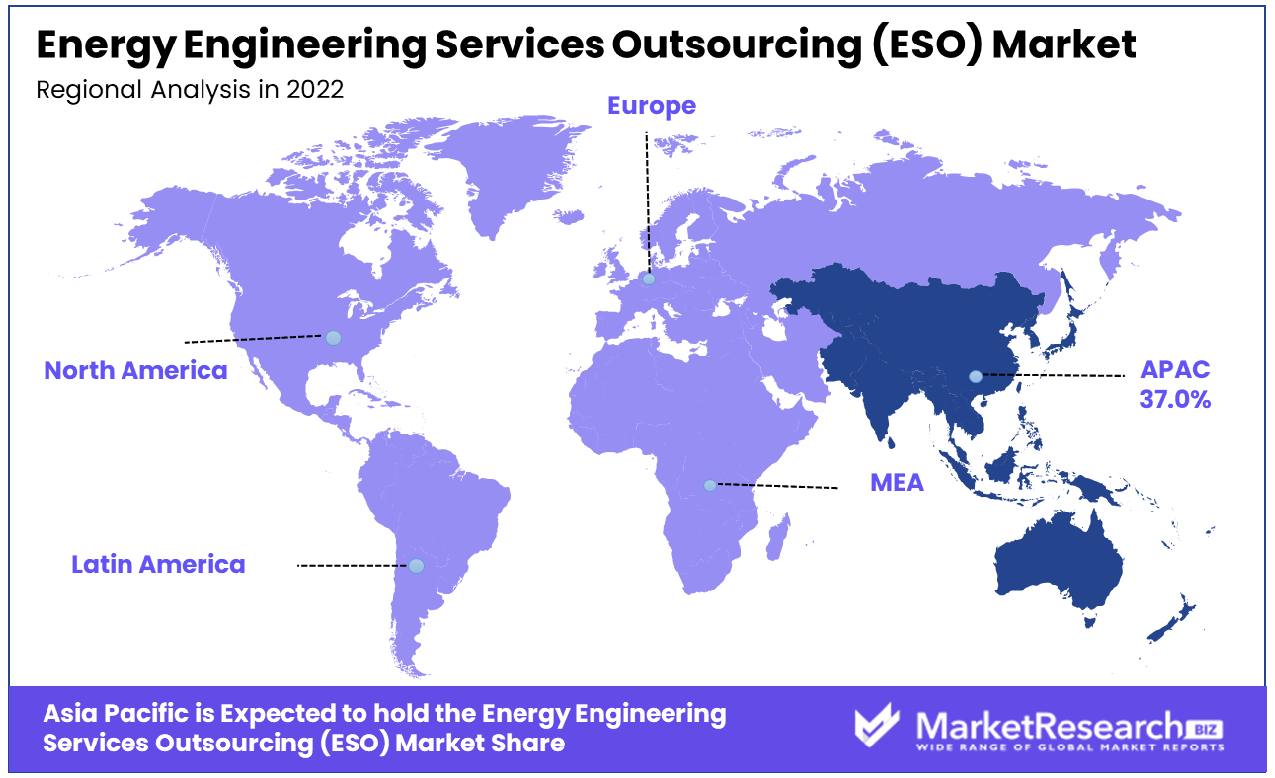
The market dynamics in Asia Pacific are influenced by the region’s commitment to meeting its growing energy needs while addressing environmental concerns. This commitment has led to substantial investments in energy infrastructure, including both conventional and renewable energy projects. The growing focus on energy efficiency, coupled with the adoption of advanced technologies in energy management, further boosts the ESO market. Additionally, government initiatives and incentives for green energy projects enhance the appeal of outsourcing engineering services in the energy sector.
North America's Innovation and Advanced Energy Solutions
North America’s ESO market is driven by the region's focus on innovation and the adoption of advanced energy solutions. The United States and Canada are at the forefront of technological advancements in energy efficiency and renewable energy sources. The strong emphasis on sustainable energy practices and the presence of leading energy firms foster a robust market for ESO services.
Europe's Strategic Energy Initiatives and Sustainability Focus
In Europe, the ESO market benefits from the region's strategic energy initiatives and a strong focus on sustainability. European countries are leaders in renewable energy adoption and have set ambitious targets for reducing carbon emissions. The increasing need for specialized services to manage these complex energy projects supports the growth of the ESO market in Europe. The region's commitment to environmental goals and efficient energy use drives the demand for outsourced engineering services in the energy sector.
Energy Engineering Services Outsourcing (ESO) Industry By Region
North America
- The US
- Canada
- Rest of North America
Europe
- Germany
- France
- The UK
- Spain
- Italy
- Russia
- Netherlands
- Rest of Europe
Asia-Pacific
- China
- Japan
- South Korea
- India
- New Zealand
- Singapore
- Thailand
- Vietnam
- Rest of Asia Pacific
Latin America
- Brazil
- Mexico
- Rest of Latin America
Middle East & Africa
- South Africa
- Saudi Arabia
- UAE
- Rest of Middle East & Africa
In the Energy Engineering Services Outsourcing (ESO) Market, a critical segment for the energy sector's efficiency and innovation, the companies listed are key players driving growth and transformation. Semcon and Segula Technologies, with their extensive expertise in engineering and design services, lead the market in providing customized solutions for energy projects, highlighting the industry's focus on specialized and tailored engineering support.
STATS and Total OutSource, Inc., known for their technical and project management services, play crucial roles in optimizing energy operations and infrastructure, reflecting the growing demand for comprehensive and integrated ESO solutions. Cubic Corporation and QUEST GLOBAL, offering a range of engineering and technology services, contribute significantly to the market by catering to complex energy challenges, from renewable energy integration to digital transformation.
Rilco Engineering Services and Mott MacDonald, with their deep industry knowledge, are pivotal in delivering high-quality engineering and consulting services, underscoring the market's emphasis on expertise and reliability. LUXOFT, A DXC TECHNOLOGY COMPANY, and ESI Group, specializing in digital solutions, demonstrate the industry's shift towards leveraging advanced technologies like AI and IoT in energy engineering.
Cyient and Capgemini Engineering (formerly Altran), focusing on technology and innovation, are key in driving the adoption of cutting-edge solutions in energy engineering, from data analytics to smart grid technologies. Alten Group and Assystem, with their global presence, underscore the importance of scalability and international expertise in the ESO market.
Altair Engineering Inc., known for its software and computational technology, provides essential tools and services that enhance engineering efficiency and innovation in the energy sector.Collectively, these companies drive the Energy Engineering Services Outsourcing Market's growth, representing diverse strategies - from specialized engineering support to digital and technological solutions - crucial for addressing the evolving needs and challenges of the global energy industry.
Energy Engineering Services Outsourcing (ESO) Industry Key Players
- Semcon
- STATS
- Total OutSource, Inc.
- Cubic Corporation
- Segula Technologies
- QUEST GLOBAL
- Rilco Engineering Services
- Mott MacDonald
- LUXOFT, A DXC TECHNOLOGY COMPANY
- ESI Group
- Cyient
- Capgemini Engineering (Altran)
- Alten Group
- Assystem
- Altair Engineering Inc.
- HCL Technologies Limited
- Tech Mahindra Limited
- Wipro Limited
- Tata Consultancy Services Limited
- Cybage Software Pvt. Ltd.
Energy Engineering Services Outsourcing (ESO) Market Recent Development
- In November 2023, Ofgem, the UK's energy regulator, announced rule changes aimed at expediting the grid connection approval process for new renewable energy projects and infrastructure developments.
- In June 2023, the National Grid Electricity System Operator (ESO) is taking steps to expedite connections to the electricity network for renewable energy projects.
- In 2023, Decentralized Energy Systems: ESO providers are exploring decentralized energy systems, where power generation and distribution are localized. This trend is driven by a desire for increased resilience and reduced transmission losses.
- In 2023, SolarEdge Technologies, Inc. which is a producer of technology for smart power unveiled its first battery Virtual Power Plant specifically designed to be compatible with its National Grid ESO Demand Flexibility Service (DFS) in the UK.
Report Scope
Report Features Description Market Value (2022) USD 325.1 Billion Forecast Revenue (2032) USD 2,002.6 Billion CAGR (2023-2032) 20.5% Base Year for Estimation 2022 Historic Period 2016-2022 Forecast Period 2023-2032 Report Coverage Revenue Forecast, Market Dynamics, COVID-19 Impact, Competitive Landscape, Recent Developments Segments Covered By Service(R&D and Designing, Structuring & Layout, Digitization, Implementation & Maintenance), By Location(Onshore, Offshore), By Energy Source(Renewable, Non-renewable, Chemical Processing) Regional Analysis North America - The US, Canada, Rest of North America, Europe - Germany, France, The UK, Spain, Italy, Russia, Netherlands, Rest of Europe, Asia-Pacific - China, Japan, South Korea, India, New Zealand, Singapore, Thailand, Vietnam, Rest of Asia Pacific, Latin America - Brazil, Mexico, Rest of Latin America, Middle East & Africa - South Africa, Saudi Arabia, UAE, Rest of Middle East & Africa Competitive Landscape Semcon, STATS, Total OutSource, Inc., Cubic Corporation, Segula Technologies, QUEST GLOBAL, Mott MacDonald, LUXOFT, A DXC TECHNOLOGY COMPANY, ESI Group, Cyient, Capgemini Engineering (Altran), Alten Group, Assystem, Altair Engineering Inc., HCL Technologies Limited, Tech Mahindra Limited, Wipro Limited, Tata Consultancy Services Limited, Cybage Software Pvt. Ltd. Customization Scope Customization for segments, region/country-level will be provided. Moreover, additional customization can be done based on the requirements. Purchase Options We have three licenses to opt for Single User License, Multi-User License (Up to 5 Users), Corporate Use License (Unlimited User and Printable PDF) -
- 1. Executive Summary
- 1.1. Definition
- 1.2. Taxonomy
- 1.3. Research Scope
- 1.4. Key Analysis
- 1.5. Key Findings by Major Segments
- 1.6. Top strategies by Major Players
- 2. Global Energy Engineering Services Outsourcing (ESO) Market Overview
- 2.1. Energy Engineering Services Outsourcing (ESO) Market Dynamics
- 2.1.1. Drivers
- 2.1.2. Opportunities
- 2.1.3. Restraints
- 2.1.4. Challenges
- 2.2. Macro-economic Factors
- 2.3. Regulatory Framework
- 2.4. Market Investment Feasibility Index
- 2.5. PEST Analysis
- 2.6. PORTER’S Five Force Analysis
- 2.7. Drivers & Restraints Impact Analysis
- 2.8. Industry Chain Analysis
- 2.9. Cost Structure Analysis
- 2.10. Marketing Strategy
- 2.11. Russia-Ukraine War Impact Analysis
- 2.12. Opportunity Map Analysis
- 2.13. Market Competition Scenario Analysis
- 2.14. Product Life Cycle Analysis
- 2.15. Opportunity Orbits
- 2.16. Manufacturer Intensity Map
- 2.17. Major Companies sales by Value & Volume
- 2.1. Energy Engineering Services Outsourcing (ESO) Market Dynamics
- 3. Global Energy Engineering Services Outsourcing (ESO) Market Analysis, Opportunity and Forecast, 2016-2032
- 3.1. Global Energy Engineering Services Outsourcing (ESO) Market Analysis, 2016-2021
- 3.2. Global Energy Engineering Services Outsourcing (ESO) Market Opportunity and Forecast, 2023-2032
- 3.3. Global Energy Engineering Services Outsourcing (ESO) Market Analysis, Opportunity and Forecast, By By Service, 2016-2032
- 3.3.1. Global Energy Engineering Services Outsourcing (ESO) Market Analysis by By Service: Introduction
- 3.3.2. Market Size Absolute $ Opportunity Analysis and Forecast, By By Service, 2016-2032
- 3.3.3. R&D and Designing
- 3.3.4. Structuring & Layout
- 3.3.5. Digitization
- 3.3.6. Implementation & Maintenance
- 3.4. Global Energy Engineering Services Outsourcing (ESO) Market Analysis, Opportunity and Forecast, By By Location, 2016-2032
- 3.4.1. Global Energy Engineering Services Outsourcing (ESO) Market Analysis by By Location: Introduction
- 3.4.2. Market Size Absolute $ Opportunity Analysis and Forecast, By By Location, 2016-2032
- 3.4.3. Onshore
- 3.4.4. Offshore
- 3.5. Global Energy Engineering Services Outsourcing (ESO) Market Analysis, Opportunity and Forecast, By By Energy Source, 2016-2032
- 3.5.1. Global Energy Engineering Services Outsourcing (ESO) Market Analysis by By Energy Source: Introduction
- 3.5.2. Market Size Absolute $ Opportunity Analysis and Forecast, By By Energy Source, 2016-2032
- 3.5.3. Renewable
- 3.5.4. Non-renewable
- 3.5.5. Chemical Processing
- 4. North America Energy Engineering Services Outsourcing (ESO) Market Analysis, Opportunity and Forecast, 2016-2032
- 4.1. North America Energy Engineering Services Outsourcing (ESO) Market Analysis, 2016-2021
- 4.2. North America Energy Engineering Services Outsourcing (ESO) Market Opportunity and Forecast, 2023-2032
- 4.3. North America Energy Engineering Services Outsourcing (ESO) Market Analysis, Opportunity and Forecast, By By Service, 2016-2032
- 4.3.1. North America Energy Engineering Services Outsourcing (ESO) Market Analysis by By Service: Introduction
- 4.3.2. Market Size Absolute $ Opportunity Analysis and Forecast, By By Service, 2016-2032
- 4.3.3. R&D and Designing
- 4.3.4. Structuring & Layout
- 4.3.5. Digitization
- 4.3.6. Implementation & Maintenance
- 4.4. North America Energy Engineering Services Outsourcing (ESO) Market Analysis, Opportunity and Forecast, By By Location, 2016-2032
- 4.4.1. North America Energy Engineering Services Outsourcing (ESO) Market Analysis by By Location: Introduction
- 4.4.2. Market Size Absolute $ Opportunity Analysis and Forecast, By By Location, 2016-2032
- 4.4.3. Onshore
- 4.4.4. Offshore
- 4.5. North America Energy Engineering Services Outsourcing (ESO) Market Analysis, Opportunity and Forecast, By By Energy Source, 2016-2032
- 4.5.1. North America Energy Engineering Services Outsourcing (ESO) Market Analysis by By Energy Source: Introduction
- 4.5.2. Market Size Absolute $ Opportunity Analysis and Forecast, By By Energy Source, 2016-2032
- 4.5.3. Renewable
- 4.5.4. Non-renewable
- 4.5.5. Chemical Processing
- 4.6. North America Energy Engineering Services Outsourcing (ESO) Market Analysis, Opportunity and Forecast, By Country , 2016-2032
- 4.6.1. North America Energy Engineering Services Outsourcing (ESO) Market Analysis by Country : Introduction
- 4.6.2. Market Size Absolute $ Opportunity Analysis and Forecast, Country , 2016-2032
- 4.6.2.1. The US
- 4.6.2.2. Canada
- 4.6.2.3. Mexico
- 5. Western Europe Energy Engineering Services Outsourcing (ESO) Market Analysis, Opportunity and Forecast, 2016-2032
- 5.1. Western Europe Energy Engineering Services Outsourcing (ESO) Market Analysis, 2016-2021
- 5.2. Western Europe Energy Engineering Services Outsourcing (ESO) Market Opportunity and Forecast, 2023-2032
- 5.3. Western Europe Energy Engineering Services Outsourcing (ESO) Market Analysis, Opportunity and Forecast, By By Service, 2016-2032
- 5.3.1. Western Europe Energy Engineering Services Outsourcing (ESO) Market Analysis by By Service: Introduction
- 5.3.2. Market Size Absolute $ Opportunity Analysis and Forecast, By By Service, 2016-2032
- 5.3.3. R&D and Designing
- 5.3.4. Structuring & Layout
- 5.3.5. Digitization
- 5.3.6. Implementation & Maintenance
- 5.4. Western Europe Energy Engineering Services Outsourcing (ESO) Market Analysis, Opportunity and Forecast, By By Location, 2016-2032
- 5.4.1. Western Europe Energy Engineering Services Outsourcing (ESO) Market Analysis by By Location: Introduction
- 5.4.2. Market Size Absolute $ Opportunity Analysis and Forecast, By By Location, 2016-2032
- 5.4.3. Onshore
- 5.4.4. Offshore
- 5.5. Western Europe Energy Engineering Services Outsourcing (ESO) Market Analysis, Opportunity and Forecast, By By Energy Source, 2016-2032
- 5.5.1. Western Europe Energy Engineering Services Outsourcing (ESO) Market Analysis by By Energy Source: Introduction
- 5.5.2. Market Size Absolute $ Opportunity Analysis and Forecast, By By Energy Source, 2016-2032
- 5.5.3. Renewable
- 5.5.4. Non-renewable
- 5.5.5. Chemical Processing
- 5.6. Western Europe Energy Engineering Services Outsourcing (ESO) Market Analysis, Opportunity and Forecast, By Country , 2016-2032
- 5.6.1. Western Europe Energy Engineering Services Outsourcing (ESO) Market Analysis by Country : Introduction
- 5.6.2. Market Size Absolute $ Opportunity Analysis and Forecast, Country , 2016-2032
- 5.6.2.1. Germany
- 5.6.2.2. France
- 5.6.2.3. The UK
- 5.6.2.4. Spain
- 5.6.2.5. Italy
- 5.6.2.6. Portugal
- 5.6.2.7. Ireland
- 5.6.2.8. Austria
- 5.6.2.9. Switzerland
- 5.6.2.10. Benelux
- 5.6.2.11. Nordic
- 5.6.2.12. Rest of Western Europe
- 6. Eastern Europe Energy Engineering Services Outsourcing (ESO) Market Analysis, Opportunity and Forecast, 2016-2032
- 6.1. Eastern Europe Energy Engineering Services Outsourcing (ESO) Market Analysis, 2016-2021
- 6.2. Eastern Europe Energy Engineering Services Outsourcing (ESO) Market Opportunity and Forecast, 2023-2032
- 6.3. Eastern Europe Energy Engineering Services Outsourcing (ESO) Market Analysis, Opportunity and Forecast, By By Service, 2016-2032
- 6.3.1. Eastern Europe Energy Engineering Services Outsourcing (ESO) Market Analysis by By Service: Introduction
- 6.3.2. Market Size Absolute $ Opportunity Analysis and Forecast, By By Service, 2016-2032
- 6.3.3. R&D and Designing
- 6.3.4. Structuring & Layout
- 6.3.5. Digitization
- 6.3.6. Implementation & Maintenance
- 6.4. Eastern Europe Energy Engineering Services Outsourcing (ESO) Market Analysis, Opportunity and Forecast, By By Location, 2016-2032
- 6.4.1. Eastern Europe Energy Engineering Services Outsourcing (ESO) Market Analysis by By Location: Introduction
- 6.4.2. Market Size Absolute $ Opportunity Analysis and Forecast, By By Location, 2016-2032
- 6.4.3. Onshore
- 6.4.4. Offshore
- 6.5. Eastern Europe Energy Engineering Services Outsourcing (ESO) Market Analysis, Opportunity and Forecast, By By Energy Source, 2016-2032
- 6.5.1. Eastern Europe Energy Engineering Services Outsourcing (ESO) Market Analysis by By Energy Source: Introduction
- 6.5.2. Market Size Absolute $ Opportunity Analysis and Forecast, By By Energy Source, 2016-2032
- 6.5.3. Renewable
- 6.5.4. Non-renewable
- 6.5.5. Chemical Processing
- 6.6. Eastern Europe Energy Engineering Services Outsourcing (ESO) Market Analysis, Opportunity and Forecast, By Country , 2016-2032
- 6.6.1. Eastern Europe Energy Engineering Services Outsourcing (ESO) Market Analysis by Country : Introduction
- 6.6.2. Market Size Absolute $ Opportunity Analysis and Forecast, Country , 2016-2032
- 6.6.2.1. Russia
- 6.6.2.2. Poland
- 6.6.2.3. The Czech Republic
- 6.6.2.4. Greece
- 6.6.2.5. Rest of Eastern Europe
- 7. APAC Energy Engineering Services Outsourcing (ESO) Market Analysis, Opportunity and Forecast, 2016-2032
- 7.1. APAC Energy Engineering Services Outsourcing (ESO) Market Analysis, 2016-2021
- 7.2. APAC Energy Engineering Services Outsourcing (ESO) Market Opportunity and Forecast, 2023-2032
- 7.3. APAC Energy Engineering Services Outsourcing (ESO) Market Analysis, Opportunity and Forecast, By By Service, 2016-2032
- 7.3.1. APAC Energy Engineering Services Outsourcing (ESO) Market Analysis by By Service: Introduction
- 7.3.2. Market Size Absolute $ Opportunity Analysis and Forecast, By By Service, 2016-2032
- 7.3.3. R&D and Designing
- 7.3.4. Structuring & Layout
- 7.3.5. Digitization
- 7.3.6. Implementation & Maintenance
- 7.4. APAC Energy Engineering Services Outsourcing (ESO) Market Analysis, Opportunity and Forecast, By By Location, 2016-2032
- 7.4.1. APAC Energy Engineering Services Outsourcing (ESO) Market Analysis by By Location: Introduction
- 7.4.2. Market Size Absolute $ Opportunity Analysis and Forecast, By By Location, 2016-2032
- 7.4.3. Onshore
- 7.4.4. Offshore
- 7.5. APAC Energy Engineering Services Outsourcing (ESO) Market Analysis, Opportunity and Forecast, By By Energy Source, 2016-2032
- 7.5.1. APAC Energy Engineering Services Outsourcing (ESO) Market Analysis by By Energy Source: Introduction
- 7.5.2. Market Size Absolute $ Opportunity Analysis and Forecast, By By Energy Source, 2016-2032
- 7.5.3. Renewable
- 7.5.4. Non-renewable
- 7.5.5. Chemical Processing
- 7.6. APAC Energy Engineering Services Outsourcing (ESO) Market Analysis, Opportunity and Forecast, By Country , 2016-2032
- 7.6.1. APAC Energy Engineering Services Outsourcing (ESO) Market Analysis by Country : Introduction
- 7.6.2. Market Size Absolute $ Opportunity Analysis and Forecast, Country , 2016-2032
- 7.6.2.1. China
- 7.6.2.2. Japan
- 7.6.2.3. South Korea
- 7.6.2.4. India
- 7.6.2.5. Australia & New Zeland
- 7.6.2.6. Indonesia
- 7.6.2.7. Malaysia
- 7.6.2.8. Philippines
- 7.6.2.9. Singapore
- 7.6.2.10. Thailand
- 7.6.2.11. Vietnam
- 7.6.2.12. Rest of APAC
- 8. Latin America Energy Engineering Services Outsourcing (ESO) Market Analysis, Opportunity and Forecast, 2016-2032
- 8.1. Latin America Energy Engineering Services Outsourcing (ESO) Market Analysis, 2016-2021
- 8.2. Latin America Energy Engineering Services Outsourcing (ESO) Market Opportunity and Forecast, 2023-2032
- 8.3. Latin America Energy Engineering Services Outsourcing (ESO) Market Analysis, Opportunity and Forecast, By By Service, 2016-2032
- 8.3.1. Latin America Energy Engineering Services Outsourcing (ESO) Market Analysis by By Service: Introduction
- 8.3.2. Market Size Absolute $ Opportunity Analysis and Forecast, By By Service, 2016-2032
- 8.3.3. R&D and Designing
- 8.3.4. Structuring & Layout
- 8.3.5. Digitization
- 8.3.6. Implementation & Maintenance
- 8.4. Latin America Energy Engineering Services Outsourcing (ESO) Market Analysis, Opportunity and Forecast, By By Location, 2016-2032
- 8.4.1. Latin America Energy Engineering Services Outsourcing (ESO) Market Analysis by By Location: Introduction
- 8.4.2. Market Size Absolute $ Opportunity Analysis and Forecast, By By Location, 2016-2032
- 8.4.3. Onshore
- 8.4.4. Offshore
- 8.5. Latin America Energy Engineering Services Outsourcing (ESO) Market Analysis, Opportunity and Forecast, By By Energy Source, 2016-2032
- 8.5.1. Latin America Energy Engineering Services Outsourcing (ESO) Market Analysis by By Energy Source: Introduction
- 8.5.2. Market Size Absolute $ Opportunity Analysis and Forecast, By By Energy Source, 2016-2032
- 8.5.3. Renewable
- 8.5.4. Non-renewable
- 8.5.5. Chemical Processing
- 8.6. Latin America Energy Engineering Services Outsourcing (ESO) Market Analysis, Opportunity and Forecast, By Country , 2016-2032
- 8.6.1. Latin America Energy Engineering Services Outsourcing (ESO) Market Analysis by Country : Introduction
- 8.6.2. Market Size Absolute $ Opportunity Analysis and Forecast, Country , 2016-2032
- 8.6.2.1. Brazil
- 8.6.2.2. Colombia
- 8.6.2.3. Chile
- 8.6.2.4. Argentina
- 8.6.2.5. Costa Rica
- 8.6.2.6. Rest of Latin America
- 9. Middle East & Africa Energy Engineering Services Outsourcing (ESO) Market Analysis, Opportunity and Forecast, 2016-2032
- 9.1. Middle East & Africa Energy Engineering Services Outsourcing (ESO) Market Analysis, 2016-2021
- 9.2. Middle East & Africa Energy Engineering Services Outsourcing (ESO) Market Opportunity and Forecast, 2023-2032
- 9.3. Middle East & Africa Energy Engineering Services Outsourcing (ESO) Market Analysis, Opportunity and Forecast, By By Service, 2016-2032
- 9.3.1. Middle East & Africa Energy Engineering Services Outsourcing (ESO) Market Analysis by By Service: Introduction
- 9.3.2. Market Size Absolute $ Opportunity Analysis and Forecast, By By Service, 2016-2032
- 9.3.3. R&D and Designing
- 9.3.4. Structuring & Layout
- 9.3.5. Digitization
- 9.3.6. Implementation & Maintenance
- 9.4. Middle East & Africa Energy Engineering Services Outsourcing (ESO) Market Analysis, Opportunity and Forecast, By By Location, 2016-2032
- 9.4.1. Middle East & Africa Energy Engineering Services Outsourcing (ESO) Market Analysis by By Location: Introduction
- 9.4.2. Market Size Absolute $ Opportunity Analysis and Forecast, By By Location, 2016-2032
- 9.4.3. Onshore
- 9.4.4. Offshore
- 9.5. Middle East & Africa Energy Engineering Services Outsourcing (ESO) Market Analysis, Opportunity and Forecast, By By Energy Source, 2016-2032
- 9.5.1. Middle East & Africa Energy Engineering Services Outsourcing (ESO) Market Analysis by By Energy Source: Introduction
- 9.5.2. Market Size Absolute $ Opportunity Analysis and Forecast, By By Energy Source, 2016-2032
- 9.5.3. Renewable
- 9.5.4. Non-renewable
- 9.5.5. Chemical Processing
- 9.6. Middle East & Africa Energy Engineering Services Outsourcing (ESO) Market Analysis, Opportunity and Forecast, By Country , 2016-2032
- 9.6.1. Middle East & Africa Energy Engineering Services Outsourcing (ESO) Market Analysis by Country : Introduction
- 9.6.2. Market Size Absolute $ Opportunity Analysis and Forecast, Country , 2016-2032
- 9.6.2.1. Algeria
- 9.6.2.2. Egypt
- 9.6.2.3. Israel
- 9.6.2.4. Kuwait
- 9.6.2.5. Nigeria
- 9.6.2.6. Saudi Arabia
- 9.6.2.7. South Africa
- 9.6.2.8. Turkey
- 9.6.2.9. The UAE
- 9.6.2.10. Rest of MEA
- 10. Global Energy Engineering Services Outsourcing (ESO) Market Analysis, Opportunity and Forecast, By Region , 2016-2032
- 10.1. Global Energy Engineering Services Outsourcing (ESO) Market Analysis by Region : Introduction
- 10.2. Market Size Absolute $ Opportunity Analysis and Forecast, By Region , 2016-2032
- 10.2.1. North America
- 10.2.2. Western Europe
- 10.2.3. Eastern Europe
- 10.2.4. APAC
- 10.2.5. Latin America
- 10.2.6. Middle East & Africa
- 11. Global Energy Engineering Services Outsourcing (ESO) Market Competitive Landscape, Market Share Analysis, and Company Profiles
- 11.1. Market Share Analysis
- 11.2. Company Profiles
- 11.3. Semcon
- 11.3.1. Company Overview
- 11.3.2. Financial Highlights
- 11.3.3. Product Portfolio
- 11.3.4. SWOT Analysis
- 11.3.5. Key Strategies and Developments
- 11.4. STATS
- 11.4.1. Company Overview
- 11.4.2. Financial Highlights
- 11.4.3. Product Portfolio
- 11.4.4. SWOT Analysis
- 11.4.5. Key Strategies and Developments
- 11.5. Total OutSource, Inc.
- 11.5.1. Company Overview
- 11.5.2. Financial Highlights
- 11.5.3. Product Portfolio
- 11.5.4. SWOT Analysis
- 11.5.5. Key Strategies and Developments
- 11.6. Cubic Corporation
- 11.6.1. Company Overview
- 11.6.2. Financial Highlights
- 11.6.3. Product Portfolio
- 11.6.4. SWOT Analysis
- 11.6.5. Key Strategies and Developments
- 11.7. Segula Technologies
- 11.7.1. Company Overview
- 11.7.2. Financial Highlights
- 11.7.3. Product Portfolio
- 11.7.4. SWOT Analysis
- 11.7.5. Key Strategies and Developments
- 11.8. QUEST GLOBAL
- 11.8.1. Company Overview
- 11.8.2. Financial Highlights
- 11.8.3. Product Portfolio
- 11.8.4. SWOT Analysis
- 11.8.5. Key Strategies and Developments
- 11.9. Rilco Engineering Services
- 11.9.1. Company Overview
- 11.9.2. Financial Highlights
- 11.9.3. Product Portfolio
- 11.9.4. SWOT Analysis
- 11.9.5. Key Strategies and Developments
- 11.10. Mott MacDonald
- 11.10.1. Company Overview
- 11.10.2. Financial Highlights
- 11.10.3. Product Portfolio
- 11.10.4. SWOT Analysis
- 11.10.5. Key Strategies and Developments
- 11.11. LUXOFT, A DXC TECHNOLOGY COMPANY
- 11.11.1. Company Overview
- 11.11.2. Financial Highlights
- 11.11.3. Product Portfolio
- 11.11.4. SWOT Analysis
- 11.11.5. Key Strategies and Developments
- 11.12. ESI Group
- 11.12.1. Company Overview
- 11.12.2. Financial Highlights
- 11.12.3. Product Portfolio
- 11.12.4. SWOT Analysis
- 11.12.5. Key Strategies and Developments
- 11.13.1. Company Overview
- 11.13.2. Financial Highlights
- 11.13.3. Product Portfolio
- 11.13.4. SWOT Analysis
- 11.13.5. Key Strategies and Developments
- 11.14. Cyient
- 11.14.1. Company Overview
- 11.14.2. Financial Highlights
- 11.14.3. Product Portfolio
- 11.14.4. SWOT Analysis
- 11.14.5. Key Strategies and Developments
- 11.15. Alten Group
- 11.15.1. Company Overview
- 11.15.2. Financial Highlights
- 11.15.3. Product Portfolio
- 11.15.4. SWOT Analysis
- 11.15.5. Key Strategies and Developments
- 11.16. Assystem
- 11.16.1. Company Overview
- 11.16.2. Financial Highlights
- 11.16.3. Product Portfolio
- 11.16.4. SWOT Analysis
- 11.16.5. Key Strategies and Developments
- 11.17. Altair Engineering Inc.
- 11.17.1. Company Overview
- 11.17.2. Financial Highlights
- 11.17.3. Product Portfolio
- 11.17.4. SWOT Analysis
- 11.17.5. Key Strategies and Developments
- 11.18. HCL Technologies Limited
- 11.18.1. Company Overview
- 11.18.2. Financial Highlights
- 11.18.3. Product Portfolio
- 11.18.4. SWOT Analysis
- 11.18.5. Key Strategies and Developments
- 11.19. Tech Mahindra Limited
- 11.19.1. Company Overview
- 11.19.2. Financial Highlights
- 11.19.3. Product Portfolio
- 11.19.4. SWOT Analysis
- 11.19.5. Key Strategies and Developments
- 11.20. Wipro Limited
- 11.20.1. Company Overview
- 11.20.2. Financial Highlights
- 11.20.3. Product Portfolio
- 11.20.4. SWOT Analysis
- 11.20.5. Key Strategies and Developments
- 11.21. Tata Consultancy Services Limited
- 11.21.1. Company Overview
- 11.21.2. Financial Highlights
- 11.21.3. Product Portfolio
- 11.21.4. SWOT Analysis
- 11.21.5. Key Strategies and Developments
- 11.22. Cybage Software Pvt.Ltd.
- 11.22.1. Company Overview
- 11.22.2. Financial Highlights
- 11.22.3. Product Portfolio
- 11.22.4. SWOT Analysis
- 11.22.5. Key Strategies and Developments
- 12. Assumptions and Acronyms
- 13. Research Methodology
- 14. Contact
"
- List of Figures
- "
- Figure 1: Global Energy Engineering Services Outsourcing (ESO) Market Revenue (US$ Mn) Market Share by By Service in 2022
- Figure 2: Global Energy Engineering Services Outsourcing (ESO) Market Market Attractiveness Analysis by By Service, 2016-2032
- Figure 3: Global Energy Engineering Services Outsourcing (ESO) Market Revenue (US$ Mn) Market Share by By Locationin 2022
- Figure 4: Global Energy Engineering Services Outsourcing (ESO) Market Market Attractiveness Analysis by By Location, 2016-2032
- Figure 5: Global Energy Engineering Services Outsourcing (ESO) Market Revenue (US$ Mn) Market Share by By Energy Sourcein 2022
- Figure 6: Global Energy Engineering Services Outsourcing (ESO) Market Market Attractiveness Analysis by By Energy Source, 2016-2032
- Figure 7: Global Energy Engineering Services Outsourcing (ESO) Market Revenue (US$ Mn) Market Share by Region in 2022
- Figure 8: Global Energy Engineering Services Outsourcing (ESO) Market Market Attractiveness Analysis by Region, 2016-2032
- Figure 9: Global Energy Engineering Services Outsourcing (ESO) Market Market Revenue (US$ Mn) (2016-2032)
- Figure 10: Global Energy Engineering Services Outsourcing (ESO) Market Market Revenue (US$ Mn) Comparison by Region (2016-2032)
- Figure 11: Global Energy Engineering Services Outsourcing (ESO) Market Market Revenue (US$ Mn) Comparison by By Service (2016-2032)
- Figure 12: Global Energy Engineering Services Outsourcing (ESO) Market Market Revenue (US$ Mn) Comparison by By Location (2016-2032)
- Figure 13: Global Energy Engineering Services Outsourcing (ESO) Market Market Revenue (US$ Mn) Comparison by By Energy Source (2016-2032)
- Figure 14: Global Energy Engineering Services Outsourcing (ESO) Market Market Y-o-Y Growth Rate Comparison by Region (2016-2032)
- Figure 15: Global Energy Engineering Services Outsourcing (ESO) Market Market Y-o-Y Growth Rate Comparison by By Service (2016-2032)
- Figure 16: Global Energy Engineering Services Outsourcing (ESO) Market Market Y-o-Y Growth Rate Comparison by By Location (2016-2032)
- Figure 17: Global Energy Engineering Services Outsourcing (ESO) Market Market Y-o-Y Growth Rate Comparison by By Energy Source (2016-2032)
- Figure 18: Global Energy Engineering Services Outsourcing (ESO) Market Market Share Comparison by Region (2016-2032)
- Figure 19: Global Energy Engineering Services Outsourcing (ESO) Market Market Share Comparison by By Service (2016-2032)
- Figure 20: Global Energy Engineering Services Outsourcing (ESO) Market Market Share Comparison by By Location (2016-2032)
- Figure 21: Global Energy Engineering Services Outsourcing (ESO) Market Market Share Comparison by By Energy Source (2016-2032)
- Figure 22: North America Energy Engineering Services Outsourcing (ESO) Market Revenue (US$ Mn) Market Share by By Servicein 2022
- Figure 23: North America Energy Engineering Services Outsourcing (ESO) Market Market Attractiveness Analysis by By Service, 2016-2032
- Figure 24: North America Energy Engineering Services Outsourcing (ESO) Market Revenue (US$ Mn) Market Share by By Locationin 2022
- Figure 25: North America Energy Engineering Services Outsourcing (ESO) Market Market Attractiveness Analysis by By Location, 2016-2032
- Figure 26: North America Energy Engineering Services Outsourcing (ESO) Market Revenue (US$ Mn) Market Share by By Energy Sourcein 2022
- Figure 27: North America Energy Engineering Services Outsourcing (ESO) Market Market Attractiveness Analysis by By Energy Source, 2016-2032
- Figure 28: North America Energy Engineering Services Outsourcing (ESO) Market Revenue (US$ Mn) Market Share by Country in 2022
- Figure 29: North America Energy Engineering Services Outsourcing (ESO) Market Market Attractiveness Analysis by Country, 2016-2032
- Figure 30: North America Energy Engineering Services Outsourcing (ESO) Market Market Revenue (US$ Mn) (2016-2032)
- Figure 31: North America Energy Engineering Services Outsourcing (ESO) Market Market Revenue (US$ Mn) Comparison by Country (2016-2032)
- Figure 32: North America Energy Engineering Services Outsourcing (ESO) Market Market Revenue (US$ Mn) Comparison by By Service (2016-2032)
- Figure 33: North America Energy Engineering Services Outsourcing (ESO) Market Market Revenue (US$ Mn) Comparison by By Location (2016-2032)
- Figure 34: North America Energy Engineering Services Outsourcing (ESO) Market Market Revenue (US$ Mn) Comparison by By Energy Source (2016-2032)
- Figure 35: North America Energy Engineering Services Outsourcing (ESO) Market Market Y-o-Y Growth Rate Comparison by Country (2016-2032)
- Figure 36: North America Energy Engineering Services Outsourcing (ESO) Market Market Y-o-Y Growth Rate Comparison by By Service (2016-2032)
- Figure 37: North America Energy Engineering Services Outsourcing (ESO) Market Market Y-o-Y Growth Rate Comparison by By Location (2016-2032)
- Figure 38: North America Energy Engineering Services Outsourcing (ESO) Market Market Y-o-Y Growth Rate Comparison by By Energy Source (2016-2032)
- Figure 39: North America Energy Engineering Services Outsourcing (ESO) Market Market Share Comparison by Country (2016-2032)
- Figure 40: North America Energy Engineering Services Outsourcing (ESO) Market Market Share Comparison by By Service (2016-2032)
- Figure 41: North America Energy Engineering Services Outsourcing (ESO) Market Market Share Comparison by By Location (2016-2032)
- Figure 42: North America Energy Engineering Services Outsourcing (ESO) Market Market Share Comparison by By Energy Source (2016-2032)
- Figure 43: Western Europe Energy Engineering Services Outsourcing (ESO) Market Revenue (US$ Mn) Market Share by By Servicein 2022
- Figure 44: Western Europe Energy Engineering Services Outsourcing (ESO) Market Market Attractiveness Analysis by By Service, 2016-2032
- Figure 45: Western Europe Energy Engineering Services Outsourcing (ESO) Market Revenue (US$ Mn) Market Share by By Locationin 2022
- Figure 46: Western Europe Energy Engineering Services Outsourcing (ESO) Market Market Attractiveness Analysis by By Location, 2016-2032
- Figure 47: Western Europe Energy Engineering Services Outsourcing (ESO) Market Revenue (US$ Mn) Market Share by By Energy Sourcein 2022
- Figure 48: Western Europe Energy Engineering Services Outsourcing (ESO) Market Market Attractiveness Analysis by By Energy Source, 2016-2032
- Figure 49: Western Europe Energy Engineering Services Outsourcing (ESO) Market Revenue (US$ Mn) Market Share by Country in 2022
- Figure 50: Western Europe Energy Engineering Services Outsourcing (ESO) Market Market Attractiveness Analysis by Country, 2016-2032
- Figure 51: Western Europe Energy Engineering Services Outsourcing (ESO) Market Market Revenue (US$ Mn) (2016-2032)
- Figure 52: Western Europe Energy Engineering Services Outsourcing (ESO) Market Market Revenue (US$ Mn) Comparison by Country (2016-2032)
- Figure 53: Western Europe Energy Engineering Services Outsourcing (ESO) Market Market Revenue (US$ Mn) Comparison by By Service (2016-2032)
- Figure 54: Western Europe Energy Engineering Services Outsourcing (ESO) Market Market Revenue (US$ Mn) Comparison by By Location (2016-2032)
- Figure 55: Western Europe Energy Engineering Services Outsourcing (ESO) Market Market Revenue (US$ Mn) Comparison by By Energy Source (2016-2032)
- Figure 56: Western Europe Energy Engineering Services Outsourcing (ESO) Market Market Y-o-Y Growth Rate Comparison by Country (2016-2032)
- Figure 57: Western Europe Energy Engineering Services Outsourcing (ESO) Market Market Y-o-Y Growth Rate Comparison by By Service (2016-2032)
- Figure 58: Western Europe Energy Engineering Services Outsourcing (ESO) Market Market Y-o-Y Growth Rate Comparison by By Location (2016-2032)
- Figure 59: Western Europe Energy Engineering Services Outsourcing (ESO) Market Market Y-o-Y Growth Rate Comparison by By Energy Source (2016-2032)
- Figure 60: Western Europe Energy Engineering Services Outsourcing (ESO) Market Market Share Comparison by Country (2016-2032)
- Figure 61: Western Europe Energy Engineering Services Outsourcing (ESO) Market Market Share Comparison by By Service (2016-2032)
- Figure 62: Western Europe Energy Engineering Services Outsourcing (ESO) Market Market Share Comparison by By Location (2016-2032)
- Figure 63: Western Europe Energy Engineering Services Outsourcing (ESO) Market Market Share Comparison by By Energy Source (2016-2032)
- Figure 64: Eastern Europe Energy Engineering Services Outsourcing (ESO) Market Revenue (US$ Mn) Market Share by By Servicein 2022
- Figure 65: Eastern Europe Energy Engineering Services Outsourcing (ESO) Market Market Attractiveness Analysis by By Service, 2016-2032
- Figure 66: Eastern Europe Energy Engineering Services Outsourcing (ESO) Market Revenue (US$ Mn) Market Share by By Locationin 2022
- Figure 67: Eastern Europe Energy Engineering Services Outsourcing (ESO) Market Market Attractiveness Analysis by By Location, 2016-2032
- Figure 68: Eastern Europe Energy Engineering Services Outsourcing (ESO) Market Revenue (US$ Mn) Market Share by By Energy Sourcein 2022
- Figure 69: Eastern Europe Energy Engineering Services Outsourcing (ESO) Market Market Attractiveness Analysis by By Energy Source, 2016-2032
- Figure 70: Eastern Europe Energy Engineering Services Outsourcing (ESO) Market Revenue (US$ Mn) Market Share by Country in 2022
- Figure 71: Eastern Europe Energy Engineering Services Outsourcing (ESO) Market Market Attractiveness Analysis by Country, 2016-2032
- Figure 72: Eastern Europe Energy Engineering Services Outsourcing (ESO) Market Market Revenue (US$ Mn) (2016-2032)
- Figure 73: Eastern Europe Energy Engineering Services Outsourcing (ESO) Market Market Revenue (US$ Mn) Comparison by Country (2016-2032)
- Figure 74: Eastern Europe Energy Engineering Services Outsourcing (ESO) Market Market Revenue (US$ Mn) Comparison by By Service (2016-2032)
- Figure 75: Eastern Europe Energy Engineering Services Outsourcing (ESO) Market Market Revenue (US$ Mn) Comparison by By Location (2016-2032)
- Figure 76: Eastern Europe Energy Engineering Services Outsourcing (ESO) Market Market Revenue (US$ Mn) Comparison by By Energy Source (2016-2032)
- Figure 77: Eastern Europe Energy Engineering Services Outsourcing (ESO) Market Market Y-o-Y Growth Rate Comparison by Country (2016-2032)
- Figure 78: Eastern Europe Energy Engineering Services Outsourcing (ESO) Market Market Y-o-Y Growth Rate Comparison by By Service (2016-2032)
- Figure 79: Eastern Europe Energy Engineering Services Outsourcing (ESO) Market Market Y-o-Y Growth Rate Comparison by By Location (2016-2032)
- Figure 80: Eastern Europe Energy Engineering Services Outsourcing (ESO) Market Market Y-o-Y Growth Rate Comparison by By Energy Source (2016-2032)
- Figure 81: Eastern Europe Energy Engineering Services Outsourcing (ESO) Market Market Share Comparison by Country (2016-2032)
- Figure 82: Eastern Europe Energy Engineering Services Outsourcing (ESO) Market Market Share Comparison by By Service (2016-2032)
- Figure 83: Eastern Europe Energy Engineering Services Outsourcing (ESO) Market Market Share Comparison by By Location (2016-2032)
- Figure 84: Eastern Europe Energy Engineering Services Outsourcing (ESO) Market Market Share Comparison by By Energy Source (2016-2032)
- Figure 85: APAC Energy Engineering Services Outsourcing (ESO) Market Revenue (US$ Mn) Market Share by By Servicein 2022
- Figure 86: APAC Energy Engineering Services Outsourcing (ESO) Market Market Attractiveness Analysis by By Service, 2016-2032
- Figure 87: APAC Energy Engineering Services Outsourcing (ESO) Market Revenue (US$ Mn) Market Share by By Locationin 2022
- Figure 88: APAC Energy Engineering Services Outsourcing (ESO) Market Market Attractiveness Analysis by By Location, 2016-2032
- Figure 89: APAC Energy Engineering Services Outsourcing (ESO) Market Revenue (US$ Mn) Market Share by By Energy Sourcein 2022
- Figure 90: APAC Energy Engineering Services Outsourcing (ESO) Market Market Attractiveness Analysis by By Energy Source, 2016-2032
- Figure 91: APAC Energy Engineering Services Outsourcing (ESO) Market Revenue (US$ Mn) Market Share by Country in 2022
- Figure 92: APAC Energy Engineering Services Outsourcing (ESO) Market Market Attractiveness Analysis by Country, 2016-2032
- Figure 93: APAC Energy Engineering Services Outsourcing (ESO) Market Market Revenue (US$ Mn) (2016-2032)
- Figure 94: APAC Energy Engineering Services Outsourcing (ESO) Market Market Revenue (US$ Mn) Comparison by Country (2016-2032)
- Figure 95: APAC Energy Engineering Services Outsourcing (ESO) Market Market Revenue (US$ Mn) Comparison by By Service (2016-2032)
- Figure 96: APAC Energy Engineering Services Outsourcing (ESO) Market Market Revenue (US$ Mn) Comparison by By Location (2016-2032)
- Figure 97: APAC Energy Engineering Services Outsourcing (ESO) Market Market Revenue (US$ Mn) Comparison by By Energy Source (2016-2032)
- Figure 98: APAC Energy Engineering Services Outsourcing (ESO) Market Market Y-o-Y Growth Rate Comparison by Country (2016-2032)
- Figure 99: APAC Energy Engineering Services Outsourcing (ESO) Market Market Y-o-Y Growth Rate Comparison by By Service (2016-2032)
- Figure 100: APAC Energy Engineering Services Outsourcing (ESO) Market Market Y-o-Y Growth Rate Comparison by By Location (2016-2032)
- Figure 101: APAC Energy Engineering Services Outsourcing (ESO) Market Market Y-o-Y Growth Rate Comparison by By Energy Source (2016-2032)
- Figure 102: APAC Energy Engineering Services Outsourcing (ESO) Market Market Share Comparison by Country (2016-2032)
- Figure 103: APAC Energy Engineering Services Outsourcing (ESO) Market Market Share Comparison by By Service (2016-2032)
- Figure 104: APAC Energy Engineering Services Outsourcing (ESO) Market Market Share Comparison by By Location (2016-2032)
- Figure 105: APAC Energy Engineering Services Outsourcing (ESO) Market Market Share Comparison by By Energy Source (2016-2032)
- Figure 106: Latin America Energy Engineering Services Outsourcing (ESO) Market Revenue (US$ Mn) Market Share by By Servicein 2022
- Figure 107: Latin America Energy Engineering Services Outsourcing (ESO) Market Market Attractiveness Analysis by By Service, 2016-2032
- Figure 108: Latin America Energy Engineering Services Outsourcing (ESO) Market Revenue (US$ Mn) Market Share by By Locationin 2022
- Figure 109: Latin America Energy Engineering Services Outsourcing (ESO) Market Market Attractiveness Analysis by By Location, 2016-2032
- Figure 110: Latin America Energy Engineering Services Outsourcing (ESO) Market Revenue (US$ Mn) Market Share by By Energy Sourcein 2022
- Figure 111: Latin America Energy Engineering Services Outsourcing (ESO) Market Market Attractiveness Analysis by By Energy Source, 2016-2032
- Figure 112: Latin America Energy Engineering Services Outsourcing (ESO) Market Revenue (US$ Mn) Market Share by Country in 2022
- Figure 113: Latin America Energy Engineering Services Outsourcing (ESO) Market Market Attractiveness Analysis by Country, 2016-2032
- Figure 114: Latin America Energy Engineering Services Outsourcing (ESO) Market Market Revenue (US$ Mn) (2016-2032)
- Figure 115: Latin America Energy Engineering Services Outsourcing (ESO) Market Market Revenue (US$ Mn) Comparison by Country (2016-2032)
- Figure 116: Latin America Energy Engineering Services Outsourcing (ESO) Market Market Revenue (US$ Mn) Comparison by By Service (2016-2032)
- Figure 117: Latin America Energy Engineering Services Outsourcing (ESO) Market Market Revenue (US$ Mn) Comparison by By Location (2016-2032)
- Figure 118: Latin America Energy Engineering Services Outsourcing (ESO) Market Market Revenue (US$ Mn) Comparison by By Energy Source (2016-2032)
- Figure 119: Latin America Energy Engineering Services Outsourcing (ESO) Market Market Y-o-Y Growth Rate Comparison by Country (2016-2032)
- Figure 120: Latin America Energy Engineering Services Outsourcing (ESO) Market Market Y-o-Y Growth Rate Comparison by By Service (2016-2032)
- Figure 121: Latin America Energy Engineering Services Outsourcing (ESO) Market Market Y-o-Y Growth Rate Comparison by By Location (2016-2032)
- Figure 122: Latin America Energy Engineering Services Outsourcing (ESO) Market Market Y-o-Y Growth Rate Comparison by By Energy Source (2016-2032)
- Figure 123: Latin America Energy Engineering Services Outsourcing (ESO) Market Market Share Comparison by Country (2016-2032)
- Figure 124: Latin America Energy Engineering Services Outsourcing (ESO) Market Market Share Comparison by By Service (2016-2032)
- Figure 125: Latin America Energy Engineering Services Outsourcing (ESO) Market Market Share Comparison by By Location (2016-2032)
- Figure 126: Latin America Energy Engineering Services Outsourcing (ESO) Market Market Share Comparison by By Energy Source (2016-2032)
- Figure 127: Middle East & Africa Energy Engineering Services Outsourcing (ESO) Market Revenue (US$ Mn) Market Share by By Servicein 2022
- Figure 128: Middle East & Africa Energy Engineering Services Outsourcing (ESO) Market Market Attractiveness Analysis by By Service, 2016-2032
- Figure 129: Middle East & Africa Energy Engineering Services Outsourcing (ESO) Market Revenue (US$ Mn) Market Share by By Locationin 2022
- Figure 130: Middle East & Africa Energy Engineering Services Outsourcing (ESO) Market Market Attractiveness Analysis by By Location, 2016-2032
- Figure 131: Middle East & Africa Energy Engineering Services Outsourcing (ESO) Market Revenue (US$ Mn) Market Share by By Energy Sourcein 2022
- Figure 132: Middle East & Africa Energy Engineering Services Outsourcing (ESO) Market Market Attractiveness Analysis by By Energy Source, 2016-2032
- Figure 133: Middle East & Africa Energy Engineering Services Outsourcing (ESO) Market Revenue (US$ Mn) Market Share by Country in 2022
- Figure 134: Middle East & Africa Energy Engineering Services Outsourcing (ESO) Market Market Attractiveness Analysis by Country, 2016-2032
- Figure 135: Middle East & Africa Energy Engineering Services Outsourcing (ESO) Market Market Revenue (US$ Mn) (2016-2032)
- Figure 136: Middle East & Africa Energy Engineering Services Outsourcing (ESO) Market Market Revenue (US$ Mn) Comparison by Country (2016-2032)
- Figure 137: Middle East & Africa Energy Engineering Services Outsourcing (ESO) Market Market Revenue (US$ Mn) Comparison by By Service (2016-2032)
- Figure 138: Middle East & Africa Energy Engineering Services Outsourcing (ESO) Market Market Revenue (US$ Mn) Comparison by By Location (2016-2032)
- Figure 139: Middle East & Africa Energy Engineering Services Outsourcing (ESO) Market Market Revenue (US$ Mn) Comparison by By Energy Source (2016-2032)
- Figure 140: Middle East & Africa Energy Engineering Services Outsourcing (ESO) Market Market Y-o-Y Growth Rate Comparison by Country (2016-2032)
- Figure 141: Middle East & Africa Energy Engineering Services Outsourcing (ESO) Market Market Y-o-Y Growth Rate Comparison by By Service (2016-2032)
- Figure 142: Middle East & Africa Energy Engineering Services Outsourcing (ESO) Market Market Y-o-Y Growth Rate Comparison by By Location (2016-2032)
- Figure 143: Middle East & Africa Energy Engineering Services Outsourcing (ESO) Market Market Y-o-Y Growth Rate Comparison by By Energy Source (2016-2032)
- Figure 144: Middle East & Africa Energy Engineering Services Outsourcing (ESO) Market Market Share Comparison by Country (2016-2032)
- Figure 145: Middle East & Africa Energy Engineering Services Outsourcing (ESO) Market Market Share Comparison by By Service (2016-2032)
- Figure 146: Middle East & Africa Energy Engineering Services Outsourcing (ESO) Market Market Share Comparison by By Location (2016-2032)
- Figure 147: Middle East & Africa Energy Engineering Services Outsourcing (ESO) Market Market Share Comparison by By Energy Source (2016-2032)
"
- List of Tables
- "
- Table 1: Global Energy Engineering Services Outsourcing (ESO) Market Market Comparison by By Service (2016-2032)
- Table 2: Global Energy Engineering Services Outsourcing (ESO) Market Market Comparison by By Location (2016-2032)
- Table 3: Global Energy Engineering Services Outsourcing (ESO) Market Market Comparison by By Energy Source (2016-2032)
- Table 4: Global Energy Engineering Services Outsourcing (ESO) Market Revenue (US$ Mn) Comparison by Region (2016-2032)
- Table 5: Global Energy Engineering Services Outsourcing (ESO) Market Market Revenue (US$ Mn) (2016-2032)
- Table 6: Global Energy Engineering Services Outsourcing (ESO) Market Market Revenue (US$ Mn) Comparison by Region (2016-2032)
- Table 7: Global Energy Engineering Services Outsourcing (ESO) Market Market Revenue (US$ Mn) Comparison by By Service (2016-2032)
- Table 8: Global Energy Engineering Services Outsourcing (ESO) Market Market Revenue (US$ Mn) Comparison by By Location (2016-2032)
- Table 9: Global Energy Engineering Services Outsourcing (ESO) Market Market Revenue (US$ Mn) Comparison by By Energy Source (2016-2032)
- Table 10: Global Energy Engineering Services Outsourcing (ESO) Market Market Y-o-Y Growth Rate Comparison by Region (2016-2032)
- Table 11: Global Energy Engineering Services Outsourcing (ESO) Market Market Y-o-Y Growth Rate Comparison by By Service (2016-2032)
- Table 12: Global Energy Engineering Services Outsourcing (ESO) Market Market Y-o-Y Growth Rate Comparison by By Location (2016-2032)
- Table 13: Global Energy Engineering Services Outsourcing (ESO) Market Market Y-o-Y Growth Rate Comparison by By Energy Source (2016-2032)
- Table 14: Global Energy Engineering Services Outsourcing (ESO) Market Market Share Comparison by Region (2016-2032)
- Table 15: Global Energy Engineering Services Outsourcing (ESO) Market Market Share Comparison by By Service (2016-2032)
- Table 16: Global Energy Engineering Services Outsourcing (ESO) Market Market Share Comparison by By Location (2016-2032)
- Table 17: Global Energy Engineering Services Outsourcing (ESO) Market Market Share Comparison by By Energy Source (2016-2032)
- Table 18: North America Energy Engineering Services Outsourcing (ESO) Market Market Comparison by By Location (2016-2032)
- Table 19: North America Energy Engineering Services Outsourcing (ESO) Market Market Comparison by By Energy Source (2016-2032)
- Table 20: North America Energy Engineering Services Outsourcing (ESO) Market Revenue (US$ Mn) Comparison by Country (2016-2032)
- Table 21: North America Energy Engineering Services Outsourcing (ESO) Market Market Revenue (US$ Mn) (2016-2032)
- Table 22: North America Energy Engineering Services Outsourcing (ESO) Market Market Revenue (US$ Mn) Comparison by Country (2016-2032)
- Table 23: North America Energy Engineering Services Outsourcing (ESO) Market Market Revenue (US$ Mn) Comparison by By Service (2016-2032)
- Table 24: North America Energy Engineering Services Outsourcing (ESO) Market Market Revenue (US$ Mn) Comparison by By Location (2016-2032)
- Table 25: North America Energy Engineering Services Outsourcing (ESO) Market Market Revenue (US$ Mn) Comparison by By Energy Source (2016-2032)
- Table 26: North America Energy Engineering Services Outsourcing (ESO) Market Market Y-o-Y Growth Rate Comparison by Country (2016-2032)
- Table 27: North America Energy Engineering Services Outsourcing (ESO) Market Market Y-o-Y Growth Rate Comparison by By Service (2016-2032)
- Table 28: North America Energy Engineering Services Outsourcing (ESO) Market Market Y-o-Y Growth Rate Comparison by By Location (2016-2032)
- Table 29: North America Energy Engineering Services Outsourcing (ESO) Market Market Y-o-Y Growth Rate Comparison by By Energy Source (2016-2032)
- Table 30: North America Energy Engineering Services Outsourcing (ESO) Market Market Share Comparison by Country (2016-2032)
- Table 31: North America Energy Engineering Services Outsourcing (ESO) Market Market Share Comparison by By Service (2016-2032)
- Table 32: North America Energy Engineering Services Outsourcing (ESO) Market Market Share Comparison by By Location (2016-2032)
- Table 33: North America Energy Engineering Services Outsourcing (ESO) Market Market Share Comparison by By Energy Source (2016-2032)
- Table 34: Western Europe Energy Engineering Services Outsourcing (ESO) Market Market Comparison by By Service (2016-2032)
- Table 35: Western Europe Energy Engineering Services Outsourcing (ESO) Market Market Comparison by By Location (2016-2032)
- Table 36: Western Europe Energy Engineering Services Outsourcing (ESO) Market Market Comparison by By Energy Source (2016-2032)
- Table 37: Western Europe Energy Engineering Services Outsourcing (ESO) Market Revenue (US$ Mn) Comparison by Country (2016-2032)
- Table 38: Western Europe Energy Engineering Services Outsourcing (ESO) Market Market Revenue (US$ Mn) (2016-2032)
- Table 39: Western Europe Energy Engineering Services Outsourcing (ESO) Market Market Revenue (US$ Mn) Comparison by Country (2016-2032)
- Table 40: Western Europe Energy Engineering Services Outsourcing (ESO) Market Market Revenue (US$ Mn) Comparison by By Service (2016-2032)
- Table 41: Western Europe Energy Engineering Services Outsourcing (ESO) Market Market Revenue (US$ Mn) Comparison by By Location (2016-2032)
- Table 42: Western Europe Energy Engineering Services Outsourcing (ESO) Market Market Revenue (US$ Mn) Comparison by By Energy Source (2016-2032)
- Table 43: Western Europe Energy Engineering Services Outsourcing (ESO) Market Market Y-o-Y Growth Rate Comparison by Country (2016-2032)
- Table 44: Western Europe Energy Engineering Services Outsourcing (ESO) Market Market Y-o-Y Growth Rate Comparison by By Service (2016-2032)
- Table 45: Western Europe Energy Engineering Services Outsourcing (ESO) Market Market Y-o-Y Growth Rate Comparison by By Location (2016-2032)
- Table 46: Western Europe Energy Engineering Services Outsourcing (ESO) Market Market Y-o-Y Growth Rate Comparison by By Energy Source (2016-2032)
- Table 47: Western Europe Energy Engineering Services Outsourcing (ESO) Market Market Share Comparison by Country (2016-2032)
- Table 48: Western Europe Energy Engineering Services Outsourcing (ESO) Market Market Share Comparison by By Service (2016-2032)
- Table 49: Western Europe Energy Engineering Services Outsourcing (ESO) Market Market Share Comparison by By Location (2016-2032)
- Table 50: Western Europe Energy Engineering Services Outsourcing (ESO) Market Market Share Comparison by By Energy Source (2016-2032)
- Table 51: Eastern Europe Energy Engineering Services Outsourcing (ESO) Market Market Comparison by By Service (2016-2032)
- Table 52: Eastern Europe Energy Engineering Services Outsourcing (ESO) Market Market Comparison by By Location (2016-2032)
- Table 53: Eastern Europe Energy Engineering Services Outsourcing (ESO) Market Market Comparison by By Energy Source (2016-2032)
- Table 54: Eastern Europe Energy Engineering Services Outsourcing (ESO) Market Revenue (US$ Mn) Comparison by Country (2016-2032)
- Table 55: Eastern Europe Energy Engineering Services Outsourcing (ESO) Market Market Revenue (US$ Mn) (2016-2032)
- Table 56: Eastern Europe Energy Engineering Services Outsourcing (ESO) Market Market Revenue (US$ Mn) Comparison by Country (2016-2032)
- Table 57: Eastern Europe Energy Engineering Services Outsourcing (ESO) Market Market Revenue (US$ Mn) Comparison by By Service (2016-2032)
- Table 58: Eastern Europe Energy Engineering Services Outsourcing (ESO) Market Market Revenue (US$ Mn) Comparison by By Location (2016-2032)
- Table 59: Eastern Europe Energy Engineering Services Outsourcing (ESO) Market Market Revenue (US$ Mn) Comparison by By Energy Source (2016-2032)
- Table 60: Eastern Europe Energy Engineering Services Outsourcing (ESO) Market Market Y-o-Y Growth Rate Comparison by Country (2016-2032)
- Table 61: Eastern Europe Energy Engineering Services Outsourcing (ESO) Market Market Y-o-Y Growth Rate Comparison by By Service (2016-2032)
- Table 62: Eastern Europe Energy Engineering Services Outsourcing (ESO) Market Market Y-o-Y Growth Rate Comparison by By Location (2016-2032)
- Table 63: Eastern Europe Energy Engineering Services Outsourcing (ESO) Market Market Y-o-Y Growth Rate Comparison by By Energy Source (2016-2032)
- Table 64: Eastern Europe Energy Engineering Services Outsourcing (ESO) Market Market Share Comparison by Country (2016-2032)
- Table 65: Eastern Europe Energy Engineering Services Outsourcing (ESO) Market Market Share Comparison by By Service (2016-2032)
- Table 66: Eastern Europe Energy Engineering Services Outsourcing (ESO) Market Market Share Comparison by By Location (2016-2032)
- Table 67: Eastern Europe Energy Engineering Services Outsourcing (ESO) Market Market Share Comparison by By Energy Source (2016-2032)
- Table 68: APAC Energy Engineering Services Outsourcing (ESO) Market Market Comparison by By Service (2016-2032)
- Table 69: APAC Energy Engineering Services Outsourcing (ESO) Market Market Comparison by By Location (2016-2032)
- Table 70: APAC Energy Engineering Services Outsourcing (ESO) Market Market Comparison by By Energy Source (2016-2032)
- Table 71: APAC Energy Engineering Services Outsourcing (ESO) Market Revenue (US$ Mn) Comparison by Country (2016-2032)
- Table 72: APAC Energy Engineering Services Outsourcing (ESO) Market Market Revenue (US$ Mn) (2016-2032)
- Table 73: APAC Energy Engineering Services Outsourcing (ESO) Market Market Revenue (US$ Mn) Comparison by Country (2016-2032)
- Table 74: APAC Energy Engineering Services Outsourcing (ESO) Market Market Revenue (US$ Mn) Comparison by By Service (2016-2032)
- Table 75: APAC Energy Engineering Services Outsourcing (ESO) Market Market Revenue (US$ Mn) Comparison by By Location (2016-2032)
- Table 76: APAC Energy Engineering Services Outsourcing (ESO) Market Market Revenue (US$ Mn) Comparison by By Energy Source (2016-2032)
- Table 77: APAC Energy Engineering Services Outsourcing (ESO) Market Market Y-o-Y Growth Rate Comparison by Country (2016-2032)
- Table 78: APAC Energy Engineering Services Outsourcing (ESO) Market Market Y-o-Y Growth Rate Comparison by By Service (2016-2032)
- Table 79: APAC Energy Engineering Services Outsourcing (ESO) Market Market Y-o-Y Growth Rate Comparison by By Location (2016-2032)
- Table 80: APAC Energy Engineering Services Outsourcing (ESO) Market Market Y-o-Y Growth Rate Comparison by By Energy Source (2016-2032)
- Table 81: APAC Energy Engineering Services Outsourcing (ESO) Market Market Share Comparison by Country (2016-2032)
- Table 82: APAC Energy Engineering Services Outsourcing (ESO) Market Market Share Comparison by By Service (2016-2032)
- Table 83: APAC Energy Engineering Services Outsourcing (ESO) Market Market Share Comparison by By Location (2016-2032)
- Table 84: APAC Energy Engineering Services Outsourcing (ESO) Market Market Share Comparison by By Energy Source (2016-2032)
- Table 85: Latin America Energy Engineering Services Outsourcing (ESO) Market Market Comparison by By Service (2016-2032)
- Table 86: Latin America Energy Engineering Services Outsourcing (ESO) Market Market Comparison by By Location (2016-2032)
- Table 87: Latin America Energy Engineering Services Outsourcing (ESO) Market Market Comparison by By Energy Source (2016-2032)
- Table 88: Latin America Energy Engineering Services Outsourcing (ESO) Market Revenue (US$ Mn) Comparison by Country (2016-2032)
- Table 89: Latin America Energy Engineering Services Outsourcing (ESO) Market Market Revenue (US$ Mn) (2016-2032)
- Table 90: Latin America Energy Engineering Services Outsourcing (ESO) Market Market Revenue (US$ Mn) Comparison by Country (2016-2032)
- Table 91: Latin America Energy Engineering Services Outsourcing (ESO) Market Market Revenue (US$ Mn) Comparison by By Service (2016-2032)
- Table 92: Latin America Energy Engineering Services Outsourcing (ESO) Market Market Revenue (US$ Mn) Comparison by By Location (2016-2032)
- Table 93: Latin America Energy Engineering Services Outsourcing (ESO) Market Market Revenue (US$ Mn) Comparison by By Energy Source (2016-2032)
- Table 94: Latin America Energy Engineering Services Outsourcing (ESO) Market Market Y-o-Y Growth Rate Comparison by Country (2016-2032)
- Table 95: Latin America Energy Engineering Services Outsourcing (ESO) Market Market Y-o-Y Growth Rate Comparison by By Service (2016-2032)
- Table 96: Latin America Energy Engineering Services Outsourcing (ESO) Market Market Y-o-Y Growth Rate Comparison by By Location (2016-2032)
- Table 97: Latin America Energy Engineering Services Outsourcing (ESO) Market Market Y-o-Y Growth Rate Comparison by By Energy Source (2016-2032)
- Table 98: Latin America Energy Engineering Services Outsourcing (ESO) Market Market Share Comparison by Country (2016-2032)
- Table 99: Latin America Energy Engineering Services Outsourcing (ESO) Market Market Share Comparison by By Service (2016-2032)
- Table 100: Latin America Energy Engineering Services Outsourcing (ESO) Market Market Share Comparison by By Location (2016-2032)
- Table 101: Latin America Energy Engineering Services Outsourcing (ESO) Market Market Share Comparison by By Energy Source (2016-2032)
- Table 102: Middle East & Africa Energy Engineering Services Outsourcing (ESO) Market Market Comparison by By Service (2016-2032)
- Table 103: Middle East & Africa Energy Engineering Services Outsourcing (ESO) Market Market Comparison by By Location (2016-2032)
- Table 104: Middle East & Africa Energy Engineering Services Outsourcing (ESO) Market Market Comparison by By Energy Source (2016-2032)
- Table 105: Middle East & Africa Energy Engineering Services Outsourcing (ESO) Market Revenue (US$ Mn) Comparison by Country (2016-2032)
- Table 106: Middle East & Africa Energy Engineering Services Outsourcing (ESO) Market Market Revenue (US$ Mn) (2016-2032)
- Table 107: Middle East & Africa Energy Engineering Services Outsourcing (ESO) Market Market Revenue (US$ Mn) Comparison by Country (2016-2032)
- Table 108: Middle East & Africa Energy Engineering Services Outsourcing (ESO) Market Market Revenue (US$ Mn) Comparison by By Service (2016-2032)
- Table 109: Middle East & Africa Energy Engineering Services Outsourcing (ESO) Market Market Revenue (US$ Mn) Comparison by By Location (2016-2032)
- Table 110: Middle East & Africa Energy Engineering Services Outsourcing (ESO) Market Market Revenue (US$ Mn) Comparison by By Energy Source (2016-2032)
- Table 111: Middle East & Africa Energy Engineering Services Outsourcing (ESO) Market Market Y-o-Y Growth Rate Comparison by Country (2016-2032)
- Table 112: Middle East & Africa Energy Engineering Services Outsourcing (ESO) Market Market Y-o-Y Growth Rate Comparison by By Service (2016-2032)
- Table 113: Middle East & Africa Energy Engineering Services Outsourcing (ESO) Market Market Y-o-Y Growth Rate Comparison by By Location (2016-2032)
- Table 114: Middle East & Africa Energy Engineering Services Outsourcing (ESO) Market Market Y-o-Y Growth Rate Comparison by By Energy Source (2016-2032)
- Table 115: Middle East & Africa Energy Engineering Services Outsourcing (ESO) Market Market Share Comparison by Country (2016-2032)
- Table 116: Middle East & Africa Energy Engineering Services Outsourcing (ESO) Market Market Share Comparison by By Service (2016-2032)
- Table 117: Middle East & Africa Energy Engineering Services Outsourcing (ESO) Market Market Share Comparison by By Location (2016-2032)
- Table 118: Middle East & Africa Energy Engineering Services Outsourcing (ESO) Market Market Share Comparison by By Energy Source (2016-2032)
- 1. Executive Summary
-
- Semcon
- STATS
- Total OutSource, Inc.
- Cubic Corporation
- Segula Technologies
- QUEST GLOBAL
- Rilco Engineering Services
- Mott MacDonald
- LUXOFT, A DXC TECHNOLOGY COMPANY
- ESI Group
- Cyient
- Capgemini Engineering (Altran)
- Alten Group
- Assystem
- Altair Engineering Inc.
- HCL Technologies Limited
- Tech Mahindra Limited
- Wipro Limited
- Tata Consultancy Services Limited
- Cybage Software Pvt. Ltd.
Our Clients


View Our Licence Options
