
Electronic Toll Collection Market By Type (Automatic Vehicle Classification (AVC) and Violation Enforcement System (VES)), By Technology (Radio Frequency Identification (RFID), Dedicated Short Range Communication (DSRC), Others), By End-user (Highway, Urban Area), By Region And Companies - Industry Segment Outlook, Market Assessment, Competition Scenario, Trends, And Forecast 2023-2032
-
8610
-
July 2023
-
512
-


-
This report was compiled by Vishwa Gaul Vishwa is an experienced market research and consulting professional with over 8 years of expertise in the ICT industry, contributing to over 700 reports across telecommunications, software, hardware, and digital solutions. Correspondence Team Lead- ICT Linkedin | Detailed Market research Methodology Our methodology involves a mix of primary research, including interviews with leading mental health experts, and secondary research from reputable medical journals and databases. View Detailed Methodology Page
-
Quick Navigation
Report Overview
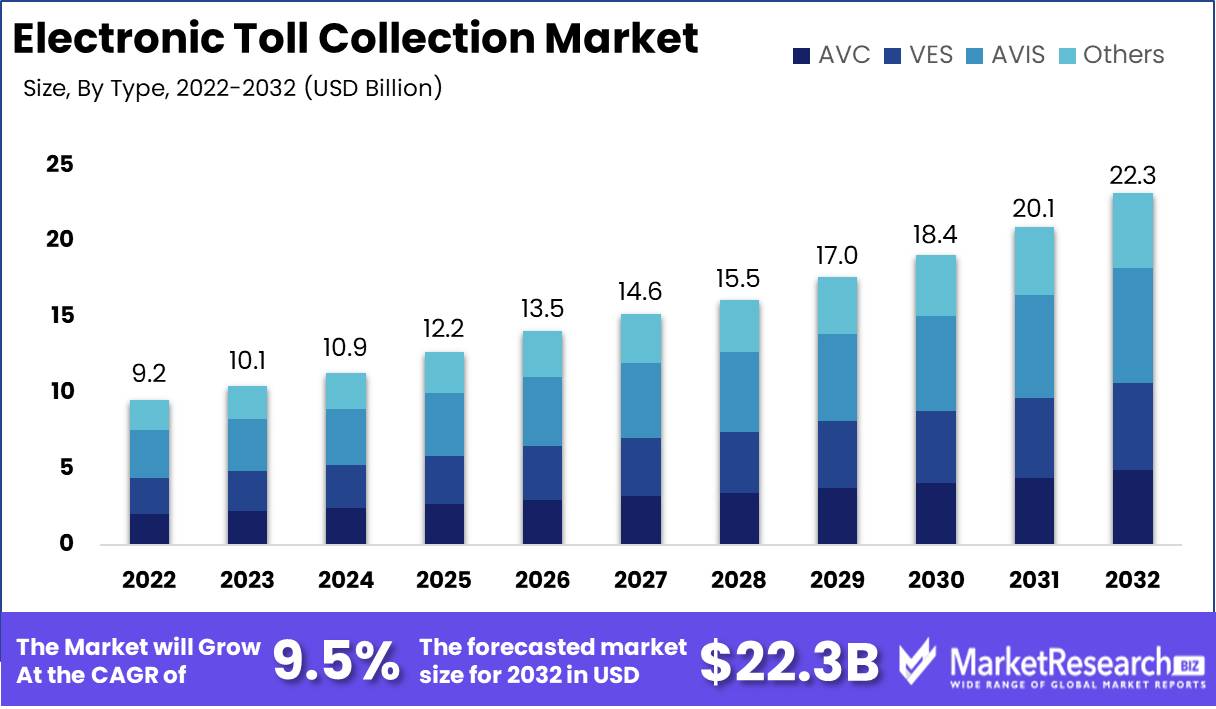
Electronic Toll Collection Market size is expected to be worth around USD 22.3 Bn by 2032 from USD 9.2 Bn in 2022, growing at a CAGR of 9.5% during the forecast period from 2023 to 2032.
The Electronic Toll Collection is expanding quickly and entering the mainstream. In recent years, significant investments and innovations on this market have made it a popular option for businesses. In this blog post, we will examine the Electronic Toll Collection Market in greater detail. Increasing demand for efficient toll collection systems, growing technological advancements in the transportation industry, and rising demand for intelligent transportation are driving the market's expansion. The growing need to reduce traffic congestion and improve traffic management is also a factor in market expansion.
Electronic Toll Collection (ETC) is the automated collection of vehicle levies. It is a system that collects tolls electronically without requiring physical contact between the vehicle and tolling system. The objectives of the Electronic Toll Collection Market are to increase the efficiency of toll collection, decrease traffic congestion, and improve commuters' overall driving experience.
The Electronic Toll Collection Market has a number of advantages over conventional toll collection techniques. These advantages include improved traffic flow, shorter wait times, and increased security due to the elimination of cash transactions. ETC systems also provide a more expedient method of travel for commuters, as they eliminate the need to halt at toll plazas. This system decreases fuel consumption and vehicle emissions, which is environmentally beneficial.
The Electronic Toll Collection Market has witnessed numerous innovations. The most significant innovation is the creation of RFID (Radio Frequency Identification) technology, which enables the automatic collection of tolls using an electronic device affixed to the vehicle. The integration of GPS (Global Positioning System) and mobile applications that enable vehicles to pay tolls without halting is a further innovation of note. These innovations have substantially increased the effectiveness of toll collection, thereby enhancing the transportation experience as a whole.
Driving factors
Traffic Administration
Traffic management is one of the leading market drivers for ETC. Congestion on roads can result in significant delays, a rise in petroleum consumption, and an increase in vehicle emissions. ETC systems offer an efficient way to collect tolls from vehicles without requiring them to halt at a toll kiosk. By eliminating the need for vehicles to halt, highway traffic flow can be significantly enhanced. This, in turn, decreases traffic congestion and improves the commuter traveling experience.
RFID and GPS Innovations
RFID and GPS technologies have advanced significantly over the past decade, and this has been essential to the expansion of the ETC market. Attaching RFID identifiers to vehicles enables seamless toll collection without the need for currency transactions. GPS technology enhances the precision of the toll collection system, thereby reducing the likelihood of errors. The maintenance and administration costs of ETC systems have decreased as a result of advancements in RFID and GPS technology, making them more accessible to a greater number of people worldwide.
Government Programs
As a means of reducing traffic congestion, enhancing public transport systems, and promoting sustainable transportation, governments around the globe have taken a particular interest in the deployment of ETC systems. Governments have played a significant role in the development of infrastructure required for ETC systems, including the implementation of gantries, RFID readers, and other essential apparatus. In addition, governments have been providing tax incentives to ETC system developers to encourage innovation and market expansion.
Electronic Payment Implementation
The rise in electronic payment methods has been crucial to the expansion of the ETC market. In recent years, electronic payment adoption has increased as a growing number of individuals abandon traditional cash-based payment methods. ETC systems permit seamless integration with a variety of electronic payment platforms, such as credit cards, debit cards, and mobile payment platforms. This has made ETC systems simpler to use, resulting in increased adoption rates.
Restraining Factors
Expensive Investment Costs
The high costs associated with the installation and administration of ETC systems are a significant factor restraining market growth. The implementation of ETC systems necessitates costly infrastructure modifications, including the installation of sensors, cameras, and other equipment. Moreover, the costs associated with the deployment of ETC systems vary based on the geographic location, terrain, and extant infrastructure, resulting in additional cost disparities. In addition, the costs associated with maintaining and modernizing ETC systems can be substantial, particularly for the government agencies responsible for implementing these systems.
Concerns About Privacy and Data Security
Privacy and data security concerns are significant obstacles that have hindered the ETC system's widespread adoption. The collection of user information, including location, time, and travel frequency, raises privacy concerns among users. If data is not adequately protected, it may fall into the wrong hands, resulting in data breaches and identity theft. In addition, the integration of diverse systems from a variety of vendors creates data interoperability issues that impact data management and security.
Interoperability Difficulties
Another factor restraining the ETC market is the absence of standardization across ETC systems. In the absence of standardization, interoperability issues arise, preventing toll systems from operating seamlessly across multiple regions and countries. This lack of interoperability makes it difficult for public authorities to efficiently administer and monitor the toll collection system, resulting in a greater burden and diminished system effectiveness.
Maintenance Issues
Another significant factor that restrains the ETC market is maintenance issues. ETC systems require ongoing maintenance, such as the cleansing of sensors, the replacement of defective equipment, and system upgrades to accommodate evolving technological advances. Regular maintenance necessitates skilled personnel and technical knowledge, resulting in an increase in operational expenses. Costs associated with system maintenance can be especially high for government agencies, which may lack the budget and resources necessary for effective system maintenance.
Type Analysis
With the growing adoption of Electronic Toll Collection (ETC) systems worldwide, the Automatic Vehicle Identification System (AVIS) segment is currently dominating the market. AVIS makes use of advanced technology to identify vehicles and capture toll payments electronically. It eliminates the need for manual toll collection, reduces traffic congestion, and is also cost-effective. These benefits have spurred its adoption and popularity in several regions across the world.
consumer trends and behavior towards the AVIS segment are rapidly evolving. Drivers are now opting for cashless and faster payment methods, which are enabled by AVIS technology. As a result, there is an increased demand for ETC systems that employ AVIS technology in the market. The AVIS segment is projected to register the fastest growth rate over the forthcoming years. With more countries and companies investing in the development of smart transportation systems, the demand for AVIS technology is expected to increase in the future. The segment's growth is also driven by the increasing concerns over traffic congestion and environmental pollution, which necessitate the adoption of AVIS technology.
Technology Analysis
The Radio-frequency Identification (RFID) segment is currently the dominant technology in the Electronic Toll Collection (ETC) market. RFID uses wireless communication to identify vehicles and capture toll payments electronically. It is an effective technology in reducing traffic congestion and eliminating manual toll collection. It also enables faster and more efficient transactions, making it a popular option in the ETC market.
Consumers are increasingly adopting RFID technology, given its convenience and safety benefits. They prefer cashless payment methods and faster transaction processes, which makes RFID technology an increasingly popular option. Consumers also want an easier and seamless experience during their journeys, making RFID technology an attractive option for them. The RFID segment in the ETC market is also anticipated to register the fastest growth rate over the forthcoming years.
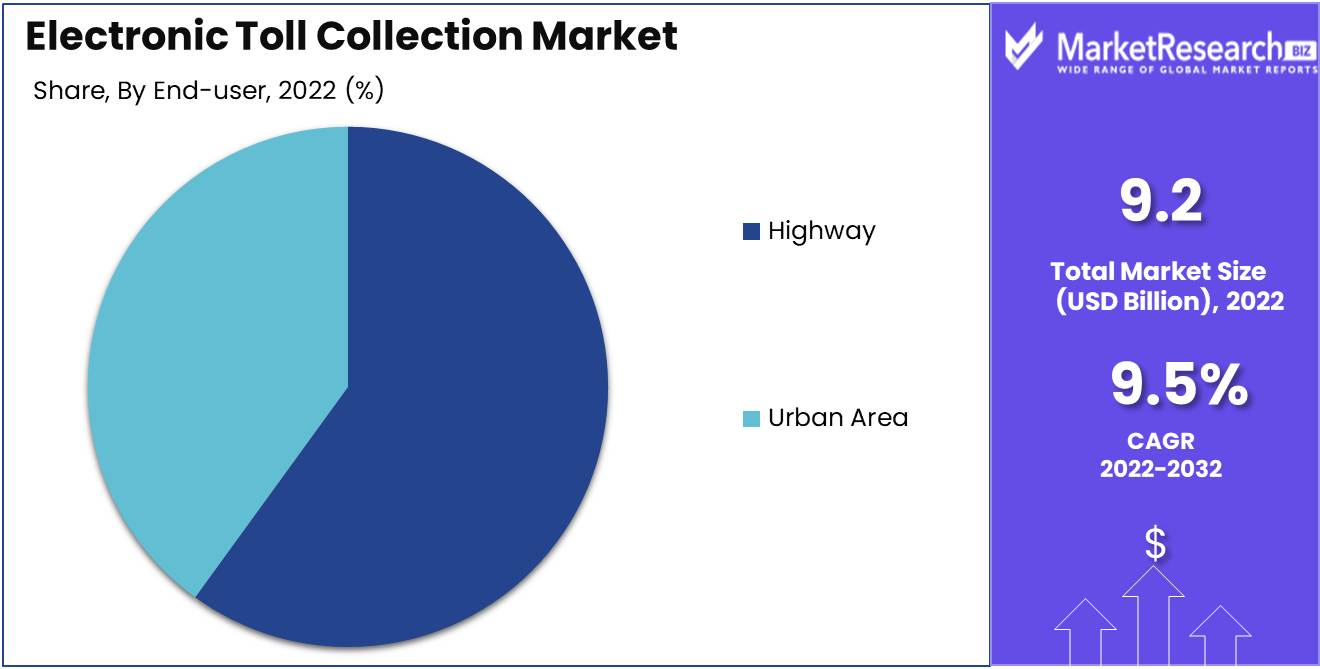
End-user Analysis
The highway segment is currently dominating the Electronic Toll Collection (ETC) market. Highways are the most significant contributors to traffic congestion, making them the logical place for the implementation of ETC systems. The adoption of ETC systems on highways helps in reducing travel time, increasing efficiency, and reducing accidents. Hence, the demand for ETC systems in highways is high.
Consumer trends and behavior towards the highway segment are evolving. Drivers are increasingly opting for faster and more efficient payment methods, such as ETC systems. ETC systems also offer safety benefits by reducing the risk of accidents caused by manual toll collection. The highway segment in the ETC market is predicted to register the fastest growth rate over the forthcoming years. With more governments investing in the development of highway infrastructure, the demand for ETC systems on highways is expected to increase.
Key Market Segments
By Type
- Automatic Vehicle Classification (AVC)
- Violation Enforcement System (VES)
- Automatic Vehicle Identification System (AVIS)
- Others (Transaction Processing/Back Office)
By Technology
- Radio Frequency Identification (RFID)
- Dedicated Short Range Communication (DSRC)
- Global Navigation Satellite System (GNSS)/GPS
- Video Analytics
- Cell Phone Tolling
- Others (Barcode-based ETC)
By End-user
- Highway
- Urban Area
Growth Opportunity
Intelligent Transportation Systems
Integration of intelligent transportation systems represents a turning point for the ETC sector. These systems' integration with ETC enables efficient toll collection, thereby reducing traffic congestion and travel times. In addition, intelligent transportation systems collect valuable data for traffic pattern analysis and road infrastructure optimization, ensuring safer and more efficient travel.
Integration of V2I and V2V
V2I (vehicle-to-infrastructure) communication has the potential to revolutionize the ETC industry. V2I integration alleviates congestion and improves safety by facilitating seamless coordination and efficient traffic flow. Concurrently, vehicle-to-vehicle (V2V) communication ensures harmonious cooperation between vehicles, thereby strengthening the foundations of safe transportation. The integration of V2I and V2V represents a significant evolution step for ETC systems.
Interoperable solutions facilitate seamless travel
Given the prevalence of multiple ETC system suppliers, interoperability becomes a significant factor in the ETC industry. Interoperable solutions enable seamless travel across diverse road networks, reducing travel delays and improving user convenience. With interoperability, motorists can transverse multiple toll roads regardless of their ETC provider, thereby expediting their travels.
The Spark for ETC Growth
Due to their emphasis on infrastructure development and transportation enhancement, emerging economies act as growth drivers for the ETC market. These nations make substantial investments in highways, expressways, and other road networks, necessitating effective toll collection systems. The increasing number of vehicles on the road increases the demand for advanced ETC systems that reduce traffic congestion and guarantee safe and efficient travel.
Meeting Demands for Contactless Payments
The introduction of cashless toll collection is a major milestone for the ETC industry. With the increasing preference for contactless payments, electronic toll collection systems are gaining popularity, allowing for more streamlined and efficient toll collection procedures. Cashless toll collection aligns with evolving consumer expectations by reducing travel time and enhancing user convenience.
Latest Trends
Conversion to electronic tolling systems
Globally, electronic tolling systems are rapidly superseding traditional toll collection methods. With the implementation of electronic tolling systems, the need for tangible toll facilities and barriers has been eliminated, resulting in a substantial increase in traffic flow and a decrease in wait times. The electronic toll collection systems include, among other technologies, Automatic Number Plate Recognition (ANPR), Dedicated Short-Range Communications (DSRC), and Global Positioning System (GPS). The implementation of electronic tolling systems has substantially reduced operational costs and increased toll operators' revenue generation.
RFID Technology Integration in Toll Collection
In Electronic Toll Collection Market, Radio Frequency Identification (RFID) technology is rapidly acquiring prominence. RFID technology employs radio waves to identify and monitor embedded identifiers on objects. RFID technology enhances the accuracy and speed of toll collection, eliminating the need for physical presence and manual currency management. The incorporation of RFID technology provides a number of benefits, including increased efficacy in toll payment, decreased waiting periods, increased accuracy and dependability, and streamlined traffic flow. Additionally eco-friendly, RFID technology eliminates the production and disposal of paper tickets.
Adoption of Mobile Toll Payment Technologies
The increasing prevalence of smartphones and high-speed internet has significantly contributed to the adoption of mobile-based toll payment solutions. The mobile-based toll payment solutions provide a simple and convenient method for paying tolls. For secure and contactless payments, the payment systems employ Near Field Communication (NFC) and Quick Response (QR) codes. It is anticipated that mobile-based toll payment systems will gain traction in developing regions due to the increased prevalence of mobile devices and the demand for cost-effective and efficient transportation solutions.
Electronic toll collection should be expanded
In developing regions, the electronic toll collection market is experiencing a surge in demand, primarily due to the expansion of transport infrastructure and the need for efficient toll collection systems. Significant investments in transportation infrastructure are occurring in developing regions such as Asia-Pacific and the Middle East, resulting in an increase in demand for toll collection systems. Governments in these regions are concentrating on lowering the operational expenses and increasing the revenue generation of toll collection systems. It is anticipated that the expansion of electronic toll collection systems in these regions will substantially improve traffic flow and decrease congestion.
Regional Analysis
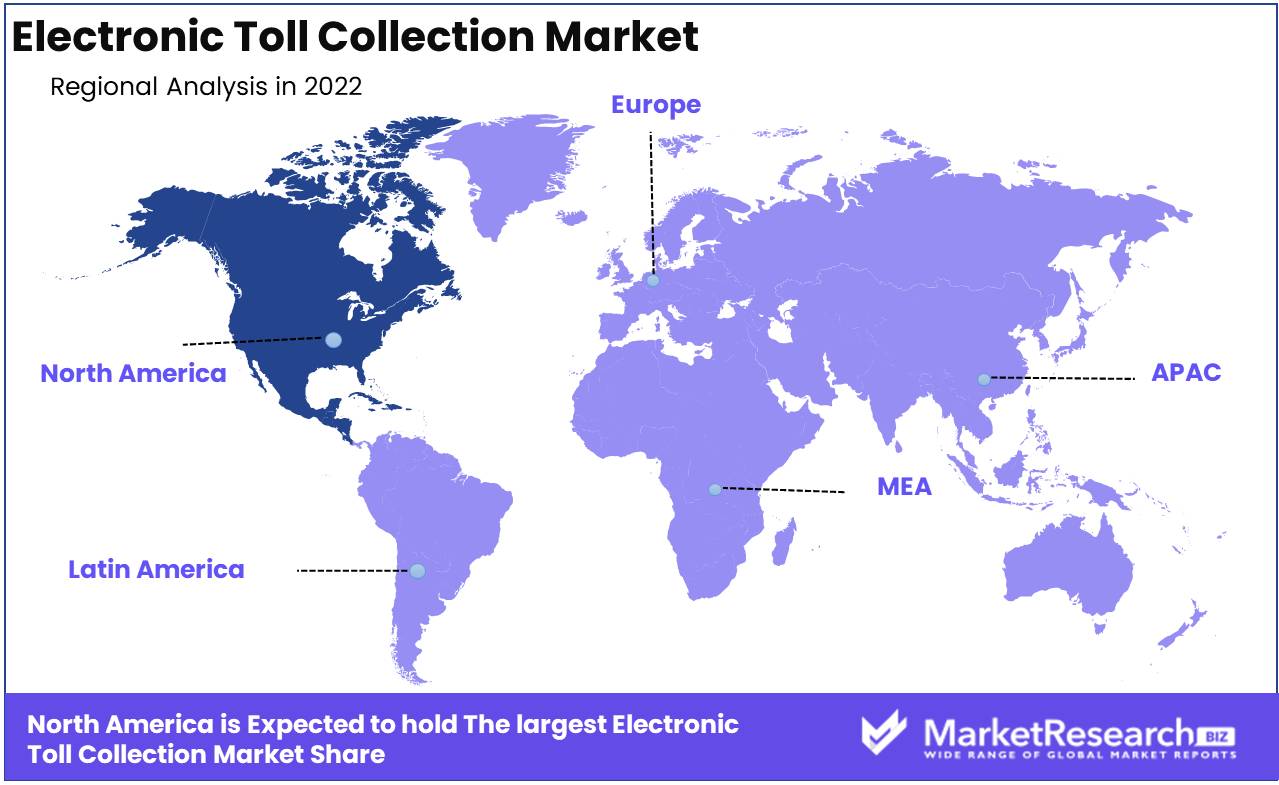
North America Leads Electronic Toll Collection Market. ETC systems are replacing traditional toll collection globally. ETC systems' effectiveness reduces traffic on toll roads and highways. An Electronic Toll Collection (ETC) system lets automobiles pay tolls via wireless transmission without stopping. According to a market analysis, North America controls the worldwide ETC market. The research attributes the region's supremacy to strong economies, substantial road traffic, government infrastructure investment, and sophisticated technology usage.
North America dominates the ETC market because to market drivers, technology breakthroughs and acceptance, and market obstacles. North America's strong economies drive the ETC market. Economic growth and rising disposable income have spurred infrastructure improvements in the region. The market has also grown due to rising car ownership and desire for improved roads.
Technology has also boosted the North American ETC market. GPS and wireless communication devices have enhanced ETC system accuracy and efficiency. Intelligent transportation systems integrate traffic management and road safety, improving road infrastructure.
Next-generation ETC systems were developed in North America due to its early embrace of sophisticated technology. Conduent, TransCore, and Kapsch Trafficcom have spent in R&D to create cutting-edge ETC systems that have transformed toll collection.
Key Regions and Countries
North America
- US
- Canada
- Mexico
Western Europe
- Germany
- France
- The UK
- Spain
- Italy
- Portugal
- Ireland
- Austria
- Switzerland
- Benelux
- Nordic
- Rest of Western Europe
Eastern Europe
- Russia
- Poland
- The Czech Republic
- Greece
- Rest of Eastern Europe
APAC
- China
- Japan
- South Korea
- India
- Australia & New Zealand
- Indonesia
- Malaysia
- Philippines
- Singapore
- Thailand
- Vietnam
- Rest of APAC
Latin America
- Brazil
- Colombia
- Chile
- Argentina
- Costa Rica
- Rest of Latin America
Middle East & Africa
- Algeria
- Egypt
- Israel
- Kuwait
- Nigeria
- Saudi Arabia
- South Africa
- Turkey
- United Arab Emirates
- Rest of MEA
Key Players Analysis
The Electronic Toll Collection (ETC) market is expanding at an unprecedented rate as the demand for quicker, safer, and hassle-free payment methods on toll roads increases. Between 2021 and 2027, the market is anticipated to expand at a lucrative CAGR of over 10%. Conduent, Inc., Thales Group, Kapsch TrafficCom AG, Siemens AG, TransCore Holdings, Inc., and others are among the market's key participants.
Conduent, Inc. is the industry leader in operations management, analytics, and technology-enabled services. The company provides ETC services to governments and private organizations, which aid in optimizing currency administration, reducing operational expenses, and enhancing revenue generation.
The French multinational corporation Thales Group provides intelligent transportation systems and solutions for toll collection, traffic management, and public transport. ETC solutions offered by the company consist of electronic identifiers, reader systems, and back-office systems.
Austria-based Kapsch TrafficCom AG provides intelligent transportation systems and digitalization solutions for toll collection, traffic management, and connected vehicles. The company provides comprehensive ETC solutions for highways, tunnels, and urban areas, including transponders, readers, and payment systems.
Siemens AG is a global technology juggernaut that provides sustainable transportation, intelligent infrastructure, and digital industry solutions. The company provides ETC systems that allow vehicles to electronically pay tolls, thereby minimizing congestion and accelerating traffic flow.
The foremost provider of transportation solutions, including tolling, traffic management, and transit solutions, is TransCore Holdings, Inc. ETC solutions from TransCore include RFID identifiers and readers, sophisticated payment systems, and comprehensive back-office systems.
Top Key Players in Electronic Toll Collection Market
- Robert Bosch GmbH
- Continental AG
- Mitsubishi Heavy Industries Ltd.
- DENSO Corp.
- Leonardo S.p.A.
- NXP Semiconductors N.V.
- Roper Technologies Inc.
- Indra Sistemas S.A.
- Kapsch TrafficCom AG
- Shenzhen Genvict Technologies Co Ltd.
- Danlaw Inc.
- Tecsidel SA
- Savari Inc.
- Star Systems International Ltd.
- Efkon AG
Recent Development
- In November 2020, Kapsch TrafficCom AG (Austria) announced that it had developed an all-new electronic tolling (AET) system for the New York State Thruway Authority (NYSTA), which is now fully operational and in revenue service.
- In May 2021, Conduent, Inc. (US) was awarded an eight-year USD 246 million contract to design and maintain an upgraded system for its transponder-based toll collection system, known as E-ZPass.
- In October 2021, TransCore (US) announced the launch of a new product that allows RVers to travel across the country using only one transponder to pay tolls electronically without stopping at a toll booth.
- In November 2021, SiVA, a Grupo Marhnos company, selected Thales to revolutionize toll collection in Guatemala. Thales will provide its PITZ® (Peage Intelligent Transport Zero) electronic toll collection system to the country's vital Palin-Escuintla toll road corridor.
- In December 2020, In Mexico, Kapsch has been awarded a contract to implement an electronic toll collection system for the “MRO Paquete Noreste” highways in the country's northeastern region. The contract was awarded.
Report Scope:
Report Features Description Market Value (2022) USD 9.2 Bn Forecast Revenue (2032) USD 22.3 Bn CAGR (2023-2032) 9.5% Base Year for Estimation 2022 Historic Period 2016-2022 Forecast Period 2023-2032 Report Coverage Revenue Forecast, Market Dynamics, COVID-19 Impact, Competitive Landscape, Recent Developments Segments Covered By Type (Automatic Vehicle Classification (AVC), Violation Enforcement System (VES), Automatic Vehicle Identification System (AVIS), Others (Transaction Processing/Back Office))
By Technology (Radio Frequency Identification (RFID), Dedicated Short Range Communication (DSRC), Global Navigation Satellite System (GNSS)/GPS, Video Analytics, Cell Phone Tolling, Others (Barcode-based ETC))
By End-user (Highway, Urban Area)Regional Analysis North America – The US, Canada, & Mexico; Western Europe – Germany, France, The UK, Spain, Italy, Portugal, Ireland, Austria, Switzerland, Benelux, Nordic, & Rest of Western Europe; Eastern Europe – Russia, Poland, The Czech Republic, Greece, & Rest of Eastern Europe; APAC – China, Japan, South Korea, India, Australia & New Zealand, Indonesia, Malaysia, Philippines, Singapore, Thailand, Vietnam, & Rest of APAC; Latin America – Brazil, Colombia, Chile, Argentina, Costa Rica, & Rest of Latin America; Middle East & Africa – Algeria, Egypt, Israel, Kuwait, Nigeria, Saudi Arabia, South Africa, Turkey, United Arab Emirates, & Rest of MEA Competitive Landscape Robert Bosch GmbH, Continental AG, Mitsubishi Heavy Industries Ltd., DENSO Corp., Leonardo S.p.A., NXP Semiconductors N.V., Roper Technologies Inc., Indra Sistemas S.A., Kapsch TrafficCom AG, Shenzhen Genvict Technologies Co Ltd., Danlaw Inc., Tecsidel SA, Savari Inc., Star Systems International Ltd., Efkon AG Customization Scope Customization for segments, region/country-level will be provided. Moreover, additional customization can be done based on the requirements. Purchase Options We have three licenses to opt for: Single User License, Multi-User License (Up to 5 Users), Corporate Use License (Unlimited User and Printable PDF) -
-
- Robert Bosch GmbH
- Continental AG
- Mitsubishi Heavy Industries Ltd.
- DENSO Corp.
- Leonardo S.p.A.
- NXP Semiconductors N.V.
- Roper Technologies Inc.
- Indra Sistemas S.A.
- Kapsch TrafficCom AG
- Shenzhen Genvict Technologies Co Ltd.
- Danlaw Inc.
- Tecsidel SA
- Savari Inc.
- Star Systems International Ltd.
- Efkon AG
Our Clients


View Our Licence Options
