
Electrical Bushing Market By Product Type (Oil Impregnated Paper (OIP), Resin Impregnated Paper (RIP) and Others), By Insulation (Porcelain, Polymeric, and Glass), By Voltage (Medium, High, and Extra High Voltage), By Application (Transformer, Switchgear, and Others), By End User (Utilities, Industries, and Others), By Technology, By Region and Companies - Industry Segment Outlook, Market Assessment, Competition Scenario, Trends, and Forecast 2024-2033
-
8811
-
May 2024
-
300
-


-
This report was compiled by Vishwa Gaul Vishwa is an experienced market research and consulting professional with over 8 years of expertise in the ICT industry, contributing to over 700 reports across telecommunications, software, hardware, and digital solutions. Correspondence Team Lead- ICT Linkedin | Detailed Market research Methodology Our methodology involves a mix of primary research, including interviews with leading mental health experts, and secondary research from reputable medical journals and databases. View Detailed Methodology Page
-
Quick Navigation
Report Overview
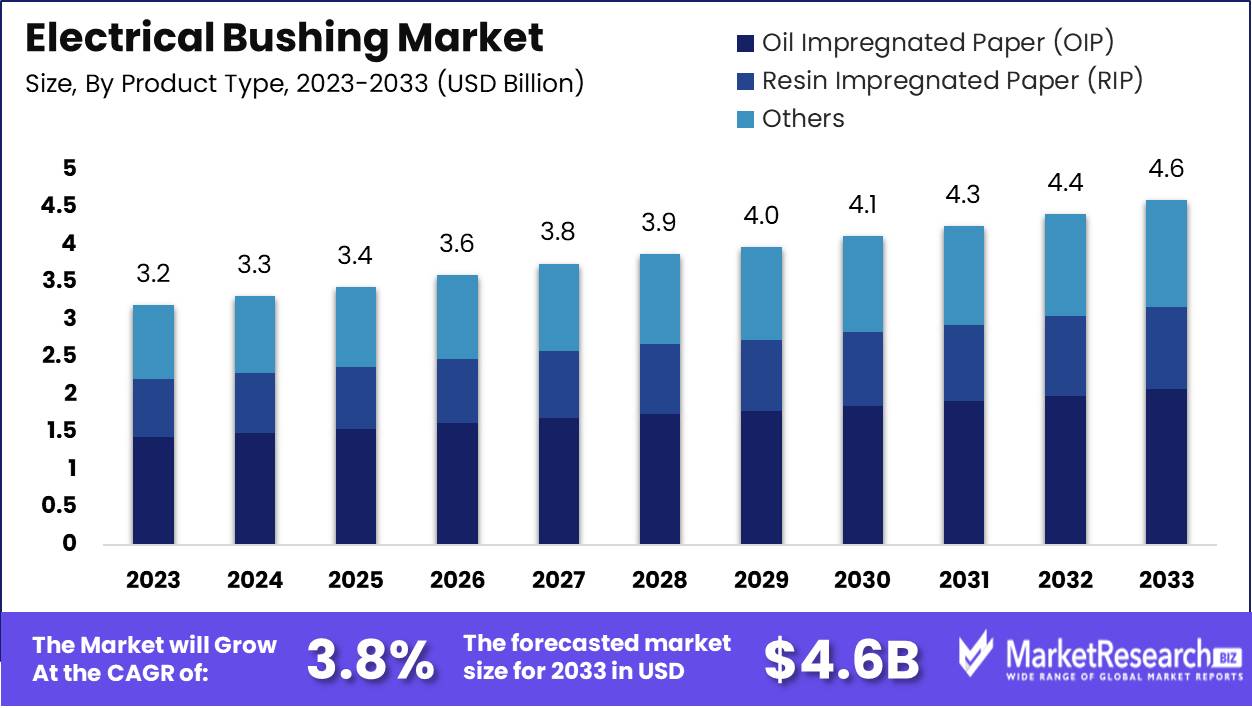
The Electrical Bushing Market was valued at USD 3.2 billion in 2023. It is expected to reach USD 4.6 billion in 2033, with a CAGR of 3.8% during the forecast period from 2024 to 2033.
The surge in demand for integrated insulation bushings and the rapid requirement from the railway and renewable energy industries for electrical equipment are some of the main key factors for the electrical bushing market expansion. The distribution of electricity is carried out in multiple places such as power generation units to commercial setups. Electrical bushing is important and compulsory for the stable distribution of electricity. It has become mandatory because it ensures the safety of both machines and humans.
There are several factors for working together to ensure the safe and efficient flow of electricity into different systems. One such component is the electrical bushing in transformers that carries high voltage of current through enclosed equipment and offers an insulating shield between the live conductor and the electrical apparatus conducting body. These types of electrical bushings are made up of porcelain, epoxy, and some composite materials. The main purposes of such kinds of electrical bushing are electrical insulation, environmental protection, and voltage distribution. The electrical bushings in the transformers allow the live wire, either high- or low-voltage, to generate power out of the transformer.
For example, Transformers have electrical bushing that creates a bridge between the HV windings and the external electrical lines. Such types of electrical bushings must be secure and have an insulated connection for the electricity to pass from the transformer to the other external circuit. It prevents electrical short circuits that could otherwise happen due to the difference in different voltage levels. The transformers are then protected and ensure efficient transmission of the electric power flow. Electrical bushings are an important element in transformers and act as a shielded interface that ensures the consistent and safe workflow of these elements in electrical power distribution systems.
Additionally, the modernization of the present transformers is a substantial factor in the market expansion. The surge in electrification and rise in urbanization of the developing regions will also contribute to market growth. Electrical bushing is a crucial part of the industry as it offers both electrical insulation and structural support. Thus, it safeguards the operations of multiple electrical systems and contributes to the whole functionality of the industrial infrastructure. Such type of industrial requirements will help the electrical bushing market to expand in the coming future.
Key Takeaways
- Market Growth: The electrical bushing market was valued at USD 3.2 billion in 2023. It is expected to reach 4.6 billion in 2033, with a CAGR of 3.8% during the forecast period from 2024 to 2033.
- By Product Type: Oil Impregnated Paper (OIP) dominates the Electrical Bushing Market with reliability and cost-effectiveness.
- By Insulation: Porcelain dominates the Electrical Bushing Market with unmatched durability and reliability.
- By Voltage: In 2023's Electrical Bushing Market is dominated by Medium Voltage, with robust growth.
- By Application: In 2023 Electrical Bushing Market was led by Transformers, driven by technological advancements.
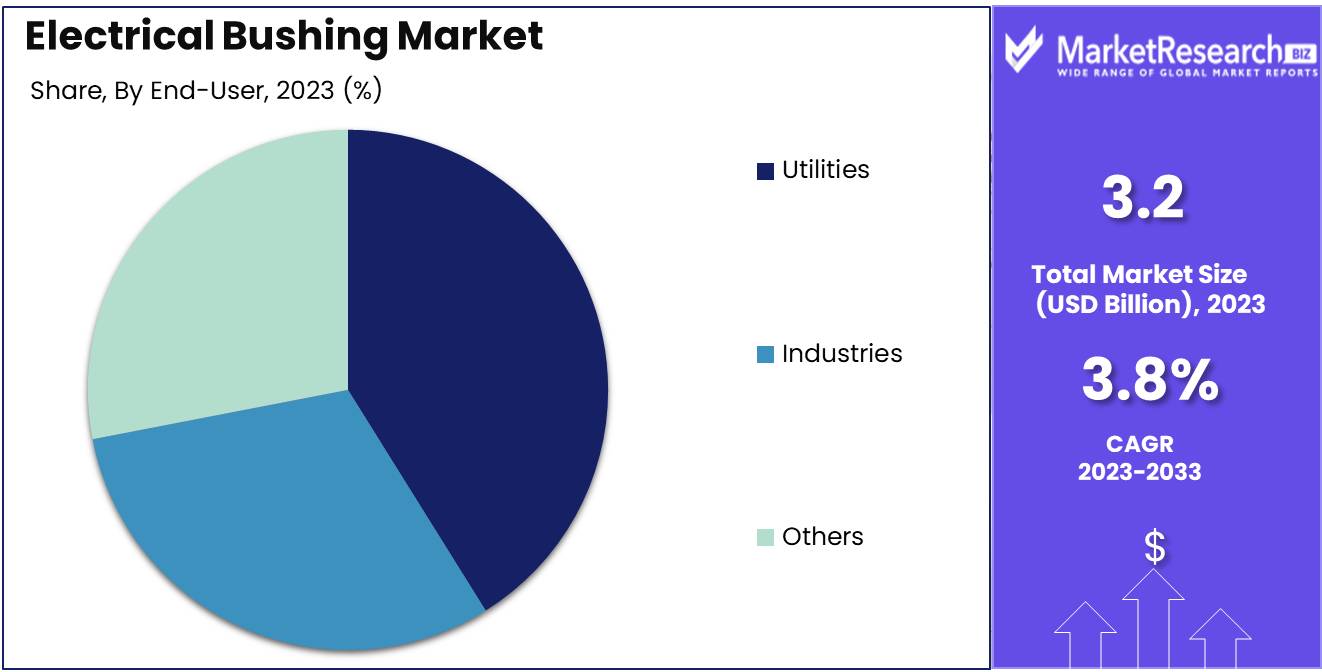
- By End User: In 2023, Utilities dominated, while Industries and Others contributed significantly.
- Regional Dominance: Asia Pacific dominates with a 45% share, driven by rapid industrialization.
- Growth Opportunity: The global electrical bushing market thrives on upgrading infrastructure and meeting rising renewable energy demands.
Driving factors
Growing Power Demand: Energizing the Electrical Bushing Market
The escalating global demand for electricity is a pivotal driver for the growth of the electrical bushing market. As economies expand and urbanization progresses, the consumption of electricity surges, particularly in emerging markets. According to the International Energy Agency, global electricity demand is expected to grow by 2.1% per year through 2040, necessitating substantial investments in electrical infrastructure.
Electrical bushings, essential for safely conducting electricity through the enclosures of high-voltage equipment, see heightened demand driven by this need for expanded electrical capacity. This increased requirement for electrical infrastructure directly correlates with a higher volume of installations of transformers, switchgear, and other distribution equipment, which are integral components requiring bushings for efficient and safe operation.
Expansion and Upgradation of Grid Structure: Creating a Robust Framework for Market Expansion
The expansion and modernization of grid infrastructure worldwide significantly enhance the growth prospects for the electrical bushing market. As nations strive to improve the reliability and efficiency of power distribution, the upgrade of existing grid structures becomes imperative. This factor is particularly pronounced in developed economies where aging power systems pose risks to energy reliability and efficiency.
Simultaneously, in developing regions, the push to electrify rural areas and integrate renewable energy sources into the grid necessitates the building of new infrastructure. These developments lead to increased demand for high-quality electrical bushings, which are crucial for preventing electrical failures and ensuring the longevity of the infrastructure. Additionally, the trend towards smart grids and the integration of digital technologies into grid operations indirectly supports the bushing market by increasing the overall investment in and sophistication of electrical transmission systems.
Industrial Sector Energy Consumption: Fueling Market Demand Through Sector-Specific Needs
The industrial sector's energy consumption also plays a significant role in shaping the demand for electrical bushings. Industries such as manufacturing, mining, and chemicals are heavily reliant on stable and uninterrupted power supply, which requires robust electrical infrastructure. As industrial entities expand, so too does their energy demand, driving the need for specialized electrical equipment, including bushings that can handle high voltages and ensure operational safety.
Moreover, the push towards energy efficiency and sustainability within the sector encourages upgrades to more reliable and efficient electrical systems, further bolstering the market for advanced bushing solutions. This trend is particularly notable in regions experiencing rapid industrial growth, such as Asia-Pacific, where industrial energy consumption is expected to continue its upward trajectory, directly influencing the demand dynamics in the electrical bushing market.
Restraining Factors
Aging Power Systems as a Constraint on Market Expansion
Aging power systems are a significant restraining factor in the electrical bushing market. As infrastructure ages, the risk of system inefficiencies and failures increases, necessitating rigorous maintenance rather than replacement with new technologies that incorporate advanced bushings. This dynamic can slow down the adoption rate of newer, more efficient bushing technologies which are essential for modern electrical systems. Furthermore, the financial burden of upgrading aging systems often leads to prolonged decision cycles by utilities and industries, further impeding the swift integration of new solutions.
Failure Risks Curtailing Technological Adoption
The inherent risk of failure in electrical bushings poses a critical challenge to market growth. Failures can lead to significant operational disruptions and safety hazards, which in turn increase liability concerns for manufacturers and users. This fear of potential failures makes stakeholders cautious about adopting newer bushing technologies, despite their improved performance and safety features. Consequently, the market's growth is restrained as the industry tends to favor proven, albeit older, technologies over innovative solutions that still need to establish a longer track record of reliability.
By Product Type Analysis
Oil Impregnated Paper (OIP) dominates the Electrical Bushing Market with reliability and cost-effectiveness.
In 2023, Oil Impregnated Paper (OIP) held a dominant market position in the "By Product Type" segment of the Electrical Bushing Market. This segment includes Oil Impregnated Paper (OIP), Resin Impregnated Paper (RIP), and other materials. OIP's predominance in the market can be attributed to its proven reliability and cost-effectiveness in high-voltage applications, making it a preferred choice for utility companies and heavy industries.
The Resin Impregnated Paper (RIP), on the other hand, has been gaining traction due to its enhanced mechanical strength and reduced environmental risks compared to OIP. RIP is increasingly favored in regions with stringent environmental regulations and where operational reliability under varying climatic conditions is critical.
The "Others" category includes newer materials and technologies that are being developed to address specific market needs such as higher performance efficiency, lower maintenance costs, and reduced environmental impact. This segment is expected to grow as technological innovations and sustainability criteria become more influential in market dynamics. Each of these product types is evolving in response to the shifting priorities of energy distribution networks and the increasing demand for more durable and ecologically responsible solutions.
By Insulation Analysis
Porcelain dominates the Electrical Bushing Market with unmatched durability and reliability.
In 2023, Porcelain held a dominant market position in the "By Insulation" segment of the Electrical Bushing Market, underscoring its pivotal role amidst alternatives such as polymeric and glass insulations. Porcelain, known for its excellent electrical insulation properties and high mechanical strength, remains the preferred choice in environments demanding robust performance and durability. This material's longevity and resistance to thermal and environmental stresses have solidified its status as a cornerstone in traditional power infrastructure, particularly in high-voltage applications.
On the other hand, the polymeric and glass segments represent innovative adaptations to evolving market needs. Polymeric bushings, favored for their lighter weight and superior flexibility, offer significant advantages in terms of ease of installation and reduced maintenance costs. These features make them particularly suitable for dynamic modern grid systems. Meanwhile, glass, though less common, provides unique aesthetic options and transparency, aligning with niche applications where visual monitoring of internal conditions is beneficial. Each material brings distinct advantages to the table, shaping the competitive landscape of the electrical bushing market.
By Voltage Analysis
In 2023's Electrical Bushing Market: Dominated by Medium Voltage, robust growth.
In 2023, the Electrical Bushing Market saw varying degrees of dominance across different voltage segments, each serving specific operational needs in power infrastructure. The Medium Voltage segment maintained a substantial market share, driven by extensive applications in industrial and urban infrastructure where safety and reliability are critical. This segment benefits from a broad base of established installations and ongoing upgrades to more efficient and safer systems.
Moving to the High Voltage segment, its significance is underscored by the need for robust systems capable of handling the demands of long-distance transmission and substations. This segment's growth is propelled by the expanding reach of grid networks and the integration of renewable energy sources, necessitating advanced bushing solutions that minimize electrical losses and enhance performance.
The Extra High Voltage segment, while more niche, is critical for regions pushing the boundaries of power transmission over vast distances. This segment is essential for interconnecting power grids across countries and continents, facilitating large-scale energy distribution with minimal losses. Innovations in materials and technology in this segment are pivotal, as they directly impact efficiency and system stability in high-demand scenarios. Each segment addresses unique challenges and plays a vital role in the broader landscape of electrical infrastructure development.
By Application Analysis
In 2023 Electrical Bushing Market was led by Transformers, driven by technological advancements.
In 2023, the Electrical Bushing Market saw distinct segmental dominance across various applications, particularly highlighting Transformers, Switchgear, and Other relevant applications.
Transformers, as a primary application, held a dominant market position, reflecting their critical role in basis of voltage regulation and electrical insulation within power systems. This segment benefits significantly from advancements in material science and an increased focus on grid stability in renewable energy transitions. Switchgear, another key segment, also showed substantial growth, driven by the escalating demand for high-voltage transmission systems and the integration of smart grid technologies. This segment's expansion is further supported by investments in infrastructure upgrades and enhanced safety standards.
The 'Others' category, encompassing applications such as generators and capacitors, though smaller, is witnessing innovation-driven growth, particularly in response to the evolving needs for energy-efficient and compact power equipment. Each segment, therefore, presents unique opportunities and challenges, underscored by technological advancements and regulatory frameworks shaping the market dynamics.
By End User Analysis
In 2023, Utilities dominated, while Industries and Others contributed significantly.
In 2023, Utilities held a dominant market position in the Electrical Bushing Market's By End User segment. Utilities, encompassing power generation, transmission, and distribution entities, emerged as the primary consumers of electrical bushings. The sector's reliance on electrical infrastructure for efficient energy delivery drove the demand for bushings, crucial components facilitating safe electrical insulation and power transmission. Moreover, stringent regulatory frameworks emphasizing grid reliability and safety standards further propelled the adoption of advanced bushing technologies within utility networks.
Concurrently, Industries constituted another significant end-user segment, comprising manufacturing, mining, and oil and gas sectors. These industries integrated electrical bushings into their operational frameworks to ensure uninterrupted power supply and safeguard critical equipment against electrical faults.
Additionally, Other end users, including commercial establishments and infrastructure projects, contributed to market growth by incorporating bushings for diverse electrical applications. This robust demand across multiple end-user segments underscores the pivotal role of electrical bushings in sustaining reliable and efficient electrical systems.
Key Market Segments
By Product Type
- Oil Impregnated Paper (OIP)
- Resin Impregnated Paper (RIP)
- Others
By Insulation
- Porcelain
- Polymeric
- Glass
By Voltage
- Medium
- High
- Extra High Voltage
By Application
- Transformer
- Switchgear
- Others
By End User
- Utilities
- Industries
- Others
Growth Opportunity
Upgrading and Modernizing Aging Electrical Infrastructure
The global electrical bushing market stands poised for significant expansion in 2024, primarily fueled by the imperative need to upgrade and modernize aging electrical infrastructure worldwide. As established economies continue to grapple with outdated systems, the demand for efficient and reliable electrical components, including bushings, escalates. With governments and private entities allocating substantial investments toward infrastructure revitalization projects, the electrical bushing market is expected to witness a surge in demand.
According to recent industry analysis, the global electrical bushing market growth can be attributed to the pressing requirement for enhanced grid reliability and resilience, particularly in regions with aging infrastructure. As countries embark on ambitious electrification programs, the role of electrical bushings in ensuring the seamless transmission of electricity becomes increasingly pivotal.
Increasing Demand for Renewable Energy
Furthermore, the escalating demand for renewable energy sources further augments the growth opportunities for the electrical bushing market. As the world transitions toward sustainable energy solutions, there is a burgeoning need for robust electrical systems capable of accommodating the intermittency associated with renewable sources. Electrical bushings play a critical role in facilitating the efficient transmission of power generated from renewable assets such as wind and solar farms.
Recent market studies indicate that the renewable energy sector is poised for exponential growth, with investments reaching unprecedented levels. By capitalizing on this trend, manufacturers in the electrical bushing market can align their product offerings with the evolving needs of renewable energy infrastructure, thereby unlocking new avenues for expansion and innovation.
Latest Trends
Renewable Energy Projects
The burgeoning demand for renewable energy sources continues to propel the Electrical Bushing Market forward. With increasing environmental consciousness and governmental initiatives favoring clean energy, the integration of electrical bushings in renewable energy projects, such as solar and wind farms, has witnessed unprecedented growth. The intricate design and high voltage requirements of these projects necessitate specialized bushings capable of withstanding harsh environmental conditions, thereby driving innovation and expansion within the market.
Modernization of Existing Transformers
Another prominent trend is the modernization drive within the Electrical Bushing Market driven by the imperative to upgrade existing transformer infrastructure. As aging transformers face obsolescence and inefficiencies, utilities and industries are investing in retrofitting and upgrading initiatives to enhance operational efficiency and prolong asset lifespan. This trend not only fosters the adoption of advanced bushing technologies but also presents lucrative opportunities for manufacturers to provide retrofit solutions tailored to the specific needs of diverse transformer installations.
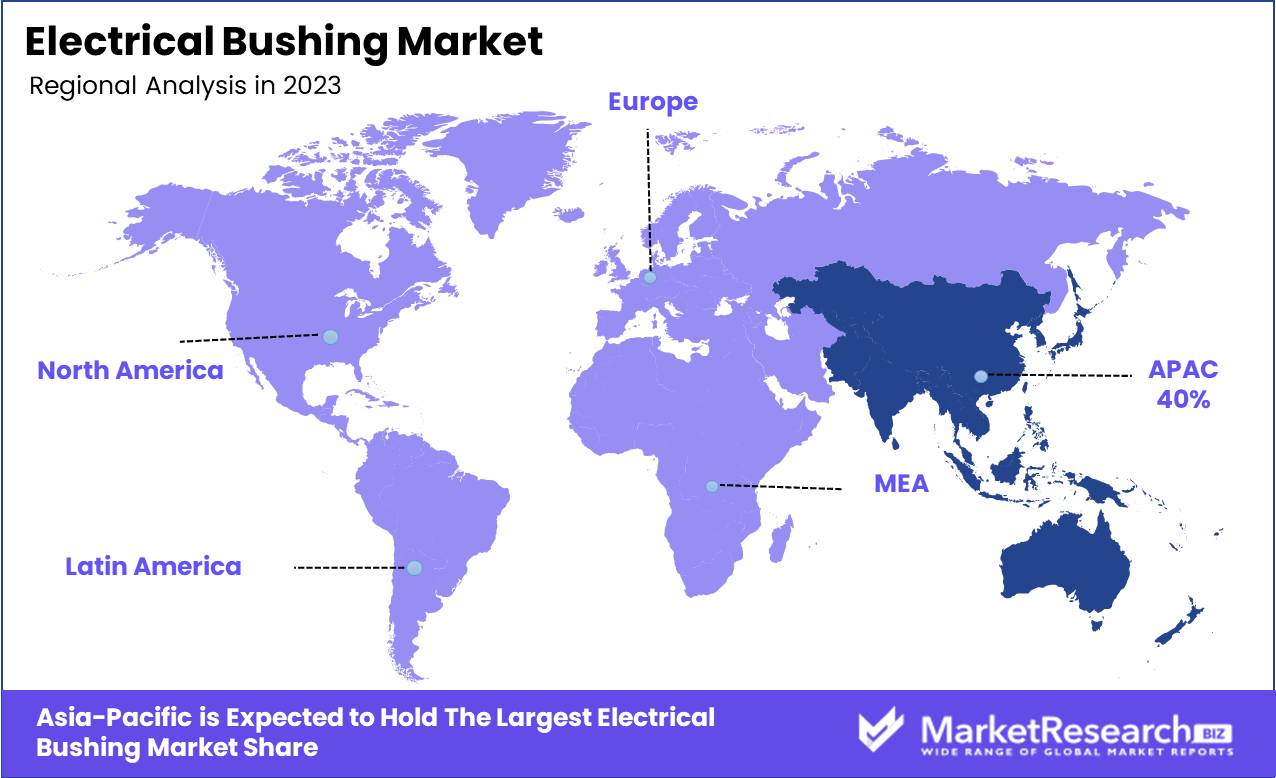
Regional Analysis
Asia Pacific dominates with a 45% share, driven by rapid industrialization.
In North America, the electrical bushing market is marked by steady growth, attributed primarily to robust infrastructural development and ongoing modernization initiatives in the power transmission and distribution sector. Regulatory emphasis on energy efficiency and the adoption of renewable energy sources further bolster market expansion.
Europe showcases a mature market landscape with a focus on upgrading aging power infrastructure, driving demand for advanced bushing technologies. Asia Pacific emerges as the dominating region, spearheading market growth with a significant largest market share attributed to rapid industrialization, urbanization, and escalating energy demand. According to recent industry analyses, Asia Pacific commands approximately 45% of the global electrical bushing market, driven by substantial investments in grid expansion projects and renewable energy integration.
Middle East & Africa and Latin America exhibit promising growth prospects, propelled by burgeoning investments in power generation and transmission infrastructure, albeit with varying degrees of market penetration. Collectively, these regions present a dynamic landscape for electrical bushing manufacturers, with Asia Pacific leading the charge in market dominance.
Key Regions and Countries
North America
- The US
- Canada
- Rest of North America
Europe
- Germany
- France
- The UK
- Spain
- Netherlands
- Russia
- Italy
- Rest of Europe
Asia-Pacific
- China
- Japan
- Singapore
- Thailand
- South Korea
- Vietnam
- India
- New Zealand
- Rest of Asia Pacific
Latin America
- Mexico
- Brazil
- Rest of Latin America
Middle East & Africa
- Saudi Arabia
- South Africa
- UAE
- Rest of the Middle East & Africa
Key Players Analysis
In the landscape of the global Electrical Bushing Market in 2024, key players such as ABB Group, TRENCH Group (SIEMENS), General Electric, Eaton, and others stand as pivotal entities shaping the industry's trajectory. These major companies, renowned for their innovation and expertise, wield considerable influence over market dynamics.
The ABB Group, for instance, continues to fortify its position through strategic acquisitions and technological advancements, cementing its reputation as a leader in electrical solutions. Similarly, TRENCH Group (SIEMENS) leverages its extensive experience and global reach to offer cutting-edge bushing solutions tailored to diverse market needs.
General Electric and Eaton, stalwarts in the electrical industry, consistently demonstrate a commitment to innovation and quality, driving market growth through their comprehensive product portfolios and customer-centric approach.
Moreover, emerging players like Elliot Industries, Gipro GMBH, and RHM International inject dynamism into the market with their specialized offerings and agile business strategies, challenging established norms and fostering healthy competition.
As the global demand for reliable electrical infrastructure continues to surge, key players like Toshiba, Webster-Wilkinson, Siemens, and Nexans play an instrumental role in meeting these needs through their robust product offerings and unwavering dedication to excellence.
Market Key Players
- ABB Group
- TRENCH Group (SIEMENS)
- General Electric
- Eaton
- Elliot Industries
- Gipro GMBH
- RHM International
- Toshiba
- Webster-Wilkinson
- Siemens (Germany)
- Nexans (France)
Recent Development
- In June 2023, At CWIEME Berlin, Hitachi Energy unveiled cutting-edge solutions, spotlighting breakthroughs in transformer insulation and components. Their product launch included interactive sessions on EasyDry®, a pioneering dry-type, paperless bushing.
- In December 2023, Bechtel Energy Inc. entrusted ABB with the task of delivering comprehensive automation, electrical, and digital solutions for Phase 1 of the Rio Grande LNG facility in Brownsville, Texas, as per the contract awarded.
Report Scope
Report Features Description Market Value (2023) USD 3.2 billion Forecast Revenue (2033) USD 4.6 billion CAGR (2024-2032) 3.8% Base Year for Estimation 2023 Historic Period 2016-2023 Forecast Period 2024-2033 Report Coverage Revenue Forecast, Market Dynamics, COVID-19 Impact, Competitive Landscape, Recent Developments Segments Covered By Product Type (Oil Impregnated Paper (OIP), Resin Impregnated Paper (RIP) and Others), By Insulation (Porcelain, Polymeric, and Glass), By Voltage (Medium, High, and Extra High Voltage), By Application (Transformer, Switchgear, and Others), By End User(Utilities, Industries, and Others) Regional Analysis North America - The US, Canada, Rest of North America, Europe - Germany, France, The UK, Spain, Italy, Russia, Netherlands, Rest of Europe, Asia-Pacific - China, Japan, South Korea, India, New Zealand, Singapore, Thailand, Vietnam, Rest of Asia Pacific, Latin America - Brazil, Mexico, Rest of Latin America, Middle East & Africa - South Africa, Saudi Arabia, UAE, Rest of Middle East & Africa Competitive Landscape ABB Group, TRENCH Group (SIEMENS), General Electric, Eaton, Elliot Industries, Gipro GMBH, RHM International, Toshiba, Webster-Wilkinson, Siemens (Germany), Nexans (France) Customization Scope Customization for segments, region/country-level will be provided. Moreover, additional customization can be done based on the requirements. Purchase Options We have three licenses to opt for Single User License, Multi-User License (Up to 5 Users), Corporate Use License (Unlimited User and Printable PDF) -
- 1. Executive Summary
- 1.1. Definition
- 1.2. Taxonomy
- 1.3. Research Scope
- 1.4. Key Analysis
- 1.5. Key Findings by Major Segments
- 1.6. Top strategies by Major Players
- 2. Global Electrical Bushing Market Overview
- 2.1. Electrical Bushing Market Dynamics
- 2.1.1. Drivers
- 2.1.2. Opportunities
- 2.1.3. Restraints
- 2.1.4. Challenges
- 2.2. Macro-economic Factors
- 2.3. Regulatory Framework
- 2.4. Market Investment Feasibility Index
- 2.5. PEST Analysis
- 2.6. PORTER’S Five Force Analysis
- 2.7. Drivers & Restraints Impact Analysis
- 2.8. Industry Chain Analysis
- 2.9. Cost Structure Analysis
- 2.10. Marketing Strategy
- 2.11. Russia-Ukraine War Impact Analysis
- 2.12. Opportunity Map Analysis
- 2.13. Market Competition Scenario Analysis
- 2.14. Product Life Cycle Analysis
- 2.15. Opportunity Orbits
- 2.16. Manufacturer Intensity Map
- 2.17. Major Companies sales by Value & Volume
- 2.1. Electrical Bushing Market Dynamics
- 3. Global Electrical Bushing Market Analysis, Opportunity and Forecast, 2016-2032
- 3.1. Global Electrical Bushing Market Analysis, 2016-2021
- 3.2. Global Electrical Bushing Market Opportunity and Forecast, 2023-2032
- 3.3. Global Electrical Bushing Market Analysis, Opportunity and Forecast, By Product Type , 2016-2032
- 3.3.1. Global Electrical Bushing Market Analysis by Product Type : Introduction
- 3.3.2. Market Size Absolute $ Opportunity Analysis and Forecast, By Product Type , 2016-2032
- 3.3.3. Oil Impregnated Paper (OIP)
- 3.3.4. Resin Impregnated Paper (RIP)
- 3.3.5. Others
- 3.4. Global Electrical Bushing Market Analysis, Opportunity and Forecast, By Insulation , 2016-2032
- 3.4.1. Global Electrical Bushing Market Analysis by Insulation : Introduction
- 3.4.2. Market Size Absolute $ Opportunity Analysis and Forecast, By Insulation , 2016-2032
- 3.4.3. Porcelain
- 3.4.4. Polymeric
- 3.4.5. Glass
- 3.5. Global Electrical Bushing Market Analysis, Opportunity and Forecast, By Voltage, 2016-2032
- 3.5.1. Global Electrical Bushing Market Analysis by Voltage: Introduction
- 3.5.2. Market Size Absolute $ Opportunity Analysis and Forecast, By Voltage, 2016-2032
- 3.5.3. Medium
- 3.5.4. High
- 3.5.5. Extra High Voltage
- 3.6. Global Electrical Bushing Market Analysis, Opportunity and Forecast, By Application , 2016-2032
- 3.6.1. Global Electrical Bushing Market Analysis by Application : Introduction
- 3.6.2. Market Size Absolute $ Opportunity Analysis and Forecast, By Application , 2016-2032
- 3.6.3. Transformer
- 3.6.4. Switchgear
- 3.6.5. Others
- 3.7. Global Electrical Bushing Market Analysis, Opportunity and Forecast, By End User , 2016-2032
- 3.7.1. Global Electrical Bushing Market Analysis by End User : Introduction
- 3.7.2. Market Size Absolute $ Opportunity Analysis and Forecast, By End User , 2016-2032
- 3.7.3. Utilities
- 3.7.4. Industries
- 3.7.5. Others
- 4. North America Electrical Bushing Market Analysis, Opportunity and Forecast, 2016-2032
- 4.1. North America Electrical Bushing Market Analysis, 2016-2021
- 4.2. North America Electrical Bushing Market Opportunity and Forecast, 2023-2032
- 4.3. North America Electrical Bushing Market Analysis, Opportunity and Forecast, By Product Type , 2016-2032
- 4.3.1. North America Electrical Bushing Market Analysis by Product Type : Introduction
- 4.3.2. Market Size Absolute $ Opportunity Analysis and Forecast, By Product Type , 2016-2032
- 4.3.3. Oil Impregnated Paper (OIP)
- 4.3.4. Resin Impregnated Paper (RIP)
- 4.3.5. Others
- 4.4. North America Electrical Bushing Market Analysis, Opportunity and Forecast, By Insulation , 2016-2032
- 4.4.1. North America Electrical Bushing Market Analysis by Insulation : Introduction
- 4.4.2. Market Size Absolute $ Opportunity Analysis and Forecast, By Insulation , 2016-2032
- 4.4.3. Porcelain
- 4.4.4. Polymeric
- 4.4.5. Glass
- 4.5. North America Electrical Bushing Market Analysis, Opportunity and Forecast, By Voltage, 2016-2032
- 4.5.1. North America Electrical Bushing Market Analysis by Voltage: Introduction
- 4.5.2. Market Size Absolute $ Opportunity Analysis and Forecast, By Voltage, 2016-2032
- 4.5.3. Medium
- 4.5.4. High
- 4.5.5. Extra High Voltage
- 4.6. North America Electrical Bushing Market Analysis, Opportunity and Forecast, By Application , 2016-2032
- 4.6.1. North America Electrical Bushing Market Analysis by Application : Introduction
- 4.6.2. Market Size Absolute $ Opportunity Analysis and Forecast, By Application , 2016-2032
- 4.6.3. Transformer
- 4.6.4. Switchgear
- 4.6.5. Others
- 4.7. North America Electrical Bushing Market Analysis, Opportunity and Forecast, By End User , 2016-2032
- 4.7.1. North America Electrical Bushing Market Analysis by End User : Introduction
- 4.7.2. Market Size Absolute $ Opportunity Analysis and Forecast, By End User , 2016-2032
- 4.7.3. Utilities
- 4.7.4. Industries
- 4.7.5. Others
- 4.8. North America Electrical Bushing Market Analysis, Opportunity and Forecast, By Country , 2016-2032
- 4.8.1. North America Electrical Bushing Market Analysis by Country : Introduction
- 4.8.2. Market Size Absolute $ Opportunity Analysis and Forecast, Country , 2016-2032
- 4.8.2.1. The US
- 4.8.2.2. Canada
- 4.8.2.3. Mexico
- 5. Western Europe Electrical Bushing Market Analysis, Opportunity and Forecast, 2016-2032
- 5.1. Western Europe Electrical Bushing Market Analysis, 2016-2021
- 5.2. Western Europe Electrical Bushing Market Opportunity and Forecast, 2023-2032
- 5.3. Western Europe Electrical Bushing Market Analysis, Opportunity and Forecast, By Product Type , 2016-2032
- 5.3.1. Western Europe Electrical Bushing Market Analysis by Product Type : Introduction
- 5.3.2. Market Size Absolute $ Opportunity Analysis and Forecast, By Product Type , 2016-2032
- 5.3.3. Oil Impregnated Paper (OIP)
- 5.3.4. Resin Impregnated Paper (RIP)
- 5.3.5. Others
- 5.4. Western Europe Electrical Bushing Market Analysis, Opportunity and Forecast, By Insulation , 2016-2032
- 5.4.1. Western Europe Electrical Bushing Market Analysis by Insulation : Introduction
- 5.4.2. Market Size Absolute $ Opportunity Analysis and Forecast, By Insulation , 2016-2032
- 5.4.3. Porcelain
- 5.4.4. Polymeric
- 5.4.5. Glass
- 5.5. Western Europe Electrical Bushing Market Analysis, Opportunity and Forecast, By Voltage, 2016-2032
- 5.5.1. Western Europe Electrical Bushing Market Analysis by Voltage: Introduction
- 5.5.2. Market Size Absolute $ Opportunity Analysis and Forecast, By Voltage, 2016-2032
- 5.5.3. Medium
- 5.5.4. High
- 5.5.5. Extra High Voltage
- 5.6. Western Europe Electrical Bushing Market Analysis, Opportunity and Forecast, By Application , 2016-2032
- 5.6.1. Western Europe Electrical Bushing Market Analysis by Application : Introduction
- 5.6.2. Market Size Absolute $ Opportunity Analysis and Forecast, By Application , 2016-2032
- 5.6.3. Transformer
- 5.6.4. Switchgear
- 5.6.5. Others
- 5.7. Western Europe Electrical Bushing Market Analysis, Opportunity and Forecast, By End User , 2016-2032
- 5.7.1. Western Europe Electrical Bushing Market Analysis by End User : Introduction
- 5.7.2. Market Size Absolute $ Opportunity Analysis and Forecast, By End User , 2016-2032
- 5.7.3. Utilities
- 5.7.4. Industries
- 5.7.5. Others
- 5.8. Western Europe Electrical Bushing Market Analysis, Opportunity and Forecast, By Country , 2016-2032
- 5.8.1. Western Europe Electrical Bushing Market Analysis by Country : Introduction
- 5.8.2. Market Size Absolute $ Opportunity Analysis and Forecast, Country , 2016-2032
- 5.8.2.1. Germany
- 5.8.2.2. France
- 5.8.2.3. The UK
- 5.8.2.4. Spain
- 5.8.2.5. Italy
- 5.8.2.6. Portugal
- 5.8.2.7. Ireland
- 5.8.2.8. Austria
- 5.8.2.9. Switzerland
- 5.8.2.10. Benelux
- 5.8.2.11. Nordic
- 5.8.2.12. Rest of Western Europe
- 6. Eastern Europe Electrical Bushing Market Analysis, Opportunity and Forecast, 2016-2032
- 6.1. Eastern Europe Electrical Bushing Market Analysis, 2016-2021
- 6.2. Eastern Europe Electrical Bushing Market Opportunity and Forecast, 2023-2032
- 6.3. Eastern Europe Electrical Bushing Market Analysis, Opportunity and Forecast, By Product Type , 2016-2032
- 6.3.1. Eastern Europe Electrical Bushing Market Analysis by Product Type : Introduction
- 6.3.2. Market Size Absolute $ Opportunity Analysis and Forecast, By Product Type , 2016-2032
- 6.3.3. Oil Impregnated Paper (OIP)
- 6.3.4. Resin Impregnated Paper (RIP)
- 6.3.5. Others
- 6.4. Eastern Europe Electrical Bushing Market Analysis, Opportunity and Forecast, By Insulation , 2016-2032
- 6.4.1. Eastern Europe Electrical Bushing Market Analysis by Insulation : Introduction
- 6.4.2. Market Size Absolute $ Opportunity Analysis and Forecast, By Insulation , 2016-2032
- 6.4.3. Porcelain
- 6.4.4. Polymeric
- 6.4.5. Glass
- 6.5. Eastern Europe Electrical Bushing Market Analysis, Opportunity and Forecast, By Voltage, 2016-2032
- 6.5.1. Eastern Europe Electrical Bushing Market Analysis by Voltage: Introduction
- 6.5.2. Market Size Absolute $ Opportunity Analysis and Forecast, By Voltage, 2016-2032
- 6.5.3. Medium
- 6.5.4. High
- 6.5.5. Extra High Voltage
- 6.6. Eastern Europe Electrical Bushing Market Analysis, Opportunity and Forecast, By Application , 2016-2032
- 6.6.1. Eastern Europe Electrical Bushing Market Analysis by Application : Introduction
- 6.6.2. Market Size Absolute $ Opportunity Analysis and Forecast, By Application , 2016-2032
- 6.6.3. Transformer
- 6.6.4. Switchgear
- 6.6.5. Others
- 6.7. Eastern Europe Electrical Bushing Market Analysis, Opportunity and Forecast, By End User , 2016-2032
- 6.7.1. Eastern Europe Electrical Bushing Market Analysis by End User : Introduction
- 6.7.2. Market Size Absolute $ Opportunity Analysis and Forecast, By End User , 2016-2032
- 6.7.3. Utilities
- 6.7.4. Industries
- 6.7.5. Others
- 6.8. Eastern Europe Electrical Bushing Market Analysis, Opportunity and Forecast, By Country , 2016-2032
- 6.8.1. Eastern Europe Electrical Bushing Market Analysis by Country : Introduction
- 6.8.2. Market Size Absolute $ Opportunity Analysis and Forecast, Country , 2016-2032
- 6.8.2.1. Russia
- 6.8.2.2. Poland
- 6.8.2.3. The Czech Republic
- 6.8.2.4. Greece
- 6.8.2.5. Rest of Eastern Europe
- 7. APAC Electrical Bushing Market Analysis, Opportunity and Forecast, 2016-2032
- 7.1. APAC Electrical Bushing Market Analysis, 2016-2021
- 7.2. APAC Electrical Bushing Market Opportunity and Forecast, 2023-2032
- 7.3. APAC Electrical Bushing Market Analysis, Opportunity and Forecast, By Product Type , 2016-2032
- 7.3.1. APAC Electrical Bushing Market Analysis by Product Type : Introduction
- 7.3.2. Market Size Absolute $ Opportunity Analysis and Forecast, By Product Type , 2016-2032
- 7.3.3. Oil Impregnated Paper (OIP)
- 7.3.4. Resin Impregnated Paper (RIP)
- 7.3.5. Others
- 7.4. APAC Electrical Bushing Market Analysis, Opportunity and Forecast, By Insulation , 2016-2032
- 7.4.1. APAC Electrical Bushing Market Analysis by Insulation : Introduction
- 7.4.2. Market Size Absolute $ Opportunity Analysis and Forecast, By Insulation , 2016-2032
- 7.4.3. Porcelain
- 7.4.4. Polymeric
- 7.4.5. Glass
- 7.5. APAC Electrical Bushing Market Analysis, Opportunity and Forecast, By Voltage, 2016-2032
- 7.5.1. APAC Electrical Bushing Market Analysis by Voltage: Introduction
- 7.5.2. Market Size Absolute $ Opportunity Analysis and Forecast, By Voltage, 2016-2032
- 7.5.3. Medium
- 7.5.4. High
- 7.5.5. Extra High Voltage
- 7.6. APAC Electrical Bushing Market Analysis, Opportunity and Forecast, By Application , 2016-2032
- 7.6.1. APAC Electrical Bushing Market Analysis by Application : Introduction
- 7.6.2. Market Size Absolute $ Opportunity Analysis and Forecast, By Application , 2016-2032
- 7.6.3. Transformer
- 7.6.4. Switchgear
- 7.6.5. Others
- 7.7. APAC Electrical Bushing Market Analysis, Opportunity and Forecast, By End User , 2016-2032
- 7.7.1. APAC Electrical Bushing Market Analysis by End User : Introduction
- 7.7.2. Market Size Absolute $ Opportunity Analysis and Forecast, By End User , 2016-2032
- 7.7.3. Utilities
- 7.7.4. Industries
- 7.7.5. Others
- 7.8. APAC Electrical Bushing Market Analysis, Opportunity and Forecast, By Country , 2016-2032
- 7.8.1. APAC Electrical Bushing Market Analysis by Country : Introduction
- 7.8.2. Market Size Absolute $ Opportunity Analysis and Forecast, Country , 2016-2032
- 7.8.2.1. China
- 7.8.2.2. Japan
- 7.8.2.3. South Korea
- 7.8.2.4. India
- 7.8.2.5. Australia & New Zeland
- 7.8.2.6. Indonesia
- 7.8.2.7. Malaysia
- 7.8.2.8. Philippines
- 7.8.2.9. Singapore
- 7.8.2.10. Thailand
- 7.8.2.11. Vietnam
- 7.8.2.12. Rest of APAC
- 8. Latin America Electrical Bushing Market Analysis, Opportunity and Forecast, 2016-2032
- 8.1. Latin America Electrical Bushing Market Analysis, 2016-2021
- 8.2. Latin America Electrical Bushing Market Opportunity and Forecast, 2023-2032
- 8.3. Latin America Electrical Bushing Market Analysis, Opportunity and Forecast, By Product Type , 2016-2032
- 8.3.1. Latin America Electrical Bushing Market Analysis by Product Type : Introduction
- 8.3.2. Market Size Absolute $ Opportunity Analysis and Forecast, By Product Type , 2016-2032
- 8.3.3. Oil Impregnated Paper (OIP)
- 8.3.4. Resin Impregnated Paper (RIP)
- 8.3.5. Others
- 8.4. Latin America Electrical Bushing Market Analysis, Opportunity and Forecast, By Insulation , 2016-2032
- 8.4.1. Latin America Electrical Bushing Market Analysis by Insulation : Introduction
- 8.4.2. Market Size Absolute $ Opportunity Analysis and Forecast, By Insulation , 2016-2032
- 8.4.3. Porcelain
- 8.4.4. Polymeric
- 8.4.5. Glass
- 8.5. Latin America Electrical Bushing Market Analysis, Opportunity and Forecast, By Voltage, 2016-2032
- 8.5.1. Latin America Electrical Bushing Market Analysis by Voltage: Introduction
- 8.5.2. Market Size Absolute $ Opportunity Analysis and Forecast, By Voltage, 2016-2032
- 8.5.3. Medium
- 8.5.4. High
- 8.5.5. Extra High Voltage
- 8.6. Latin America Electrical Bushing Market Analysis, Opportunity and Forecast, By Application , 2016-2032
- 8.6.1. Latin America Electrical Bushing Market Analysis by Application : Introduction
- 8.6.2. Market Size Absolute $ Opportunity Analysis and Forecast, By Application , 2016-2032
- 8.6.3. Transformer
- 8.6.4. Switchgear
- 8.6.5. Others
- 8.7. Latin America Electrical Bushing Market Analysis, Opportunity and Forecast, By End User , 2016-2032
- 8.7.1. Latin America Electrical Bushing Market Analysis by End User : Introduction
- 8.7.2. Market Size Absolute $ Opportunity Analysis and Forecast, By End User , 2016-2032
- 8.7.3. Utilities
- 8.7.4. Industries
- 8.7.5. Others
- 8.8. Latin America Electrical Bushing Market Analysis, Opportunity and Forecast, By Country , 2016-2032
- 8.8.1. Latin America Electrical Bushing Market Analysis by Country : Introduction
- 8.8.2. Market Size Absolute $ Opportunity Analysis and Forecast, Country , 2016-2032
- 8.8.2.1. Brazil
- 8.8.2.2. Colombia
- 8.8.2.3. Chile
- 8.8.2.4. Argentina
- 8.8.2.5. Costa Rica
- 8.8.2.6. Rest of Latin America
- 9. Middle East & Africa Electrical Bushing Market Analysis, Opportunity and Forecast, 2016-2032
- 9.1. Middle East & Africa Electrical Bushing Market Analysis, 2016-2021
- 9.2. Middle East & Africa Electrical Bushing Market Opportunity and Forecast, 2023-2032
- 9.3. Middle East & Africa Electrical Bushing Market Analysis, Opportunity and Forecast, By Product Type , 2016-2032
- 9.3.1. Middle East & Africa Electrical Bushing Market Analysis by Product Type : Introduction
- 9.3.2. Market Size Absolute $ Opportunity Analysis and Forecast, By Product Type , 2016-2032
- 9.3.3. Oil Impregnated Paper (OIP)
- 9.3.4. Resin Impregnated Paper (RIP)
- 9.3.5. Others
- 9.4. Middle East & Africa Electrical Bushing Market Analysis, Opportunity and Forecast, By Insulation , 2016-2032
- 9.4.1. Middle East & Africa Electrical Bushing Market Analysis by Insulation : Introduction
- 9.4.2. Market Size Absolute $ Opportunity Analysis and Forecast, By Insulation , 2016-2032
- 9.4.3. Porcelain
- 9.4.4. Polymeric
- 9.4.5. Glass
- 9.5. Middle East & Africa Electrical Bushing Market Analysis, Opportunity and Forecast, By Voltage, 2016-2032
- 9.5.1. Middle East & Africa Electrical Bushing Market Analysis by Voltage: Introduction
- 9.5.2. Market Size Absolute $ Opportunity Analysis and Forecast, By Voltage, 2016-2032
- 9.5.3. Medium
- 9.5.4. High
- 9.5.5. Extra High Voltage
- 9.6. Middle East & Africa Electrical Bushing Market Analysis, Opportunity and Forecast, By Application , 2016-2032
- 9.6.1. Middle East & Africa Electrical Bushing Market Analysis by Application : Introduction
- 9.6.2. Market Size Absolute $ Opportunity Analysis and Forecast, By Application , 2016-2032
- 9.6.3. Transformer
- 9.6.4. Switchgear
- 9.6.5. Others
- 9.7. Middle East & Africa Electrical Bushing Market Analysis, Opportunity and Forecast, By End User , 2016-2032
- 9.7.1. Middle East & Africa Electrical Bushing Market Analysis by End User : Introduction
- 9.7.2. Market Size Absolute $ Opportunity Analysis and Forecast, By End User , 2016-2032
- 9.7.3. Utilities
- 9.7.4. Industries
- 9.7.5. Others
- 9.8. Middle East & Africa Electrical Bushing Market Analysis, Opportunity and Forecast, By Country , 2016-2032
- 9.8.1. Middle East & Africa Electrical Bushing Market Analysis by Country : Introduction
- 9.8.2. Market Size Absolute $ Opportunity Analysis and Forecast, Country , 2016-2032
- 9.8.2.1. Algeria
- 9.8.2.2. Egypt
- 9.8.2.3. Israel
- 9.8.2.4. Kuwait
- 9.8.2.5. Nigeria
- 9.8.2.6. Saudi Arabia
- 9.8.2.7. South Africa
- 9.8.2.8. Turkey
- 9.8.2.9. The UAE
- 9.8.2.10. Rest of MEA
- 10. Global Electrical Bushing Market Analysis, Opportunity and Forecast, By Region , 2016-2032
- 10.1. Global Electrical Bushing Market Analysis by Region : Introduction
- 10.2. Market Size Absolute $ Opportunity Analysis and Forecast, By Region , 2016-2032
- 10.2.1. North America
- 10.2.2. Western Europe
- 10.2.3. Eastern Europe
- 10.2.4. APAC
- 10.2.5. Latin America
- 10.2.6. Middle East & Africa
- 11. Global Electrical Bushing Market Competitive Landscape, Market Share Analysis, and Company Profiles
- 11.1. Market Share Analysis
- 11.2. Company Profiles
- 11.3. ABB Group
- 11.3.1. Company Overview
- 11.3.2. Financial Highlights
- 11.3.3. Product Portfolio
- 11.3.4. SWOT Analysis
- 11.3.5. Key Strategies and Developments
- 11.4. TRENCH Group (SIEMENS)
- 11.4.1. Company Overview
- 11.4.2. Financial Highlights
- 11.4.3. Product Portfolio
- 11.4.4. SWOT Analysis
- 11.4.5. Key Strategies and Developments
- 11.5. General Electric
- 11.5.1. Company Overview
- 11.5.2. Financial Highlights
- 11.5.3. Product Portfolio
- 11.5.4. SWOT Analysis
- 11.5.5. Key Strategies and Developments
- 11.6. Eaton
- 11.6.1. Company Overview
- 11.6.2. Financial Highlights
- 11.6.3. Product Portfolio
- 11.6.4. SWOT Analysis
- 11.6.5. Key Strategies and Developments
- 11.7. Elliot Industries
- 11.7.1. Company Overview
- 11.7.2. Financial Highlights
- 11.7.3. Product Portfolio
- 11.7.4. SWOT Analysis
- 11.7.5. Key Strategies and Developments
- 11.8. Gipro GMBH
- 11.8.1. Company Overview
- 11.8.2. Financial Highlights
- 11.8.3. Product Portfolio
- 11.8.4. SWOT Analysis
- 11.8.5. Key Strategies and Developments
- 11.9. RHM International
- 11.9.1. Company Overview
- 11.9.2. Financial Highlights
- 11.9.3. Product Portfolio
- 11.9.4. SWOT Analysis
- 11.9.5. Key Strategies and Developments
- 11.10. Toshiba
- 11.10.1. Company Overview
- 11.10.2. Financial Highlights
- 11.10.3. Product Portfolio
- 11.10.4. SWOT Analysis
- 11.10.5. Key Strategies and Developments
- 11.11. Webster-Wilkinson
- 11.11.1. Company Overview
- 11.11.2. Financial Highlights
- 11.11.3. Product Portfolio
- 11.11.4. SWOT Analysis
- 11.11.5. Key Strategies and Developments
- 11.12. Siemens (Germany)
- 11.12.1. Company Overview
- 11.12.2. Financial Highlights
- 11.12.3. Product Portfolio
- 11.12.4. SWOT Analysis
- 11.12.5. Key Strategies and Developments
- 11.13.1. Company Overview
- 11.13.2. Financial Highlights
- 11.13.3. Product Portfolio
- 11.13.4. SWOT Analysis
- 11.13.5. Key Strategies and Developments
- 11.14. Nexans (France)
- 11.14.1. Company Overview
- 11.14.2. Financial Highlights
- 11.14.3. Product Portfolio
- 11.14.4. SWOT Analysis
- 11.14.5. Key Strategies and Developments
- 12. Assumptions and Acronyms
- 13. Research Methodology
- 14. Contact
"
- List of Figures
- "
- Figure 1: Global Electrical Bushing Market Revenue (US$ Mn) Market Share by Product Type in 2022
- Figure 2: Global Electrical Bushing Market Market Attractiveness Analysis by Product Type , 2016-2032
- Figure 3: Global Electrical Bushing Market Revenue (US$ Mn) Market Share by Insulation in 2022
- Figure 4: Global Electrical Bushing Market Market Attractiveness Analysis by Insulation , 2016-2032
- Figure 5: Global Electrical Bushing Market Revenue (US$ Mn) Market Share by Voltagein 2022
- Figure 6: Global Electrical Bushing Market Market Attractiveness Analysis by Voltage, 2016-2032
- Figure 7: Global Electrical Bushing Market Revenue (US$ Mn) Market Share by Application in 2022
- Figure 8: Global Electrical Bushing Market Market Attractiveness Analysis by Application , 2016-2032
- Figure 9: Global Electrical Bushing Market Revenue (US$ Mn) Market Share by End User in 2022
- Figure 10: Global Electrical Bushing Market Market Attractiveness Analysis by End User , 2016-2032
- Figure 11: Global Electrical Bushing Market Revenue (US$ Mn) Market Share by Region in 2022
- Figure 12: Global Electrical Bushing Market Market Attractiveness Analysis by Region, 2016-2032
- Figure 13: Global Electrical Bushing Market Market Revenue (US$ Mn) (2016-2032)
- Figure 14: Global Electrical Bushing Market Market Revenue (US$ Mn) Comparison by Region (2016-2032)
- Figure 15: Global Electrical Bushing Market Market Revenue (US$ Mn) Comparison by Product Type (2016-2032)
- Figure 16: Global Electrical Bushing Market Market Revenue (US$ Mn) Comparison by Insulation (2016-2032)
- Figure 17: Global Electrical Bushing Market Market Revenue (US$ Mn) Comparison by Voltage (2016-2032)
- Figure 18: Global Electrical Bushing Market Market Revenue (US$ Mn) Comparison by Application (2016-2032)
- Figure 19: Global Electrical Bushing Market Market Revenue (US$ Mn) Comparison by End User (2016-2032)
- Figure 20: Global Electrical Bushing Market Market Y-o-Y Growth Rate Comparison by Region (2016-2032)
- Figure 21: Global Electrical Bushing Market Market Y-o-Y Growth Rate Comparison by Product Type (2016-2032)
- Figure 22: Global Electrical Bushing Market Market Y-o-Y Growth Rate Comparison by Insulation (2016-2032)
- Figure 23: Global Electrical Bushing Market Market Y-o-Y Growth Rate Comparison by Voltage (2016-2032)
- Figure 24: Global Electrical Bushing Market Market Y-o-Y Growth Rate Comparison by Application (2016-2032)
- Figure 25: Global Electrical Bushing Market Market Y-o-Y Growth Rate Comparison by End User (2016-2032)
- Figure 26: Global Electrical Bushing Market Market Share Comparison by Region (2016-2032)
- Figure 27: Global Electrical Bushing Market Market Share Comparison by Product Type (2016-2032)
- Figure 28: Global Electrical Bushing Market Market Share Comparison by Insulation (2016-2032)
- Figure 29: Global Electrical Bushing Market Market Share Comparison by Voltage (2016-2032)
- Figure 30: Global Electrical Bushing Market Market Share Comparison by Application (2016-2032)
- Figure 31: Global Electrical Bushing Market Market Share Comparison by End User (2016-2032)
- Figure 32: North America Electrical Bushing Market Revenue (US$ Mn) Market Share by Product Type in 2022
- Figure 33: North America Electrical Bushing Market Market Attractiveness Analysis by Product Type , 2016-2032
- Figure 34: North America Electrical Bushing Market Revenue (US$ Mn) Market Share by Insulation in 2022
- Figure 35: North America Electrical Bushing Market Market Attractiveness Analysis by Insulation , 2016-2032
- Figure 36: North America Electrical Bushing Market Revenue (US$ Mn) Market Share by Voltagein 2022
- Figure 37: North America Electrical Bushing Market Market Attractiveness Analysis by Voltage, 2016-2032
- Figure 38: North America Electrical Bushing Market Revenue (US$ Mn) Market Share by Application in 2022
- Figure 39: North America Electrical Bushing Market Market Attractiveness Analysis by Application , 2016-2032
- Figure 40: North America Electrical Bushing Market Revenue (US$ Mn) Market Share by End User in 2022
- Figure 41: North America Electrical Bushing Market Market Attractiveness Analysis by End User , 2016-2032
- Figure 42: North America Electrical Bushing Market Revenue (US$ Mn) Market Share by Country in 2022
- Figure 43: North America Electrical Bushing Market Market Attractiveness Analysis by Country, 2016-2032
- Figure 44: North America Electrical Bushing Market Market Revenue (US$ Mn) (2016-2032)
- Figure 45: North America Electrical Bushing Market Market Revenue (US$ Mn) Comparison by Country (2016-2032)
- Figure 46: North America Electrical Bushing Market Market Revenue (US$ Mn) Comparison by Product Type (2016-2032)
- Figure 47: North America Electrical Bushing Market Market Revenue (US$ Mn) Comparison by Insulation (2016-2032)
- Figure 48: North America Electrical Bushing Market Market Revenue (US$ Mn) Comparison by Voltage (2016-2032)
- Figure 49: North America Electrical Bushing Market Market Revenue (US$ Mn) Comparison by Application (2016-2032)
- Figure 50: North America Electrical Bushing Market Market Revenue (US$ Mn) Comparison by End User (2016-2032)
- Figure 51: North America Electrical Bushing Market Market Y-o-Y Growth Rate Comparison by Country (2016-2032)
- Figure 52: North America Electrical Bushing Market Market Y-o-Y Growth Rate Comparison by Product Type (2016-2032)
- Figure 53: North America Electrical Bushing Market Market Y-o-Y Growth Rate Comparison by Insulation (2016-2032)
- Figure 54: North America Electrical Bushing Market Market Y-o-Y Growth Rate Comparison by Voltage (2016-2032)
- Figure 55: North America Electrical Bushing Market Market Y-o-Y Growth Rate Comparison by Application (2016-2032)
- Figure 56: North America Electrical Bushing Market Market Y-o-Y Growth Rate Comparison by End User (2016-2032)
- Figure 57: North America Electrical Bushing Market Market Share Comparison by Country (2016-2032)
- Figure 58: North America Electrical Bushing Market Market Share Comparison by Product Type (2016-2032)
- Figure 59: North America Electrical Bushing Market Market Share Comparison by Insulation (2016-2032)
- Figure 60: North America Electrical Bushing Market Market Share Comparison by Voltage (2016-2032)
- Figure 61: North America Electrical Bushing Market Market Share Comparison by Application (2016-2032)
- Figure 62: North America Electrical Bushing Market Market Share Comparison by End User (2016-2032)
- Figure 63: Western Europe Electrical Bushing Market Revenue (US$ Mn) Market Share by Product Type in 2022
- Figure 64: Western Europe Electrical Bushing Market Market Attractiveness Analysis by Product Type , 2016-2032
- Figure 65: Western Europe Electrical Bushing Market Revenue (US$ Mn) Market Share by Insulation in 2022
- Figure 66: Western Europe Electrical Bushing Market Market Attractiveness Analysis by Insulation , 2016-2032
- Figure 67: Western Europe Electrical Bushing Market Revenue (US$ Mn) Market Share by Voltagein 2022
- Figure 68: Western Europe Electrical Bushing Market Market Attractiveness Analysis by Voltage, 2016-2032
- Figure 69: Western Europe Electrical Bushing Market Revenue (US$ Mn) Market Share by Application in 2022
- Figure 70: Western Europe Electrical Bushing Market Market Attractiveness Analysis by Application , 2016-2032
- Figure 71: Western Europe Electrical Bushing Market Revenue (US$ Mn) Market Share by End User in 2022
- Figure 72: Western Europe Electrical Bushing Market Market Attractiveness Analysis by End User , 2016-2032
- Figure 73: Western Europe Electrical Bushing Market Revenue (US$ Mn) Market Share by Country in 2022
- Figure 74: Western Europe Electrical Bushing Market Market Attractiveness Analysis by Country, 2016-2032
- Figure 75: Western Europe Electrical Bushing Market Market Revenue (US$ Mn) (2016-2032)
- Figure 76: Western Europe Electrical Bushing Market Market Revenue (US$ Mn) Comparison by Country (2016-2032)
- Figure 77: Western Europe Electrical Bushing Market Market Revenue (US$ Mn) Comparison by Product Type (2016-2032)
- Figure 78: Western Europe Electrical Bushing Market Market Revenue (US$ Mn) Comparison by Insulation (2016-2032)
- Figure 79: Western Europe Electrical Bushing Market Market Revenue (US$ Mn) Comparison by Voltage (2016-2032)
- Figure 80: Western Europe Electrical Bushing Market Market Revenue (US$ Mn) Comparison by Application (2016-2032)
- Figure 81: Western Europe Electrical Bushing Market Market Revenue (US$ Mn) Comparison by End User (2016-2032)
- Figure 82: Western Europe Electrical Bushing Market Market Y-o-Y Growth Rate Comparison by Country (2016-2032)
- Figure 83: Western Europe Electrical Bushing Market Market Y-o-Y Growth Rate Comparison by Product Type (2016-2032)
- Figure 84: Western Europe Electrical Bushing Market Market Y-o-Y Growth Rate Comparison by Insulation (2016-2032)
- Figure 85: Western Europe Electrical Bushing Market Market Y-o-Y Growth Rate Comparison by Voltage (2016-2032)
- Figure 86: Western Europe Electrical Bushing Market Market Y-o-Y Growth Rate Comparison by Application (2016-2032)
- Figure 87: Western Europe Electrical Bushing Market Market Y-o-Y Growth Rate Comparison by End User (2016-2032)
- Figure 88: Western Europe Electrical Bushing Market Market Share Comparison by Country (2016-2032)
- Figure 89: Western Europe Electrical Bushing Market Market Share Comparison by Product Type (2016-2032)
- Figure 90: Western Europe Electrical Bushing Market Market Share Comparison by Insulation (2016-2032)
- Figure 91: Western Europe Electrical Bushing Market Market Share Comparison by Voltage (2016-2032)
- Figure 92: Western Europe Electrical Bushing Market Market Share Comparison by Application (2016-2032)
- Figure 93: Western Europe Electrical Bushing Market Market Share Comparison by End User (2016-2032)
- Figure 94: Eastern Europe Electrical Bushing Market Revenue (US$ Mn) Market Share by Product Type in 2022
- Figure 95: Eastern Europe Electrical Bushing Market Market Attractiveness Analysis by Product Type , 2016-2032
- Figure 96: Eastern Europe Electrical Bushing Market Revenue (US$ Mn) Market Share by Insulation in 2022
- Figure 97: Eastern Europe Electrical Bushing Market Market Attractiveness Analysis by Insulation , 2016-2032
- Figure 98: Eastern Europe Electrical Bushing Market Revenue (US$ Mn) Market Share by Voltagein 2022
- Figure 99: Eastern Europe Electrical Bushing Market Market Attractiveness Analysis by Voltage, 2016-2032
- Figure 100: Eastern Europe Electrical Bushing Market Revenue (US$ Mn) Market Share by Application in 2022
- Figure 101: Eastern Europe Electrical Bushing Market Market Attractiveness Analysis by Application , 2016-2032
- Figure 102: Eastern Europe Electrical Bushing Market Revenue (US$ Mn) Market Share by End User in 2022
- Figure 103: Eastern Europe Electrical Bushing Market Market Attractiveness Analysis by End User , 2016-2032
- Figure 104: Eastern Europe Electrical Bushing Market Revenue (US$ Mn) Market Share by Country in 2022
- Figure 105: Eastern Europe Electrical Bushing Market Market Attractiveness Analysis by Country, 2016-2032
- Figure 106: Eastern Europe Electrical Bushing Market Market Revenue (US$ Mn) (2016-2032)
- Figure 107: Eastern Europe Electrical Bushing Market Market Revenue (US$ Mn) Comparison by Country (2016-2032)
- Figure 108: Eastern Europe Electrical Bushing Market Market Revenue (US$ Mn) Comparison by Product Type (2016-2032)
- Figure 109: Eastern Europe Electrical Bushing Market Market Revenue (US$ Mn) Comparison by Insulation (2016-2032)
- Figure 110: Eastern Europe Electrical Bushing Market Market Revenue (US$ Mn) Comparison by Voltage (2016-2032)
- Figure 111: Eastern Europe Electrical Bushing Market Market Revenue (US$ Mn) Comparison by Application (2016-2032)
- Figure 112: Eastern Europe Electrical Bushing Market Market Revenue (US$ Mn) Comparison by End User (2016-2032)
- Figure 113: Eastern Europe Electrical Bushing Market Market Y-o-Y Growth Rate Comparison by Country (2016-2032)
- Figure 114: Eastern Europe Electrical Bushing Market Market Y-o-Y Growth Rate Comparison by Product Type (2016-2032)
- Figure 115: Eastern Europe Electrical Bushing Market Market Y-o-Y Growth Rate Comparison by Insulation (2016-2032)
- Figure 116: Eastern Europe Electrical Bushing Market Market Y-o-Y Growth Rate Comparison by Voltage (2016-2032)
- Figure 117: Eastern Europe Electrical Bushing Market Market Y-o-Y Growth Rate Comparison by Application (2016-2032)
- Figure 118: Eastern Europe Electrical Bushing Market Market Y-o-Y Growth Rate Comparison by End User (2016-2032)
- Figure 119: Eastern Europe Electrical Bushing Market Market Share Comparison by Country (2016-2032)
- Figure 120: Eastern Europe Electrical Bushing Market Market Share Comparison by Product Type (2016-2032)
- Figure 121: Eastern Europe Electrical Bushing Market Market Share Comparison by Insulation (2016-2032)
- Figure 122: Eastern Europe Electrical Bushing Market Market Share Comparison by Voltage (2016-2032)
- Figure 123: Eastern Europe Electrical Bushing Market Market Share Comparison by Application (2016-2032)
- Figure 124: Eastern Europe Electrical Bushing Market Market Share Comparison by End User (2016-2032)
- Figure 125: APAC Electrical Bushing Market Revenue (US$ Mn) Market Share by Product Type in 2022
- Figure 126: APAC Electrical Bushing Market Market Attractiveness Analysis by Product Type , 2016-2032
- Figure 127: APAC Electrical Bushing Market Revenue (US$ Mn) Market Share by Insulation in 2022
- Figure 128: APAC Electrical Bushing Market Market Attractiveness Analysis by Insulation , 2016-2032
- Figure 129: APAC Electrical Bushing Market Revenue (US$ Mn) Market Share by Voltagein 2022
- Figure 130: APAC Electrical Bushing Market Market Attractiveness Analysis by Voltage, 2016-2032
- Figure 131: APAC Electrical Bushing Market Revenue (US$ Mn) Market Share by Application in 2022
- Figure 132: APAC Electrical Bushing Market Market Attractiveness Analysis by Application , 2016-2032
- Figure 133: APAC Electrical Bushing Market Revenue (US$ Mn) Market Share by End User in 2022
- Figure 134: APAC Electrical Bushing Market Market Attractiveness Analysis by End User , 2016-2032
- Figure 135: APAC Electrical Bushing Market Revenue (US$ Mn) Market Share by Country in 2022
- Figure 136: APAC Electrical Bushing Market Market Attractiveness Analysis by Country, 2016-2032
- Figure 137: APAC Electrical Bushing Market Market Revenue (US$ Mn) (2016-2032)
- Figure 138: APAC Electrical Bushing Market Market Revenue (US$ Mn) Comparison by Country (2016-2032)
- Figure 139: APAC Electrical Bushing Market Market Revenue (US$ Mn) Comparison by Product Type (2016-2032)
- Figure 140: APAC Electrical Bushing Market Market Revenue (US$ Mn) Comparison by Insulation (2016-2032)
- Figure 141: APAC Electrical Bushing Market Market Revenue (US$ Mn) Comparison by Voltage (2016-2032)
- Figure 142: APAC Electrical Bushing Market Market Revenue (US$ Mn) Comparison by Application (2016-2032)
- Figure 143: APAC Electrical Bushing Market Market Revenue (US$ Mn) Comparison by End User (2016-2032)
- Figure 144: APAC Electrical Bushing Market Market Y-o-Y Growth Rate Comparison by Country (2016-2032)
- Figure 145: APAC Electrical Bushing Market Market Y-o-Y Growth Rate Comparison by Product Type (2016-2032)
- Figure 146: APAC Electrical Bushing Market Market Y-o-Y Growth Rate Comparison by Insulation (2016-2032)
- Figure 147: APAC Electrical Bushing Market Market Y-o-Y Growth Rate Comparison by Voltage (2016-2032)
- Figure 148: APAC Electrical Bushing Market Market Y-o-Y Growth Rate Comparison by Application (2016-2032)
- Figure 149: APAC Electrical Bushing Market Market Y-o-Y Growth Rate Comparison by End User (2016-2032)
- Figure 150: APAC Electrical Bushing Market Market Share Comparison by Country (2016-2032)
- Figure 151: APAC Electrical Bushing Market Market Share Comparison by Product Type (2016-2032)
- Figure 152: APAC Electrical Bushing Market Market Share Comparison by Insulation (2016-2032)
- Figure 153: APAC Electrical Bushing Market Market Share Comparison by Voltage (2016-2032)
- Figure 154: APAC Electrical Bushing Market Market Share Comparison by Application (2016-2032)
- Figure 155: APAC Electrical Bushing Market Market Share Comparison by End User (2016-2032)
- Figure 156: Latin America Electrical Bushing Market Revenue (US$ Mn) Market Share by Product Type in 2022
- Figure 157: Latin America Electrical Bushing Market Market Attractiveness Analysis by Product Type , 2016-2032
- Figure 158: Latin America Electrical Bushing Market Revenue (US$ Mn) Market Share by Insulation in 2022
- Figure 159: Latin America Electrical Bushing Market Market Attractiveness Analysis by Insulation , 2016-2032
- Figure 160: Latin America Electrical Bushing Market Revenue (US$ Mn) Market Share by Voltagein 2022
- Figure 161: Latin America Electrical Bushing Market Market Attractiveness Analysis by Voltage, 2016-2032
- Figure 162: Latin America Electrical Bushing Market Revenue (US$ Mn) Market Share by Application in 2022
- Figure 163: Latin America Electrical Bushing Market Market Attractiveness Analysis by Application , 2016-2032
- Figure 164: Latin America Electrical Bushing Market Revenue (US$ Mn) Market Share by End User in 2022
- Figure 165: Latin America Electrical Bushing Market Market Attractiveness Analysis by End User , 2016-2032
- Figure 166: Latin America Electrical Bushing Market Revenue (US$ Mn) Market Share by Country in 2022
- Figure 167: Latin America Electrical Bushing Market Market Attractiveness Analysis by Country, 2016-2032
- Figure 168: Latin America Electrical Bushing Market Market Revenue (US$ Mn) (2016-2032)
- Figure 169: Latin America Electrical Bushing Market Market Revenue (US$ Mn) Comparison by Country (2016-2032)
- Figure 170: Latin America Electrical Bushing Market Market Revenue (US$ Mn) Comparison by Product Type (2016-2032)
- Figure 171: Latin America Electrical Bushing Market Market Revenue (US$ Mn) Comparison by Insulation (2016-2032)
- Figure 172: Latin America Electrical Bushing Market Market Revenue (US$ Mn) Comparison by Voltage (2016-2032)
- Figure 173: Latin America Electrical Bushing Market Market Revenue (US$ Mn) Comparison by Application (2016-2032)
- Figure 174: Latin America Electrical Bushing Market Market Revenue (US$ Mn) Comparison by End User (2016-2032)
- Figure 175: Latin America Electrical Bushing Market Market Y-o-Y Growth Rate Comparison by Country (2016-2032)
- Figure 176: Latin America Electrical Bushing Market Market Y-o-Y Growth Rate Comparison by Product Type (2016-2032)
- Figure 177: Latin America Electrical Bushing Market Market Y-o-Y Growth Rate Comparison by Insulation (2016-2032)
- Figure 178: Latin America Electrical Bushing Market Market Y-o-Y Growth Rate Comparison by Voltage (2016-2032)
- Figure 179: Latin America Electrical Bushing Market Market Y-o-Y Growth Rate Comparison by Application (2016-2032)
- Figure 180: Latin America Electrical Bushing Market Market Y-o-Y Growth Rate Comparison by End User (2016-2032)
- Figure 181: Latin America Electrical Bushing Market Market Share Comparison by Country (2016-2032)
- Figure 182: Latin America Electrical Bushing Market Market Share Comparison by Product Type (2016-2032)
- Figure 183: Latin America Electrical Bushing Market Market Share Comparison by Insulation (2016-2032)
- Figure 184: Latin America Electrical Bushing Market Market Share Comparison by Voltage (2016-2032)
- Figure 185: Latin America Electrical Bushing Market Market Share Comparison by Application (2016-2032)
- Figure 186: Latin America Electrical Bushing Market Market Share Comparison by End User (2016-2032)
- Figure 187: Middle East & Africa Electrical Bushing Market Revenue (US$ Mn) Market Share by Product Type in 2022
- Figure 188: Middle East & Africa Electrical Bushing Market Market Attractiveness Analysis by Product Type , 2016-2032
- Figure 189: Middle East & Africa Electrical Bushing Market Revenue (US$ Mn) Market Share by Insulation in 2022
- Figure 190: Middle East & Africa Electrical Bushing Market Market Attractiveness Analysis by Insulation , 2016-2032
- Figure 191: Middle East & Africa Electrical Bushing Market Revenue (US$ Mn) Market Share by Voltagein 2022
- Figure 192: Middle East & Africa Electrical Bushing Market Market Attractiveness Analysis by Voltage, 2016-2032
- Figure 193: Middle East & Africa Electrical Bushing Market Revenue (US$ Mn) Market Share by Application in 2022
- Figure 194: Middle East & Africa Electrical Bushing Market Market Attractiveness Analysis by Application , 2016-2032
- Figure 195: Middle East & Africa Electrical Bushing Market Revenue (US$ Mn) Market Share by End User in 2022
- Figure 196: Middle East & Africa Electrical Bushing Market Market Attractiveness Analysis by End User , 2016-2032
- Figure 197: Middle East & Africa Electrical Bushing Market Revenue (US$ Mn) Market Share by Country in 2022
- Figure 198: Middle East & Africa Electrical Bushing Market Market Attractiveness Analysis by Country, 2016-2032
- Figure 199: Middle East & Africa Electrical Bushing Market Market Revenue (US$ Mn) (2016-2032)
- Figure 200: Middle East & Africa Electrical Bushing Market Market Revenue (US$ Mn) Comparison by Country (2016-2032)
- Figure 201: Middle East & Africa Electrical Bushing Market Market Revenue (US$ Mn) Comparison by Product Type (2016-2032)
- Figure 202: Middle East & Africa Electrical Bushing Market Market Revenue (US$ Mn) Comparison by Insulation (2016-2032)
- Figure 203: Middle East & Africa Electrical Bushing Market Market Revenue (US$ Mn) Comparison by Voltage (2016-2032)
- Figure 204: Middle East & Africa Electrical Bushing Market Market Revenue (US$ Mn) Comparison by Application (2016-2032)
- Figure 205: Middle East & Africa Electrical Bushing Market Market Revenue (US$ Mn) Comparison by End User (2016-2032)
- Figure 206: Middle East & Africa Electrical Bushing Market Market Y-o-Y Growth Rate Comparison by Country (2016-2032)
- Figure 207: Middle East & Africa Electrical Bushing Market Market Y-o-Y Growth Rate Comparison by Product Type (2016-2032)
- Figure 208: Middle East & Africa Electrical Bushing Market Market Y-o-Y Growth Rate Comparison by Insulation (2016-2032)
- Figure 209: Middle East & Africa Electrical Bushing Market Market Y-o-Y Growth Rate Comparison by Voltage (2016-2032)
- Figure 210: Middle East & Africa Electrical Bushing Market Market Y-o-Y Growth Rate Comparison by Application (2016-2032)
- Figure 211: Middle East & Africa Electrical Bushing Market Market Y-o-Y Growth Rate Comparison by End User (2016-2032)
- Figure 212: Middle East & Africa Electrical Bushing Market Market Share Comparison by Country (2016-2032)
- Figure 213: Middle East & Africa Electrical Bushing Market Market Share Comparison by Product Type (2016-2032)
- Figure 214: Middle East & Africa Electrical Bushing Market Market Share Comparison by Insulation (2016-2032)
- Figure 215: Middle East & Africa Electrical Bushing Market Market Share Comparison by Voltage (2016-2032)
- Figure 216: Middle East & Africa Electrical Bushing Market Market Share Comparison by Application (2016-2032)
- Figure 217: Middle East & Africa Electrical Bushing Market Market Share Comparison by End User (2016-2032)
"
- List of Tables
- "
- Table 1: Global Electrical Bushing Market Market Comparison by Product Type (2016-2032)
- Table 2: Global Electrical Bushing Market Market Comparison by Insulation (2016-2032)
- Table 3: Global Electrical Bushing Market Market Comparison by Voltage (2016-2032)
- Table 4: Global Electrical Bushing Market Market Comparison by Application (2016-2032)
- Table 5: Global Electrical Bushing Market Market Comparison by End User (2016-2032)
- Table 6: Global Electrical Bushing Market Revenue (US$ Mn) Comparison by Region (2016-2032)
- Table 7: Global Electrical Bushing Market Market Revenue (US$ Mn) (2016-2032)
- Table 8: Global Electrical Bushing Market Market Revenue (US$ Mn) Comparison by Region (2016-2032)
- Table 9: Global Electrical Bushing Market Market Revenue (US$ Mn) Comparison by Product Type (2016-2032)
- Table 10: Global Electrical Bushing Market Market Revenue (US$ Mn) Comparison by Insulation (2016-2032)
- Table 11: Global Electrical Bushing Market Market Revenue (US$ Mn) Comparison by Voltage (2016-2032)
- Table 12: Global Electrical Bushing Market Market Revenue (US$ Mn) Comparison by Application (2016-2032)
- Table 13: Global Electrical Bushing Market Market Revenue (US$ Mn) Comparison by End User (2016-2032)
- Table 14: Global Electrical Bushing Market Market Y-o-Y Growth Rate Comparison by Region (2016-2032)
- Table 15: Global Electrical Bushing Market Market Y-o-Y Growth Rate Comparison by Product Type (2016-2032)
- Table 16: Global Electrical Bushing Market Market Y-o-Y Growth Rate Comparison by Insulation (2016-2032)
- Table 17: Global Electrical Bushing Market Market Y-o-Y Growth Rate Comparison by Voltage (2016-2032)
- Table 18: Global Electrical Bushing Market Market Y-o-Y Growth Rate Comparison by Application (2016-2032)
- Table 19: Global Electrical Bushing Market Market Y-o-Y Growth Rate Comparison by End User (2016-2032)
- Table 20: Global Electrical Bushing Market Market Share Comparison by Region (2016-2032)
- Table 21: Global Electrical Bushing Market Market Share Comparison by Product Type (2016-2032)
- Table 22: Global Electrical Bushing Market Market Share Comparison by Insulation (2016-2032)
- Table 23: Global Electrical Bushing Market Market Share Comparison by Voltage (2016-2032)
- Table 24: Global Electrical Bushing Market Market Share Comparison by Application (2016-2032)
- Table 25: Global Electrical Bushing Market Market Share Comparison by End User (2016-2032)
- Table 26: North America Electrical Bushing Market Market Comparison by Insulation (2016-2032)
- Table 27: North America Electrical Bushing Market Market Comparison by Voltage (2016-2032)
- Table 28: North America Electrical Bushing Market Market Comparison by Application (2016-2032)
- Table 29: North America Electrical Bushing Market Market Comparison by End User (2016-2032)
- Table 30: North America Electrical Bushing Market Revenue (US$ Mn) Comparison by Country (2016-2032)
- Table 31: North America Electrical Bushing Market Market Revenue (US$ Mn) (2016-2032)
- Table 32: North America Electrical Bushing Market Market Revenue (US$ Mn) Comparison by Country (2016-2032)
- Table 33: North America Electrical Bushing Market Market Revenue (US$ Mn) Comparison by Product Type (2016-2032)
- Table 34: North America Electrical Bushing Market Market Revenue (US$ Mn) Comparison by Insulation (2016-2032)
- Table 35: North America Electrical Bushing Market Market Revenue (US$ Mn) Comparison by Voltage (2016-2032)
- Table 36: North America Electrical Bushing Market Market Revenue (US$ Mn) Comparison by Application (2016-2032)
- Table 37: North America Electrical Bushing Market Market Revenue (US$ Mn) Comparison by End User (2016-2032)
- Table 38: North America Electrical Bushing Market Market Y-o-Y Growth Rate Comparison by Country (2016-2032)
- Table 39: North America Electrical Bushing Market Market Y-o-Y Growth Rate Comparison by Product Type (2016-2032)
- Table 40: North America Electrical Bushing Market Market Y-o-Y Growth Rate Comparison by Insulation (2016-2032)
- Table 41: North America Electrical Bushing Market Market Y-o-Y Growth Rate Comparison by Voltage (2016-2032)
- Table 42: North America Electrical Bushing Market Market Y-o-Y Growth Rate Comparison by Application (2016-2032)
- Table 43: North America Electrical Bushing Market Market Y-o-Y Growth Rate Comparison by End User (2016-2032)
- Table 44: North America Electrical Bushing Market Market Share Comparison by Country (2016-2032)
- Table 45: North America Electrical Bushing Market Market Share Comparison by Product Type (2016-2032)
- Table 46: North America Electrical Bushing Market Market Share Comparison by Insulation (2016-2032)
- Table 47: North America Electrical Bushing Market Market Share Comparison by Voltage (2016-2032)
- Table 48: North America Electrical Bushing Market Market Share Comparison by Application (2016-2032)
- Table 49: North America Electrical Bushing Market Market Share Comparison by End User (2016-2032)
- Table 50: Western Europe Electrical Bushing Market Market Comparison by Product Type (2016-2032)
- Table 51: Western Europe Electrical Bushing Market Market Comparison by Insulation (2016-2032)
- Table 52: Western Europe Electrical Bushing Market Market Comparison by Voltage (2016-2032)
- Table 53: Western Europe Electrical Bushing Market Market Comparison by Application (2016-2032)
- Table 54: Western Europe Electrical Bushing Market Market Comparison by End User (2016-2032)
- Table 55: Western Europe Electrical Bushing Market Revenue (US$ Mn) Comparison by Country (2016-2032)
- Table 56: Western Europe Electrical Bushing Market Market Revenue (US$ Mn) (2016-2032)
- Table 57: Western Europe Electrical Bushing Market Market Revenue (US$ Mn) Comparison by Country (2016-2032)
- Table 58: Western Europe Electrical Bushing Market Market Revenue (US$ Mn) Comparison by Product Type (2016-2032)
- Table 59: Western Europe Electrical Bushing Market Market Revenue (US$ Mn) Comparison by Insulation (2016-2032)
- Table 60: Western Europe Electrical Bushing Market Market Revenue (US$ Mn) Comparison by Voltage (2016-2032)
- Table 61: Western Europe Electrical Bushing Market Market Revenue (US$ Mn) Comparison by Application (2016-2032)
- Table 62: Western Europe Electrical Bushing Market Market Revenue (US$ Mn) Comparison by End User (2016-2032)
- Table 63: Western Europe Electrical Bushing Market Market Y-o-Y Growth Rate Comparison by Country (2016-2032)
- Table 64: Western Europe Electrical Bushing Market Market Y-o-Y Growth Rate Comparison by Product Type (2016-2032)
- Table 65: Western Europe Electrical Bushing Market Market Y-o-Y Growth Rate Comparison by Insulation (2016-2032)
- Table 66: Western Europe Electrical Bushing Market Market Y-o-Y Growth Rate Comparison by Voltage (2016-2032)
- Table 67: Western Europe Electrical Bushing Market Market Y-o-Y Growth Rate Comparison by Application (2016-2032)
- Table 68: Western Europe Electrical Bushing Market Market Y-o-Y Growth Rate Comparison by End User (2016-2032)
- Table 69: Western Europe Electrical Bushing Market Market Share Comparison by Country (2016-2032)
- Table 70: Western Europe Electrical Bushing Market Market Share Comparison by Product Type (2016-2032)
- Table 71: Western Europe Electrical Bushing Market Market Share Comparison by Insulation (2016-2032)
- Table 72: Western Europe Electrical Bushing Market Market Share Comparison by Voltage (2016-2032)
- Table 73: Western Europe Electrical Bushing Market Market Share Comparison by Application (2016-2032)
- Table 74: Western Europe Electrical Bushing Market Market Share Comparison by End User (2016-2032)
- Table 75: Eastern Europe Electrical Bushing Market Market Comparison by Product Type (2016-2032)
- Table 76: Eastern Europe Electrical Bushing Market Market Comparison by Insulation (2016-2032)
- Table 77: Eastern Europe Electrical Bushing Market Market Comparison by Voltage (2016-2032)
- Table 78: Eastern Europe Electrical Bushing Market Market Comparison by Application (2016-2032)
- Table 79: Eastern Europe Electrical Bushing Market Market Comparison by End User (2016-2032)
- Table 80: Eastern Europe Electrical Bushing Market Revenue (US$ Mn) Comparison by Country (2016-2032)
- Table 81: Eastern Europe Electrical Bushing Market Market Revenue (US$ Mn) (2016-2032)
- Table 82: Eastern Europe Electrical Bushing Market Market Revenue (US$ Mn) Comparison by Country (2016-2032)
- Table 83: Eastern Europe Electrical Bushing Market Market Revenue (US$ Mn) Comparison by Product Type (2016-2032)
- Table 84: Eastern Europe Electrical Bushing Market Market Revenue (US$ Mn) Comparison by Insulation (2016-2032)
- Table 85: Eastern Europe Electrical Bushing Market Market Revenue (US$ Mn) Comparison by Voltage (2016-2032)
- Table 86: Eastern Europe Electrical Bushing Market Market Revenue (US$ Mn) Comparison by Application (2016-2032)
- Table 87: Eastern Europe Electrical Bushing Market Market Revenue (US$ Mn) Comparison by End User (2016-2032)
- Table 88: Eastern Europe Electrical Bushing Market Market Y-o-Y Growth Rate Comparison by Country (2016-2032)
- Table 89: Eastern Europe Electrical Bushing Market Market Y-o-Y Growth Rate Comparison by Product Type (2016-2032)
- Table 90: Eastern Europe Electrical Bushing Market Market Y-o-Y Growth Rate Comparison by Insulation (2016-2032)
- Table 91: Eastern Europe Electrical Bushing Market Market Y-o-Y Growth Rate Comparison by Voltage (2016-2032)
- Table 92: Eastern Europe Electrical Bushing Market Market Y-o-Y Growth Rate Comparison by Application (2016-2032)
- Table 93: Eastern Europe Electrical Bushing Market Market Y-o-Y Growth Rate Comparison by End User (2016-2032)
- Table 94: Eastern Europe Electrical Bushing Market Market Share Comparison by Country (2016-2032)
- Table 95: Eastern Europe Electrical Bushing Market Market Share Comparison by Product Type (2016-2032)
- Table 96: Eastern Europe Electrical Bushing Market Market Share Comparison by Insulation (2016-2032)
- Table 97: Eastern Europe Electrical Bushing Market Market Share Comparison by Voltage (2016-2032)
- Table 98: Eastern Europe Electrical Bushing Market Market Share Comparison by Application (2016-2032)
- Table 99: Eastern Europe Electrical Bushing Market Market Share Comparison by End User (2016-2032)
- Table 100: APAC Electrical Bushing Market Market Comparison by Product Type (2016-2032)
- Table 101: APAC Electrical Bushing Market Market Comparison by Insulation (2016-2032)
- Table 102: APAC Electrical Bushing Market Market Comparison by Voltage (2016-2032)
- Table 103: APAC Electrical Bushing Market Market Comparison by Application (2016-2032)
- Table 104: APAC Electrical Bushing Market Market Comparison by End User (2016-2032)
- Table 105: APAC Electrical Bushing Market Revenue (US$ Mn) Comparison by Country (2016-2032)
- Table 106: APAC Electrical Bushing Market Market Revenue (US$ Mn) (2016-2032)
- Table 107: APAC Electrical Bushing Market Market Revenue (US$ Mn) Comparison by Country (2016-2032)
- Table 108: APAC Electrical Bushing Market Market Revenue (US$ Mn) Comparison by Product Type (2016-2032)
- Table 109: APAC Electrical Bushing Market Market Revenue (US$ Mn) Comparison by Insulation (2016-2032)
- Table 110: APAC Electrical Bushing Market Market Revenue (US$ Mn) Comparison by Voltage (2016-2032)
- Table 111: APAC Electrical Bushing Market Market Revenue (US$ Mn) Comparison by Application (2016-2032)
- Table 112: APAC Electrical Bushing Market Market Revenue (US$ Mn) Comparison by End User (2016-2032)
- Table 113: APAC Electrical Bushing Market Market Y-o-Y Growth Rate Comparison by Country (2016-2032)
- Table 114: APAC Electrical Bushing Market Market Y-o-Y Growth Rate Comparison by Product Type (2016-2032)
- Table 115: APAC Electrical Bushing Market Market Y-o-Y Growth Rate Comparison by Insulation (2016-2032)
- Table 116: APAC Electrical Bushing Market Market Y-o-Y Growth Rate Comparison by Voltage (2016-2032)
- Table 117: APAC Electrical Bushing Market Market Y-o-Y Growth Rate Comparison by Application (2016-2032)
- Table 118: APAC Electrical Bushing Market Market Y-o-Y Growth Rate Comparison by End User (2016-2032)
- Table 119: APAC Electrical Bushing Market Market Share Comparison by Country (2016-2032)
- Table 120: APAC Electrical Bushing Market Market Share Comparison by Product Type (2016-2032)
- Table 121: APAC Electrical Bushing Market Market Share Comparison by Insulation (2016-2032)
- Table 122: APAC Electrical Bushing Market Market Share Comparison by Voltage (2016-2032)
- Table 123: APAC Electrical Bushing Market Market Share Comparison by Application (2016-2032)
- Table 124: APAC Electrical Bushing Market Market Share Comparison by End User (2016-2032)
- Table 125: Latin America Electrical Bushing Market Market Comparison by Product Type (2016-2032)
- Table 126: Latin America Electrical Bushing Market Market Comparison by Insulation (2016-2032)
- Table 127: Latin America Electrical Bushing Market Market Comparison by Voltage (2016-2032)
- Table 128: Latin America Electrical Bushing Market Market Comparison by Application (2016-2032)
- Table 129: Latin America Electrical Bushing Market Market Comparison by End User (2016-2032)
- Table 130: Latin America Electrical Bushing Market Revenue (US$ Mn) Comparison by Country (2016-2032)
- Table 131: Latin America Electrical Bushing Market Market Revenue (US$ Mn) (2016-2032)
- Table 132: Latin America Electrical Bushing Market Market Revenue (US$ Mn) Comparison by Country (2016-2032)
- Table 133: Latin America Electrical Bushing Market Market Revenue (US$ Mn) Comparison by Product Type (2016-2032)
- Table 134: Latin America Electrical Bushing Market Market Revenue (US$ Mn) Comparison by Insulation (2016-2032)
- Table 135: Latin America Electrical Bushing Market Market Revenue (US$ Mn) Comparison by Voltage (2016-2032)
- Table 136: Latin America Electrical Bushing Market Market Revenue (US$ Mn) Comparison by Application (2016-2032)
- Table 137: Latin America Electrical Bushing Market Market Revenue (US$ Mn) Comparison by End User (2016-2032)
- Table 138: Latin America Electrical Bushing Market Market Y-o-Y Growth Rate Comparison by Country (2016-2032)
- Table 139: Latin America Electrical Bushing Market Market Y-o-Y Growth Rate Comparison by Product Type (2016-2032)
- Table 140: Latin America Electrical Bushing Market Market Y-o-Y Growth Rate Comparison by Insulation (2016-2032)
- Table 141: Latin America Electrical Bushing Market Market Y-o-Y Growth Rate Comparison by Voltage (2016-2032)
- Table 142: Latin America Electrical Bushing Market Market Y-o-Y Growth Rate Comparison by Application (2016-2032)
- Table 143: Latin America Electrical Bushing Market Market Y-o-Y Growth Rate Comparison by End User (2016-2032)
- Table 144: Latin America Electrical Bushing Market Market Share Comparison by Country (2016-2032)
- Table 145: Latin America Electrical Bushing Market Market Share Comparison by Product Type (2016-2032)
- Table 146: Latin America Electrical Bushing Market Market Share Comparison by Insulation (2016-2032)
- Table 147: Latin America Electrical Bushing Market Market Share Comparison by Voltage (2016-2032)
- Table 148: Latin America Electrical Bushing Market Market Share Comparison by Application (2016-2032)
- Table 149: Latin America Electrical Bushing Market Market Share Comparison by End User (2016-2032)
- Table 150: Middle East & Africa Electrical Bushing Market Market Comparison by Product Type (2016-2032)
- Table 151: Middle East & Africa Electrical Bushing Market Market Comparison by Insulation (2016-2032)
- Table 152: Middle East & Africa Electrical Bushing Market Market Comparison by Voltage (2016-2032)
- Table 153: Middle East & Africa Electrical Bushing Market Market Comparison by Application (2016-2032)
- Table 154: Middle East & Africa Electrical Bushing Market Market Comparison by End User (2016-2032)
- Table 155: Middle East & Africa Electrical Bushing Market Revenue (US$ Mn) Comparison by Country (2016-2032)
- Table 156: Middle East & Africa Electrical Bushing Market Market Revenue (US$ Mn) (2016-2032)
- Table 157: Middle East & Africa Electrical Bushing Market Market Revenue (US$ Mn) Comparison by Country (2016-2032)
- Table 158: Middle East & Africa Electrical Bushing Market Market Revenue (US$ Mn) Comparison by Product Type (2016-2032)
- Table 159: Middle East & Africa Electrical Bushing Market Market Revenue (US$ Mn) Comparison by Insulation (2016-2032)
- Table 160: Middle East & Africa Electrical Bushing Market Market Revenue (US$ Mn) Comparison by Voltage (2016-2032)
- Table 161: Middle East & Africa Electrical Bushing Market Market Revenue (US$ Mn) Comparison by Application (2016-2032)
- Table 162: Middle East & Africa Electrical Bushing Market Market Revenue (US$ Mn) Comparison by End User (2016-2032)
- Table 163: Middle East & Africa Electrical Bushing Market Market Y-o-Y Growth Rate Comparison by Country (2016-2032)
- Table 164: Middle East & Africa Electrical Bushing Market Market Y-o-Y Growth Rate Comparison by Product Type (2016-2032)
- Table 165: Middle East & Africa Electrical Bushing Market Market Y-o-Y Growth Rate Comparison by Insulation (2016-2032)
- Table 166: Middle East & Africa Electrical Bushing Market Market Y-o-Y Growth Rate Comparison by Voltage (2016-2032)
- Table 167: Middle East & Africa Electrical Bushing Market Market Y-o-Y Growth Rate Comparison by Application (2016-2032)
- Table 168: Middle East & Africa Electrical Bushing Market Market Y-o-Y Growth Rate Comparison by End User (2016-2032)
- Table 169: Middle East & Africa Electrical Bushing Market Market Share Comparison by Country (2016-2032)
- Table 170: Middle East & Africa Electrical Bushing Market Market Share Comparison by Product Type (2016-2032)
- Table 171: Middle East & Africa Electrical Bushing Market Market Share Comparison by Insulation (2016-2032)
- Table 172: Middle East & Africa Electrical Bushing Market Market Share Comparison by Voltage (2016-2032)
- Table 173: Middle East & Africa Electrical Bushing Market Market Share Comparison by Application (2016-2032)
- Table 174: Middle East & Africa Electrical Bushing Market Market Share Comparison by End User (2016-2032)
- 1. Executive Summary
-
- ABB Group
- TRENCH Group (SIEMENS)
- General Electric
- Eaton
- Elliot Industries
- Gipro GMBH
- RHM International
- Toshiba
- Webster-Wilkinson
- Siemens (Germany)
- Nexans (France)
Our Clients


View Our Licence Options
