
E-Fuels Market Report By Renewable Source (Solar, Wind, Others), Fuel Type (E-methane, E-kerosene, E-methanol, E-ammonia, E-diesel, E-gasoline), By State (Gas, Liquid), By Production Method (Power-To-Liquid, Power-To-Gas, Gas-To-Liquid, Biologically Derived Fuels), By Technology (Hydrogen Technology [Electrolysis], Fischer-Tropsch, Reverse-Water-Gas-Shift [RWGS]), By Carbon Source (Point Source, Smokestack, Gas Well, Direct Air Capture), By Carbon Capture (Post-combustion, Pre-combustion), By End-use, By Region and Companies - Industry Segment Outlo
-
48187
-
June 2024
-
280
-


-
This report was compiled by Shreyas Rokade Shreyas Rokade is a seasoned Research Analyst with CMFE, bringing extensive expertise in market research and consulting, with a strong background in Chemical Engineering. Correspondence Team Lead-CMFE Linkedin | Detailed Market research Methodology Our methodology involves a mix of primary research, including interviews with leading mental health experts, and secondary research from reputable medical journals and databases. View Detailed Methodology Page
-
Quick Navigation
- Report Overview
- Key Takeaways
- Driving Factors
- Restraining Factors
- Renewable Source Analysis
- Fuel Type Analysis
- State Analysis
- Production Method Analysis
- Technology Analysis
- Carbon Source Analysis
- Carbon Capture Analysis
- End-Use Analysis
- Key Market Segments
- Growth Opportunities
- Trending Factors
- Regional Analysis
- Key Players Analysis
- Recent Developments
- Report Scope
Report Overview
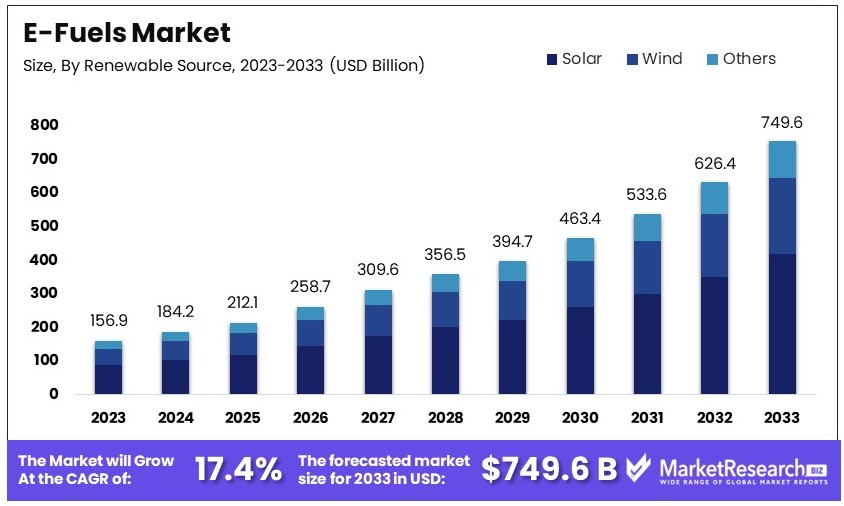
The Global E-Fuels Market size is expected to be worth around USD 749.6 Billion by 2033, from USD 156.9 Billion in 2023, growing at a CAGR of 17.4% during the forecast period from 2024 to 2033.
E-Fuels, or synthetic fuels, are manufactured by capturing and converting carbon dioxide from the atmosphere or by using renewable energy sources. This market is integral to sustainable mobility solutions, particularly in reducing carbon footprints of existing internal combustion engines.
E-Fuels are gaining traction among policymakers, automotive manufacturers, and energy sectors, looking to meet stringent environmental regulations while bridging the gap to fully renewable energy adoption.
The e-fuels market is poised for significant growth, driven by advances in renewable energy technologies and increasing global commitments to sustainable mobility. In 2023, renewable energy capacity surged by 50%, with solar PV constituting three-quarters of this expansion, signaling robust momentum in clean energy investments essential for e-fuels production.
This growth trajectory is supported by substantial increases in renewable energy deployment across key markets such as the United States, China, and the European Union, which collectively are enhancing their renewable capacity to meet escalating electricity demands.
Forecasts suggest that by 2025, renewable energy sources will produce 35% of global electricity, further enabling the production of synthetic fuels. Moreover, the rapid expansion in solar PV and wind capacity is projected to double by 2028, reinforcing the foundational infrastructure necessary for large-scale e-fuels production.
Despite these positive trends, there are challenges, notably in financing and equitable energy distribution, particularly in emerging economies. These disparities need addressing to fully harness the global potential of renewable energy for e-fuel production. Additionally, as renewable energy costs continue to decline, driven by technological advancements and economies of scale, the economic case for e-fuels becomes increasingly compelling, particularly as nations seek to decarbonize sectors such as transportation and industry.
The integration of rapidly growing renewable energy resources with advancements in e-fuels technology presents a transformative opportunity for sustainable mobility. It aligns with global energy security and environmental objectives, promising a substantial shift towards cleaner energy alternatives in the coming decades.
Key Takeaways
- Market Value: The E-Fuels Market was valued at USD 156.9 billion in 2023 and is expected to reach USD 749.6 billion by 2033, with a CAGR of 17.4%.
- By Renewable Source Analysis: Solar leads with 56.1%; essential for sustainable fuel production.
- By Fuel Type Analysis: E-diesel dominates with 28.4%; crucial for transitioning heavy transport to cleaner alternatives.
- By State Analysis: Liquid form has the majority at 74.5%; preferred for its ease of use in existing infrastructures.
- By Production Method Analysis: Power-To-Liquid leads with 37.4%; pivotal for converting renewable energy into liquid fuels.
- By Technology Analysis: Hydrogen Technology (Electrolysis) dominates at 46.4%; key for green fuel synthesis.
- By Carbon Source Analysis: Point source holds 28.9%; highlights focus on capturing emissions at origin.
- By Carbon Capture Analysis: Post-combustion captures the majority at 67.5%; significant for its applicability to existing plants.
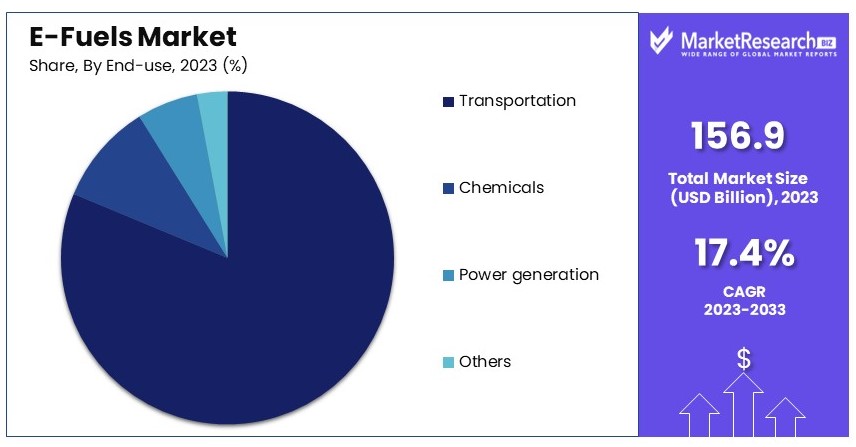
- By End-use Analysis: Transportation dominates at 82.4%; critical for reducing sector emissions.
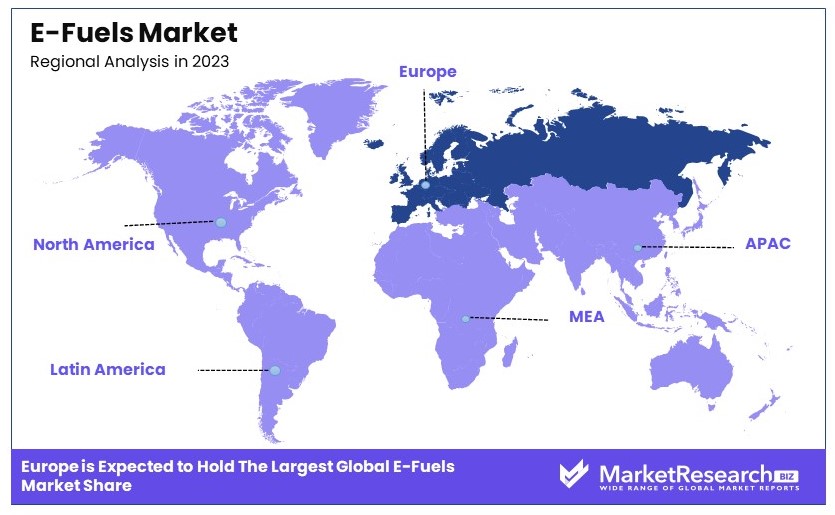
- Dominant Region: Europe leads with 41.4%; strong policy support for clean technologies.
- Analyst Viewpoint: High potential for growth, driven by environmental policies and technological advancements in carbon capture and renewable energy.
- Growth Opportunities: Innovations in production efficiency and partnerships with automotive manufacturers are crucial for market penetration and growth.
Driving Factors
Stringent Environmental Regulations and Carbon Reduction Targets Drive Market Growth
Governments worldwide are implementing stricter emissions standards and ambitious carbon reduction goals. This is driving the demand for cleaner fuel alternatives, such as e-fuels. E-fuels are carbon-neutral when produced using renewable energy infrastructure, making them a solution to meet these targets without major changes to existing infrastructure. For example, the European Union's Renewable Energy Directive II (RED II) recognizes e-fuels as a viable option to meet renewable energy targets in the transport sector. This regulatory support is pushing industries, especially aviation and shipping, to invest in e-fuel development and adoption.
The impact of these regulations is significant. Companies are increasingly looking for ways to comply with new standards while maintaining operational efficiency. The aviation sector, responsible for 2-3% of global carbon emissions, sees e-fuels as a critical component of its strategy to reduce emissions. This regulatory pressure, combined with the push for renewable energy, is creating a robust demand for e-fuels, encouraging further research, development, and market growth.
Compatibility with Existing Infrastructure Drives Market Growth
A key advantage driving the growth of e-fuels is their compatibility with current engines and fuel management systems. This significantly reduces the barriers to adoption compared to other alternative fuels that require extensive infrastructure changes. For instance, Porsche is investing heavily in e-fuel development, particularly for its classic car market. The company has partnered with Siemens Energy to build an e-fuel production plant in Chile. The aim is to produce carbon-neutral fuel that can be used in conventional combustion engines without modifications.
This compatibility allows for a gradual transition to cleaner fuels without rendering existing vehicles obsolete. The ability to use e-fuels in current engines means that consumers and businesses can adopt these fuels without incurring the high costs associated with replacing or retrofitting equipment. This factor is crucial in gaining acceptance and encouraging widespread use, thereby driving market growth.
Increasing Investment from Major Energy and Automotive Companies Drives Market Growth
The e-fuels market is seeing substantial growth due to significant investments from established players in the energy and automotive sectors. These companies recognize the potential of e-fuels as a long-term solution for reducing emissions while maintaining their core business models. For instance, ExxonMobil has partnered with Porsche to test e-fuels in race conditions, while Shell is investing in e-fuel production facilities.
These investments are driving technological advancements and helping to scale up production. As a result, production costs are expected to decrease over time, making e-fuels more competitive with traditional fuels. The involvement of major companies also brings credibility and financial resources, accelerating the development and commercialization of e-fuels. This investment from key industry players is crucial in establishing a sustainable market for e-fuels, contributing significantly to their growth and adoption.
Restraining Factors
High Production Costs Restrain Market Growth
The production of e-fuels is significantly more expensive than conventional fossil fuels. This high cost is due to the energy-intensive process required to synthesize these fuels and the substantial investment needed in renewable energy infrastructure. According to the International Council on Clean Transportation (ICCT), e-fuels can cost between 3 to 6 times more than conventional jet fuel.
This significant price difference poses a major challenge for the widespread adoption of e-fuels, particularly in price-sensitive markets. Without substantial subsidies or regulatory support, it is difficult for e-fuels to compete economically. This cost disparity limits the market penetration of e-fuels in the short to medium term, hindering their growth and acceptance as a viable alternative to fossil fuels.
Low Energy Efficiency in Production Restrains Market Growth
The production of e-fuels involves multiple energy conversion steps, each resulting in efficiency losses. Consequently, the overall energy efficiency of e-fuels is relatively low compared to direct electrification solutions. Research by Transport & Environment indicates that the well-to-wheel efficiency of e-fuels in cars is only about 13%, whereas battery-electric vehicles achieve around 72%.
This low efficiency not only leads to higher production costs but also raises concerns about the scalability of e-fuels as a primary solution for decarbonization. In sectors where direct electrification is feasible, the inefficiency of e-fuels makes them a less attractive option. This inefficiency poses a significant barrier to the adoption and growth of the e-fuels market.
Renewable Source Analysis
Solar dominates with 56.1% due to abundant availability and decreasing costs.
The solar segment leads the e-fuels market, capturing 56.1% of the market share. This dominance is primarily due to the abundant availability of solar energy and the continuous decrease in solar panel costs. Solar energy is harnessed through photovoltaic cells that convert sunlight directly into electricity, which is then used in the production of e-fuels. The widespread adoption of solar technology has been driven by significant advancements in efficiency and a steady decline in installation costs. These factors make solar energy an attractive and cost-effective option for e-fuel production.
The wind energy segment, while also significant, holds a smaller share. Wind turbines convert kinetic energy from wind into electricity, which can then be used to produce e-fuels. Wind energy is particularly effective in regions with consistent and strong wind patterns. However, the variability in wind speeds and the need for substantial initial investments in infrastructure pose challenges. Despite these hurdles, wind energy remains a crucial component of the renewable energy mix for e-fuel production, offering a complementary solution to solar energy.
Other renewable sources, including hydropower and geothermal energy, play a smaller but essential role in the e-fuels market. These sources provide reliable and steady energy outputs, crucial for maintaining consistent e-fuel production. Hydropower, in particular, offers a stable and high-capacity energy source, while geothermal energy provides a sustainable and low-emission alternative. The integration of diverse renewable sources ensures a balanced and resilient energy supply for e-fuel production, contributing to overall market growth.
Fuel Type Analysis
E-diesel dominates with 28.4% due to compatibility with existing diesel engines.
E-diesel leads the e-fuels market with a 28.4% share. This dominance is attributed to its compatibility with existing diesel engines and infrastructure. E-diesel can be used as a drop-in replacement for conventional diesel, requiring no modifications to engines or fuel distribution systems. This ease of integration makes e-diesel an attractive option for various sectors, including transportation and industrial applications. The ability to seamlessly transition from fossil fuels to e-diesel supports the adoption of e-fuels and drives market growth.
E-methanol and e-kerosene are other significant sub-segments in the e-fuels market. E-methanol, produced from hydrogen and carbon dioxide, is used as a fuel in both internal combustion engines and fuel cells. It is also a key feedstock for the chemical industry. The versatility of e-methanol in different applications supports its market presence, though its share is smaller compared to e-diesel.
E-kerosene, primarily used in aviation, is crucial for reducing the carbon footprint of air travel. The aviation industry is a significant source of greenhouse gas emissions, and the adoption of e-kerosene offers a sustainable alternative. However, the high costs of production and the stringent regulatory standards in the aviation sector pose challenges to its widespread adoption. Despite these challenges, e-kerosene plays a vital role in the decarbonization of aviation.
Other e-fuels, such as e-methane, e-ammonia, and e-gasoline, cater to niche markets with specific needs. E-methane is used in the gas grid and as a vehicle fuel, while e-ammonia serves as a zero-carbon fuel for shipping and a potential hydrogen carrier. E-gasoline, although less prevalent, provides a sustainable alternative for conventional gasoline engines. Each of these fuels contributes to the diversity and resilience of the e-fuels market.
State Analysis
Liquid fuels dominate with 74.5% due to ease of storage and transportation.
Liquid fuels hold a dominant position in the e-fuels market, accounting for 74.5% of the market share. The ease of storage and transportation of liquid fuels makes them the preferred choice for many applications, including transportation, power generation, and industrial uses. Liquid e-fuels can be stored in conventional tanks and transported using existing infrastructure, simplifying the transition from fossil fuels to sustainable alternatives.
Gaseous e-fuels, although important, occupy a smaller market share. These fuels, such as e-methane and e-hydrogen, are typically stored under high pressure or in liquefied form, which requires specialized infrastructure and safety measures. The high energy density and efficient combustion of gaseous e-fuels make them suitable for specific applications, such as heating and power generation. However, the challenges associated with storage and distribution limit their broader market penetration.
The dominance of liquid e-fuels is further supported by the ongoing development of power-to-liquid technologies. These technologies convert renewable electricity into liquid hydrocarbons, which can then be used as fuels. The versatility and compatibility of liquid e-fuels with existing infrastructure and technologies drive their market growth and support the transition to sustainable energy sources.
Production Method Analysis
Power-To-Liquid dominates with 37.4% due to efficiency and versatility.
The power-to-liquid (PtL) production method leads the e-fuels market, capturing 37.4% of the market share. PtL processes convert renewable electricity into liquid hydrocarbons, offering a versatile and efficient method for producing e-fuels. This method involves the electrolysis of water to produce hydrogen, which is then combined with carbon dioxide to create liquid fuels. The efficiency and scalability of PtL technology make it a preferred choice for producing various e-fuels, including e-diesel and e-kerosene.
Power-to-gas (PtG) and gas-to-liquid (GtL) methods also play significant roles in the e-fuels market. PtG processes produce gaseous e-fuels, such as e-methane and e-hydrogen, by converting renewable electricity. These fuels are used in applications where high energy density and clean combustion are essential. The GtL process, on the other hand, converts natural gas or biogas into liquid fuels, providing an additional pathway for e-fuel production.
Biologically derived fuels, although smaller in market share, contribute to the diversity of the e-fuels landscape. These fuels are produced from biomass through processes such as anaerobic digestion and fermentation. Biologically derived e-fuels offer sustainable alternatives to traditional fossil fuels and play a role in reducing greenhouse gas emissions.
The dominance of PtL technology is driven by its ability to produce high-quality liquid fuels that can be used in existing engines and infrastructure. The ongoing advancements in PtL technology, including improved catalysts and process optimization, enhance its efficiency and cost-effectiveness. As renewable energy sources become more prevalent, the adoption of PtL methods for e-fuel production is expected to increase, further solidifying its market leadership.
Technology Analysis
Hydrogen Technology (Electrolysis) dominates with 46.4% due to its efficiency and scalability.
Hydrogen technology, particularly electrolysis, leads the e-fuels market with a 46.4% share. Electrolysis uses renewable electricity to split water into hydrogen and oxygen, providing a clean and efficient method for producing hydrogen. This hydrogen is a critical feedstock for various e-fuels, including e-methanol and e-ammonia. The scalability and efficiency of electrolysis make it a cornerstone of the e-fuels market, supporting the production of diverse and sustainable fuels.
The Fischer-Tropsch (FT) process and reverse-water-gas-shift (RWGS) technology are also significant in the e-fuels market. The FT process converts synthesis gas, a mixture of hydrogen and carbon monoxide, into liquid hydrocarbons. This technology is used in power-to-liquid methods and is essential for producing high-quality e-diesel and e-kerosene. The RWGS process, on the other hand, converts carbon dioxide and hydrogen into carbon monoxide and water, providing a pathway for synthesizing various e-fuels.
The dominance of technology is driven by its versatility and compatibility with renewable energy sources. Electrolysis can be integrated with solar, wind, and other renewable power sources, enabling the production of green hydrogen. This hydrogen can then be stored, transported, and converted into a range of e-fuels, supporting the transition to a sustainable energy system. The continued development and optimization of hydrogen technology, including improvements in electrolyzer efficiency and cost reduction, are expected to drive further growth in the e-fuels market.
Carbon Source Analysis
Point source carbon dominates with 28.9% due to availability and efficiency.
Point source carbon capture leads the e-fuels market with a 28.9% share. This method involves capturing carbon dioxide emissions directly from industrial sources, such as power plants and factories. The captured CO2 is then used as a feedstock for producing e-fuels. The availability of concentrated CO2 emissions at point sources makes this method efficient and cost-effective. Point source carbon capture helps reduce greenhouse gas emissions and supports the production of sustainable e-fuels.
Smokestack and gas well sources also contribute to the carbon capture landscape. Smokestack carbon capture targets emissions from various industrial processes, including cement and steel production. Gas wells capture CO2 from natural gas production, providing an additional source of carbon for e-fuel production. Both methods play important roles in reducing emissions and supporting the e-fuels market.
Direct air capture (DAC) is an emerging technology that captures CO2 directly from the atmosphere. DAC offers the potential to remove CO2 emissions regardless of their source, providing a versatile solution for carbon capture. Although currently more expensive than point source capture, DAC technology is rapidly advancing, with the potential to significantly impact the e-fuels market in the future.
The dominance of point source carbon capture is driven by its efficiency and lower cost compared to other methods. The integration of carbon capture technologies with renewable energy sources supports the production of sustainable e-fuels and contributes to overall market growth. As carbon capture technologies continue to evolve, their role in the e-fuels market is expected to expand, providing diverse and sustainable solutions for reducing greenhouse gas emissions.
Carbon Capture Analysis
Post-combustion dominates with 67.5% due to its established technology and compatibility with existing infrastructure.
Post-combustion carbon capture leads the market, holding 67.5% of the share. This method involves capturing CO2 emissions after fossil fuels have been burned. It is widely used because it can be retrofitted to existing power plants and industrial facilities, making it a flexible and cost-effective option. The technology for post-combustion capture is well-developed and continues to improve, enhancing its efficiency and reducing costs over time.
Pre-combustion carbon capture, while significant, occupies a smaller market share. This method involves capturing CO2 before fossil fuels are burned, typically during the gasification process. Pre-combustion capture is highly efficient and results in a cleaner final product, but it is more complex and costly to implement. It is mainly used in new power plants or industrial facilities designed with this technology in mind. The higher initial investment and infrastructure requirements limit its broader application compared to post-combustion capture.
The dominance of post-combustion carbon capture is driven by its ease of integration with existing infrastructure and its ability to be applied across a wide range of industries. As regulations on CO2 emissions become stricter, the demand for effective carbon capture solutions grows. Post-combustion capture provides a viable solution for industries looking to reduce their carbon footprint without completely overhauling their existing systems. The continued advancements in this technology, such as improved solvents and capture materials, further enhance its appeal and effectiveness.
End-Use Analysis
Transportation dominates with 82.4% due to the high demand for sustainable fuel alternatives.
The transportation sector holds 82.4% of the e-fuels market. The high demand for sustainable fuel alternatives drives this dominance. E-fuels provide a cleaner option for powering vehicles, reducing greenhouse gas emissions compared to traditional fossil fuels. They can be used in existing internal combustion engines with little to no modification, making them an attractive solution for reducing emissions in the transportation sector.
The chemicals industry also plays a significant role in the e-fuels market. E-fuels can be used as feedstocks in chemical production, providing a sustainable alternative to fossil-based raw materials. This use helps the chemicals industry reduce its carbon footprint and aligns with the growing demand for sustainable and eco-friendly products. Although the market share is smaller than transportation, the potential for growth in this segment is substantial as more chemical companies seek to adopt greener practices.
Power generation is another important end-use segment. E-fuels can be used to generate electricity in power plants, especially during times when renewable energy sources like wind and solar power are not available. This flexibility helps stabilize the power grid and ensures a reliable energy supply. The use of e-fuels in power generation supports the transition to a low-carbon energy system. However, the current share is smaller compared to transportation and chemicals due to the higher costs associated with e-fuel production for power generation.
Other end-use applications, such as industrial heating and residential use, contribute to the overall market for e-fuels. These applications benefit from the versatility and sustainability of e-fuels, but they represent a smaller share of the market due to the availability of other renewable energy sources and the higher costs of e-fuels.
Key Market Segments
By Renewable Source
- Solar
- Wind
- Others
By Fuel Type
- E-methane
- E-kerosene
- E-methanol
- E-ammonia
- E-diesel
- E-gasoline
By State
- Gas
- Liquid
By Production Method
- Power-To-Liquid
- Power-To-Gas
- Gas-To-Liquid
- Biologically Derived Fuels
By Technology
- Hydrogen Technology (Electrolysis)
- Fischer-Tropsch
- Reverse-Water-Gas-Shift (RWGS)
By Carbon Source
- Point source
- Smokestack
- Gas well
- Direct air capture
By Carbon Capture
- Post-combustion
- Pre-combustion
By End-use
- Transportation
- Chemicals
- Power generation
- Others
Growth Opportunities
Expansion in the Aviation Sector Offers Growth Opportunity
The aviation sector is a major opportunity for e-fuels due to its need for high-energy-density fuels and challenges in electrification. Airlines are under pressure to cut emissions, making e-fuels an attractive solution. E-fuels can be used in existing aircraft without significant modifications.
For example, Lufthansa's partnership with Heide refinery in Germany to develop synthetic kerosene is a key initiative. This synthetic fuel can be blended with conventional jet fuel, paving the way for broader adoption. The aviation industry's shift towards sustainable fuels could create a significant market for e-fuel producers, driving growth and innovation in this sector.
Integration with Renewable Energy Projects Offers Growth Opportunity
Integrating e-fuel production with renewable energy projects offers a significant growth opportunity. Regions with abundant solar or wind resources can utilize excess energy to produce e-fuels, balancing the grid.
The HyDeal Ambition project in Europe is an example, aiming to produce green hydrogen at €1.5/kg by 2030 using large-scale solar installations in Spain. This hydrogen can be processed into e-fuels, reducing production costs and enhancing efficiency. Such projects not only lower the cost of e-fuels but also support the stability and expansion of renewable energy systems, driving the market for sustainable fuels.
Trending Factors
Government Incentives and Mandates Are Trending Factors
Government policies are crucial in promoting e-fuels. Incentives and mandates make e-fuels competitive with conventional fuels, driving market growth. Germany targets 2% of jet fuel to be e-fuels by 2030, supported by a €640 million investment.
The EU's ReFuelEU Aviation initiative also mandates minimum shares for sustainable aviation fuels, including e-fuels. These policies create a guaranteed market for e-fuel producers. As governments worldwide adopt similar measures, the demand for e-fuels will increase, encouraging more production and technological advancements, making e-fuels a trending factor in the energy market.
Advancements in Carbon Capture Technology Are Trending Factors
Advances in direct air capture (DAC) technology are essential for scaling e-fuel production and improving environmental impact. DAC makes sourcing CO2 for e-fuel production easier and cheaper. Companies like Climeworks lead this trend, partnering with Synhelion to produce solar fuels using DAC technology.
Such collaborations demonstrate the potential for efficient and sustainable e-fuel production processes. As DAC technology improves, it will lower the cost and enhance the environmental benefits of e-fuels, driving their adoption and making them a significant trend in the renewable energy market.
Regional Analysis
Europe Dominates with 41.4% Market Share in the E-Fuels Market
Europe's commanding 41.4% market share in the e-fuels market is driven by stringent environmental regulations and aggressive carbon reduction targets. The region’s commitment to achieving net-zero emissions by 2050 necessitates innovation in sustainable fuels, positioning e-fuels as a key component. Additionally, Europe benefits from substantial government funding and partnerships between public and private sectors, fostering research, development, and deployment of e-fuels technologies.
The European e-fuels market thrives on a foundation of advanced renewable energy capabilities and robust policy support, including incentives for clean energy technologies. High consumer awareness and demand for sustainable transportation options further stimulate the market. The region's well-established automotive industry is pivoting towards sustainable practices, integrating e-fuels into their long-term strategies to comply with future emissions standards.
Regional Market Shares and Statistics:
- North America: Holds about 25% of the market, driven by increasing investments in clean technologies and rising policy initiatives supporting green energy transitions.
- Asia Pacific: Accounts for approximately 20% of the market. The region's growth is fueled by rapid industrialization and heightened environmental policies, particularly in countries like China and Japan.
- Middle East & Africa: This region represents around 7% of the market. Investments in renewable energy sources and efforts to diversify energy economies contribute to the growth of e-fuels.
- Latin America: With around 7% market share, growth is spurred by the emerging policy frameworks supporting renewable energy and the potential for regional integration of bio-based e-fuel production.
Key Regions and Countries
- North America
- The US
- Canada
- Mexico
- Western Europe
- Germany
- France
- The UK
- Spain
- Italy
- Portugal
- Ireland
- Austria
- Switzerland
- Benelux
- Nordic
- Rest of Western Europe
- Eastern Europe
- Russia
- Poland
- The Czech Republic
- Greece
- Rest of Eastern Europe
- APAC
- China
- Japan
- South Korea
- India
- Australia & New Zealand
- Indonesia
- Malaysia
- Philippines
- Singapore
- Thailand
- Vietnam
- Rest of APAC
- Latin America
- Brazil
- Colombia
- Chile
- Argentina
- Costa Rica
- Rest of Latin America
- Middle East & Africa
- Algeria
- Egypt
- Israel
- Kuwait
- Nigeria
- Saudi Arabia
- South Africa
- Turkey
- United Arab Emirates
- Rest of MEA
Key Players Analysis
The e-fuels market is growing rapidly, driven by innovation and sustainability goals. Leading companies like Royal Dutch Shell plc and Audi AG are at the forefront, leveraging their strong market positions and extensive research investments to drive adoption and influence market trends.
BMW AG and Toyota Motor Corporation are integrating e-fuels into their sustainable mobility strategies, enhancing their market influence and promoting eco-friendly transportation solutions.
Neste Oyj and Sasol Limited are significant players, focusing on advanced biofuels and sustainable production methods. Their expertise in chemical processes strengthens their strategic positioning in the market.
Enel SpA and Siemens Energy AG are pivotal in the energy sector, promoting e-fuels through clean energy projects and technological advancements. Their initiatives support market growth and transition to renewable energy sources.
Companies like LanzaTech Inc. and Climeworks AG are innovating with carbon capture and conversion technologies, creating sustainable e-fuels from waste and atmospheric CO2. Their cutting-edge solutions impact market dynamics by offering environmentally friendly alternatives.
Overall, the e-fuels market is characterized by a diverse range of companies focusing on innovation, sustainability, and strategic partnerships. The combined efforts of established corporations and emerging innovators are driving the market towards a cleaner, more sustainable future.
Market Key Players
- Archer Daniels Midland Co.
- Audi AG
- Ballard Power Systems, Inc.
- BMW AG
- Cargill Inc.
- Ceres Power Holding Plc
- Clariant International Ltd.
- Clean Fuels Alliance America
- Climeworks AG
- Covestro AG
- E-Fuel Corporation
- eFuel Pacific Limited
- Enel SpA
- Enerkem Inc.
- Global Bioenergies SA
- Groupe Renault
- Hexagon Agility
- INEOS Group AG
- LanzaTech Inc.
- Mitsubishi Chemical Corporation
- Neste Oyj
- Norsk e-Fuel AS
- Repsol SA
- Royal Dutch Shell plc
- Sasol Limited
- Siemens Energy AG
- Stora Enso Oyj
- Sunfire GmbH
- Toyota Motor Corporation
Recent Developments
- January 2024: Clariant International Ltd E-Fuels segment recorded a 12% rise in sales, achieving monthly earnings of $250 million, largely due to the implementation of new carbon capture and utilization technologies.
- July 2023: ADM's E-Fuels division recorded a significant milestone, achieving a 7% reduction in production costs due to advancements in carbon capture technologies, enhancing profitability by $15 million.
Report Scope
Report Features Description Market Value (2023) USD 156.9 Billion Forecast Revenue (2033) USD 749.6 Billion CAGR (2024-2033) 17.4% Base Year for Estimation 2023 Historic Period 2018-2023 Forecast Period 2024-2033 Report Coverage Revenue Forecast, Market Dynamics, Competitive Landscape, Recent Developments Segments Covered By Renewable Source (Solar, Wind, Others), Fuel Type (E-methane, E-kerosene, E-methanol, E-ammonia, E-diesel, E-gasoline), By State (Gas, Liquid), By Production Method (Power-To-Liquid, Power-To-Gas, Gas-To-Liquid, Biologically Derived Fuels), By Technology (Hydrogen Technology [Electrolysis], Fischer-Tropsch, Reverse-Water-Gas-Shift [RWGS]), By Carbon Source (Point Source, Smokestack, Gas Well, Direct Air Capture), By Carbon Capture (Post-combustion, Pre-combustion), By End-use (Transportation, Chemicals, Power Generation, Others) Regional Analysis North America - The US, Canada, & Mexico; Western Europe - Germany, France, The UK, Spain, Italy, Portugal, Ireland, Austria, Switzerland, Benelux, Nordic, & Rest of Western Europe; Eastern Europe - Russia, Poland, The Czech Republic, Greece, & Rest of Eastern Europe; APAC - China, Japan, South Korea, India, Australia & New Zealand, Indonesia, Malaysia, Philippines, Singapore, Thailand, Vietnam, & Rest of APAC; Latin America - Brazil, Colombia, Chile, Argentina, Costa Rica, & Rest of Latin America; Middle East & Africa - Algeria, Egypt, Israel, Kuwait, Nigeria, Saudi Arabia, South Africa, Turkey, United Arab Emirates, & Rest of MEA Competitive Landscape Archer Daniels Midland Co., Audi AG , Ballard Power Systems, Inc., BMW AG, Cargill Inc. , Ceres Power Holding Plc, Clariant International Ltd. , Clean Fuels Alliance America, Climeworks AG, Covestro AG , E-Fuel Corporation, eFuel Pacific Limited, Enel SpA , Enerkem Inc. , Global Bioenergies SA , Groupe Renault , Hexagon Agility, INEOS Group AG , LanzaTech Inc. , Mitsubishi Chemical Corporation , Neste Oyj , Norsk e-Fuel AS, Repsol SA , Royal Dutch Shell plc , Sasol Limited , Siemens Energy AG , Stora Enso Oyj , Sunfire GmbH , Toyota Motor Corporation Customization Scope Customization for segments, region/country-level will be provided. Moreover, additional customization can be done based on the requirements. Purchase Options We have three licenses to opt for: Single User License, Multi-User License (Up to 5 Users), Corporate Use License (Unlimited User and Printable PDF) -
- 1. Executive Summary
- 1.1. Definition
- 1.2. Taxonomy
- 1.3. Research Scope
- 1.4. Key Analysis
- 1.5. Key Findings by Major Segments
- 1.6. Top strategies by Major Players
- 2. Global E-Fuels Market Overview
- 2.1. E-Fuels Market Dynamics
- 2.1.1. Drivers
- 2.1.2. Opportunities
- 2.1.3. Restraints
- 2.1.4. Challenges
- 2.2. Macro-economic Factors
- 2.3. Regulatory Framework
- 2.4. Market Investment Feasibility Index
- 2.5. PEST Analysis
- 2.6. PORTER’S Five Force Analysis
- 2.7. Drivers & Restraints Impact Analysis
- 2.8. Industry Chain Analysis
- 2.9. Cost Structure Analysis
- 2.10. Marketing Strategy
- 2.11. Russia-Ukraine War Impact Analysis
- 2.12. Opportunity Map Analysis
- 2.13. Market Competition Scenario Analysis
- 2.14. Product Life Cycle Analysis
- 2.15. Opportunity Orbits
- 2.16. Manufacturer Intensity Map
- 2.17. Major Companies sales by Value & Volume
- 2.1. E-Fuels Market Dynamics
- 3. Global E-Fuels Market Analysis, Opportunity and Forecast, 2016-2032
- 3.1. Global E-Fuels Market Analysis, 2016-2021
- 3.2. Global E-Fuels Market Opportunity and Forecast, 2023-2032
- 3.3. Global E-Fuels Market Analysis, Opportunity and Forecast, By Renewable Source , 2016-2032
- 3.3.1. Global E-Fuels Market Analysis by Renewable Source : Introduction
- 3.3.2. Market Size Absolute $ Opportunity Analysis and Forecast, By Renewable Source , 2016-2032
- 3.3.3. Solar
- 3.3.4. Winds
- 3.3.5. Others
- 3.4. Global E-Fuels Market Analysis, Opportunity and Forecast, By Fuel Type, 2016-2032
- 3.4.1. Global E-Fuels Market Analysis by Fuel Type: Introduction
- 3.4.2. Market Size Absolute $ Opportunity Analysis and Forecast, By Fuel Type, 2016-2032
- 3.4.3. E-methane
- 3.4.4. E-kerosene
- 3.4.5. E-methanol
- 3.4.6. E-ammonia
- 3.4.7. E-diesel
- 3.4.8. E-gasoline
- 3.5. Global E-Fuels Market Analysis, Opportunity and Forecast, By State, 2016-2032
- 3.5.1. Global E-Fuels Market Analysis by State: Introduction
- 3.5.2. Market Size Absolute $ Opportunity Analysis and Forecast, By State, 2016-2032
- 3.5.3. Gas
- 3.5.4. Liquid
- 3.6. Global E-Fuels Market Analysis, Opportunity and Forecast, By Production Method , 2016-2032
- 3.6.1. Global E-Fuels Market Analysis by Production Method : Introduction
- 3.6.2. Market Size Absolute $ Opportunity Analysis and Forecast, By Production Method , 2016-2032
- 3.6.3. Power-To-Liquid
- 3.6.4. Power-To-Gas
- 3.6.5. Gas-To-Liquid
- 3.6.6. Biologically Derived Fuels
- 3.7. Global E-Fuels Market Analysis, Opportunity and Forecast, By Technology , 2016-2032
- 3.7.1. Global E-Fuels Market Analysis by Technology : Introduction
- 3.7.2. Market Size Absolute $ Opportunity Analysis and Forecast, By Technology , 2016-2032
- 3.7.3. Hydrogen Technology (Electrolysis)
- 3.7.4. Fischer-Tropsch
- 3.7.5. Reverse-Water-Gas-Shift (RWGS)
- 3.8. Global E-Fuels Market Analysis, Opportunity and Forecast, By End-use , 2016-2032
- 3.8.1. Global E-Fuels Market Analysis by End-use : Introduction
- 3.8.2. Market Size Absolute $ Opportunity Analysis and Forecast, By End-use , 2016-2032
- 3.8.3. Transportation
- 3.8.4. Chemicals
- 3.8.5. Power generation
- 3.8.6. Others
- 4. North America E-Fuels Market Analysis, Opportunity and Forecast, 2016-2032
- 4.1. North America E-Fuels Market Analysis, 2016-2021
- 4.2. North America E-Fuels Market Opportunity and Forecast, 2023-2032
- 4.3. North America E-Fuels Market Analysis, Opportunity and Forecast, By Renewable Source , 2016-2032
- 4.3.1. North America E-Fuels Market Analysis by Renewable Source : Introduction
- 4.3.2. Market Size Absolute $ Opportunity Analysis and Forecast, By Renewable Source , 2016-2032
- 4.3.3. Solar
- 4.3.4. Winds
- 4.3.5. Others
- 4.4. North America E-Fuels Market Analysis, Opportunity and Forecast, By Fuel Type, 2016-2032
- 4.4.1. North America E-Fuels Market Analysis by Fuel Type: Introduction
- 4.4.2. Market Size Absolute $ Opportunity Analysis and Forecast, By Fuel Type, 2016-2032
- 4.4.3. E-methane
- 4.4.4. E-kerosene
- 4.4.5. E-methanol
- 4.4.6. E-ammonia
- 4.4.7. E-diesel
- 4.4.8. E-gasoline
- 4.5. North America E-Fuels Market Analysis, Opportunity and Forecast, By State, 2016-2032
- 4.5.1. North America E-Fuels Market Analysis by State: Introduction
- 4.5.2. Market Size Absolute $ Opportunity Analysis and Forecast, By State, 2016-2032
- 4.5.3. Gas
- 4.5.4. Liquid
- 4.6. North America E-Fuels Market Analysis, Opportunity and Forecast, By Production Method , 2016-2032
- 4.6.1. North America E-Fuels Market Analysis by Production Method : Introduction
- 4.6.2. Market Size Absolute $ Opportunity Analysis and Forecast, By Production Method , 2016-2032
- 4.6.3. Power-To-Liquid
- 4.6.4. Power-To-Gas
- 4.6.5. Gas-To-Liquid
- 4.6.6. Biologically Derived Fuels
- 4.7. North America E-Fuels Market Analysis, Opportunity and Forecast, By Technology , 2016-2032
- 4.7.1. North America E-Fuels Market Analysis by Technology : Introduction
- 4.7.2. Market Size Absolute $ Opportunity Analysis and Forecast, By Technology , 2016-2032
- 4.7.3. Hydrogen Technology (Electrolysis)
- 4.7.4. Fischer-Tropsch
- 4.7.5. Reverse-Water-Gas-Shift (RWGS)
- 4.8. North America E-Fuels Market Analysis, Opportunity and Forecast, By End-use , 2016-2032
- 4.8.1. North America E-Fuels Market Analysis by End-use : Introduction
- 4.8.2. Market Size Absolute $ Opportunity Analysis and Forecast, By End-use , 2016-2032
- 4.8.3. Transportation
- 4.8.4. Chemicals
- 4.8.5. Power generation
- 4.8.6. Others
- 4.9. North America E-Fuels Market Analysis, Opportunity and Forecast, By Country , 2016-2032
- 4.9.1. North America E-Fuels Market Analysis by Country : Introduction
- 4.9.2. Market Size Absolute $ Opportunity Analysis and Forecast, Country , 2016-2032
- 4.9.2.1. The US
- 4.9.2.2. Canada
- 4.9.2.3. Mexico
- 5. Western Europe E-Fuels Market Analysis, Opportunity and Forecast, 2016-2032
- 5.1. Western Europe E-Fuels Market Analysis, 2016-2021
- 5.2. Western Europe E-Fuels Market Opportunity and Forecast, 2023-2032
- 5.3. Western Europe E-Fuels Market Analysis, Opportunity and Forecast, By Renewable Source , 2016-2032
- 5.3.1. Western Europe E-Fuels Market Analysis by Renewable Source : Introduction
- 5.3.2. Market Size Absolute $ Opportunity Analysis and Forecast, By Renewable Source , 2016-2032
- 5.3.3. Solar
- 5.3.4. Winds
- 5.3.5. Others
- 5.4. Western Europe E-Fuels Market Analysis, Opportunity and Forecast, By Fuel Type, 2016-2032
- 5.4.1. Western Europe E-Fuels Market Analysis by Fuel Type: Introduction
- 5.4.2. Market Size Absolute $ Opportunity Analysis and Forecast, By Fuel Type, 2016-2032
- 5.4.3. E-methane
- 5.4.4. E-kerosene
- 5.4.5. E-methanol
- 5.4.6. E-ammonia
- 5.4.7. E-diesel
- 5.4.8. E-gasoline
- 5.5. Western Europe E-Fuels Market Analysis, Opportunity and Forecast, By State, 2016-2032
- 5.5.1. Western Europe E-Fuels Market Analysis by State: Introduction
- 5.5.2. Market Size Absolute $ Opportunity Analysis and Forecast, By State, 2016-2032
- 5.5.3. Gas
- 5.5.4. Liquid
- 5.6. Western Europe E-Fuels Market Analysis, Opportunity and Forecast, By Production Method , 2016-2032
- 5.6.1. Western Europe E-Fuels Market Analysis by Production Method : Introduction
- 5.6.2. Market Size Absolute $ Opportunity Analysis and Forecast, By Production Method , 2016-2032
- 5.6.3. Power-To-Liquid
- 5.6.4. Power-To-Gas
- 5.6.5. Gas-To-Liquid
- 5.6.6. Biologically Derived Fuels
- 5.7. Western Europe E-Fuels Market Analysis, Opportunity and Forecast, By Technology , 2016-2032
- 5.7.1. Western Europe E-Fuels Market Analysis by Technology : Introduction
- 5.7.2. Market Size Absolute $ Opportunity Analysis and Forecast, By Technology , 2016-2032
- 5.7.3. Hydrogen Technology (Electrolysis)
- 5.7.4. Fischer-Tropsch
- 5.7.5. Reverse-Water-Gas-Shift (RWGS)
- 5.8. Western Europe E-Fuels Market Analysis, Opportunity and Forecast, By End-use , 2016-2032
- 5.8.1. Western Europe E-Fuels Market Analysis by End-use : Introduction
- 5.8.2. Market Size Absolute $ Opportunity Analysis and Forecast, By End-use , 2016-2032
- 5.8.3. Transportation
- 5.8.4. Chemicals
- 5.8.5. Power generation
- 5.8.6. Others
- 5.9. Western Europe E-Fuels Market Analysis, Opportunity and Forecast, By Country , 2016-2032
- 5.9.1. Western Europe E-Fuels Market Analysis by Country : Introduction
- 5.9.2. Market Size Absolute $ Opportunity Analysis and Forecast, Country , 2016-2032
- 5.9.2.1. Germany
- 5.9.2.2. France
- 5.9.2.3. The UK
- 5.9.2.4. Spain
- 5.9.2.5. Italy
- 5.9.2.6. Portugal
- 5.9.2.7. Ireland
- 5.9.2.8. Austria
- 5.9.2.9. Switzerland
- 5.9.2.10. Benelux
- 5.9.2.11. Nordic
- 5.9.2.12. Rest of Western Europe
- 6. Eastern Europe E-Fuels Market Analysis, Opportunity and Forecast, 2016-2032
- 6.1. Eastern Europe E-Fuels Market Analysis, 2016-2021
- 6.2. Eastern Europe E-Fuels Market Opportunity and Forecast, 2023-2032
- 6.3. Eastern Europe E-Fuels Market Analysis, Opportunity and Forecast, By Renewable Source , 2016-2032
- 6.3.1. Eastern Europe E-Fuels Market Analysis by Renewable Source : Introduction
- 6.3.2. Market Size Absolute $ Opportunity Analysis and Forecast, By Renewable Source , 2016-2032
- 6.3.3. Solar
- 6.3.4. Winds
- 6.3.5. Others
- 6.4. Eastern Europe E-Fuels Market Analysis, Opportunity and Forecast, By Fuel Type, 2016-2032
- 6.4.1. Eastern Europe E-Fuels Market Analysis by Fuel Type: Introduction
- 6.4.2. Market Size Absolute $ Opportunity Analysis and Forecast, By Fuel Type, 2016-2032
- 6.4.3. E-methane
- 6.4.4. E-kerosene
- 6.4.5. E-methanol
- 6.4.6. E-ammonia
- 6.4.7. E-diesel
- 6.4.8. E-gasoline
- 6.5. Eastern Europe E-Fuels Market Analysis, Opportunity and Forecast, By State, 2016-2032
- 6.5.1. Eastern Europe E-Fuels Market Analysis by State: Introduction
- 6.5.2. Market Size Absolute $ Opportunity Analysis and Forecast, By State, 2016-2032
- 6.5.3. Gas
- 6.5.4. Liquid
- 6.6. Eastern Europe E-Fuels Market Analysis, Opportunity and Forecast, By Production Method , 2016-2032
- 6.6.1. Eastern Europe E-Fuels Market Analysis by Production Method : Introduction
- 6.6.2. Market Size Absolute $ Opportunity Analysis and Forecast, By Production Method , 2016-2032
- 6.6.3. Power-To-Liquid
- 6.6.4. Power-To-Gas
- 6.6.5. Gas-To-Liquid
- 6.6.6. Biologically Derived Fuels
- 6.7. Eastern Europe E-Fuels Market Analysis, Opportunity and Forecast, By Technology , 2016-2032
- 6.7.1. Eastern Europe E-Fuels Market Analysis by Technology : Introduction
- 6.7.2. Market Size Absolute $ Opportunity Analysis and Forecast, By Technology , 2016-2032
- 6.7.3. Hydrogen Technology (Electrolysis)
- 6.7.4. Fischer-Tropsch
- 6.7.5. Reverse-Water-Gas-Shift (RWGS)
- 6.8. Eastern Europe E-Fuels Market Analysis, Opportunity and Forecast, By End-use , 2016-2032
- 6.8.1. Eastern Europe E-Fuels Market Analysis by End-use : Introduction
- 6.8.2. Market Size Absolute $ Opportunity Analysis and Forecast, By End-use , 2016-2032
- 6.8.3. Transportation
- 6.8.4. Chemicals
- 6.8.5. Power generation
- 6.8.6. Others
- 6.9. Eastern Europe E-Fuels Market Analysis, Opportunity and Forecast, By Country , 2016-2032
- 6.9.1. Eastern Europe E-Fuels Market Analysis by Country : Introduction
- 6.9.2. Market Size Absolute $ Opportunity Analysis and Forecast, Country , 2016-2032
- 6.9.2.1. Russia
- 6.9.2.2. Poland
- 6.9.2.3. The Czech Republic
- 6.9.2.4. Greece
- 6.9.2.5. Rest of Eastern Europe
- 7. APAC E-Fuels Market Analysis, Opportunity and Forecast, 2016-2032
- 7.1. APAC E-Fuels Market Analysis, 2016-2021
- 7.2. APAC E-Fuels Market Opportunity and Forecast, 2023-2032
- 7.3. APAC E-Fuels Market Analysis, Opportunity and Forecast, By Renewable Source , 2016-2032
- 7.3.1. APAC E-Fuels Market Analysis by Renewable Source : Introduction
- 7.3.2. Market Size Absolute $ Opportunity Analysis and Forecast, By Renewable Source , 2016-2032
- 7.3.3. Solar
- 7.3.4. Winds
- 7.3.5. Others
- 7.4. APAC E-Fuels Market Analysis, Opportunity and Forecast, By Fuel Type, 2016-2032
- 7.4.1. APAC E-Fuels Market Analysis by Fuel Type: Introduction
- 7.4.2. Market Size Absolute $ Opportunity Analysis and Forecast, By Fuel Type, 2016-2032
- 7.4.3. E-methane
- 7.4.4. E-kerosene
- 7.4.5. E-methanol
- 7.4.6. E-ammonia
- 7.4.7. E-diesel
- 7.4.8. E-gasoline
- 7.5. APAC E-Fuels Market Analysis, Opportunity and Forecast, By State, 2016-2032
- 7.5.1. APAC E-Fuels Market Analysis by State: Introduction
- 7.5.2. Market Size Absolute $ Opportunity Analysis and Forecast, By State, 2016-2032
- 7.5.3. Gas
- 7.5.4. Liquid
- 7.6. APAC E-Fuels Market Analysis, Opportunity and Forecast, By Production Method , 2016-2032
- 7.6.1. APAC E-Fuels Market Analysis by Production Method : Introduction
- 7.6.2. Market Size Absolute $ Opportunity Analysis and Forecast, By Production Method , 2016-2032
- 7.6.3. Power-To-Liquid
- 7.6.4. Power-To-Gas
- 7.6.5. Gas-To-Liquid
- 7.6.6. Biologically Derived Fuels
- 7.7. APAC E-Fuels Market Analysis, Opportunity and Forecast, By Technology , 2016-2032
- 7.7.1. APAC E-Fuels Market Analysis by Technology : Introduction
- 7.7.2. Market Size Absolute $ Opportunity Analysis and Forecast, By Technology , 2016-2032
- 7.7.3. Hydrogen Technology (Electrolysis)
- 7.7.4. Fischer-Tropsch
- 7.7.5. Reverse-Water-Gas-Shift (RWGS)
- 7.8. APAC E-Fuels Market Analysis, Opportunity and Forecast, By End-use , 2016-2032
- 7.8.1. APAC E-Fuels Market Analysis by End-use : Introduction
- 7.8.2. Market Size Absolute $ Opportunity Analysis and Forecast, By End-use , 2016-2032
- 7.8.3. Transportation
- 7.8.4. Chemicals
- 7.8.5. Power generation
- 7.8.6. Others
- 7.9. APAC E-Fuels Market Analysis, Opportunity and Forecast, By Country , 2016-2032
- 7.9.1. APAC E-Fuels Market Analysis by Country : Introduction
- 7.9.2. Market Size Absolute $ Opportunity Analysis and Forecast, Country , 2016-2032
- 7.9.2.1. China
- 7.9.2.2. Japan
- 7.9.2.3. South Korea
- 7.9.2.4. India
- 7.9.2.5. Australia & New Zeland
- 7.9.2.6. Indonesia
- 7.9.2.7. Malaysia
- 7.9.2.8. Philippines
- 7.9.2.9. Singapore
- 7.9.2.10. Thailand
- 7.9.2.11. Vietnam
- 7.9.2.12. Rest of APAC
- 8. Latin America E-Fuels Market Analysis, Opportunity and Forecast, 2016-2032
- 8.1. Latin America E-Fuels Market Analysis, 2016-2021
- 8.2. Latin America E-Fuels Market Opportunity and Forecast, 2023-2032
- 8.3. Latin America E-Fuels Market Analysis, Opportunity and Forecast, By Renewable Source , 2016-2032
- 8.3.1. Latin America E-Fuels Market Analysis by Renewable Source : Introduction
- 8.3.2. Market Size Absolute $ Opportunity Analysis and Forecast, By Renewable Source , 2016-2032
- 8.3.3. Solar
- 8.3.4. Winds
- 8.3.5. Others
- 8.4. Latin America E-Fuels Market Analysis, Opportunity and Forecast, By Fuel Type, 2016-2032
- 8.4.1. Latin America E-Fuels Market Analysis by Fuel Type: Introduction
- 8.4.2. Market Size Absolute $ Opportunity Analysis and Forecast, By Fuel Type, 2016-2032
- 8.4.3. E-methane
- 8.4.4. E-kerosene
- 8.4.5. E-methanol
- 8.4.6. E-ammonia
- 8.4.7. E-diesel
- 8.4.8. E-gasoline
- 8.5. Latin America E-Fuels Market Analysis, Opportunity and Forecast, By State, 2016-2032
- 8.5.1. Latin America E-Fuels Market Analysis by State: Introduction
- 8.5.2. Market Size Absolute $ Opportunity Analysis and Forecast, By State, 2016-2032
- 8.5.3. Gas
- 8.5.4. Liquid
- 8.6. Latin America E-Fuels Market Analysis, Opportunity and Forecast, By Production Method , 2016-2032
- 8.6.1. Latin America E-Fuels Market Analysis by Production Method : Introduction
- 8.6.2. Market Size Absolute $ Opportunity Analysis and Forecast, By Production Method , 2016-2032
- 8.6.3. Power-To-Liquid
- 8.6.4. Power-To-Gas
- 8.6.5. Gas-To-Liquid
- 8.6.6. Biologically Derived Fuels
- 8.7. Latin America E-Fuels Market Analysis, Opportunity and Forecast, By Technology , 2016-2032
- 8.7.1. Latin America E-Fuels Market Analysis by Technology : Introduction
- 8.7.2. Market Size Absolute $ Opportunity Analysis and Forecast, By Technology , 2016-2032
- 8.7.3. Hydrogen Technology (Electrolysis)
- 8.7.4. Fischer-Tropsch
- 8.7.5. Reverse-Water-Gas-Shift (RWGS)
- 8.8. Latin America E-Fuels Market Analysis, Opportunity and Forecast, By End-use , 2016-2032
- 8.8.1. Latin America E-Fuels Market Analysis by End-use : Introduction
- 8.8.2. Market Size Absolute $ Opportunity Analysis and Forecast, By End-use , 2016-2032
- 8.8.3. Transportation
- 8.8.4. Chemicals
- 8.8.5. Power generation
- 8.8.6. Others
- 8.9. Latin America E-Fuels Market Analysis, Opportunity and Forecast, By Country , 2016-2032
- 8.9.1. Latin America E-Fuels Market Analysis by Country : Introduction
- 8.9.2. Market Size Absolute $ Opportunity Analysis and Forecast, Country , 2016-2032
- 8.9.2.1. Brazil
- 8.9.2.2. Colombia
- 8.9.2.3. Chile
- 8.9.2.4. Argentina
- 8.9.2.5. Costa Rica
- 8.9.2.6. Rest of Latin America
- 9. Middle East & Africa E-Fuels Market Analysis, Opportunity and Forecast, 2016-2032
- 9.1. Middle East & Africa E-Fuels Market Analysis, 2016-2021
- 9.2. Middle East & Africa E-Fuels Market Opportunity and Forecast, 2023-2032
- 9.3. Middle East & Africa E-Fuels Market Analysis, Opportunity and Forecast, By Renewable Source , 2016-2032
- 9.3.1. Middle East & Africa E-Fuels Market Analysis by Renewable Source : Introduction
- 9.3.2. Market Size Absolute $ Opportunity Analysis and Forecast, By Renewable Source , 2016-2032
- 9.3.3. Solar
- 9.3.4. Winds
- 9.3.5. Others
- 9.4. Middle East & Africa E-Fuels Market Analysis, Opportunity and Forecast, By Fuel Type, 2016-2032
- 9.4.1. Middle East & Africa E-Fuels Market Analysis by Fuel Type: Introduction
- 9.4.2. Market Size Absolute $ Opportunity Analysis and Forecast, By Fuel Type, 2016-2032
- 9.4.3. E-methane
- 9.4.4. E-kerosene
- 9.4.5. E-methanol
- 9.4.6. E-ammonia
- 9.4.7. E-diesel
- 9.4.8. E-gasoline
- 9.5. Middle East & Africa E-Fuels Market Analysis, Opportunity and Forecast, By State, 2016-2032
- 9.5.1. Middle East & Africa E-Fuels Market Analysis by State: Introduction
- 9.5.2. Market Size Absolute $ Opportunity Analysis and Forecast, By State, 2016-2032
- 9.5.3. Gas
- 9.5.4. Liquid
- 9.6. Middle East & Africa E-Fuels Market Analysis, Opportunity and Forecast, By Production Method , 2016-2032
- 9.6.1. Middle East & Africa E-Fuels Market Analysis by Production Method : Introduction
- 9.6.2. Market Size Absolute $ Opportunity Analysis and Forecast, By Production Method , 2016-2032
- 9.6.3. Power-To-Liquid
- 9.6.4. Power-To-Gas
- 9.6.5. Gas-To-Liquid
- 9.6.6. Biologically Derived Fuels
- 9.7. Middle East & Africa E-Fuels Market Analysis, Opportunity and Forecast, By Technology , 2016-2032
- 9.7.1. Middle East & Africa E-Fuels Market Analysis by Technology : Introduction
- 9.7.2. Market Size Absolute $ Opportunity Analysis and Forecast, By Technology , 2016-2032
- 9.7.3. Hydrogen Technology (Electrolysis)
- 9.7.4. Fischer-Tropsch
- 9.7.5. Reverse-Water-Gas-Shift (RWGS)
- 9.8. Middle East & Africa E-Fuels Market Analysis, Opportunity and Forecast, By End-use , 2016-2032
- 9.8.1. Middle East & Africa E-Fuels Market Analysis by End-use : Introduction
- 9.8.2. Market Size Absolute $ Opportunity Analysis and Forecast, By End-use , 2016-2032
- 9.8.3. Transportation
- 9.8.4. Chemicals
- 9.8.5. Power generation
- 9.8.6. Others
- 9.9. Middle East & Africa E-Fuels Market Analysis, Opportunity and Forecast, By Country , 2016-2032
- 9.9.1. Middle East & Africa E-Fuels Market Analysis by Country : Introduction
- 9.9.2. Market Size Absolute $ Opportunity Analysis and Forecast, Country , 2016-2032
- 9.9.2.1. Algeria
- 9.9.2.2. Egypt
- 9.9.2.3. Israel
- 9.9.2.4. Kuwait
- 9.9.2.5. Nigeria
- 9.9.2.6. Saudi Arabia
- 9.9.2.7. South Africa
- 9.9.2.8. Turkey
- 9.9.2.9. The UAE
- 9.9.2.10. Rest of MEA
- 10. Global E-Fuels Market Analysis, Opportunity and Forecast, By Region , 2016-2032
- 10.1. Global E-Fuels Market Analysis by Region : Introduction
- 10.2. Market Size Absolute $ Opportunity Analysis and Forecast, By Region , 2016-2032
- 10.2.1. North America
- 10.2.2. Western Europe
- 10.2.3. Eastern Europe
- 10.2.4. APAC
- 10.2.5. Latin America
- 10.2.6. Middle East & Africa
- 11. Global E-Fuels Market Competitive Landscape, Market Share Analysis, and Company Profiles
- 11.1. Market Share Analysis
- 11.2. Company Profiles
- 11.3. Archer Daniels Midland Co.
- 11.3.1. Company Overview
- 11.3.2. Financial Highlights
- 11.3.3. Product Portfolio
- 11.3.4. SWOT Analysis
- 11.3.5. Key Strategies and Developments
- 11.4. Audi AG
- 11.4.1. Company Overview
- 11.4.2. Financial Highlights
- 11.4.3. Product Portfolio
- 11.4.4. SWOT Analysis
- 11.4.5. Key Strategies and Developments
- 11.5. Ballard Power Systems, Inc.
- 11.5.1. Company Overview
- 11.5.2. Financial Highlights
- 11.5.3. Product Portfolio
- 11.5.4. SWOT Analysis
- 11.5.5. Key Strategies and Developments
- 11.6. BMW AG
- 11.6.1. Company Overview
- 11.6.2. Financial Highlights
- 11.6.3. Product Portfolio
- 11.6.4. SWOT Analysis
- 11.6.5. Key Strategies and Developments
- 11.7. Cargill Inc.
- 11.7.1. Company Overview
- 11.7.2. Financial Highlights
- 11.7.3. Product Portfolio
- 11.7.4. SWOT Analysis
- 11.7.5. Key Strategies and Developments
- 11.8. Ceres Power Holding Plc
- 11.8.1. Company Overview
- 11.8.2. Financial Highlights
- 11.8.3. Product Portfolio
- 11.8.4. SWOT Analysis
- 11.8.5. Key Strategies and Developments
- 11.9. Clariant International Ltd.
- 11.9.1. Company Overview
- 11.9.2. Financial Highlights
- 11.9.3. Product Portfolio
- 11.9.4. SWOT Analysis
- 11.9.5. Key Strategies and Developments
- 11.10. Clean Fuels Alliance America
- 11.10.1. Company Overview
- 11.10.2. Financial Highlights
- 11.10.3. Product Portfolio
- 11.10.4. SWOT Analysis
- 11.10.5. Key Strategies and Developments
- 11.11. Climeworks AG
- 11.11.1. Company Overview
- 11.11.2. Financial Highlights
- 11.11.3. Product Portfolio
- 11.11.4. SWOT Analysis
- 11.11.5. Key Strategies and Developments
- 11.12. Covestro AG
- 11.12.1. Company Overview
- 11.12.2. Financial Highlights
- 11.12.3. Product Portfolio
- 11.12.4. SWOT Analysis
- 11.12.5. Key Strategies and Developments
- 11.13.1. Company Overview
- 11.13.2. Financial Highlights
- 11.13.3. Product Portfolio
- 11.13.4. SWOT Analysis
- 11.13.5. Key Strategies and Developments
- 11.14. E-Fuel Corporation
- 11.14.1. Company Overview
- 11.14.2. Financial Highlights
- 11.14.3. Product Portfolio
- 11.14.4. SWOT Analysis
- 11.14.5. Key Strategies and Developments
- 11.15. Enel SpA
- 11.15.1. Company Overview
- 11.15.2. Financial Highlights
- 11.15.3. Product Portfolio
- 11.15.4. SWOT Analysis
- 11.15.5. Key Strategies and Developments
- 11.16. Enerkem Inc.
- 11.16.1. Company Overview
- 11.16.2. Financial Highlights
- 11.16.3. Product Portfolio
- 11.16.4. SWOT Analysis
- 11.16.5. Key Strategies and Developments
- 11.17. Global Bioenergies SA
- 11.17.1. Company Overview
- 11.17.2. Financial Highlights
- 11.17.3. Product Portfolio
- 11.17.4. SWOT Analysis
- 11.17.5. Key Strategies and Developments
- 11.18. Groupe Renault
- 11.18.1. Company Overview
- 11.18.2. Financial Highlights
- 11.18.3. Product Portfolio
- 11.18.4. SWOT Analysis
- 11.18.5. Key Strategies and Developments
- 11.19. Hexagon Agility
- 11.19.1. Company Overview
- 11.19.2. Financial Highlights
- 11.19.3. Product Portfolio
- 11.19.4. SWOT Analysis
- 11.19.5. Key Strategies and Developments
- 11.20. INEOS Group AG
- 11.20.1. Company Overview
- 11.20.2. Financial Highlights
- 11.20.3. Product Portfolio
- 11.20.4. SWOT Analysis
- 11.20.5. Key Strategies and Developments
- 11.21. LanzaTech Inc.
- 11.21.1. Company Overview
- 11.21.2. Financial Highlights
- 11.21.3. Product Portfolio
- 11.21.4. SWOT Analysis
- 11.21.5. Key Strategies and Developments
- 11.22. Mitsubishi Chemical Corporation
- 11.22.1. Company Overview
- 11.22.2. Financial Highlights
- 11.22.3. Product Portfolio
- 11.22.4. SWOT Analysis
- 11.22.5. Key Strategies and Developments
- 12. Assumptions and Acronyms
- 13. Research Methodology
- 14. Contact
"
- List of Figures
- "
- Figure 1: Global E-Fuels Market Revenue (US$ Mn) Market Share by Renewable Source in 2022
- Figure 2: Global E-Fuels Market Attractiveness Analysis by Renewable Source , 2016-2032
- Figure 3: Global E-Fuels Market Revenue (US$ Mn) Market Share by Fuel Typein 2022
- Figure 4: Global E-Fuels Market Attractiveness Analysis by Fuel Type, 2016-2032
- Figure 5: Global E-Fuels Market Revenue (US$ Mn) Market Share by Statein 2022
- Figure 6: Global E-Fuels Market Attractiveness Analysis by State, 2016-2032
- Figure 7: Global E-Fuels Market Revenue (US$ Mn) Market Share by Production Method in 2022
- Figure 8: Global E-Fuels Market Attractiveness Analysis by Production Method , 2016-2032
- Figure 9: Global E-Fuels Market Revenue (US$ Mn) Market Share by Technology in 2022
- Figure 10: Global E-Fuels Market Attractiveness Analysis by Technology , 2016-2032
- Figure 11: Global E-Fuels Market Revenue (US$ Mn) Market Share by End-use in 2022
- Figure 12: Global E-Fuels Market Attractiveness Analysis by End-use , 2016-2032
- Figure 13: Global E-Fuels Market Revenue (US$ Mn) Market Share by Region in 2022
- Figure 14: Global E-Fuels Market Attractiveness Analysis by Region, 2016-2032
- Figure 15: Global E-Fuels Market Revenue (US$ Mn) (2016-2032)
- Figure 16: Global E-Fuels Market Revenue (US$ Mn) Comparison by Region (2016-2032)
- Figure 17: Global E-Fuels Market Revenue (US$ Mn) Comparison by Renewable Source (2016-2032)
- Figure 18: Global E-Fuels Market Revenue (US$ Mn) Comparison by Fuel Type (2016-2032)
- Figure 19: Global E-Fuels Market Revenue (US$ Mn) Comparison by State (2016-2032)
- Figure 20: Global E-Fuels Market Revenue (US$ Mn) Comparison by Production Method (2016-2032)
- Figure 21: Global E-Fuels Market Revenue (US$ Mn) Comparison by Technology (2016-2032)
- Figure 22: Global E-Fuels Market Revenue (US$ Mn) Comparison by End-use (2016-2032)
- Figure 23: Global E-Fuels Market Y-o-Y Growth Rate Comparison by Region (2016-2032)
- Figure 24: Global E-Fuels Market Y-o-Y Growth Rate Comparison by Renewable Source (2016-2032)
- Figure 25: Global E-Fuels Market Y-o-Y Growth Rate Comparison by Fuel Type (2016-2032)
- Figure 26: Global E-Fuels Market Y-o-Y Growth Rate Comparison by State (2016-2032)
- Figure 27: Global E-Fuels Market Y-o-Y Growth Rate Comparison by Production Method (2016-2032)
- Figure 28: Global E-Fuels Market Y-o-Y Growth Rate Comparison by Technology (2016-2032)
- Figure 29: Global E-Fuels Market Y-o-Y Growth Rate Comparison by End-use (2016-2032)
- Figure 30: Global E-Fuels Market Share Comparison by Region (2016-2032)
- Figure 31: Global E-Fuels Market Share Comparison by Renewable Source (2016-2032)
- Figure 32: Global E-Fuels Market Share Comparison by Fuel Type (2016-2032)
- Figure 33: Global E-Fuels Market Share Comparison by State (2016-2032)
- Figure 34: Global E-Fuels Market Share Comparison by Production Method (2016-2032)
- Figure 35: Global E-Fuels Market Share Comparison by Technology (2016-2032)
- Figure 36: Global E-Fuels Market Share Comparison by End-use (2016-2032)
- Figure 37: North America E-Fuels Market Revenue (US$ Mn) Market Share by Renewable Source in 2022
- Figure 38: North America E-Fuels Market Attractiveness Analysis by Renewable Source , 2016-2032
- Figure 39: North America E-Fuels Market Revenue (US$ Mn) Market Share by Fuel Typein 2022
- Figure 40: North America E-Fuels Market Attractiveness Analysis by Fuel Type, 2016-2032
- Figure 41: North America E-Fuels Market Revenue (US$ Mn) Market Share by Statein 2022
- Figure 42: North America E-Fuels Market Attractiveness Analysis by State, 2016-2032
- Figure 43: North America E-Fuels Market Revenue (US$ Mn) Market Share by Production Method in 2022
- Figure 44: North America E-Fuels Market Attractiveness Analysis by Production Method , 2016-2032
- Figure 45: North America E-Fuels Market Revenue (US$ Mn) Market Share by Technology in 2022
- Figure 46: North America E-Fuels Market Attractiveness Analysis by Technology , 2016-2032
- Figure 47: North America E-Fuels Market Revenue (US$ Mn) Market Share by End-use in 2022
- Figure 48: North America E-Fuels Market Attractiveness Analysis by End-use , 2016-2032
- Figure 49: North America E-Fuels Market Revenue (US$ Mn) Market Share by Country in 2022
- Figure 50: North America E-Fuels Market Attractiveness Analysis by Country, 2016-2032
- Figure 51: North America E-Fuels Market Revenue (US$ Mn) (2016-2032)
- Figure 52: North America E-Fuels Market Revenue (US$ Mn) Comparison by Country (2016-2032)
- Figure 53: North America E-Fuels Market Revenue (US$ Mn) Comparison by Renewable Source (2016-2032)
- Figure 54: North America E-Fuels Market Revenue (US$ Mn) Comparison by Fuel Type (2016-2032)
- Figure 55: North America E-Fuels Market Revenue (US$ Mn) Comparison by State (2016-2032)
- Figure 56: North America E-Fuels Market Revenue (US$ Mn) Comparison by Production Method (2016-2032)
- Figure 57: North America E-Fuels Market Revenue (US$ Mn) Comparison by Technology (2016-2032)
- Figure 58: North America E-Fuels Market Revenue (US$ Mn) Comparison by End-use (2016-2032)
- Figure 59: North America E-Fuels Market Y-o-Y Growth Rate Comparison by Country (2016-2032)
- Figure 60: North America E-Fuels Market Y-o-Y Growth Rate Comparison by Renewable Source (2016-2032)
- Figure 61: North America E-Fuels Market Y-o-Y Growth Rate Comparison by Fuel Type (2016-2032)
- Figure 62: North America E-Fuels Market Y-o-Y Growth Rate Comparison by State (2016-2032)
- Figure 63: North America E-Fuels Market Y-o-Y Growth Rate Comparison by Production Method (2016-2032)
- Figure 64: North America E-Fuels Market Y-o-Y Growth Rate Comparison by Technology (2016-2032)
- Figure 65: North America E-Fuels Market Y-o-Y Growth Rate Comparison by End-use (2016-2032)
- Figure 66: North America E-Fuels Market Share Comparison by Country (2016-2032)
- Figure 67: North America E-Fuels Market Share Comparison by Renewable Source (2016-2032)
- Figure 68: North America E-Fuels Market Share Comparison by Fuel Type (2016-2032)
- Figure 69: North America E-Fuels Market Share Comparison by State (2016-2032)
- Figure 70: North America E-Fuels Market Share Comparison by Production Method (2016-2032)
- Figure 71: North America E-Fuels Market Share Comparison by Technology (2016-2032)
- Figure 72: North America E-Fuels Market Share Comparison by End-use (2016-2032)
- Figure 73: Western Europe E-Fuels Market Revenue (US$ Mn) Market Share by Renewable Source in 2022
- Figure 74: Western Europe E-Fuels Market Attractiveness Analysis by Renewable Source , 2016-2032
- Figure 75: Western Europe E-Fuels Market Revenue (US$ Mn) Market Share by Fuel Typein 2022
- Figure 76: Western Europe E-Fuels Market Attractiveness Analysis by Fuel Type, 2016-2032
- Figure 77: Western Europe E-Fuels Market Revenue (US$ Mn) Market Share by Statein 2022
- Figure 78: Western Europe E-Fuels Market Attractiveness Analysis by State, 2016-2032
- Figure 79: Western Europe E-Fuels Market Revenue (US$ Mn) Market Share by Production Method in 2022
- Figure 80: Western Europe E-Fuels Market Attractiveness Analysis by Production Method , 2016-2032
- Figure 81: Western Europe E-Fuels Market Revenue (US$ Mn) Market Share by Technology in 2022
- Figure 82: Western Europe E-Fuels Market Attractiveness Analysis by Technology , 2016-2032
- Figure 83: Western Europe E-Fuels Market Revenue (US$ Mn) Market Share by End-use in 2022
- Figure 84: Western Europe E-Fuels Market Attractiveness Analysis by End-use , 2016-2032
- Figure 85: Western Europe E-Fuels Market Revenue (US$ Mn) Market Share by Country in 2022
- Figure 86: Western Europe E-Fuels Market Attractiveness Analysis by Country, 2016-2032
- Figure 87: Western Europe E-Fuels Market Revenue (US$ Mn) (2016-2032)
- Figure 88: Western Europe E-Fuels Market Revenue (US$ Mn) Comparison by Country (2016-2032)
- Figure 89: Western Europe E-Fuels Market Revenue (US$ Mn) Comparison by Renewable Source (2016-2032)
- Figure 90: Western Europe E-Fuels Market Revenue (US$ Mn) Comparison by Fuel Type (2016-2032)
- Figure 91: Western Europe E-Fuels Market Revenue (US$ Mn) Comparison by State (2016-2032)
- Figure 92: Western Europe E-Fuels Market Revenue (US$ Mn) Comparison by Production Method (2016-2032)
- Figure 93: Western Europe E-Fuels Market Revenue (US$ Mn) Comparison by Technology (2016-2032)
- Figure 94: Western Europe E-Fuels Market Revenue (US$ Mn) Comparison by End-use (2016-2032)
- Figure 95: Western Europe E-Fuels Market Y-o-Y Growth Rate Comparison by Country (2016-2032)
- Figure 96: Western Europe E-Fuels Market Y-o-Y Growth Rate Comparison by Renewable Source (2016-2032)
- Figure 97: Western Europe E-Fuels Market Y-o-Y Growth Rate Comparison by Fuel Type (2016-2032)
- Figure 98: Western Europe E-Fuels Market Y-o-Y Growth Rate Comparison by State (2016-2032)
- Figure 99: Western Europe E-Fuels Market Y-o-Y Growth Rate Comparison by Production Method (2016-2032)
- Figure 100: Western Europe E-Fuels Market Y-o-Y Growth Rate Comparison by Technology (2016-2032)
- Figure 101: Western Europe E-Fuels Market Y-o-Y Growth Rate Comparison by End-use (2016-2032)
- Figure 102: Western Europe E-Fuels Market Share Comparison by Country (2016-2032)
- Figure 103: Western Europe E-Fuels Market Share Comparison by Renewable Source (2016-2032)
- Figure 104: Western Europe E-Fuels Market Share Comparison by Fuel Type (2016-2032)
- Figure 105: Western Europe E-Fuels Market Share Comparison by State (2016-2032)
- Figure 106: Western Europe E-Fuels Market Share Comparison by Production Method (2016-2032)
- Figure 107: Western Europe E-Fuels Market Share Comparison by Technology (2016-2032)
- Figure 108: Western Europe E-Fuels Market Share Comparison by End-use (2016-2032)
- Figure 109: Eastern Europe E-Fuels Market Revenue (US$ Mn) Market Share by Renewable Source in 2022
- Figure 110: Eastern Europe E-Fuels Market Attractiveness Analysis by Renewable Source , 2016-2032
- Figure 111: Eastern Europe E-Fuels Market Revenue (US$ Mn) Market Share by Fuel Typein 2022
- Figure 112: Eastern Europe E-Fuels Market Attractiveness Analysis by Fuel Type, 2016-2032
- Figure 113: Eastern Europe E-Fuels Market Revenue (US$ Mn) Market Share by Statein 2022
- Figure 114: Eastern Europe E-Fuels Market Attractiveness Analysis by State, 2016-2032
- Figure 115: Eastern Europe E-Fuels Market Revenue (US$ Mn) Market Share by Production Method in 2022
- Figure 116: Eastern Europe E-Fuels Market Attractiveness Analysis by Production Method , 2016-2032
- Figure 117: Eastern Europe E-Fuels Market Revenue (US$ Mn) Market Share by Technology in 2022
- Figure 118: Eastern Europe E-Fuels Market Attractiveness Analysis by Technology , 2016-2032
- Figure 119: Eastern Europe E-Fuels Market Revenue (US$ Mn) Market Share by End-use in 2022
- Figure 120: Eastern Europe E-Fuels Market Attractiveness Analysis by End-use , 2016-2032
- Figure 121: Eastern Europe E-Fuels Market Revenue (US$ Mn) Market Share by Country in 2022
- Figure 122: Eastern Europe E-Fuels Market Attractiveness Analysis by Country, 2016-2032
- Figure 123: Eastern Europe E-Fuels Market Revenue (US$ Mn) (2016-2032)
- Figure 124: Eastern Europe E-Fuels Market Revenue (US$ Mn) Comparison by Country (2016-2032)
- Figure 125: Eastern Europe E-Fuels Market Revenue (US$ Mn) Comparison by Renewable Source (2016-2032)
- Figure 126: Eastern Europe E-Fuels Market Revenue (US$ Mn) Comparison by Fuel Type (2016-2032)
- Figure 127: Eastern Europe E-Fuels Market Revenue (US$ Mn) Comparison by State (2016-2032)
- Figure 128: Eastern Europe E-Fuels Market Revenue (US$ Mn) Comparison by Production Method (2016-2032)
- Figure 129: Eastern Europe E-Fuels Market Revenue (US$ Mn) Comparison by Technology (2016-2032)
- Figure 130: Eastern Europe E-Fuels Market Revenue (US$ Mn) Comparison by End-use (2016-2032)
- Figure 131: Eastern Europe E-Fuels Market Y-o-Y Growth Rate Comparison by Country (2016-2032)
- Figure 132: Eastern Europe E-Fuels Market Y-o-Y Growth Rate Comparison by Renewable Source (2016-2032)
- Figure 133: Eastern Europe E-Fuels Market Y-o-Y Growth Rate Comparison by Fuel Type (2016-2032)
- Figure 134: Eastern Europe E-Fuels Market Y-o-Y Growth Rate Comparison by State (2016-2032)
- Figure 135: Eastern Europe E-Fuels Market Y-o-Y Growth Rate Comparison by Production Method (2016-2032)
- Figure 136: Eastern Europe E-Fuels Market Y-o-Y Growth Rate Comparison by Technology (2016-2032)
- Figure 137: Eastern Europe E-Fuels Market Y-o-Y Growth Rate Comparison by End-use (2016-2032)
- Figure 138: Eastern Europe E-Fuels Market Share Comparison by Country (2016-2032)
- Figure 139: Eastern Europe E-Fuels Market Share Comparison by Renewable Source (2016-2032)
- Figure 140: Eastern Europe E-Fuels Market Share Comparison by Fuel Type (2016-2032)
- Figure 141: Eastern Europe E-Fuels Market Share Comparison by State (2016-2032)
- Figure 142: Eastern Europe E-Fuels Market Share Comparison by Production Method (2016-2032)
- Figure 143: Eastern Europe E-Fuels Market Share Comparison by Technology (2016-2032)
- Figure 144: Eastern Europe E-Fuels Market Share Comparison by End-use (2016-2032)
- Figure 145: APAC E-Fuels Market Revenue (US$ Mn) Market Share by Renewable Source in 2022
- Figure 146: APAC E-Fuels Market Attractiveness Analysis by Renewable Source , 2016-2032
- Figure 147: APAC E-Fuels Market Revenue (US$ Mn) Market Share by Fuel Typein 2022
- Figure 148: APAC E-Fuels Market Attractiveness Analysis by Fuel Type, 2016-2032
- Figure 149: APAC E-Fuels Market Revenue (US$ Mn) Market Share by Statein 2022
- Figure 150: APAC E-Fuels Market Attractiveness Analysis by State, 2016-2032
- Figure 151: APAC E-Fuels Market Revenue (US$ Mn) Market Share by Production Method in 2022
- Figure 152: APAC E-Fuels Market Attractiveness Analysis by Production Method , 2016-2032
- Figure 153: APAC E-Fuels Market Revenue (US$ Mn) Market Share by Technology in 2022
- Figure 154: APAC E-Fuels Market Attractiveness Analysis by Technology , 2016-2032
- Figure 155: APAC E-Fuels Market Revenue (US$ Mn) Market Share by End-use in 2022
- Figure 156: APAC E-Fuels Market Attractiveness Analysis by End-use , 2016-2032
- Figure 157: APAC E-Fuels Market Revenue (US$ Mn) Market Share by Country in 2022
- Figure 158: APAC E-Fuels Market Attractiveness Analysis by Country, 2016-2032
- Figure 159: APAC E-Fuels Market Revenue (US$ Mn) (2016-2032)
- Figure 160: APAC E-Fuels Market Revenue (US$ Mn) Comparison by Country (2016-2032)
- Figure 161: APAC E-Fuels Market Revenue (US$ Mn) Comparison by Renewable Source (2016-2032)
- Figure 162: APAC E-Fuels Market Revenue (US$ Mn) Comparison by Fuel Type (2016-2032)
- Figure 163: APAC E-Fuels Market Revenue (US$ Mn) Comparison by State (2016-2032)
- Figure 164: APAC E-Fuels Market Revenue (US$ Mn) Comparison by Production Method (2016-2032)
- Figure 165: APAC E-Fuels Market Revenue (US$ Mn) Comparison by Technology (2016-2032)
- Figure 166: APAC E-Fuels Market Revenue (US$ Mn) Comparison by End-use (2016-2032)
- Figure 167: APAC E-Fuels Market Y-o-Y Growth Rate Comparison by Country (2016-2032)
- Figure 168: APAC E-Fuels Market Y-o-Y Growth Rate Comparison by Renewable Source (2016-2032)
- Figure 169: APAC E-Fuels Market Y-o-Y Growth Rate Comparison by Fuel Type (2016-2032)
- Figure 170: APAC E-Fuels Market Y-o-Y Growth Rate Comparison by State (2016-2032)
- Figure 171: APAC E-Fuels Market Y-o-Y Growth Rate Comparison by Production Method (2016-2032)
- Figure 172: APAC E-Fuels Market Y-o-Y Growth Rate Comparison by Technology (2016-2032)
- Figure 173: APAC E-Fuels Market Y-o-Y Growth Rate Comparison by End-use (2016-2032)
- Figure 174: APAC E-Fuels Market Share Comparison by Country (2016-2032)
- Figure 175: APAC E-Fuels Market Share Comparison by Renewable Source (2016-2032)
- Figure 176: APAC E-Fuels Market Share Comparison by Fuel Type (2016-2032)
- Figure 177: APAC E-Fuels Market Share Comparison by State (2016-2032)
- Figure 178: APAC E-Fuels Market Share Comparison by Production Method (2016-2032)
- Figure 179: APAC E-Fuels Market Share Comparison by Technology (2016-2032)
- Figure 180: APAC E-Fuels Market Share Comparison by End-use (2016-2032)
- Figure 181: Latin America E-Fuels Market Revenue (US$ Mn) Market Share by Renewable Source in 2022
- Figure 182: Latin America E-Fuels Market Attractiveness Analysis by Renewable Source , 2016-2032
- Figure 183: Latin America E-Fuels Market Revenue (US$ Mn) Market Share by Fuel Typein 2022
- Figure 184: Latin America E-Fuels Market Attractiveness Analysis by Fuel Type, 2016-2032
- Figure 185: Latin America E-Fuels Market Revenue (US$ Mn) Market Share by Statein 2022
- Figure 186: Latin America E-Fuels Market Attractiveness Analysis by State, 2016-2032
- Figure 187: Latin America E-Fuels Market Revenue (US$ Mn) Market Share by Production Method in 2022
- Figure 188: Latin America E-Fuels Market Attractiveness Analysis by Production Method , 2016-2032
- Figure 189: Latin America E-Fuels Market Revenue (US$ Mn) Market Share by Technology in 2022
- Figure 190: Latin America E-Fuels Market Attractiveness Analysis by Technology , 2016-2032
- Figure 191: Latin America E-Fuels Market Revenue (US$ Mn) Market Share by End-use in 2022
- Figure 192: Latin America E-Fuels Market Attractiveness Analysis by End-use , 2016-2032
- Figure 193: Latin America E-Fuels Market Revenue (US$ Mn) Market Share by Country in 2022
- Figure 194: Latin America E-Fuels Market Attractiveness Analysis by Country, 2016-2032
- Figure 195: Latin America E-Fuels Market Revenue (US$ Mn) (2016-2032)
- Figure 196: Latin America E-Fuels Market Revenue (US$ Mn) Comparison by Country (2016-2032)
- Figure 197: Latin America E-Fuels Market Revenue (US$ Mn) Comparison by Renewable Source (2016-2032)
- Figure 198: Latin America E-Fuels Market Revenue (US$ Mn) Comparison by Fuel Type (2016-2032)
- Figure 199: Latin America E-Fuels Market Revenue (US$ Mn) Comparison by State (2016-2032)
- Figure 200: Latin America E-Fuels Market Revenue (US$ Mn) Comparison by Production Method (2016-2032)
- Figure 201: Latin America E-Fuels Market Revenue (US$ Mn) Comparison by Technology (2016-2032)
- Figure 202: Latin America E-Fuels Market Revenue (US$ Mn) Comparison by End-use (2016-2032)
- Figure 203: Latin America E-Fuels Market Y-o-Y Growth Rate Comparison by Country (2016-2032)
- Figure 204: Latin America E-Fuels Market Y-o-Y Growth Rate Comparison by Renewable Source (2016-2032)
- Figure 205: Latin America E-Fuels Market Y-o-Y Growth Rate Comparison by Fuel Type (2016-2032)
- Figure 206: Latin America E-Fuels Market Y-o-Y Growth Rate Comparison by State (2016-2032)
- Figure 207: Latin America E-Fuels Market Y-o-Y Growth Rate Comparison by Production Method (2016-2032)
- Figure 208: Latin America E-Fuels Market Y-o-Y Growth Rate Comparison by Technology (2016-2032)
- Figure 209: Latin America E-Fuels Market Y-o-Y Growth Rate Comparison by End-use (2016-2032)
- Figure 210: Latin America E-Fuels Market Share Comparison by Country (2016-2032)
- Figure 211: Latin America E-Fuels Market Share Comparison by Renewable Source (2016-2032)
- Figure 212: Latin America E-Fuels Market Share Comparison by Fuel Type (2016-2032)
- Figure 213: Latin America E-Fuels Market Share Comparison by State (2016-2032)
- Figure 214: Latin America E-Fuels Market Share Comparison by Production Method (2016-2032)
- Figure 215: Latin America E-Fuels Market Share Comparison by Technology (2016-2032)
- Figure 216: Latin America E-Fuels Market Share Comparison by End-use (2016-2032)
- Figure 217: Middle East & Africa E-Fuels Market Revenue (US$ Mn) Market Share by Renewable Source in 2022
- Figure 218: Middle East & Africa E-Fuels Market Attractiveness Analysis by Renewable Source , 2016-2032
- Figure 219: Middle East & Africa E-Fuels Market Revenue (US$ Mn) Market Share by Fuel Typein 2022
- Figure 220: Middle East & Africa E-Fuels Market Attractiveness Analysis by Fuel Type, 2016-2032
- Figure 221: Middle East & Africa E-Fuels Market Revenue (US$ Mn) Market Share by Statein 2022
- Figure 222: Middle East & Africa E-Fuels Market Attractiveness Analysis by State, 2016-2032
- Figure 223: Middle East & Africa E-Fuels Market Revenue (US$ Mn) Market Share by Production Method in 2022
- Figure 224: Middle East & Africa E-Fuels Market Attractiveness Analysis by Production Method , 2016-2032
- Figure 225: Middle East & Africa E-Fuels Market Revenue (US$ Mn) Market Share by Technology in 2022
- Figure 226: Middle East & Africa E-Fuels Market Attractiveness Analysis by Technology , 2016-2032
- Figure 227: Middle East & Africa E-Fuels Market Revenue (US$ Mn) Market Share by End-use in 2022
- Figure 228: Middle East & Africa E-Fuels Market Attractiveness Analysis by End-use , 2016-2032
- Figure 229: Middle East & Africa E-Fuels Market Revenue (US$ Mn) Market Share by Country in 2022
- Figure 230: Middle East & Africa E-Fuels Market Attractiveness Analysis by Country, 2016-2032
- Figure 231: Middle East & Africa E-Fuels Market Revenue (US$ Mn) (2016-2032)
- Figure 232: Middle East & Africa E-Fuels Market Revenue (US$ Mn) Comparison by Country (2016-2032)
- Figure 233: Middle East & Africa E-Fuels Market Revenue (US$ Mn) Comparison by Renewable Source (2016-2032)
- Figure 234: Middle East & Africa E-Fuels Market Revenue (US$ Mn) Comparison by Fuel Type (2016-2032)
- Figure 235: Middle East & Africa E-Fuels Market Revenue (US$ Mn) Comparison by State (2016-2032)
- Figure 236: Middle East & Africa E-Fuels Market Revenue (US$ Mn) Comparison by Production Method (2016-2032)
- Figure 237: Middle East & Africa E-Fuels Market Revenue (US$ Mn) Comparison by Technology (2016-2032)
- Figure 238: Middle East & Africa E-Fuels Market Revenue (US$ Mn) Comparison by End-use (2016-2032)
- Figure 239: Middle East & Africa E-Fuels Market Y-o-Y Growth Rate Comparison by Country (2016-2032)
- Figure 240: Middle East & Africa E-Fuels Market Y-o-Y Growth Rate Comparison by Renewable Source (2016-2032)
- Figure 241: Middle East & Africa E-Fuels Market Y-o-Y Growth Rate Comparison by Fuel Type (2016-2032)
- Figure 242: Middle East & Africa E-Fuels Market Y-o-Y Growth Rate Comparison by State (2016-2032)
- Figure 243: Middle East & Africa E-Fuels Market Y-o-Y Growth Rate Comparison by Production Method (2016-2032)
- Figure 244: Middle East & Africa E-Fuels Market Y-o-Y Growth Rate Comparison by Technology (2016-2032)
- Figure 245: Middle East & Africa E-Fuels Market Y-o-Y Growth Rate Comparison by End-use (2016-2032)
- Figure 246: Middle East & Africa E-Fuels Market Share Comparison by Country (2016-2032)
- Figure 247: Middle East & Africa E-Fuels Market Share Comparison by Renewable Source (2016-2032)
- Figure 248: Middle East & Africa E-Fuels Market Share Comparison by Fuel Type (2016-2032)
- Figure 249: Middle East & Africa E-Fuels Market Share Comparison by State (2016-2032)
- Figure 250: Middle East & Africa E-Fuels Market Share Comparison by Production Method (2016-2032)
- Figure 251: Middle East & Africa E-Fuels Market Share Comparison by Technology (2016-2032)
- Figure 252: Middle East & Africa E-Fuels Market Share Comparison by End-use (2016-2032)
"
- List of Tables
- "
- Table 1: Global E-Fuels Market Comparison by Renewable Source (2016-2032)
- Table 2: Global E-Fuels Market Comparison by Fuel Type (2016-2032)
- Table 3: Global E-Fuels Market Comparison by State (2016-2032)
- Table 4: Global E-Fuels Market Comparison by Production Method (2016-2032)
- Table 5: Global E-Fuels Market Comparison by Technology (2016-2032)
- Table 6: Global E-Fuels Market Comparison by End-use (2016-2032)
- Table 7: Global E-Fuels Market Revenue (US$ Mn) Comparison by Region (2016-2032)
- Table 8: Global E-Fuels Market Revenue (US$ Mn) (2016-2032)
- Table 9: Global E-Fuels Market Revenue (US$ Mn) Comparison by Region (2016-2032)
- Table 10: Global E-Fuels Market Revenue (US$ Mn) Comparison by Renewable Source (2016-2032)
- Table 11: Global E-Fuels Market Revenue (US$ Mn) Comparison by Fuel Type (2016-2032)
- Table 12: Global E-Fuels Market Revenue (US$ Mn) Comparison by State (2016-2032)
- Table 13: Global E-Fuels Market Revenue (US$ Mn) Comparison by Production Method (2016-2032)
- Table 14: Global E-Fuels Market Revenue (US$ Mn) Comparison by Technology (2016-2032)
- Table 15: Global E-Fuels Market Revenue (US$ Mn) Comparison by End-use (2016-2032)
- Table 16: Global E-Fuels Market Y-o-Y Growth Rate Comparison by Region (2016-2032)
- Table 17: Global E-Fuels Market Y-o-Y Growth Rate Comparison by Renewable Source (2016-2032)
- Table 18: Global E-Fuels Market Y-o-Y Growth Rate Comparison by Fuel Type (2016-2032)
- Table 19: Global E-Fuels Market Y-o-Y Growth Rate Comparison by State (2016-2032)
- Table 20: Global E-Fuels Market Y-o-Y Growth Rate Comparison by Production Method (2016-2032)
- Table 21: Global E-Fuels Market Y-o-Y Growth Rate Comparison by Technology (2016-2032)
- Table 22: Global E-Fuels Market Y-o-Y Growth Rate Comparison by End-use (2016-2032)
- Table 23: Global E-Fuels Market Share Comparison by Region (2016-2032)
- Table 24: Global E-Fuels Market Share Comparison by Renewable Source (2016-2032)
- Table 25: Global E-Fuels Market Share Comparison by Fuel Type (2016-2032)
- Table 26: Global E-Fuels Market Share Comparison by State (2016-2032)
- Table 27: Global E-Fuels Market Share Comparison by Production Method (2016-2032)
- Table 28: Global E-Fuels Market Share Comparison by Technology (2016-2032)
- Table 29: Global E-Fuels Market Share Comparison by End-use (2016-2032)
- Table 30: North America E-Fuels Market Comparison by Fuel Type (2016-2032)
- Table 31: North America E-Fuels Market Comparison by State (2016-2032)
- Table 32: North America E-Fuels Market Comparison by Production Method (2016-2032)
- Table 33: North America E-Fuels Market Comparison by Technology (2016-2032)
- Table 34: North America E-Fuels Market Comparison by End-use (2016-2032)
- Table 35: North America E-Fuels Market Revenue (US$ Mn) Comparison by Country (2016-2032)
- Table 36: North America E-Fuels Market Revenue (US$ Mn) (2016-2032)
- Table 37: North America E-Fuels Market Revenue (US$ Mn) Comparison by Country (2016-2032)
- Table 38: North America E-Fuels Market Revenue (US$ Mn) Comparison by Renewable Source (2016-2032)
- Table 39: North America E-Fuels Market Revenue (US$ Mn) Comparison by Fuel Type (2016-2032)
- Table 40: North America E-Fuels Market Revenue (US$ Mn) Comparison by State (2016-2032)
- Table 41: North America E-Fuels Market Revenue (US$ Mn) Comparison by Production Method (2016-2032)
- Table 42: North America E-Fuels Market Revenue (US$ Mn) Comparison by Technology (2016-2032)
- Table 43: North America E-Fuels Market Revenue (US$ Mn) Comparison by End-use (2016-2032)
- Table 44: North America E-Fuels Market Y-o-Y Growth Rate Comparison by Country (2016-2032)
- Table 45: North America E-Fuels Market Y-o-Y Growth Rate Comparison by Renewable Source (2016-2032)
- Table 46: North America E-Fuels Market Y-o-Y Growth Rate Comparison by Fuel Type (2016-2032)
- Table 47: North America E-Fuels Market Y-o-Y Growth Rate Comparison by State (2016-2032)
- Table 48: North America E-Fuels Market Y-o-Y Growth Rate Comparison by Production Method (2016-2032)
- Table 49: North America E-Fuels Market Y-o-Y Growth Rate Comparison by Technology (2016-2032)
- Table 50: North America E-Fuels Market Y-o-Y Growth Rate Comparison by End-use (2016-2032)
- Table 51: North America E-Fuels Market Share Comparison by Country (2016-2032)
- Table 52: North America E-Fuels Market Share Comparison by Renewable Source (2016-2032)
- Table 53: North America E-Fuels Market Share Comparison by Fuel Type (2016-2032)
- Table 54: North America E-Fuels Market Share Comparison by State (2016-2032)
- Table 55: North America E-Fuels Market Share Comparison by Production Method (2016-2032)
- Table 56: North America E-Fuels Market Share Comparison by Technology (2016-2032)
- Table 57: North America E-Fuels Market Share Comparison by End-use (2016-2032)
- Table 58: Western Europe E-Fuels Market Comparison by Renewable Source (2016-2032)
- Table 59: Western Europe E-Fuels Market Comparison by Fuel Type (2016-2032)
- Table 60: Western Europe E-Fuels Market Comparison by State (2016-2032)
- Table 61: Western Europe E-Fuels Market Comparison by Production Method (2016-2032)
- Table 62: Western Europe E-Fuels Market Comparison by Technology (2016-2032)
- Table 63: Western Europe E-Fuels Market Comparison by End-use (2016-2032)
- Table 64: Western Europe E-Fuels Market Revenue (US$ Mn) Comparison by Country (2016-2032)
- Table 65: Western Europe E-Fuels Market Revenue (US$ Mn) (2016-2032)
- Table 66: Western Europe E-Fuels Market Revenue (US$ Mn) Comparison by Country (2016-2032)
- Table 67: Western Europe E-Fuels Market Revenue (US$ Mn) Comparison by Renewable Source (2016-2032)
- Table 68: Western Europe E-Fuels Market Revenue (US$ Mn) Comparison by Fuel Type (2016-2032)
- Table 69: Western Europe E-Fuels Market Revenue (US$ Mn) Comparison by State (2016-2032)
- Table 70: Western Europe E-Fuels Market Revenue (US$ Mn) Comparison by Production Method (2016-2032)
- Table 71: Western Europe E-Fuels Market Revenue (US$ Mn) Comparison by Technology (2016-2032)
- Table 72: Western Europe E-Fuels Market Revenue (US$ Mn) Comparison by End-use (2016-2032)
- Table 73: Western Europe E-Fuels Market Y-o-Y Growth Rate Comparison by Country (2016-2032)
- Table 74: Western Europe E-Fuels Market Y-o-Y Growth Rate Comparison by Renewable Source (2016-2032)
- Table 75: Western Europe E-Fuels Market Y-o-Y Growth Rate Comparison by Fuel Type (2016-2032)
- Table 76: Western Europe E-Fuels Market Y-o-Y Growth Rate Comparison by State (2016-2032)
- Table 77: Western Europe E-Fuels Market Y-o-Y Growth Rate Comparison by Production Method (2016-2032)
- Table 78: Western Europe E-Fuels Market Y-o-Y Growth Rate Comparison by Technology (2016-2032)
- Table 79: Western Europe E-Fuels Market Y-o-Y Growth Rate Comparison by End-use (2016-2032)
- Table 80: Western Europe E-Fuels Market Share Comparison by Country (2016-2032)
- Table 81: Western Europe E-Fuels Market Share Comparison by Renewable Source (2016-2032)
- Table 82: Western Europe E-Fuels Market Share Comparison by Fuel Type (2016-2032)
- Table 83: Western Europe E-Fuels Market Share Comparison by State (2016-2032)
- Table 84: Western Europe E-Fuels Market Share Comparison by Production Method (2016-2032)
- Table 85: Western Europe E-Fuels Market Share Comparison by Technology (2016-2032)
- Table 86: Western Europe E-Fuels Market Share Comparison by End-use (2016-2032)
- Table 87: Eastern Europe E-Fuels Market Comparison by Renewable Source (2016-2032)
- Table 88: Eastern Europe E-Fuels Market Comparison by Fuel Type (2016-2032)
- Table 89: Eastern Europe E-Fuels Market Comparison by State (2016-2032)
- Table 90: Eastern Europe E-Fuels Market Comparison by Production Method (2016-2032)
- Table 91: Eastern Europe E-Fuels Market Comparison by Technology (2016-2032)
- Table 92: Eastern Europe E-Fuels Market Comparison by End-use (2016-2032)
- Table 93: Eastern Europe E-Fuels Market Revenue (US$ Mn) Comparison by Country (2016-2032)
- Table 94: Eastern Europe E-Fuels Market Revenue (US$ Mn) (2016-2032)
- Table 95: Eastern Europe E-Fuels Market Revenue (US$ Mn) Comparison by Country (2016-2032)
- Table 96: Eastern Europe E-Fuels Market Revenue (US$ Mn) Comparison by Renewable Source (2016-2032)
- Table 97: Eastern Europe E-Fuels Market Revenue (US$ Mn) Comparison by Fuel Type (2016-2032)
- Table 98: Eastern Europe E-Fuels Market Revenue (US$ Mn) Comparison by State (2016-2032)
- Table 99: Eastern Europe E-Fuels Market Revenue (US$ Mn) Comparison by Production Method (2016-2032)
- Table 100: Eastern Europe E-Fuels Market Revenue (US$ Mn) Comparison by Technology (2016-2032)
- Table 101: Eastern Europe E-Fuels Market Revenue (US$ Mn) Comparison by End-use (2016-2032)
- Table 102: Eastern Europe E-Fuels Market Y-o-Y Growth Rate Comparison by Country (2016-2032)
- Table 103: Eastern Europe E-Fuels Market Y-o-Y Growth Rate Comparison by Renewable Source (2016-2032)
- Table 104: Eastern Europe E-Fuels Market Y-o-Y Growth Rate Comparison by Fuel Type (2016-2032)
- Table 105: Eastern Europe E-Fuels Market Y-o-Y Growth Rate Comparison by State (2016-2032)
- Table 106: Eastern Europe E-Fuels Market Y-o-Y Growth Rate Comparison by Production Method (2016-2032)
- Table 107: Eastern Europe E-Fuels Market Y-o-Y Growth Rate Comparison by Technology (2016-2032)
- Table 108: Eastern Europe E-Fuels Market Y-o-Y Growth Rate Comparison by End-use (2016-2032)
- Table 109: Eastern Europe E-Fuels Market Share Comparison by Country (2016-2032)
- Table 110: Eastern Europe E-Fuels Market Share Comparison by Renewable Source (2016-2032)
- Table 111: Eastern Europe E-Fuels Market Share Comparison by Fuel Type (2016-2032)
- Table 112: Eastern Europe E-Fuels Market Share Comparison by State (2016-2032)
- Table 113: Eastern Europe E-Fuels Market Share Comparison by Production Method (2016-2032)
- Table 114: Eastern Europe E-Fuels Market Share Comparison by Technology (2016-2032)
- Table 115: Eastern Europe E-Fuels Market Share Comparison by End-use (2016-2032)
- Table 116: APAC E-Fuels Market Comparison by Renewable Source (2016-2032)
- Table 117: APAC E-Fuels Market Comparison by Fuel Type (2016-2032)
- Table 118: APAC E-Fuels Market Comparison by State (2016-2032)
- Table 119: APAC E-Fuels Market Comparison by Production Method (2016-2032)
- Table 120: APAC E-Fuels Market Comparison by Technology (2016-2032)
- Table 121: APAC E-Fuels Market Comparison by End-use (2016-2032)
- Table 122: APAC E-Fuels Market Revenue (US$ Mn) Comparison by Country (2016-2032)
- Table 123: APAC E-Fuels Market Revenue (US$ Mn) (2016-2032)
- Table 124: APAC E-Fuels Market Revenue (US$ Mn) Comparison by Country (2016-2032)
- Table 125: APAC E-Fuels Market Revenue (US$ Mn) Comparison by Renewable Source (2016-2032)
- Table 126: APAC E-Fuels Market Revenue (US$ Mn) Comparison by Fuel Type (2016-2032)
- Table 127: APAC E-Fuels Market Revenue (US$ Mn) Comparison by State (2016-2032)
- Table 128: APAC E-Fuels Market Revenue (US$ Mn) Comparison by Production Method (2016-2032)
- Table 129: APAC E-Fuels Market Revenue (US$ Mn) Comparison by Technology (2016-2032)
- Table 130: APAC E-Fuels Market Revenue (US$ Mn) Comparison by End-use (2016-2032)
- Table 131: APAC E-Fuels Market Y-o-Y Growth Rate Comparison by Country (2016-2032)
- Table 132: APAC E-Fuels Market Y-o-Y Growth Rate Comparison by Renewable Source (2016-2032)
- Table 133: APAC E-Fuels Market Y-o-Y Growth Rate Comparison by Fuel Type (2016-2032)
- Table 134: APAC E-Fuels Market Y-o-Y Growth Rate Comparison by State (2016-2032)
- Table 135: APAC E-Fuels Market Y-o-Y Growth Rate Comparison by Production Method (2016-2032)
- Table 136: APAC E-Fuels Market Y-o-Y Growth Rate Comparison by Technology (2016-2032)
- Table 137: APAC E-Fuels Market Y-o-Y Growth Rate Comparison by End-use (2016-2032)
- Table 138: APAC E-Fuels Market Share Comparison by Country (2016-2032)
- Table 139: APAC E-Fuels Market Share Comparison by Renewable Source (2016-2032)
- Table 140: APAC E-Fuels Market Share Comparison by Fuel Type (2016-2032)
- Table 141: APAC E-Fuels Market Share Comparison by State (2016-2032)
- Table 142: APAC E-Fuels Market Share Comparison by Production Method (2016-2032)
- Table 143: APAC E-Fuels Market Share Comparison by Technology (2016-2032)
- Table 144: APAC E-Fuels Market Share Comparison by End-use (2016-2032)
- Table 145: Latin America E-Fuels Market Comparison by Renewable Source (2016-2032)
- Table 146: Latin America E-Fuels Market Comparison by Fuel Type (2016-2032)
- Table 147: Latin America E-Fuels Market Comparison by State (2016-2032)
- Table 148: Latin America E-Fuels Market Comparison by Production Method (2016-2032)
- Table 149: Latin America E-Fuels Market Comparison by Technology (2016-2032)
- Table 150: Latin America E-Fuels Market Comparison by End-use (2016-2032)
- Table 151: Latin America E-Fuels Market Revenue (US$ Mn) Comparison by Country (2016-2032)
- Table 152: Latin America E-Fuels Market Revenue (US$ Mn) (2016-2032)
- Table 153: Latin America E-Fuels Market Revenue (US$ Mn) Comparison by Country (2016-2032)
- Table 154: Latin America E-Fuels Market Revenue (US$ Mn) Comparison by Renewable Source (2016-2032)
- Table 155: Latin America E-Fuels Market Revenue (US$ Mn) Comparison by Fuel Type (2016-2032)
- Table 156: Latin America E-Fuels Market Revenue (US$ Mn) Comparison by State (2016-2032)
- Table 157: Latin America E-Fuels Market Revenue (US$ Mn) Comparison by Production Method (2016-2032)
- Table 158: Latin America E-Fuels Market Revenue (US$ Mn) Comparison by Technology (2016-2032)
- Table 159: Latin America E-Fuels Market Revenue (US$ Mn) Comparison by End-use (2016-2032)
- Table 160: Latin America E-Fuels Market Y-o-Y Growth Rate Comparison by Country (2016-2032)
- Table 161: Latin America E-Fuels Market Y-o-Y Growth Rate Comparison by Renewable Source (2016-2032)
- Table 162: Latin America E-Fuels Market Y-o-Y Growth Rate Comparison by Fuel Type (2016-2032)
- Table 163: Latin America E-Fuels Market Y-o-Y Growth Rate Comparison by State (2016-2032)
- Table 164: Latin America E-Fuels Market Y-o-Y Growth Rate Comparison by Production Method (2016-2032)
- Table 165: Latin America E-Fuels Market Y-o-Y Growth Rate Comparison by Technology (2016-2032)
- Table 166: Latin America E-Fuels Market Y-o-Y Growth Rate Comparison by End-use (2016-2032)
- Table 167: Latin America E-Fuels Market Share Comparison by Country (2016-2032)
- Table 168: Latin America E-Fuels Market Share Comparison by Renewable Source (2016-2032)
- Table 169: Latin America E-Fuels Market Share Comparison by Fuel Type (2016-2032)
- Table 170: Latin America E-Fuels Market Share Comparison by State (2016-2032)
- Table 171: Latin America E-Fuels Market Share Comparison by Production Method (2016-2032)
- Table 172: Latin America E-Fuels Market Share Comparison by Technology (2016-2032)
- Table 173: Latin America E-Fuels Market Share Comparison by End-use (2016-2032)
- Table 174: Middle East & Africa E-Fuels Market Comparison by Renewable Source (2016-2032)
- Table 175: Middle East & Africa E-Fuels Market Comparison by Fuel Type (2016-2032)
- Table 176: Middle East & Africa E-Fuels Market Comparison by State (2016-2032)
- Table 177: Middle East & Africa E-Fuels Market Comparison by Production Method (2016-2032)
- Table 178: Middle East & Africa E-Fuels Market Comparison by Technology (2016-2032)
- Table 179: Middle East & Africa E-Fuels Market Comparison by End-use (2016-2032)
- Table 180: Middle East & Africa E-Fuels Market Revenue (US$ Mn) Comparison by Country (2016-2032)
- Table 181: Middle East & Africa E-Fuels Market Revenue (US$ Mn) (2016-2032)
- Table 182: Middle East & Africa E-Fuels Market Revenue (US$ Mn) Comparison by Country (2016-2032)
- Table 183: Middle East & Africa E-Fuels Market Revenue (US$ Mn) Comparison by Renewable Source (2016-2032)
- Table 184: Middle East & Africa E-Fuels Market Revenue (US$ Mn) Comparison by Fuel Type (2016-2032)
- Table 185: Middle East & Africa E-Fuels Market Revenue (US$ Mn) Comparison by State (2016-2032)
- Table 186: Middle East & Africa E-Fuels Market Revenue (US$ Mn) Comparison by Production Method (2016-2032)
- Table 187: Middle East & Africa E-Fuels Market Revenue (US$ Mn) Comparison by Technology (2016-2032)
- Table 188: Middle East & Africa E-Fuels Market Revenue (US$ Mn) Comparison by End-use (2016-2032)
- Table 189: Middle East & Africa E-Fuels Market Y-o-Y Growth Rate Comparison by Country (2016-2032)
- Table 190: Middle East & Africa E-Fuels Market Y-o-Y Growth Rate Comparison by Renewable Source (2016-2032)
- Table 191: Middle East & Africa E-Fuels Market Y-o-Y Growth Rate Comparison by Fuel Type (2016-2032)
- Table 192: Middle East & Africa E-Fuels Market Y-o-Y Growth Rate Comparison by State (2016-2032)
- Table 193: Middle East & Africa E-Fuels Market Y-o-Y Growth Rate Comparison by Production Method (2016-2032)
- Table 194: Middle East & Africa E-Fuels Market Y-o-Y Growth Rate Comparison by Technology (2016-2032)
- Table 195: Middle East & Africa E-Fuels Market Y-o-Y Growth Rate Comparison by End-use (2016-2032)
- Table 196: Middle East & Africa E-Fuels Market Share Comparison by Country (2016-2032)
- Table 197: Middle East & Africa E-Fuels Market Share Comparison by Renewable Source (2016-2032)
- Table 198: Middle East & Africa E-Fuels Market Share Comparison by Fuel Type (2016-2032)
- Table 199: Middle East & Africa E-Fuels Market Share Comparison by State (2016-2032)
- Table 200: Middle East & Africa E-Fuels Market Share Comparison by Production Method (2016-2032)
- Table 201: Middle East & Africa E-Fuels Market Share Comparison by Technology (2016-2032)
- Table 202: Middle East & Africa E-Fuels Market Share Comparison by End-use (2016-2032)
- 1. Executive Summary
-
- Archer Daniels Midland Co.
- Audi AG
- Ballard Power Systems, Inc.
- BMW AG
- Cargill Inc.
- Ceres Power Holding Plc
- Clariant International Ltd.
- Clean Fuels Alliance America
- Climeworks AG
- Covestro AG
- E-Fuel Corporation
- eFuel Pacific Limited
- Enel SpA
- Enerkem Inc.
- Global Bioenergies SA
- Groupe Renault
- Hexagon Agility
- INEOS Group AG
- LanzaTech Inc.
- Mitsubishi Chemical Corporation
- Neste Oyj
- Norsk e-Fuel AS
- Repsol SA
- Royal Dutch Shell plc
- Sasol Limited
- Siemens Energy AG
- Stora Enso Oyj
- Sunfire GmbH
- Toyota Motor Corporation
Our Clients


View Our Licence Options
