
Global Drug Metabolism And Pharmacokinetics (Dmpk) Market By Type(Small Molecules, Biologics), By Application(Biopharmaceutical Companies, Government and Academic Institutes, Others), By Region And Companies - Industry Segment Outlook, Market Assessment, Competition Scenario, Trends, And Forecast 2024-2033
-
45712
-
May 2024
-
300
-


-
This report was compiled by Trishita Deb Trishita Deb is an experienced market research and consulting professional with over 7 years of expertise across healthcare, consumer goods, and materials, contributing to over 400 healthcare-related reports. Correspondence Team Lead- Healthcare Linkedin | Detailed Market research Methodology Our methodology involves a mix of primary research, including interviews with leading mental health experts, and secondary research from reputable medical journals and databases. View Detailed Methodology Page
-
Quick Navigation
Report Overview
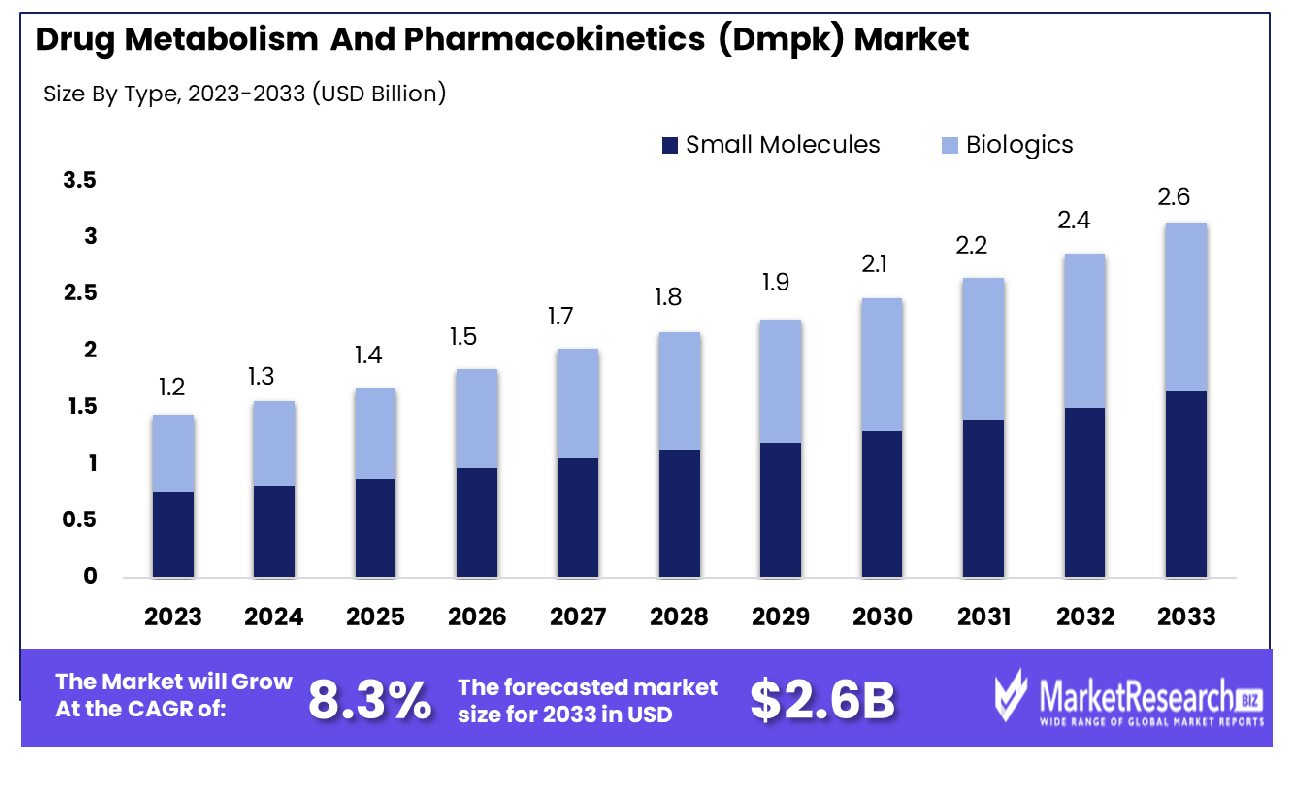
The Global Drug Metabolism And Pharmacokinetics (Dmpk) Market was valued at USD 1.2 billion in 2023. It is expected to reach USD 2.6 billion by 2033, with a CAGR of 8.3% during the forecast period from 2024 to 2033.
The Drug Metabolism and Pharmacokinetics (DMPK) Market encompasses the analysis and assessment of how drugs are absorbed, distributed, metabolized, and excreted by the body. This market is critical for understanding the safety, efficacy, and optimal dosage of pharmaceuticals. Key components include studies on enzymatic activity, drug-drug interactions, and the impact of genetic variations on drug response.
DMPK services are essential for pharmaceutical companies during drug development, providing crucial data that informs regulatory submissions and clinical trial designs. This market's growth is driven by advancements in biotechnologies, personalized medicine, and the increasing complexity of drug formulations.
The Drug Metabolism and Pharmacokinetics (DMPK) market is witnessing significant growth driven by the critical role DMPK plays in drug development and safety assessment. Drug metabolism involves complex enzymatic processes, predominantly in the liver, where enzymes such as cytochrome P450 are crucial in the biotransformation of pharmaceuticals. This enzymatic activity ensures the effective metabolism of various drugs and compounds, influencing their efficacy and safety profiles.
In 2022, the pharmaceutical industry in the United States saw a notable increase in overall expenditures, rising by 9.4% to reach $633.5 billion compared to the previous year. This growth is anticipated to continue, with a projected rise in prescription drug spending by 6.0% to 8.0% in 2023. This upward trend is bolstered by the introduction of new therapeutic products and an increase in drug utilization.
Specifically, clinics have experienced a 10.4% increase in drug expenditures, attributed to the adoption of innovative treatments and higher usage rates. Conversely, nonfederal hospitals observed a 5.9% decline in drug expenditures in 2022, despite contributions from new drugs and price adjustments, largely due to a decrease in drug utilization.
The sustained growth in pharmaceutical spending underscores the expanding demand for DMPK studies, which are essential in optimizing drug design, predicting drug-drug interactions, and ensuring patient safety. As the pharmaceutical landscape evolves with the continuous introduction of novel drugs, the DMPK market is poised for further expansion, emphasizing its indispensable role in the drug development pipeline.
Key Takeaways
- Market Growth: The Global Drug Metabolism And Pharmacokinetics (Dmpk) Market was valued at USD 1.2 billion in 2023. It is expected to reach USD 2.6 billion by 2033, with a CAGR of 8.3% during the forecast period from 2024 to 2033.
- By Type: Small molecules lead with a 60% market dominance rate.
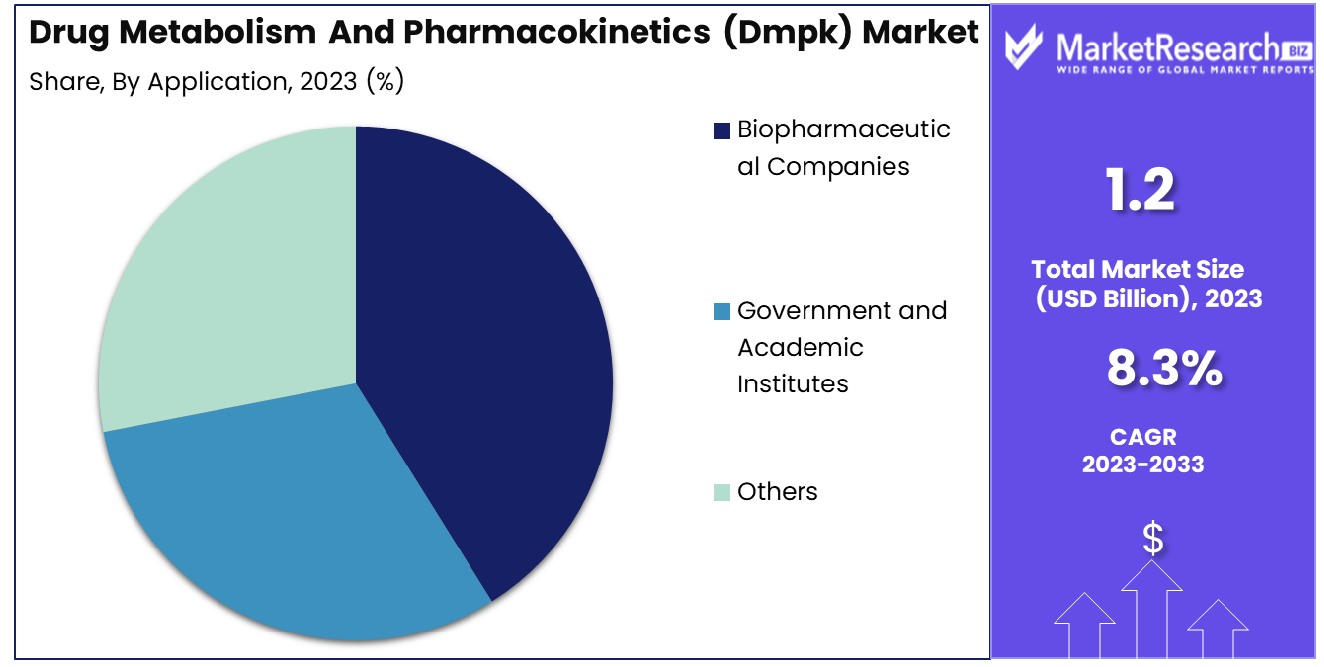
- By Application: Biopharmaceutical companies dominate, capturing 60% of the market share.
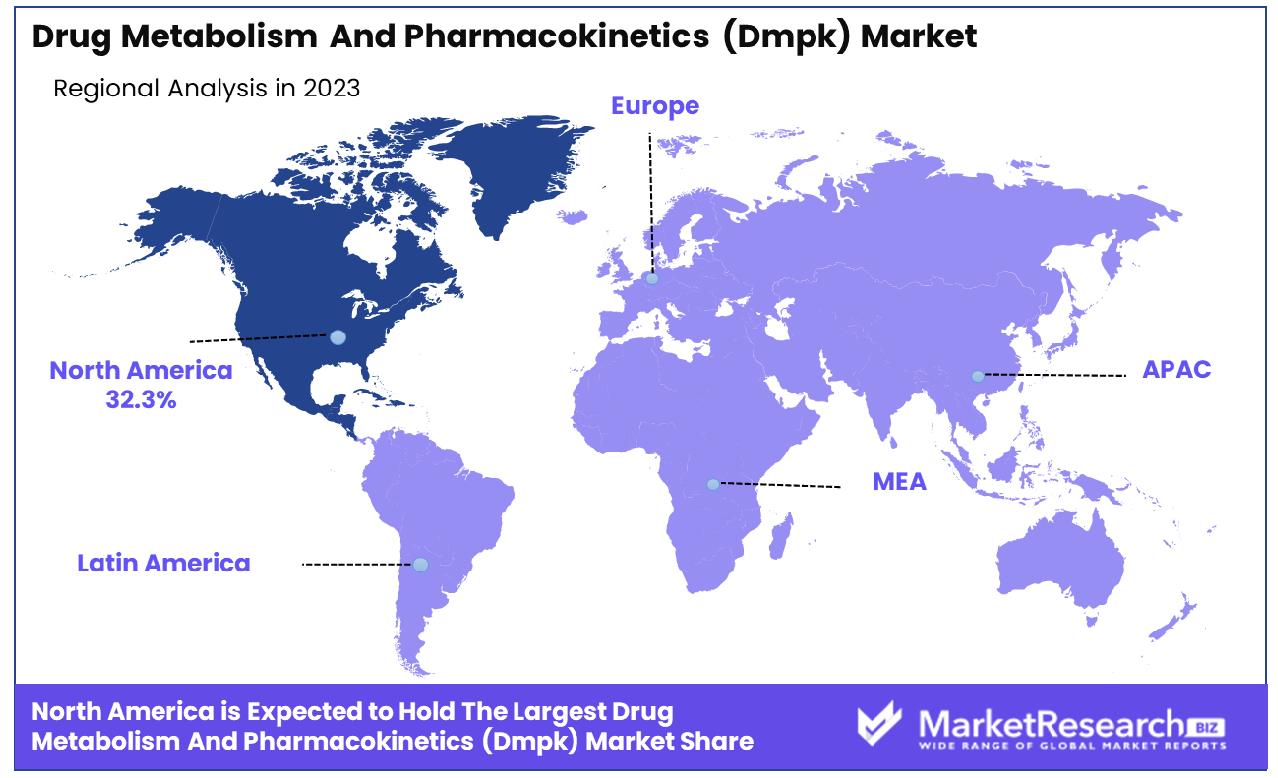
- Regional Dominance: In North America, the Drug Metabolism and Pharmacokinetics (DMPK) market holds a significant share of 32.3%.
- Growth Opportunity: The global Drug Metabolism and Pharmacokinetics (DMPK) market in 2023 emphasizes collaboration with academic institutions for innovation and expansion into emerging markets to tap into growing demand and mitigate risks.
Driving factors
Increasing Demand for Drug Development and Advancement
The escalating need for novel therapeutic agents is a pivotal driver in the growth of the Drug Metabolism and Pharmacokinetics (DMPK) market. This surge is fueled by the rising prevalence of chronic diseases, which necessitates continuous innovation in drug development.
According to recent industry reports, the global pharmaceutical market is projected to reach USD 1.5 trillion by 2023, underscoring the significant demand for new drugs. Consequently, DMPK studies have become indispensable, as they provide critical insights into the absorption, distribution, metabolism, and excretion (ADME) profiles of drugs.
These studies ensure that new pharmaceuticals are both effective and safe, thereby accelerating their progression from research phases to clinical trials and ultimately to market approval. The increasing complexity of drug molecules further underscores the need for advanced DMPK studies, which can address challenges related to drug interactions, bioavailability, and toxicity.
Growing Research into Drug-Metabolizing Enzymes and Transporters
Advancements in the understanding of drug-metabolizing enzymes and transporters significantly bolster the DMPK market. Enzymes such as cytochrome P450 (CYP450) play a crucial role in the metabolic pathways of various drugs. Recent research has focused on elucidating the genetic polymorphisms of these enzymes, which can impact drug efficacy and safety.
This research is vital for the development of personalized medicine, as it allows for the tailoring of drug treatments based on individual metabolic profiles. Moreover, studies on transporters, such as P-glycoprotein, provide insights into drug absorption and resistance mechanisms, which are essential for developing drugs with better therapeutic indices.
The integration of advanced analytical techniques, such as mass spectrometry and high-throughput screening, has further enhanced the precision of these studies, contributing to the overall growth of the DMPK market.
Collaboration Between Academia, Pharmaceutical Industry, and Regulatory Agencies
Strategic partnerships among academic institutions, the pharmaceutical industry, and regulatory bodies are instrumental in driving the growth of the DMPK market. These collaborations facilitate the sharing of knowledge, resources, and expertise, leading to more efficient drug development processes.
Academic institutions contribute cutting-edge research and innovation, while the pharmaceutical industry provides practical applications and commercial perspectives. Regulatory agencies, on the other hand, offer guidance on compliance with safety and efficacy standards, ensuring that new drugs meet stringent regulatory requirements.
This triad of collaboration accelerates the translation of scientific discoveries into therapeutic solutions, thereby enhancing the development pipeline for new drugs. Notably, joint initiatives such as public-private partnerships and consortia have been established to address specific challenges in drug metabolism and pharmacokinetics, further propelling market growth by fostering a collaborative environment conducive to innovation.
Restraining Factors
Availability of Alternative Technologies
The presence of alternative technologies poses a significant restraining factor for the Drug Metabolism and Pharmacokinetics (DMPK) market. Technologies such as in silico modeling, artificial intelligence (AI), and machine learning are increasingly being utilized to predict drug behavior, potentially reducing the reliance on traditional DMPK studies.
These technologies offer rapid and cost-effective solutions, enabling early-stage drug development to bypass some conventional DMPK processes. For instance, in silico models can simulate drug interactions and predict metabolic pathways, thus providing preliminary insights without the need for extensive in vitro or in vivo studies. According to recent industry reports, the adoption of AI in drug discovery is expected to grow at a compound annual growth rate (CAGR) of over 40% in the next few years.
This rapid adoption could divert investments away from traditional DMPK services, thereby restraining market growth. However, it is essential to note that while alternative technologies offer supplementary benefits, they may not entirely replace the comprehensive insights provided by DMPK studies, especially in the later stages of drug development.
Limited Adoption of DMPK Services in Emerging Markets
The limited adoption of DMPK services in emerging markets also constrains the market's expansion. Several factors contribute to this limited uptake, including a lack of infrastructure, insufficient funding, and a shortage of skilled professionals trained in DMPK methodologies. Emerging markets often face challenges related to regulatory frameworks and compliance, which can hinder the implementation of advanced DMPK studies.
Moreover, the cost of establishing state-of-the-art DMPK laboratories and the associated operational expenses can be prohibitive for companies in these regions. As a result, pharmaceutical and biotechnology companies in emerging markets may opt for more cost-effective, albeit less comprehensive, drug development strategies.
According to industry data, emerging markets account for less than 20% of the global pharmaceutical R&D expenditure, reflecting their limited engagement in advanced drug metabolism and pharmacokinetics research. This restrained investment in DMPK services hampers the market's potential growth in these regions, slowing the global expansion of comprehensive drug development capabilities.
By Type Analysis
Small molecules dominated 60% of the market due to their versatility and efficacy.
In 2023, Small Molecules held a dominant market position in the By Type segment of the Drug Metabolism and Pharmacokinetics (DMPK) Market, capturing more than a 60% share. The prominence of small molecules in the DMPK market can be attributed to several factors. Firstly, small molecules are traditionally the backbone of pharmaceutical treatments due to their relatively simpler structures, which facilitate easier manufacturing processes and scalability. Their smaller size allows for better tissue penetration, enhancing their efficacy in targeting specific biological pathways.
Additionally, the extensive historical data and well-established regulatory frameworks surrounding small molecules streamline the approval process, contributing to their continued preference in drug development pipelines. This dominant market position is further bolstered by the significant investments in R&D by major pharmaceutical companies aiming to innovate and optimize small molecule therapeutics for various medical conditions.
On the other hand, Biologics, while growing in popularity, accounted for a smaller share of the DMPK market. Biologics include a wide range of products such as monoclonal antibodies, therapeutic proteins, and vaccines, which are increasingly being explored for their potential to treat complex diseases like cancer and autoimmune disorders. Despite their growing significance, biologics face challenges related to their complex production processes, higher costs, and stability issues, which can impact their market penetration compared to small molecules.
The preference for small molecules in the DMPK market is expected to persist due to their cost-effectiveness, ease of production, and a robust pipeline of new drug candidates. However, advancements in biological technologies and increasing demand for targeted therapies are likely to drive the growth of the biologics segment, gradually increasing its market share in the coming years.
By Application Analysis
Biopharmaceutical companies dominated 60% of the market, reflecting their innovative research and development efforts.
In 2023, Biopharmaceutical Companies held a dominant market position in the By Application segment of the Drug Metabolism and Pharmacokinetics (DMPK) Market, capturing more than a 60% share. The significant share held by biopharmaceutical companies is driven by their substantial investments in research and development (R&D) and their focus on innovative drug discovery and development processes. These companies are at the forefront of advancing new therapeutics, leveraging DMPK studies to optimize the efficacy and safety profiles of their drug candidates.
The integration of advanced technologies such as high-throughput screening, computational modeling, and in vitro assays has enhanced the ability of biopharmaceutical companies to streamline the drug development process. This technological edge, combined with robust financial resources, enables them to conduct comprehensive DMPK studies that are crucial for the progression of novel therapies from the laboratory to clinical development trials and ultimately to market approval.
Government and Academic Institutes, while also contributing significantly to the DMPK market, held a smaller share compared to biopharmaceutical companies. These institutions focus on fundamental research, exploring new mechanisms of drug developer's action, and developing novel methodologies for DMPK studies. Their contributions are essential for the advancement of scientific knowledge and the development of innovative tools and techniques in the DMPK field.
The "Others" category, which includes contract research organizations (CROs) and biotechnology firms, also plays a vital role in the DMPK market. These entities provide specialized services and support to biopharmaceutical companies and academic institutes, facilitating various aspects of DMPK studies, including drug discovery, preclinical testing, and regulatory submissions.
Overall, the dominance of biopharmaceutical companies in the DMPK market is expected to continue, driven by their focus on innovation, extensive R&D activities, and strategic collaborations. However, the contributions of government and academic institutes, along with the support from CROs and biotechnology firms, will remain critical in advancing the field of DMPK and enhancing the development of new and effective therapeutics.
Key Market Segments
By Type
- Small Molecules
- Biologics
By Application
- Biopharmaceutical Companies
- Government and Academic Institutes
- Others
Growth Opportunity
Collaboration with Academic and Research Institutions
The 2023 growth trajectory for the global Drug Metabolism and Pharmacokinetics (DMPK) market underscores a significant trend toward collaboration with academic and research institutions. This strategic alliance fosters a synergistic environment where academic expertise in cutting-edge research complements the technological and operational capabilities of industry players.
Such collaborations are pivotal in accelerating the development of novel therapeutics by enhancing the understanding of drug absorption, distribution, metabolism, and excretion (ADME) profiles. The integration of advanced analytical techniques and innovative methodologies from academia enriches the DMPK landscape, facilitating more efficient drug development processes.
Furthermore, these partnerships often lead to shared intellectual property and co-authored publications, bolstering the market’s scientific foundation and credibility. Therefore, the engagement with academic and research institutions is anticipated to be a cornerstone for innovation and sustained growth in the DMPK sector.
Expansion into Emerging Markets
The expansion into emerging markets represents a compelling growth opportunity for the global DMPK market in 2023. These markets offer a conducive environment characterized by increasing healthcare expenditure, a growing patient population, and supportive government policies aimed at enhancing pharmaceutical research and development infrastructure.
By extending their footprint into regions such as Asia-Pacific and Latin America, DMPK service providers can tap into a burgeoning demand for drug development services. This geographical diversification not only mitigates the risks associated with market saturation in developed economies but also leverages the cost advantages and skilled workforce available in these emerging regions.
Additionally, the expansion into these markets aligns with the global trend of enhancing access to innovative therapeutics, thereby driving the overall growth of the DMPK market. Consequently, the strategic focus on emerging markets is poised to significantly augment the market’s expansion and revenue generation potential.
Latest Trends
Integration of In Silico Modeling
The integration of in silico modeling represents a paradigm shift in drug development within the DMPK market. This trend involves the utilization of computational techniques and predictive modeling to simulate the behavior of drugs in biological systems. By leveraging advanced algorithms and molecular modeling software, researchers can predict drug absorption, distribution, metabolism, and excretion (ADME) properties with greater accuracy and efficiency.
This approach significantly expedites the drug discovery process by reducing the need for costly and time-consuming laboratory experiments. Furthermore, in silico modeling enables the identification of potential drug candidates with optimized pharmacokinetic profiles, thereby enhancing the likelihood of successful clinical outcomes.
As the capabilities of computational modeling continue to advance, its integration into DMPK research is expected to become increasingly prevalent, driving innovation and streamlining drug development pipelines.
Rising Investments in Pharmacokinetics Research
The surge in investments in pharmacokinetics research reflects a growing recognition of its critical role in drug development and therapeutic optimization. Pharmaceutical companies, biotech firms, and research institutions are allocating substantial resources toward advancing our understanding of drug metabolism and pharmacokinetics.
This heightened investment is driven by several factors, including the increasing complexity of drug candidates, the rising demand for personalized medicine, and the need to address regulatory requirements for drug safety and efficacy. Moreover, advancements in analytical techniques and technologies, such as mass spectrometry and high-performance liquid chromatography, have expanded the capabilities of pharmacokinetics research, enabling more precise measurements and deeper insights into drug behavior in vivo.
The influx of funding into pharmacokinetics research is expected to fuel innovation, accelerate drug development timelines, and ultimately contribute to the delivery of safer and more efficacious therapeutics to patients worldwide.
Regional Analysis
In North America, the Drug Metabolism and Pharmacokinetics (DMPK) market accounts for 32.3% of total revenue.
In the realm of Drug Metabolism and Pharmacokinetics (DMPK), regional dynamics play a pivotal role in shaping market trends and influencing strategic decisions. Across North America, Europe, Asia Pacific, Middle East & Africa, and Latin America, distinctive characteristics and regulatory landscapes delineate the trajectory of this sector.
North America, holding sway as a frontrunner in the DMPK domain, commands a formidable share of approximately 32.3%. This dominance is underpinned by robust research infrastructure, a burgeoning pharmaceutical industry, and stringent regulatory frameworks ensuring high standards of drug safety and efficacy. With a mature market ecosystem, North America fosters innovation and adoption of advanced technologies, driving substantial investments in DMPK research and development endeavors.
In Europe, a confluence of factors including supportive government initiatives, a burgeoning geriatric population, and escalating incidences of chronic diseases bolster the demand for DMPK solutions. The region's emphasis on personalized medicine and precision therapeutics further augments market growth. Europe's market share reflects a significant portion of the global DMPK landscape, mirroring its status as a key player in pharmaceutical research and development.
The Asia Pacific region, characterized by a burgeoning healthcare infrastructure and surging investments in life sciences research, emerges as a burgeoning hub for DMPK activities. Rapid urbanization, expanding pharmaceutical markets, and a growing emphasis on precision medicine fuel market expansion in this region. Moreover, favorable regulatory reforms and a burgeoning contract research organization (CRO) landscape catalyze the uptake of DMPK services and solutions.
In the Middle East & Africa and Latin America, while market penetration may be comparatively lower, increasing investments in healthcare infrastructure and rising pharmaceutical expenditure lay the groundwork for burgeoning DMPK markets. These regions exhibit untapped potential and present lucrative opportunities for market players aiming to expand their global footprint.
Key Regions and Countries
North America
- The US
- Canada
- Rest of North America
Europe
- Germany
- France
- The UK
- Spain
- Netherlands
- Russia
- Italy
- Rest of Europe
Asia-Pacific
- China
- Japan
- Singapore
- Thailand
- South Korea
- Vietnam
- India
- New Zealand
- Rest of Asia Pacific
Latin America
- Mexico
- Brazil
- Rest of Latin America
Middle East & Africa
- Saudi Arabia
- South Africa
- UAE
- Rest of Middle East & Africa
Key Players Analysis
In 2023, the global Drug Metabolism And Pharmacokinetics (DMPK) market showcased a dynamic landscape shaped by several key players, each contributing significantly to the industry's growth trajectory. Among these influential entities, Eurofins Discovery emerged as a prominent figure, leveraging its robust capabilities in drug discovery and development services. With a comprehensive suite of offerings encompassing bioanalytical testing, in vitro and in vivo pharmacology, and medicinal chemistry support, Eurofins Discovery fortified its position as a leading solution provider in the DMPK domain.
Inotiv, renowned for its integrated drug discovery and development solutions, played a pivotal role in driving innovation within the DMPK market. Through its expertise in bioanalytical services, pharmacokinetic assessments, and toxicology studies, Inotiv contributed to advancing therapeutic research and enhancing drug efficacy and safety profiles.
Evotec, recognized for its innovative drug discovery platforms and strategic partnerships, continued to exert a significant influence on the DMPK landscape. By offering a comprehensive suite of services spanning target identification to preclinical development, Evotec bolstered the efficiency and effectiveness of drug discovery programs worldwide.
Sai Life Sciences, Sygnature Discovery, and WuXi AppTec also made substantial contributions to the global DMPK market through their diverse portfolios of drug metabolism and pharmacokinetic services. These companies demonstrated a commitment to delivering high-quality research solutions and fostering collaborative partnerships to address the evolving needs of pharmaceutical and biotechnology companies.
The collective efforts of Hangzhou Tigermed Consulting Co, Q2 Solutions, Jubilant Biosys, Frontage Laboratories, Invitrocue, and others further enriched the DMPK landscape, facilitating advancements in drug development and accelerating the pace of therapeutic innovation. As these key players continue to drive progress and shape the future of the DMPK market, stakeholders can anticipate a landscape characterized by innovation, collaboration, and transformative breakthroughs in pharmaceutical research and development.
Market Key Players
- Eurofins Discovery
- Inotiv, Evotec
- Sai Life Sciences
- Sygnature Discovery
- WuXi AppTec
- Hangzhou Tigermed Consulting Co
- Q2 Solutions
- Jubilant Biosys
- Frontage Laboratories
- Invitrocue
- Creative Biolabs
- CrownBioscience
- Agilent
- H3D
- LABCORP
- Bioduro-Sundia
- Allucent
Recent Development
- In January 2024, Sai Life Sciences enhance DMPK services with 25,000 sq. ft. lab expansion and global talent recruitment, reinforcing commitment to global clients.
- In November 2023, Miltentyi Biotech explores technological advances in drug discovery, emphasizing collaboration and AI integration to overcome silos in the DMTA cycle, enhancing efficiency and molecule quality.
- In October 2023, Roche, through its RNA Hub, pioneers Brainshuttle™ technology, facilitating the delivery of nucleic acid therapeutics to the brain, potentially revolutionizing treatments for brain diseases.
Report Scope
Report Features Description Market Value (2023) USD 1.2 Billion Forecast Revenue (2033) USD 2.6 Billion CAGR (2024-2032) 8.3% Base Year for Estimation 2023 Historic Period 2016-2023 Forecast Period 2024-2033 Report Coverage Revenue Forecast, Market Dynamics, COVID-19 Impact, Competitive Landscape, Recent Developments Segments Covered By Type(Small Molecules, Biologics), By Application(Biopharmaceutical Companies, Government and Academic Institutes, Others) Regional Analysis North America - The US, Canada, Rest of North America, Europe - Germany, France, The UK, Spain, Italy, Russia, Netherlands, Rest of Europe, Asia-Pacific - China, Japan, South Korea, India, New Zealand, Singapore, Thailand, Vietnam, Rest of Asia Pacific, Latin America - Brazil, Mexico, Rest of Latin America, Middle East & Africa - South Africa, Saudi Arabia, UAE, Rest of Middle East & Africa Competitive Landscape Eurofins Discovery, Inotiv, Evotec, Sai Life Sciences, Sygnature Discovery, WuXi AppTec, Hangzhou Tigermed Consulting Co, Q2 Solutions, Jubilant Biosys, Frontage Laboratories, Invitrocue, Creative Biolabs, CrownBioscience, Agilent, H3D, LABCORP, Bioduro-Sundia, Allucent Customization Scope Customization for segments, region/country-level will be provided. Moreover, additional customization can be done based on the requirements. Purchase Options We have three licenses to opt for Single User License, Multi-User License (Up to 5 Users), Corporate Use License (Unlimited User and Printable PDF) -
- 1. Executive Summary
- 1.1. Definition
- 1.2. Taxonomy
- 1.3. Research Scope
- 1.4. Key Analysis
- 1.5. Key Findings by Major Segments
- 1.6. Top strategies by Major Players
- 2. Global Drug Metabolism And Pharmacokinetics (Dmpk) Market Overview
- 2.1. Drug Metabolism And Pharmacokinetics (Dmpk) Market Dynamics
- 2.1.1. Drivers
- 2.1.2. Opportunities
- 2.1.3. Restraints
- 2.1.4. Challenges
- 2.2. Macro-economic Factors
- 2.3. Regulatory Framework
- 2.4. Market Investment Feasibility Index
- 2.5. PEST Analysis
- 2.6. PORTER’S Five Force Analysis
- 2.7. Drivers & Restraints Impact Analysis
- 2.8. Industry Chain Analysis
- 2.9. Cost Structure Analysis
- 2.10. Marketing Strategy
- 2.11. Russia-Ukraine War Impact Analysis
- 2.12. Opportunity Map Analysis
- 2.13. Market Competition Scenario Analysis
- 2.14. Product Life Cycle Analysis
- 2.15. Opportunity Orbits
- 2.16. Manufacturer Intensity Map
- 2.17. Major Companies sales by Value & Volume
- 2.1. Drug Metabolism And Pharmacokinetics (Dmpk) Market Dynamics
- 3. Global Drug Metabolism And Pharmacokinetics (Dmpk) Market Analysis, Opportunity and Forecast, 2016-2032
- 3.1. Global Drug Metabolism And Pharmacokinetics (Dmpk) Market Analysis, 2016-2021
- 3.2. Global Drug Metabolism And Pharmacokinetics (Dmpk) Market Opportunity and Forecast, 2023-2032
- 3.3. Global Drug Metabolism And Pharmacokinetics (Dmpk) Market Analysis, Opportunity and Forecast, By By Type, 2016-2032
- 3.3.1. Global Drug Metabolism And Pharmacokinetics (Dmpk) Market Analysis by By Type: Introduction
- 3.3.2. Market Size Absolute $ Opportunity Analysis and Forecast, By By Type, 2016-2032
- 3.3.3. Small Molecules
- 3.3.4. Biologics
- 3.4. Global Drug Metabolism And Pharmacokinetics (Dmpk) Market Analysis, Opportunity and Forecast, By By Application, 2016-2032
- 3.4.1. Global Drug Metabolism And Pharmacokinetics (Dmpk) Market Analysis by By Application: Introduction
- 3.4.2. Market Size Absolute $ Opportunity Analysis and Forecast, By By Application, 2016-2032
- 3.4.3. Biopharmaceutical Companies
- 3.4.4. Government and Academic Institutes
- 3.4.5. Others
- 4. North America Drug Metabolism And Pharmacokinetics (Dmpk) Market Analysis, Opportunity and Forecast, 2016-2032
- 4.1. North America Drug Metabolism And Pharmacokinetics (Dmpk) Market Analysis, 2016-2021
- 4.2. North America Drug Metabolism And Pharmacokinetics (Dmpk) Market Opportunity and Forecast, 2023-2032
- 4.3. North America Drug Metabolism And Pharmacokinetics (Dmpk) Market Analysis, Opportunity and Forecast, By By Type, 2016-2032
- 4.3.1. North America Drug Metabolism And Pharmacokinetics (Dmpk) Market Analysis by By Type: Introduction
- 4.3.2. Market Size Absolute $ Opportunity Analysis and Forecast, By By Type, 2016-2032
- 4.3.3. Small Molecules
- 4.3.4. Biologics
- 4.4. North America Drug Metabolism And Pharmacokinetics (Dmpk) Market Analysis, Opportunity and Forecast, By By Application, 2016-2032
- 4.4.1. North America Drug Metabolism And Pharmacokinetics (Dmpk) Market Analysis by By Application: Introduction
- 4.4.2. Market Size Absolute $ Opportunity Analysis and Forecast, By By Application, 2016-2032
- 4.4.3. Biopharmaceutical Companies
- 4.4.4. Government and Academic Institutes
- 4.4.5. Others
- 4.5. North America Drug Metabolism And Pharmacokinetics (Dmpk) Market Analysis, Opportunity and Forecast, By Country , 2016-2032
- 4.5.1. North America Drug Metabolism And Pharmacokinetics (Dmpk) Market Analysis by Country : Introduction
- 4.5.2. Market Size Absolute $ Opportunity Analysis and Forecast, Country , 2016-2032
- 4.5.2.1. The US
- 4.5.2.2. Canada
- 4.5.2.3. Mexico
- 5. Western Europe Drug Metabolism And Pharmacokinetics (Dmpk) Market Analysis, Opportunity and Forecast, 2016-2032
- 5.1. Western Europe Drug Metabolism And Pharmacokinetics (Dmpk) Market Analysis, 2016-2021
- 5.2. Western Europe Drug Metabolism And Pharmacokinetics (Dmpk) Market Opportunity and Forecast, 2023-2032
- 5.3. Western Europe Drug Metabolism And Pharmacokinetics (Dmpk) Market Analysis, Opportunity and Forecast, By By Type, 2016-2032
- 5.3.1. Western Europe Drug Metabolism And Pharmacokinetics (Dmpk) Market Analysis by By Type: Introduction
- 5.3.2. Market Size Absolute $ Opportunity Analysis and Forecast, By By Type, 2016-2032
- 5.3.3. Small Molecules
- 5.3.4. Biologics
- 5.4. Western Europe Drug Metabolism And Pharmacokinetics (Dmpk) Market Analysis, Opportunity and Forecast, By By Application, 2016-2032
- 5.4.1. Western Europe Drug Metabolism And Pharmacokinetics (Dmpk) Market Analysis by By Application: Introduction
- 5.4.2. Market Size Absolute $ Opportunity Analysis and Forecast, By By Application, 2016-2032
- 5.4.3. Biopharmaceutical Companies
- 5.4.4. Government and Academic Institutes
- 5.4.5. Others
- 5.5. Western Europe Drug Metabolism And Pharmacokinetics (Dmpk) Market Analysis, Opportunity and Forecast, By Country , 2016-2032
- 5.5.1. Western Europe Drug Metabolism And Pharmacokinetics (Dmpk) Market Analysis by Country : Introduction
- 5.5.2. Market Size Absolute $ Opportunity Analysis and Forecast, Country , 2016-2032
- 5.5.2.1. Germany
- 5.5.2.2. France
- 5.5.2.3. The UK
- 5.5.2.4. Spain
- 5.5.2.5. Italy
- 5.5.2.6. Portugal
- 5.5.2.7. Ireland
- 5.5.2.8. Austria
- 5.5.2.9. Switzerland
- 5.5.2.10. Benelux
- 5.5.2.11. Nordic
- 5.5.2.12. Rest of Western Europe
- 6. Eastern Europe Drug Metabolism And Pharmacokinetics (Dmpk) Market Analysis, Opportunity and Forecast, 2016-2032
- 6.1. Eastern Europe Drug Metabolism And Pharmacokinetics (Dmpk) Market Analysis, 2016-2021
- 6.2. Eastern Europe Drug Metabolism And Pharmacokinetics (Dmpk) Market Opportunity and Forecast, 2023-2032
- 6.3. Eastern Europe Drug Metabolism And Pharmacokinetics (Dmpk) Market Analysis, Opportunity and Forecast, By By Type, 2016-2032
- 6.3.1. Eastern Europe Drug Metabolism And Pharmacokinetics (Dmpk) Market Analysis by By Type: Introduction
- 6.3.2. Market Size Absolute $ Opportunity Analysis and Forecast, By By Type, 2016-2032
- 6.3.3. Small Molecules
- 6.3.4. Biologics
- 6.4. Eastern Europe Drug Metabolism And Pharmacokinetics (Dmpk) Market Analysis, Opportunity and Forecast, By By Application, 2016-2032
- 6.4.1. Eastern Europe Drug Metabolism And Pharmacokinetics (Dmpk) Market Analysis by By Application: Introduction
- 6.4.2. Market Size Absolute $ Opportunity Analysis and Forecast, By By Application, 2016-2032
- 6.4.3. Biopharmaceutical Companies
- 6.4.4. Government and Academic Institutes
- 6.4.5. Others
- 6.5. Eastern Europe Drug Metabolism And Pharmacokinetics (Dmpk) Market Analysis, Opportunity and Forecast, By Country , 2016-2032
- 6.5.1. Eastern Europe Drug Metabolism And Pharmacokinetics (Dmpk) Market Analysis by Country : Introduction
- 6.5.2. Market Size Absolute $ Opportunity Analysis and Forecast, Country , 2016-2032
- 6.5.2.1. Russia
- 6.5.2.2. Poland
- 6.5.2.3. The Czech Republic
- 6.5.2.4. Greece
- 6.5.2.5. Rest of Eastern Europe
- 7. APAC Drug Metabolism And Pharmacokinetics (Dmpk) Market Analysis, Opportunity and Forecast, 2016-2032
- 7.1. APAC Drug Metabolism And Pharmacokinetics (Dmpk) Market Analysis, 2016-2021
- 7.2. APAC Drug Metabolism And Pharmacokinetics (Dmpk) Market Opportunity and Forecast, 2023-2032
- 7.3. APAC Drug Metabolism And Pharmacokinetics (Dmpk) Market Analysis, Opportunity and Forecast, By By Type, 2016-2032
- 7.3.1. APAC Drug Metabolism And Pharmacokinetics (Dmpk) Market Analysis by By Type: Introduction
- 7.3.2. Market Size Absolute $ Opportunity Analysis and Forecast, By By Type, 2016-2032
- 7.3.3. Small Molecules
- 7.3.4. Biologics
- 7.4. APAC Drug Metabolism And Pharmacokinetics (Dmpk) Market Analysis, Opportunity and Forecast, By By Application, 2016-2032
- 7.4.1. APAC Drug Metabolism And Pharmacokinetics (Dmpk) Market Analysis by By Application: Introduction
- 7.4.2. Market Size Absolute $ Opportunity Analysis and Forecast, By By Application, 2016-2032
- 7.4.3. Biopharmaceutical Companies
- 7.4.4. Government and Academic Institutes
- 7.4.5. Others
- 7.5. APAC Drug Metabolism And Pharmacokinetics (Dmpk) Market Analysis, Opportunity and Forecast, By Country , 2016-2032
- 7.5.1. APAC Drug Metabolism And Pharmacokinetics (Dmpk) Market Analysis by Country : Introduction
- 7.5.2. Market Size Absolute $ Opportunity Analysis and Forecast, Country , 2016-2032
- 7.5.2.1. China
- 7.5.2.2. Japan
- 7.5.2.3. South Korea
- 7.5.2.4. India
- 7.5.2.5. Australia & New Zeland
- 7.5.2.6. Indonesia
- 7.5.2.7. Malaysia
- 7.5.2.8. Philippines
- 7.5.2.9. Singapore
- 7.5.2.10. Thailand
- 7.5.2.11. Vietnam
- 7.5.2.12. Rest of APAC
- 8. Latin America Drug Metabolism And Pharmacokinetics (Dmpk) Market Analysis, Opportunity and Forecast, 2016-2032
- 8.1. Latin America Drug Metabolism And Pharmacokinetics (Dmpk) Market Analysis, 2016-2021
- 8.2. Latin America Drug Metabolism And Pharmacokinetics (Dmpk) Market Opportunity and Forecast, 2023-2032
- 8.3. Latin America Drug Metabolism And Pharmacokinetics (Dmpk) Market Analysis, Opportunity and Forecast, By By Type, 2016-2032
- 8.3.1. Latin America Drug Metabolism And Pharmacokinetics (Dmpk) Market Analysis by By Type: Introduction
- 8.3.2. Market Size Absolute $ Opportunity Analysis and Forecast, By By Type, 2016-2032
- 8.3.3. Small Molecules
- 8.3.4. Biologics
- 8.4. Latin America Drug Metabolism And Pharmacokinetics (Dmpk) Market Analysis, Opportunity and Forecast, By By Application, 2016-2032
- 8.4.1. Latin America Drug Metabolism And Pharmacokinetics (Dmpk) Market Analysis by By Application: Introduction
- 8.4.2. Market Size Absolute $ Opportunity Analysis and Forecast, By By Application, 2016-2032
- 8.4.3. Biopharmaceutical Companies
- 8.4.4. Government and Academic Institutes
- 8.4.5. Others
- 8.5. Latin America Drug Metabolism And Pharmacokinetics (Dmpk) Market Analysis, Opportunity and Forecast, By Country , 2016-2032
- 8.5.1. Latin America Drug Metabolism And Pharmacokinetics (Dmpk) Market Analysis by Country : Introduction
- 8.5.2. Market Size Absolute $ Opportunity Analysis and Forecast, Country , 2016-2032
- 8.5.2.1. Brazil
- 8.5.2.2. Colombia
- 8.5.2.3. Chile
- 8.5.2.4. Argentina
- 8.5.2.5. Costa Rica
- 8.5.2.6. Rest of Latin America
- 9. Middle East & Africa Drug Metabolism And Pharmacokinetics (Dmpk) Market Analysis, Opportunity and Forecast, 2016-2032
- 9.1. Middle East & Africa Drug Metabolism And Pharmacokinetics (Dmpk) Market Analysis, 2016-2021
- 9.2. Middle East & Africa Drug Metabolism And Pharmacokinetics (Dmpk) Market Opportunity and Forecast, 2023-2032
- 9.3. Middle East & Africa Drug Metabolism And Pharmacokinetics (Dmpk) Market Analysis, Opportunity and Forecast, By By Type, 2016-2032
- 9.3.1. Middle East & Africa Drug Metabolism And Pharmacokinetics (Dmpk) Market Analysis by By Type: Introduction
- 9.3.2. Market Size Absolute $ Opportunity Analysis and Forecast, By By Type, 2016-2032
- 9.3.3. Small Molecules
- 9.3.4. Biologics
- 9.4. Middle East & Africa Drug Metabolism And Pharmacokinetics (Dmpk) Market Analysis, Opportunity and Forecast, By By Application, 2016-2032
- 9.4.1. Middle East & Africa Drug Metabolism And Pharmacokinetics (Dmpk) Market Analysis by By Application: Introduction
- 9.4.2. Market Size Absolute $ Opportunity Analysis and Forecast, By By Application, 2016-2032
- 9.4.3. Biopharmaceutical Companies
- 9.4.4. Government and Academic Institutes
- 9.4.5. Others
- 9.5. Middle East & Africa Drug Metabolism And Pharmacokinetics (Dmpk) Market Analysis, Opportunity and Forecast, By Country , 2016-2032
- 9.5.1. Middle East & Africa Drug Metabolism And Pharmacokinetics (Dmpk) Market Analysis by Country : Introduction
- 9.5.2. Market Size Absolute $ Opportunity Analysis and Forecast, Country , 2016-2032
- 9.5.2.1. Algeria
- 9.5.2.2. Egypt
- 9.5.2.3. Israel
- 9.5.2.4. Kuwait
- 9.5.2.5. Nigeria
- 9.5.2.6. Saudi Arabia
- 9.5.2.7. South Africa
- 9.5.2.8. Turkey
- 9.5.2.9. The UAE
- 9.5.2.10. Rest of MEA
- 10. Global Drug Metabolism And Pharmacokinetics (Dmpk) Market Analysis, Opportunity and Forecast, By Region , 2016-2032
- 10.1. Global Drug Metabolism And Pharmacokinetics (Dmpk) Market Analysis by Region : Introduction
- 10.2. Market Size Absolute $ Opportunity Analysis and Forecast, By Region , 2016-2032
- 10.2.1. North America
- 10.2.2. Western Europe
- 10.2.3. Eastern Europe
- 10.2.4. APAC
- 10.2.5. Latin America
- 10.2.6. Middle East & Africa
- 11. Global Drug Metabolism And Pharmacokinetics (Dmpk) Market Competitive Landscape, Market Share Analysis, and Company Profiles
- 11.1. Market Share Analysis
- 11.2. Company Profiles
- 11.3. Eurofins Discovery
- 11.3.1. Company Overview
- 11.3.2. Financial Highlights
- 11.3.3. Product Portfolio
- 11.3.4. SWOT Analysis
- 11.3.5. Key Strategies and Developments
- 11.4. Inotiv, Evotec
- 11.4.1. Company Overview
- 11.4.2. Financial Highlights
- 11.4.3. Product Portfolio
- 11.4.4. SWOT Analysis
- 11.4.5. Key Strategies and Developments
- 11.5. Sai Life Sciences
- 11.5.1. Company Overview
- 11.5.2. Financial Highlights
- 11.5.3. Product Portfolio
- 11.5.4. SWOT Analysis
- 11.5.5. Key Strategies and Developments
- 11.6. Sygnature Discovery
- 11.6.1. Company Overview
- 11.6.2. Financial Highlights
- 11.6.3. Product Portfolio
- 11.6.4. SWOT Analysis
- 11.6.5. Key Strategies and Developments
- 11.7. WuXi AppTec
- 11.7.1. Company Overview
- 11.7.2. Financial Highlights
- 11.7.3. Product Portfolio
- 11.7.4. SWOT Analysis
- 11.7.5. Key Strategies and Developments
- 11.8. Hangzhou Tigermed Consulting Co
- 11.8.1. Company Overview
- 11.8.2. Financial Highlights
- 11.8.3. Product Portfolio
- 11.8.4. SWOT Analysis
- 11.8.5. Key Strategies and Developments
- 11.9. Q2 Solutions
- 11.9.1. Company Overview
- 11.9.2. Financial Highlights
- 11.9.3. Product Portfolio
- 11.9.4. SWOT Analysis
- 11.9.5. Key Strategies and Developments
- 11.10. Jubilant Biosys
- 11.10.1. Company Overview
- 11.10.2. Financial Highlights
- 11.10.3. Product Portfolio
- 11.10.4. SWOT Analysis
- 11.10.5. Key Strategies and Developments
- 11.11. Frontage Laboratories
- 11.11.1. Company Overview
- 11.11.2. Financial Highlights
- 11.11.3. Product Portfolio
- 11.11.4. SWOT Analysis
- 11.11.5. Key Strategies and Developments
- 11.12. Invitrocue
- 11.12.1. Company Overview
- 11.12.2. Financial Highlights
- 11.12.3. Product Portfolio
- 11.12.4. SWOT Analysis
- 11.12.5. Key Strategies and Developments
- 11.13.1. Company Overview
- 11.13.2. Financial Highlights
- 11.13.3. Product Portfolio
- 11.13.4. SWOT Analysis
- 11.13.5. Key Strategies and Developments
- 11.14. Creative Biolabs
- 11.14.1. Company Overview
- 11.14.2. Financial Highlights
- 11.14.3. Product Portfolio
- 11.14.4. SWOT Analysis
- 11.14.5. Key Strategies and Developments
- 11.15. Agilent
- 11.15.1. Company Overview
- 11.15.2. Financial Highlights
- 11.15.3. Product Portfolio
- 11.15.4. SWOT Analysis
- 11.15.5. Key Strategies and Developments
- 11.16. H3D
- 11.16.1. Company Overview
- 11.16.2. Financial Highlights
- 11.16.3. Product Portfolio
- 11.16.4. SWOT Analysis
- 11.16.5. Key Strategies and Developments
- 11.17. LABCORP
- 11.17.1. Company Overview
- 11.17.2. Financial Highlights
- 11.17.3. Product Portfolio
- 11.17.4. SWOT Analysis
- 11.17.5. Key Strategies and Developments
- 11.18. Bioduro-Sundia
- 11.18.1. Company Overview
- 11.18.2. Financial Highlights
- 11.18.3. Product Portfolio
- 11.18.4. SWOT Analysis
- 11.18.5. Key Strategies and Developments
- 11.19. Allucent
- 11.19.1. Company Overview
- 11.19.2. Financial Highlights
- 11.19.3. Product Portfolio
- 11.19.4. SWOT Analysis
- 11.19.5. Key Strategies and Developments
- 12. Assumptions and Acronyms
- 13. Research Methodology
- 14. Contact
"
- List of Figures
- "
- Figure 1: Global Drug Metabolism And Pharmacokinetics (Dmpk) Market Revenue (US$ Mn) Market Share by By Type in 2022
- Figure 2: Global Drug Metabolism And Pharmacokinetics (Dmpk) Market Market Attractiveness Analysis by By Type, 2016-2032
- Figure 3: Global Drug Metabolism And Pharmacokinetics (Dmpk) Market Revenue (US$ Mn) Market Share by By Applicationin 2022
- Figure 4: Global Drug Metabolism And Pharmacokinetics (Dmpk) Market Market Attractiveness Analysis by By Application, 2016-2032
- Figure 5: Global Drug Metabolism And Pharmacokinetics (Dmpk) Market Revenue (US$ Mn) Market Share by Region in 2022
- Figure 6: Global Drug Metabolism And Pharmacokinetics (Dmpk) Market Market Attractiveness Analysis by Region, 2016-2032
- Figure 7: Global Drug Metabolism And Pharmacokinetics (Dmpk) Market Market Revenue (US$ Mn) (2016-2032)
- Figure 8: Global Drug Metabolism And Pharmacokinetics (Dmpk) Market Market Revenue (US$ Mn) Comparison by Region (2016-2032)
- Figure 9: Global Drug Metabolism And Pharmacokinetics (Dmpk) Market Market Revenue (US$ Mn) Comparison by By Type (2016-2032)
- Figure 10: Global Drug Metabolism And Pharmacokinetics (Dmpk) Market Market Revenue (US$ Mn) Comparison by By Application (2016-2032)
- Figure 11: Global Drug Metabolism And Pharmacokinetics (Dmpk) Market Market Y-o-Y Growth Rate Comparison by Region (2016-2032)
- Figure 12: Global Drug Metabolism And Pharmacokinetics (Dmpk) Market Market Y-o-Y Growth Rate Comparison by By Type (2016-2032)
- Figure 13: Global Drug Metabolism And Pharmacokinetics (Dmpk) Market Market Y-o-Y Growth Rate Comparison by By Application (2016-2032)
- Figure 14: Global Drug Metabolism And Pharmacokinetics (Dmpk) Market Market Share Comparison by Region (2016-2032)
- Figure 15: Global Drug Metabolism And Pharmacokinetics (Dmpk) Market Market Share Comparison by By Type (2016-2032)
- Figure 16: Global Drug Metabolism And Pharmacokinetics (Dmpk) Market Market Share Comparison by By Application (2016-2032)
- Figure 17: North America Drug Metabolism And Pharmacokinetics (Dmpk) Market Revenue (US$ Mn) Market Share by By Typein 2022
- Figure 18: North America Drug Metabolism And Pharmacokinetics (Dmpk) Market Market Attractiveness Analysis by By Type, 2016-2032
- Figure 19: North America Drug Metabolism And Pharmacokinetics (Dmpk) Market Revenue (US$ Mn) Market Share by By Applicationin 2022
- Figure 20: North America Drug Metabolism And Pharmacokinetics (Dmpk) Market Market Attractiveness Analysis by By Application, 2016-2032
- Figure 21: North America Drug Metabolism And Pharmacokinetics (Dmpk) Market Revenue (US$ Mn) Market Share by Country in 2022
- Figure 22: North America Drug Metabolism And Pharmacokinetics (Dmpk) Market Market Attractiveness Analysis by Country, 2016-2032
- Figure 23: North America Drug Metabolism And Pharmacokinetics (Dmpk) Market Market Revenue (US$ Mn) (2016-2032)
- Figure 24: North America Drug Metabolism And Pharmacokinetics (Dmpk) Market Market Revenue (US$ Mn) Comparison by Country (2016-2032)
- Figure 25: North America Drug Metabolism And Pharmacokinetics (Dmpk) Market Market Revenue (US$ Mn) Comparison by By Type (2016-2032)
- Figure 26: North America Drug Metabolism And Pharmacokinetics (Dmpk) Market Market Revenue (US$ Mn) Comparison by By Application (2016-2032)
- Figure 27: North America Drug Metabolism And Pharmacokinetics (Dmpk) Market Market Y-o-Y Growth Rate Comparison by Country (2016-2032)
- Figure 28: North America Drug Metabolism And Pharmacokinetics (Dmpk) Market Market Y-o-Y Growth Rate Comparison by By Type (2016-2032)
- Figure 29: North America Drug Metabolism And Pharmacokinetics (Dmpk) Market Market Y-o-Y Growth Rate Comparison by By Application (2016-2032)
- Figure 30: North America Drug Metabolism And Pharmacokinetics (Dmpk) Market Market Share Comparison by Country (2016-2032)
- Figure 31: North America Drug Metabolism And Pharmacokinetics (Dmpk) Market Market Share Comparison by By Type (2016-2032)
- Figure 32: North America Drug Metabolism And Pharmacokinetics (Dmpk) Market Market Share Comparison by By Application (2016-2032)
- Figure 33: Western Europe Drug Metabolism And Pharmacokinetics (Dmpk) Market Revenue (US$ Mn) Market Share by By Typein 2022
- Figure 34: Western Europe Drug Metabolism And Pharmacokinetics (Dmpk) Market Market Attractiveness Analysis by By Type, 2016-2032
- Figure 35: Western Europe Drug Metabolism And Pharmacokinetics (Dmpk) Market Revenue (US$ Mn) Market Share by By Applicationin 2022
- Figure 36: Western Europe Drug Metabolism And Pharmacokinetics (Dmpk) Market Market Attractiveness Analysis by By Application, 2016-2032
- Figure 37: Western Europe Drug Metabolism And Pharmacokinetics (Dmpk) Market Revenue (US$ Mn) Market Share by Country in 2022
- Figure 38: Western Europe Drug Metabolism And Pharmacokinetics (Dmpk) Market Market Attractiveness Analysis by Country, 2016-2032
- Figure 39: Western Europe Drug Metabolism And Pharmacokinetics (Dmpk) Market Market Revenue (US$ Mn) (2016-2032)
- Figure 40: Western Europe Drug Metabolism And Pharmacokinetics (Dmpk) Market Market Revenue (US$ Mn) Comparison by Country (2016-2032)
- Figure 41: Western Europe Drug Metabolism And Pharmacokinetics (Dmpk) Market Market Revenue (US$ Mn) Comparison by By Type (2016-2032)
- Figure 42: Western Europe Drug Metabolism And Pharmacokinetics (Dmpk) Market Market Revenue (US$ Mn) Comparison by By Application (2016-2032)
- Figure 43: Western Europe Drug Metabolism And Pharmacokinetics (Dmpk) Market Market Y-o-Y Growth Rate Comparison by Country (2016-2032)
- Figure 44: Western Europe Drug Metabolism And Pharmacokinetics (Dmpk) Market Market Y-o-Y Growth Rate Comparison by By Type (2016-2032)
- Figure 45: Western Europe Drug Metabolism And Pharmacokinetics (Dmpk) Market Market Y-o-Y Growth Rate Comparison by By Application (2016-2032)
- Figure 46: Western Europe Drug Metabolism And Pharmacokinetics (Dmpk) Market Market Share Comparison by Country (2016-2032)
- Figure 47: Western Europe Drug Metabolism And Pharmacokinetics (Dmpk) Market Market Share Comparison by By Type (2016-2032)
- Figure 48: Western Europe Drug Metabolism And Pharmacokinetics (Dmpk) Market Market Share Comparison by By Application (2016-2032)
- Figure 49: Eastern Europe Drug Metabolism And Pharmacokinetics (Dmpk) Market Revenue (US$ Mn) Market Share by By Typein 2022
- Figure 50: Eastern Europe Drug Metabolism And Pharmacokinetics (Dmpk) Market Market Attractiveness Analysis by By Type, 2016-2032
- Figure 51: Eastern Europe Drug Metabolism And Pharmacokinetics (Dmpk) Market Revenue (US$ Mn) Market Share by By Applicationin 2022
- Figure 52: Eastern Europe Drug Metabolism And Pharmacokinetics (Dmpk) Market Market Attractiveness Analysis by By Application, 2016-2032
- Figure 53: Eastern Europe Drug Metabolism And Pharmacokinetics (Dmpk) Market Revenue (US$ Mn) Market Share by Country in 2022
- Figure 54: Eastern Europe Drug Metabolism And Pharmacokinetics (Dmpk) Market Market Attractiveness Analysis by Country, 2016-2032
- Figure 55: Eastern Europe Drug Metabolism And Pharmacokinetics (Dmpk) Market Market Revenue (US$ Mn) (2016-2032)
- Figure 56: Eastern Europe Drug Metabolism And Pharmacokinetics (Dmpk) Market Market Revenue (US$ Mn) Comparison by Country (2016-2032)
- Figure 57: Eastern Europe Drug Metabolism And Pharmacokinetics (Dmpk) Market Market Revenue (US$ Mn) Comparison by By Type (2016-2032)
- Figure 58: Eastern Europe Drug Metabolism And Pharmacokinetics (Dmpk) Market Market Revenue (US$ Mn) Comparison by By Application (2016-2032)
- Figure 59: Eastern Europe Drug Metabolism And Pharmacokinetics (Dmpk) Market Market Y-o-Y Growth Rate Comparison by Country (2016-2032)
- Figure 60: Eastern Europe Drug Metabolism And Pharmacokinetics (Dmpk) Market Market Y-o-Y Growth Rate Comparison by By Type (2016-2032)
- Figure 61: Eastern Europe Drug Metabolism And Pharmacokinetics (Dmpk) Market Market Y-o-Y Growth Rate Comparison by By Application (2016-2032)
- Figure 62: Eastern Europe Drug Metabolism And Pharmacokinetics (Dmpk) Market Market Share Comparison by Country (2016-2032)
- Figure 63: Eastern Europe Drug Metabolism And Pharmacokinetics (Dmpk) Market Market Share Comparison by By Type (2016-2032)
- Figure 64: Eastern Europe Drug Metabolism And Pharmacokinetics (Dmpk) Market Market Share Comparison by By Application (2016-2032)
- Figure 65: APAC Drug Metabolism And Pharmacokinetics (Dmpk) Market Revenue (US$ Mn) Market Share by By Typein 2022
- Figure 66: APAC Drug Metabolism And Pharmacokinetics (Dmpk) Market Market Attractiveness Analysis by By Type, 2016-2032
- Figure 67: APAC Drug Metabolism And Pharmacokinetics (Dmpk) Market Revenue (US$ Mn) Market Share by By Applicationin 2022
- Figure 68: APAC Drug Metabolism And Pharmacokinetics (Dmpk) Market Market Attractiveness Analysis by By Application, 2016-2032
- Figure 69: APAC Drug Metabolism And Pharmacokinetics (Dmpk) Market Revenue (US$ Mn) Market Share by Country in 2022
- Figure 70: APAC Drug Metabolism And Pharmacokinetics (Dmpk) Market Market Attractiveness Analysis by Country, 2016-2032
- Figure 71: APAC Drug Metabolism And Pharmacokinetics (Dmpk) Market Market Revenue (US$ Mn) (2016-2032)
- Figure 72: APAC Drug Metabolism And Pharmacokinetics (Dmpk) Market Market Revenue (US$ Mn) Comparison by Country (2016-2032)
- Figure 73: APAC Drug Metabolism And Pharmacokinetics (Dmpk) Market Market Revenue (US$ Mn) Comparison by By Type (2016-2032)
- Figure 74: APAC Drug Metabolism And Pharmacokinetics (Dmpk) Market Market Revenue (US$ Mn) Comparison by By Application (2016-2032)
- Figure 75: APAC Drug Metabolism And Pharmacokinetics (Dmpk) Market Market Y-o-Y Growth Rate Comparison by Country (2016-2032)
- Figure 76: APAC Drug Metabolism And Pharmacokinetics (Dmpk) Market Market Y-o-Y Growth Rate Comparison by By Type (2016-2032)
- Figure 77: APAC Drug Metabolism And Pharmacokinetics (Dmpk) Market Market Y-o-Y Growth Rate Comparison by By Application (2016-2032)
- Figure 78: APAC Drug Metabolism And Pharmacokinetics (Dmpk) Market Market Share Comparison by Country (2016-2032)
- Figure 79: APAC Drug Metabolism And Pharmacokinetics (Dmpk) Market Market Share Comparison by By Type (2016-2032)
- Figure 80: APAC Drug Metabolism And Pharmacokinetics (Dmpk) Market Market Share Comparison by By Application (2016-2032)
- Figure 81: Latin America Drug Metabolism And Pharmacokinetics (Dmpk) Market Revenue (US$ Mn) Market Share by By Typein 2022
- Figure 82: Latin America Drug Metabolism And Pharmacokinetics (Dmpk) Market Market Attractiveness Analysis by By Type, 2016-2032
- Figure 83: Latin America Drug Metabolism And Pharmacokinetics (Dmpk) Market Revenue (US$ Mn) Market Share by By Applicationin 2022
- Figure 84: Latin America Drug Metabolism And Pharmacokinetics (Dmpk) Market Market Attractiveness Analysis by By Application, 2016-2032
- Figure 85: Latin America Drug Metabolism And Pharmacokinetics (Dmpk) Market Revenue (US$ Mn) Market Share by Country in 2022
- Figure 86: Latin America Drug Metabolism And Pharmacokinetics (Dmpk) Market Market Attractiveness Analysis by Country, 2016-2032
- Figure 87: Latin America Drug Metabolism And Pharmacokinetics (Dmpk) Market Market Revenue (US$ Mn) (2016-2032)
- Figure 88: Latin America Drug Metabolism And Pharmacokinetics (Dmpk) Market Market Revenue (US$ Mn) Comparison by Country (2016-2032)
- Figure 89: Latin America Drug Metabolism And Pharmacokinetics (Dmpk) Market Market Revenue (US$ Mn) Comparison by By Type (2016-2032)
- Figure 90: Latin America Drug Metabolism And Pharmacokinetics (Dmpk) Market Market Revenue (US$ Mn) Comparison by By Application (2016-2032)
- Figure 91: Latin America Drug Metabolism And Pharmacokinetics (Dmpk) Market Market Y-o-Y Growth Rate Comparison by Country (2016-2032)
- Figure 92: Latin America Drug Metabolism And Pharmacokinetics (Dmpk) Market Market Y-o-Y Growth Rate Comparison by By Type (2016-2032)
- Figure 93: Latin America Drug Metabolism And Pharmacokinetics (Dmpk) Market Market Y-o-Y Growth Rate Comparison by By Application (2016-2032)
- Figure 94: Latin America Drug Metabolism And Pharmacokinetics (Dmpk) Market Market Share Comparison by Country (2016-2032)
- Figure 95: Latin America Drug Metabolism And Pharmacokinetics (Dmpk) Market Market Share Comparison by By Type (2016-2032)
- Figure 96: Latin America Drug Metabolism And Pharmacokinetics (Dmpk) Market Market Share Comparison by By Application (2016-2032)
- Figure 97: Middle East & Africa Drug Metabolism And Pharmacokinetics (Dmpk) Market Revenue (US$ Mn) Market Share by By Typein 2022
- Figure 98: Middle East & Africa Drug Metabolism And Pharmacokinetics (Dmpk) Market Market Attractiveness Analysis by By Type, 2016-2032
- Figure 99: Middle East & Africa Drug Metabolism And Pharmacokinetics (Dmpk) Market Revenue (US$ Mn) Market Share by By Applicationin 2022
- Figure 100: Middle East & Africa Drug Metabolism And Pharmacokinetics (Dmpk) Market Market Attractiveness Analysis by By Application, 2016-2032
- Figure 101: Middle East & Africa Drug Metabolism And Pharmacokinetics (Dmpk) Market Revenue (US$ Mn) Market Share by Country in 2022
- Figure 102: Middle East & Africa Drug Metabolism And Pharmacokinetics (Dmpk) Market Market Attractiveness Analysis by Country, 2016-2032
- Figure 103: Middle East & Africa Drug Metabolism And Pharmacokinetics (Dmpk) Market Market Revenue (US$ Mn) (2016-2032)
- Figure 104: Middle East & Africa Drug Metabolism And Pharmacokinetics (Dmpk) Market Market Revenue (US$ Mn) Comparison by Country (2016-2032)
- Figure 105: Middle East & Africa Drug Metabolism And Pharmacokinetics (Dmpk) Market Market Revenue (US$ Mn) Comparison by By Type (2016-2032)
- Figure 106: Middle East & Africa Drug Metabolism And Pharmacokinetics (Dmpk) Market Market Revenue (US$ Mn) Comparison by By Application (2016-2032)
- Figure 107: Middle East & Africa Drug Metabolism And Pharmacokinetics (Dmpk) Market Market Y-o-Y Growth Rate Comparison by Country (2016-2032)
- Figure 108: Middle East & Africa Drug Metabolism And Pharmacokinetics (Dmpk) Market Market Y-o-Y Growth Rate Comparison by By Type (2016-2032)
- Figure 109: Middle East & Africa Drug Metabolism And Pharmacokinetics (Dmpk) Market Market Y-o-Y Growth Rate Comparison by By Application (2016-2032)
- Figure 110: Middle East & Africa Drug Metabolism And Pharmacokinetics (Dmpk) Market Market Share Comparison by Country (2016-2032)
- Figure 111: Middle East & Africa Drug Metabolism And Pharmacokinetics (Dmpk) Market Market Share Comparison by By Type (2016-2032)
- Figure 112: Middle East & Africa Drug Metabolism And Pharmacokinetics (Dmpk) Market Market Share Comparison by By Application (2016-2032)
"
- List of Tables
- "
- Table 1: Global Drug Metabolism And Pharmacokinetics (Dmpk) Market Market Comparison by By Type (2016-2032)
- Table 2: Global Drug Metabolism And Pharmacokinetics (Dmpk) Market Market Comparison by By Application (2016-2032)
- Table 3: Global Drug Metabolism And Pharmacokinetics (Dmpk) Market Revenue (US$ Mn) Comparison by Region (2016-2032)
- Table 4: Global Drug Metabolism And Pharmacokinetics (Dmpk) Market Market Revenue (US$ Mn) (2016-2032)
- Table 5: Global Drug Metabolism And Pharmacokinetics (Dmpk) Market Market Revenue (US$ Mn) Comparison by Region (2016-2032)
- Table 6: Global Drug Metabolism And Pharmacokinetics (Dmpk) Market Market Revenue (US$ Mn) Comparison by By Type (2016-2032)
- Table 7: Global Drug Metabolism And Pharmacokinetics (Dmpk) Market Market Revenue (US$ Mn) Comparison by By Application (2016-2032)
- Table 8: Global Drug Metabolism And Pharmacokinetics (Dmpk) Market Market Y-o-Y Growth Rate Comparison by Region (2016-2032)
- Table 9: Global Drug Metabolism And Pharmacokinetics (Dmpk) Market Market Y-o-Y Growth Rate Comparison by By Type (2016-2032)
- Table 10: Global Drug Metabolism And Pharmacokinetics (Dmpk) Market Market Y-o-Y Growth Rate Comparison by By Application (2016-2032)
- Table 11: Global Drug Metabolism And Pharmacokinetics (Dmpk) Market Market Share Comparison by Region (2016-2032)
- Table 12: Global Drug Metabolism And Pharmacokinetics (Dmpk) Market Market Share Comparison by By Type (2016-2032)
- Table 13: Global Drug Metabolism And Pharmacokinetics (Dmpk) Market Market Share Comparison by By Application (2016-2032)
- Table 14: North America Drug Metabolism And Pharmacokinetics (Dmpk) Market Market Comparison by By Application (2016-2032)
- Table 15: North America Drug Metabolism And Pharmacokinetics (Dmpk) Market Revenue (US$ Mn) Comparison by Country (2016-2032)
- Table 16: North America Drug Metabolism And Pharmacokinetics (Dmpk) Market Market Revenue (US$ Mn) (2016-2032)
- Table 17: North America Drug Metabolism And Pharmacokinetics (Dmpk) Market Market Revenue (US$ Mn) Comparison by Country (2016-2032)
- Table 18: North America Drug Metabolism And Pharmacokinetics (Dmpk) Market Market Revenue (US$ Mn) Comparison by By Type (2016-2032)
- Table 19: North America Drug Metabolism And Pharmacokinetics (Dmpk) Market Market Revenue (US$ Mn) Comparison by By Application (2016-2032)
- Table 20: North America Drug Metabolism And Pharmacokinetics (Dmpk) Market Market Y-o-Y Growth Rate Comparison by Country (2016-2032)
- Table 21: North America Drug Metabolism And Pharmacokinetics (Dmpk) Market Market Y-o-Y Growth Rate Comparison by By Type (2016-2032)
- Table 22: North America Drug Metabolism And Pharmacokinetics (Dmpk) Market Market Y-o-Y Growth Rate Comparison by By Application (2016-2032)
- Table 23: North America Drug Metabolism And Pharmacokinetics (Dmpk) Market Market Share Comparison by Country (2016-2032)
- Table 24: North America Drug Metabolism And Pharmacokinetics (Dmpk) Market Market Share Comparison by By Type (2016-2032)
- Table 25: North America Drug Metabolism And Pharmacokinetics (Dmpk) Market Market Share Comparison by By Application (2016-2032)
- Table 26: Western Europe Drug Metabolism And Pharmacokinetics (Dmpk) Market Market Comparison by By Type (2016-2032)
- Table 27: Western Europe Drug Metabolism And Pharmacokinetics (Dmpk) Market Market Comparison by By Application (2016-2032)
- Table 28: Western Europe Drug Metabolism And Pharmacokinetics (Dmpk) Market Revenue (US$ Mn) Comparison by Country (2016-2032)
- Table 29: Western Europe Drug Metabolism And Pharmacokinetics (Dmpk) Market Market Revenue (US$ Mn) (2016-2032)
- Table 30: Western Europe Drug Metabolism And Pharmacokinetics (Dmpk) Market Market Revenue (US$ Mn) Comparison by Country (2016-2032)
- Table 31: Western Europe Drug Metabolism And Pharmacokinetics (Dmpk) Market Market Revenue (US$ Mn) Comparison by By Type (2016-2032)
- Table 32: Western Europe Drug Metabolism And Pharmacokinetics (Dmpk) Market Market Revenue (US$ Mn) Comparison by By Application (2016-2032)
- Table 33: Western Europe Drug Metabolism And Pharmacokinetics (Dmpk) Market Market Y-o-Y Growth Rate Comparison by Country (2016-2032)
- Table 34: Western Europe Drug Metabolism And Pharmacokinetics (Dmpk) Market Market Y-o-Y Growth Rate Comparison by By Type (2016-2032)
- Table 35: Western Europe Drug Metabolism And Pharmacokinetics (Dmpk) Market Market Y-o-Y Growth Rate Comparison by By Application (2016-2032)
- Table 36: Western Europe Drug Metabolism And Pharmacokinetics (Dmpk) Market Market Share Comparison by Country (2016-2032)
- Table 37: Western Europe Drug Metabolism And Pharmacokinetics (Dmpk) Market Market Share Comparison by By Type (2016-2032)
- Table 38: Western Europe Drug Metabolism And Pharmacokinetics (Dmpk) Market Market Share Comparison by By Application (2016-2032)
- Table 39: Eastern Europe Drug Metabolism And Pharmacokinetics (Dmpk) Market Market Comparison by By Type (2016-2032)
- Table 40: Eastern Europe Drug Metabolism And Pharmacokinetics (Dmpk) Market Market Comparison by By Application (2016-2032)
- Table 41: Eastern Europe Drug Metabolism And Pharmacokinetics (Dmpk) Market Revenue (US$ Mn) Comparison by Country (2016-2032)
- Table 42: Eastern Europe Drug Metabolism And Pharmacokinetics (Dmpk) Market Market Revenue (US$ Mn) (2016-2032)
- Table 43: Eastern Europe Drug Metabolism And Pharmacokinetics (Dmpk) Market Market Revenue (US$ Mn) Comparison by Country (2016-2032)
- Table 44: Eastern Europe Drug Metabolism And Pharmacokinetics (Dmpk) Market Market Revenue (US$ Mn) Comparison by By Type (2016-2032)
- Table 45: Eastern Europe Drug Metabolism And Pharmacokinetics (Dmpk) Market Market Revenue (US$ Mn) Comparison by By Application (2016-2032)
- Table 46: Eastern Europe Drug Metabolism And Pharmacokinetics (Dmpk) Market Market Y-o-Y Growth Rate Comparison by Country (2016-2032)
- Table 47: Eastern Europe Drug Metabolism And Pharmacokinetics (Dmpk) Market Market Y-o-Y Growth Rate Comparison by By Type (2016-2032)
- Table 48: Eastern Europe Drug Metabolism And Pharmacokinetics (Dmpk) Market Market Y-o-Y Growth Rate Comparison by By Application (2016-2032)
- Table 49: Eastern Europe Drug Metabolism And Pharmacokinetics (Dmpk) Market Market Share Comparison by Country (2016-2032)
- Table 50: Eastern Europe Drug Metabolism And Pharmacokinetics (Dmpk) Market Market Share Comparison by By Type (2016-2032)
- Table 51: Eastern Europe Drug Metabolism And Pharmacokinetics (Dmpk) Market Market Share Comparison by By Application (2016-2032)
- Table 52: APAC Drug Metabolism And Pharmacokinetics (Dmpk) Market Market Comparison by By Type (2016-2032)
- Table 53: APAC Drug Metabolism And Pharmacokinetics (Dmpk) Market Market Comparison by By Application (2016-2032)
- Table 54: APAC Drug Metabolism And Pharmacokinetics (Dmpk) Market Revenue (US$ Mn) Comparison by Country (2016-2032)
- Table 55: APAC Drug Metabolism And Pharmacokinetics (Dmpk) Market Market Revenue (US$ Mn) (2016-2032)
- Table 56: APAC Drug Metabolism And Pharmacokinetics (Dmpk) Market Market Revenue (US$ Mn) Comparison by Country (2016-2032)
- Table 57: APAC Drug Metabolism And Pharmacokinetics (Dmpk) Market Market Revenue (US$ Mn) Comparison by By Type (2016-2032)
- Table 58: APAC Drug Metabolism And Pharmacokinetics (Dmpk) Market Market Revenue (US$ Mn) Comparison by By Application (2016-2032)
- Table 59: APAC Drug Metabolism And Pharmacokinetics (Dmpk) Market Market Y-o-Y Growth Rate Comparison by Country (2016-2032)
- Table 60: APAC Drug Metabolism And Pharmacokinetics (Dmpk) Market Market Y-o-Y Growth Rate Comparison by By Type (2016-2032)
- Table 61: APAC Drug Metabolism And Pharmacokinetics (Dmpk) Market Market Y-o-Y Growth Rate Comparison by By Application (2016-2032)
- Table 62: APAC Drug Metabolism And Pharmacokinetics (Dmpk) Market Market Share Comparison by Country (2016-2032)
- Table 63: APAC Drug Metabolism And Pharmacokinetics (Dmpk) Market Market Share Comparison by By Type (2016-2032)
- Table 64: APAC Drug Metabolism And Pharmacokinetics (Dmpk) Market Market Share Comparison by By Application (2016-2032)
- Table 65: Latin America Drug Metabolism And Pharmacokinetics (Dmpk) Market Market Comparison by By Type (2016-2032)
- Table 66: Latin America Drug Metabolism And Pharmacokinetics (Dmpk) Market Market Comparison by By Application (2016-2032)
- Table 67: Latin America Drug Metabolism And Pharmacokinetics (Dmpk) Market Revenue (US$ Mn) Comparison by Country (2016-2032)
- Table 68: Latin America Drug Metabolism And Pharmacokinetics (Dmpk) Market Market Revenue (US$ Mn) (2016-2032)
- Table 69: Latin America Drug Metabolism And Pharmacokinetics (Dmpk) Market Market Revenue (US$ Mn) Comparison by Country (2016-2032)
- Table 70: Latin America Drug Metabolism And Pharmacokinetics (Dmpk) Market Market Revenue (US$ Mn) Comparison by By Type (2016-2032)
- Table 71: Latin America Drug Metabolism And Pharmacokinetics (Dmpk) Market Market Revenue (US$ Mn) Comparison by By Application (2016-2032)
- Table 72: Latin America Drug Metabolism And Pharmacokinetics (Dmpk) Market Market Y-o-Y Growth Rate Comparison by Country (2016-2032)
- Table 73: Latin America Drug Metabolism And Pharmacokinetics (Dmpk) Market Market Y-o-Y Growth Rate Comparison by By Type (2016-2032)
- Table 74: Latin America Drug Metabolism And Pharmacokinetics (Dmpk) Market Market Y-o-Y Growth Rate Comparison by By Application (2016-2032)
- Table 75: Latin America Drug Metabolism And Pharmacokinetics (Dmpk) Market Market Share Comparison by Country (2016-2032)
- Table 76: Latin America Drug Metabolism And Pharmacokinetics (Dmpk) Market Market Share Comparison by By Type (2016-2032)
- Table 77: Latin America Drug Metabolism And Pharmacokinetics (Dmpk) Market Market Share Comparison by By Application (2016-2032)
- Table 78: Middle East & Africa Drug Metabolism And Pharmacokinetics (Dmpk) Market Market Comparison by By Type (2016-2032)
- Table 79: Middle East & Africa Drug Metabolism And Pharmacokinetics (Dmpk) Market Market Comparison by By Application (2016-2032)
- Table 80: Middle East & Africa Drug Metabolism And Pharmacokinetics (Dmpk) Market Revenue (US$ Mn) Comparison by Country (2016-2032)
- Table 81: Middle East & Africa Drug Metabolism And Pharmacokinetics (Dmpk) Market Market Revenue (US$ Mn) (2016-2032)
- Table 82: Middle East & Africa Drug Metabolism And Pharmacokinetics (Dmpk) Market Market Revenue (US$ Mn) Comparison by Country (2016-2032)
- Table 83: Middle East & Africa Drug Metabolism And Pharmacokinetics (Dmpk) Market Market Revenue (US$ Mn) Comparison by By Type (2016-2032)
- Table 84: Middle East & Africa Drug Metabolism And Pharmacokinetics (Dmpk) Market Market Revenue (US$ Mn) Comparison by By Application (2016-2032)
- Table 85: Middle East & Africa Drug Metabolism And Pharmacokinetics (Dmpk) Market Market Y-o-Y Growth Rate Comparison by Country (2016-2032)
- Table 86: Middle East & Africa Drug Metabolism And Pharmacokinetics (Dmpk) Market Market Y-o-Y Growth Rate Comparison by By Type (2016-2032)
- Table 87: Middle East & Africa Drug Metabolism And Pharmacokinetics (Dmpk) Market Market Y-o-Y Growth Rate Comparison by By Application (2016-2032)
- Table 88: Middle East & Africa Drug Metabolism And Pharmacokinetics (Dmpk) Market Market Share Comparison by Country (2016-2032)
- Table 89: Middle East & Africa Drug Metabolism And Pharmacokinetics (Dmpk) Market Market Share Comparison by By Type (2016-2032)
- Table 90: Middle East & Africa Drug Metabolism And Pharmacokinetics (Dmpk) Market Market Share Comparison by By Application (2016-2032)
- 1. Executive Summary
-
- Eurofins Discovery
- Inotiv, Evotec
- Sai Life Sciences
- Sygnature Discovery
- WuXi AppTec
- Hangzhou Tigermed Consulting Co
- Q2 Solutions
- Jubilant Biosys
- Frontage Laboratories
- Invitrocue
- Creative Biolabs
- CrownBioscience
- Agilent
- H3D
- LABCORP
- Bioduro-Sundia
- Allucent
Our Clients


View Our Licence Options
