Global Dried Fruits Market By Product(Apricots, Dates, Raisins, Figs, Berries, Others), By Distribution Channel(Supermarkets & Hypermarkets, Convenience Stores, Online), By Region And Companies - Industry Segment Outlook, Market Assessment, Competition Scenario, Trends, And Forecast 2024-2033
-
49862
-
July 2024
-
300
-


-
This report was compiled by Shreyas Rokade Shreyas Rokade is a seasoned Research Analyst with CMFE, bringing extensive expertise in market research and consulting, with a strong background in Chemical Engineering. Correspondence Team Lead-CMFE Linkedin | Detailed Market research Methodology Our methodology involves a mix of primary research, including interviews with leading mental health experts, and secondary research from reputable medical journals and databases. View Detailed Methodology Page
-
Quick Navigation
Report Overview
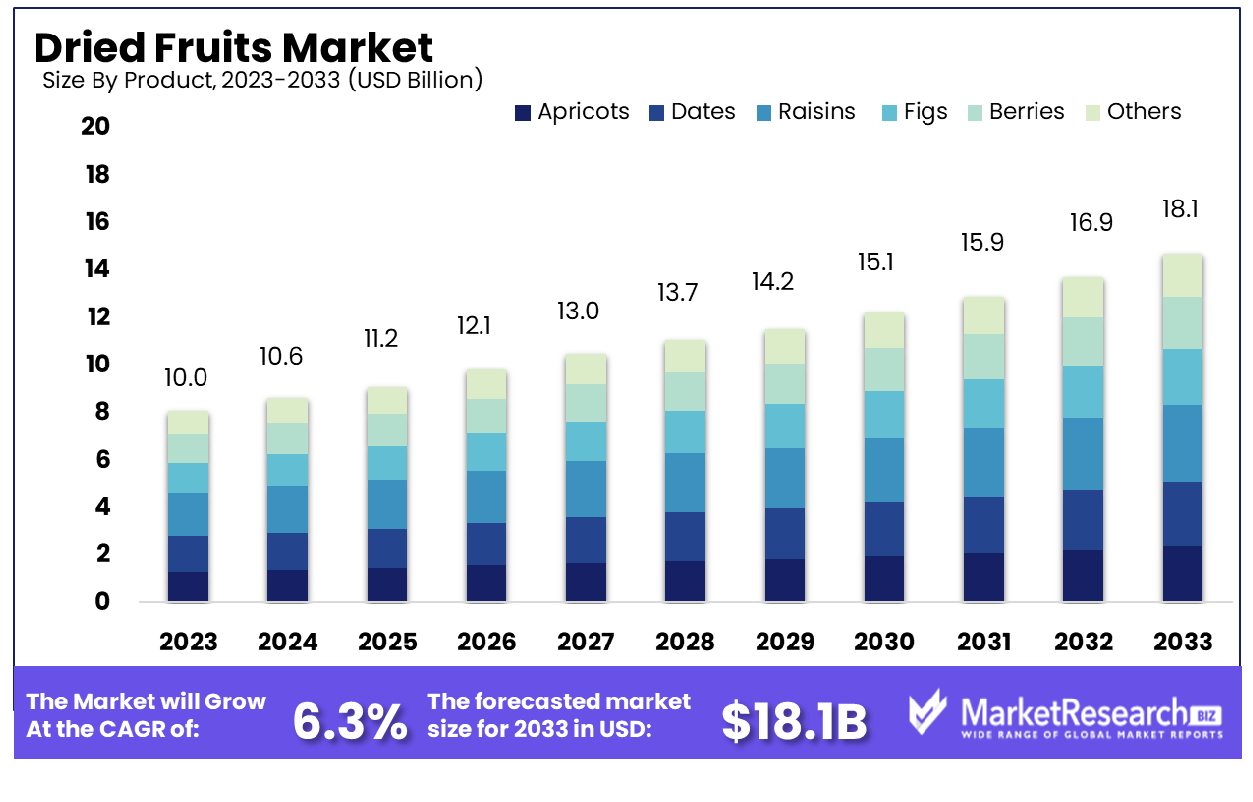
The Global Dried Fruits Market was valued at USD 10.0 billion in 2023. It is expected to reach USD 18.1 billion by 2033, with a CAGR of 6.3% during the forecast period from 2024 to 2033.
The Dried Fruits Market encompasses the global trade and distribution of dehydrated fruits, which have undergone moisture removal processes to extend shelf life and enhance flavor concentration. This market caters to a variety of sectors including retail, culinary, and nutraceuticals, offering products like raisins, dates, apricots, and berries.
The appeal of dried fruits lies in their convenience, nutritional benefits, and diverse applications in dietary supplements, snacks, and culinary ingredients. Strategic market players focus on innovative packaging, organic product offerings, and expanded distribution channels to capitalize on the growing health-conscious consumer base and emerging market economies.
The Dried Fruits Market presents a compelling opportunity within the global food industry, as consumer preferences shift towards healthier and more convenient dietary choices. Analysis indicates that dried fruit consumption correlates positively with improved dietary quality. For instance, data extracted from the National Health and Nutrition Examination Survey (2007-2016) reveal that individuals consuming dried fruits attain a mean Healthy Eating Index score of 60.6, substantially higher than the 52.6 scored by non-consumers. This underscores dried fruits' role in promoting better eating habits.
Furthermore, the consumption of dried fruits, though associated with an incremental daily caloric intake of approximately 208-215 kcal, presents significant health benefits. A pertinent study published in BMC Nutrition & Metabolism highlights a notable finding: a modest increase in dried fruit intake, about 1.3 pieces daily, can reduce the risk of type 2 diabetes by up to 60%. This statistic is particularly relevant for health-conscious consumers and underscores the potential of dried fruits as a strategic component in preventative health diets.
Key Takeaways
- Market Growth: The Global Dried Fruits Market was valued at USD 10.0 billion in 2023. It is expected to reach USD 18.1 billion by 2033, with a CAGR of 6.3% during the forecast period from 2024 to 2033.
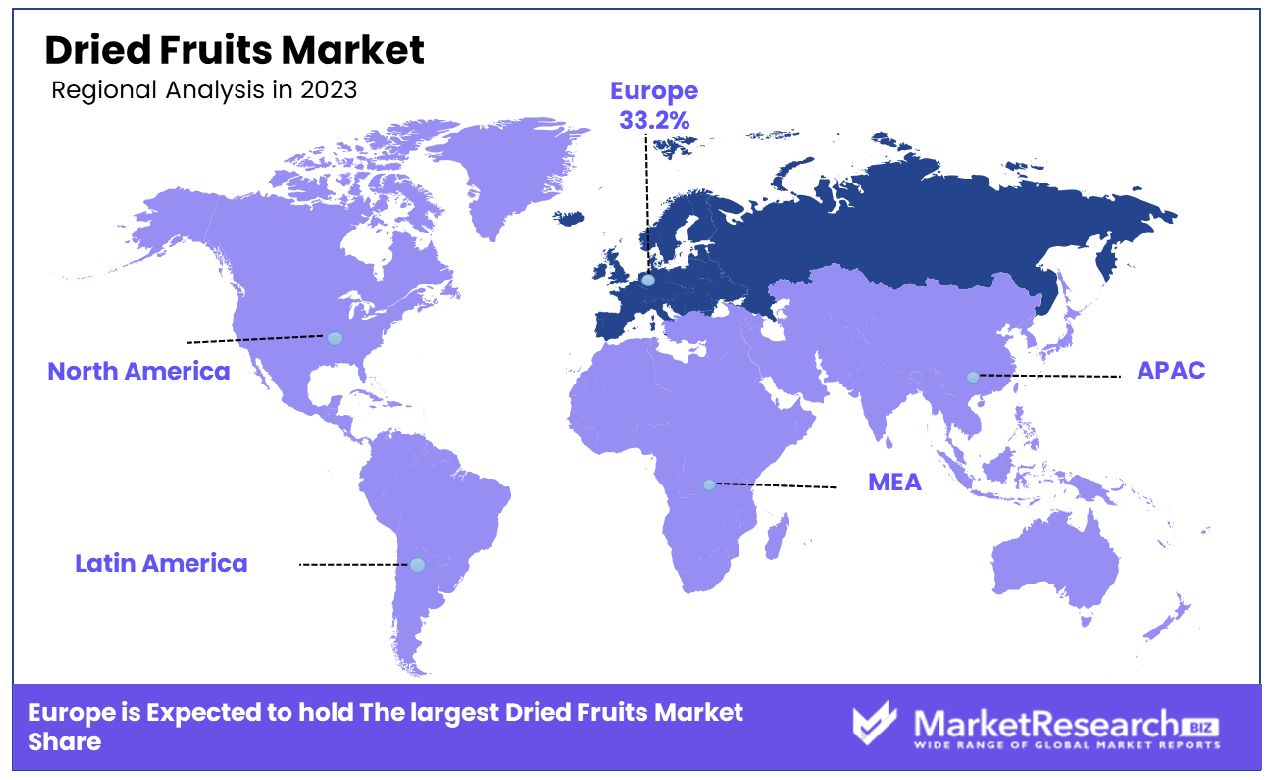
- Regional Dominance: Europe holds a 33.2% share in the global Dried Fruits Market, leading significantly.
- By Product: Raisins dominated the product segment with a 36.3% market share.
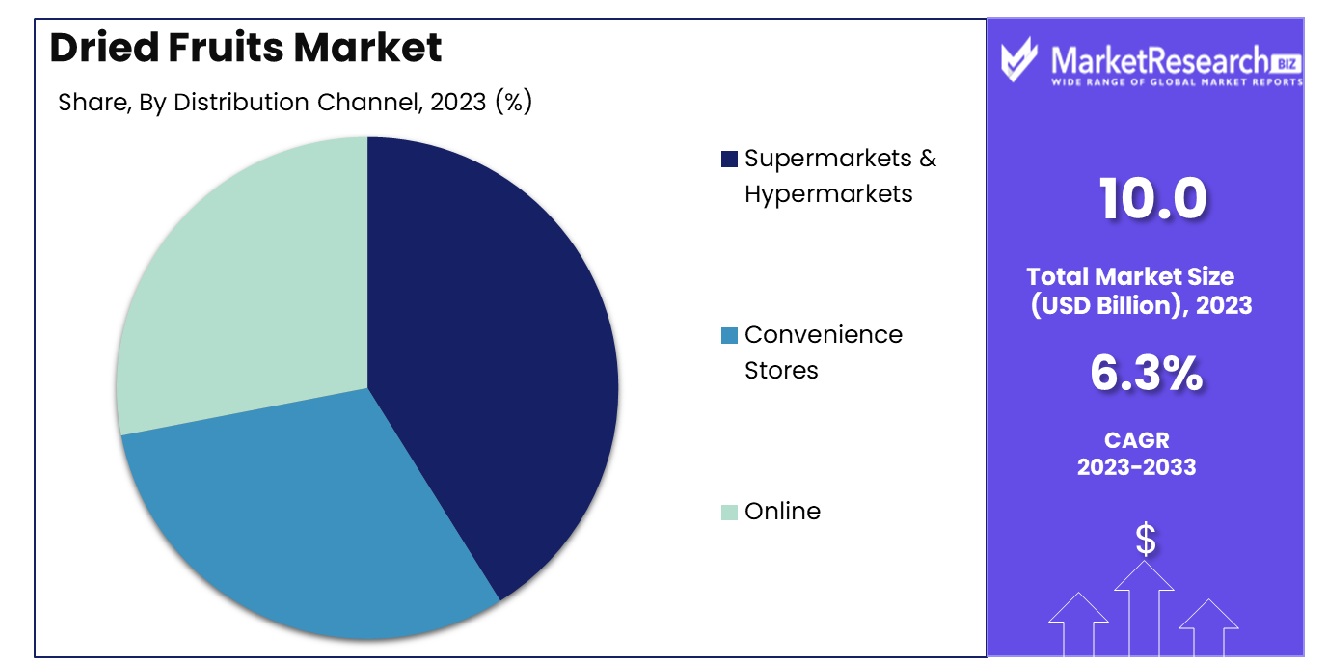
- By Distribution Channel: Supermarkets & hypermarkets led distribution channels, holding 52.3% of sales.
Driving factors
Enhanced Consumer Health Awareness Boosts Demand
The increasing consumer awareness about the health benefits associated with dried fruits is significantly driving market growth. Recent studies, such as those leveraging data from the National Health and Nutrition Examination Survey, reveal that dried fruit consumers typically achieve higher Healthy Eating Index scores compared to non-consumers (60.6 versus 52.6).
This association with improved dietary quality fuels consumer interest and demand, as more individuals seek nutritious food choices that support a healthy lifestyle. Enhanced awareness has positioned dried fruits not only as a standalone snack but also as a desirable component in health-oriented diets, influencing purchase behaviors across diverse demographics.
Snacking Trends Propel Market Expansion
Parallel to the health wave, the expansion of the snack food industry and the rising demand for convenient, yet healthy snack options, are pivotal in driving the dried fruits market. The evolving lifestyle of consumers, marked by busyness and a propensity for on-the-go eating, has elevated the demand for healthy snacks that offer both convenience and nutritional value.
Dried fruits, with their extended shelf life and portability, fit perfectly into this niche. Their natural sweetness and variety also make them an appealing choice for consumers looking to substitute traditional high-calorie snacks with healthier alternatives.
Culinary Applications Enrich Market Versatility
The expanding use of dried fruits in culinary applications further enriches their market appeal. From baking ingredients to components in gourmet dishes, dried fruits are increasingly favored for their ability to enhance flavor profiles with natural sweetness and texture.
Chefs and home cooks alike are integrating dried fruits into a variety of recipes, promoting their usage beyond traditional snacking. This versatility not only opens new market segments but also reinforces the position of dried fruits as a staple in modern, health-conscious kitchens.
Restraining Factors
Health Concerns Over Sugar Content Impede Market Growth
The high sugar content of certain dried fruits poses a significant restraint on the growth of the Dried Fruits Market. While dried fruits are praised for their health benefits, the concentration of natural sugars resulting from the dehydration process can lead to health concerns, particularly for consumers with diabetes or those monitoring calorie intake.
This factor can deter a segment of health-conscious consumers who prioritize low-sugar diets, thus limiting the potential consumer base. To mitigate this, market players may need to innovate in processing techniques that maintain the nutritional benefits of dried fruits while addressing concerns over high sugar levels.
Supply Chain Volatility Affects Market Stability
Fluctuations in the availability and price of fresh fruits for drying also play a crucial role in restraining the Dried Fruits Market. The quality and economic viability of producing dried fruits are directly tied to the supply of fresh fruits, which can be affected by factors such as climatic conditions, agricultural practices, and geopolitical issues. These fluctuations can lead to inconsistent product quality and pricing instability in the dried fruits market, challenging producers to maintain a steady supply chain and pricing strategy.
This volatility not only affects producers but also impacts retailers and consumers, potentially leading to reduced market growth during periods of supply shortage or significant price hikes. Integrating these supply chain challenges with consumer concerns over sugar content presents a complex landscape for market players, requiring strategic planning and adaptation to maintain and grow market share.
By Product Analysis
Raisins lead the Dried Fruits Market by product, holding a dominant share of 36.3%.
In 2023, Raisins held a dominant market position in the by-product segment of the Dried Fruits Market, capturing more than a 36.3% share. This prominence is closely followed by dates, which accounted for approximately 23.7% of the market. Apricots and figs also maintained significant shares, with 14.2% and 12.6% respectively, while berries and other dried fruits collectively accounted for the remaining 13.2%.
The market's affinity for raisins can be attributed to their widespread application in both culinary and commercial food production sectors, where they are prized for their natural sweetness and preservative-free attributes. This has bolstered their consumption globally, especially in regions with a strong tradition of dried fruit consumption such as North America and the Middle East.
Dates continue to see robust growth, driven by an increasing awareness of health benefits associated with their consumption, such as high fiber content and essential nutrients. This has been complemented by rising vegan and health-conscious populations who favor dates as a natural sweetener.
The apricot segment benefits from its versatility in various culinary applications, from baking to snacking, which has sustained its market presence. Meanwhile, the demand for figs has been buoyed by their growing inclusion in exotic and health-related food products, reflecting a broader consumer trend towards foods with perceived health benefits.
Berries, encompassing varieties such as cranberries and blueberries, have carved out a niche in the market through their use in dietary supplements and health foods, tapping into consumer demand for superfoods rich in antioxidants.
By Distribution Channel Analysis
Supermarkets & hypermarkets are the leading distribution channels, commanding a significant 52.3% market share.
In 2023, Supermarkets & Hypermarkets held a dominant market position in the By Distribution Channel segment of the Dried Fruits Market, capturing more than a 52.3% share. Convenience stores accounted for 29.5% of the market, while online sales channels made up the remaining 18.2%.
The substantial market share held by supermarkets and hypermarkets can be largely attributed to their ability to offer a wide variety of dried fruits under one roof, coupled with the benefit of immediate product accessibility. These outlets benefit from high foot traffic and the consumer preference for tactile, see-before-you-buy shopping experiences, which are crucial for food products.
Convenience stores have also capitalized on the growing demand for on-the-go eating options. Their strategic locations, extended hours, and rapid transaction capabilities cater effectively to busy consumers who seek quick and easy snack solutions, thereby driving the segment’s growth.
Meanwhile, the online segment has shown significant growth, driven by the shift in consumer purchasing behaviors towards digital platforms. This channel's expansion is bolstered by the convenience of home deliveries and the availability of diverse product options, often including premium and organic products not available in traditional outlets. Additionally, online platforms offer the advantage of customer reviews and competitive pricing, enhancing their appeal.
Key Market Segments
By Product
- Apricots
- Dates
- Raisins
- Figs
- Berries
- Others
By Distribution Channel
- Supermarkets & Hypermarkets
- Convenience Stores
- Online
Growth Opportunity
Technological Advancements Propel Nutritional and Flavor Enhancements
In 2023, the Dried Fruits Market is set to benefit significantly from innovations in drying technologies that aim to better preserve nutrients and enhance the natural flavors of the fruits. Modern drying techniques, such as freeze-drying and vacuum drying, are increasingly adopted by manufacturers to maintain a higher content of vitamins and antioxidants in dried fruits compared to traditional methods.
These technological advancements not only improve product quality but also appeal to health-conscious consumers who prioritize nutritional value in their snacking choices. By retaining more nutrients and improving taste, these innovations are likely to drive consumer preference and expand market share, positioning dried fruits as both a healthy and flavorful option in the global snack food arena.
Strategic Market Expansion and Targeted Marketing Drive Growth
Furthermore, 2023 presents ample opportunities for market growth through strategic expansions into new geographical markets and targeted marketing campaigns. By focusing on health-conscious consumers, especially in emerging economies where awareness of nutritional food choices is increasing, companies can tap into new consumer segments. Tailored marketing strategies that highlight the health benefits of dried fruits, such as low-fat content and high fiber, alongside their role in preventing various health conditions, can effectively attract a broader audience.
Moreover, leveraging digital marketing and social media platforms to reach these target demographics can enhance consumer engagement and drive sales, particularly among younger populations who value both convenience and health in their dietary choices. These strategic initiatives are crucial for capturing new markets and sustaining long-term growth in the global Dried Fruits Market.
Latest Trends
Organic and Natural Processing Trends Enhance Market Appeal
In 2023, the global Dried Fruits Market is witnessing a significant shift towards the consumption of organic and naturally processed products. This trend is fueled by growing consumer awareness of the health and environmental benefits associated with organic farming and natural processing methods. Organic dried fruits, free from synthetic pesticides and fertilizers, are gaining traction among health-conscious consumers who are increasingly mindful of the ecological footprint of their food choices.
The demand for these products is not only driving premium pricing in the market but also compelling manufacturers to obtain organic certifications and adopt more sustainable agricultural practices. This shift towards organic and natural products is reshaping consumer preferences and is expected to stimulate market growth by aligning with the broader trend of clean eating.
Functional Foods and Dietary Supplements Market Integration
Another prominent trend in 2023 is the incorporation of dried fruits into functional foods and dietary supplements. As consumers increasingly look for food products that offer specific health benefits beyond basic nutrition, dried fruits are being recognized for their potential to enhance health outcomes. Rich in vitamins, minerals, and antioxidants, dried fruits are being integrated into various functional foods aimed at improving digestive health, boosting immune function, and reducing the risk of chronic diseases.
Additionally, the use of dried fruits in dietary supplements is expanding, as they provide a concentrated source of nutrients in a convenient form. This integration not only broadens the application spectrum of dried fruits but also opens new avenues for market expansion, catering to the burgeoning sector of health-oriented food products.
Regional Analysis
Europe holds a commanding 33.2% share of the global Dried Fruits Market, driven by robust consumer health awareness.
In the global landscape of the Dried Fruits Market, regional dynamics display varied growth patterns and consumer preferences that influence market behavior. Europe stands as the dominant region, accounting for 33.2% of the market share. The European market benefits from high consumer awareness about dietary health and a robust demand for organic and naturally processed foods. European consumers' preference for nutritious snack alternatives, coupled with strong regulatory support for food safety and organic farming, drives substantial market growth in this region.
North America also represents a significant portion of the dried fruits market, characterized by a surge in demand for convenient, health-oriented foods. The market here is propelled by the trend towards functional foods and a growing preference for snacks that offer health benefits beyond basic nutrition, such as enhanced immunity and improved digestive health.
In Asia Pacific, the market is expanding rapidly due to increasing urbanization and the rising affluence of the middle class. Consumers in this region are becoming more health-conscious and are incorporating dried fruits into their diets as a source of essential nutrients. The region's vast agricultural sector supports local availability, making dried fruits an affordable and popular choice.
The Middle East & Africa, and Latin America are emerging markets with potential for growth. These regions experience increasing demand driven by rising health awareness and changes in dietary patterns. Local tastes and the traditional use of dried fruits in regional cuisines also play a significant role in expanding the market footprint in these areas.
Key Regions and Countries
North America
- The US
- Canada
- Rest of North America
Europe
- Germany
- France
- The UK
- Spain
- Netherlands
- Russia
- Italy
- Rest of Europe
Asia-Pacific
- China
- Japan
- Singapore
- Thailand
- South Korea
- Vietnam
- India
- New Zealand
- Rest of Asia Pacific
Latin America
- Mexico
- Brazil
- Rest of Latin America
Middle East & Africa
- Saudi Arabia
- South Africa
- UAE
- Rest of Middle East & Africa
Key Players Analysis
In 2023, the landscape of the global Dried Fruits Market is significantly shaped by the strategic movements and innovations of key players. Among them, companies like Kiantama Oy and Paradise Fruits are distinguishing themselves in the European market by focusing on organic and sustainably sourced products, aligning with the region’s stringent quality and environmental standards.
In the United States, industry stalwarts such as National Raisin Company, Traina Foods, and Dole Food Company Inc. continue to lead with their expansive product ranges and robust distribution networks. These companies capitalize on advanced drying technologies that preserve nutritional value and enhance flavor, catering to the health-conscious American consumer. Their commitment to quality and innovation helps them maintain a competitive edge in a crowded market.
Sun-Maid Growers of California, known for their iconic raisins, are leveraging their brand reputation to expand into new varieties and product offerings, thus broadening their market appeal. Similarly, Lion Raisins Inc., Red River Foods Incorporated, and Bergin Fruit and Nut Company Inc. are exploring new market segments by integrating dried fruits into functional foods and dietary supplements, tapping into the growing trend towards health and wellness.
In Australia, Sunbeam Foods Pty Ltd is capitalizing on the Asia-Pacific region’s burgeoning demand for healthy snack options by exporting premium quality dried fruits that meet the high safety and quality standards expected by consumers in this region.
Market Key Players
- Kiantama Oy (Finland)
- National Raisin Company (US)
- Traina Foods (US)
- Red River Foods Incorporated (US)
- Dole Food Company Inc (US)
- Sunbeam Foods Pty Ltd (Australia)
- Lion Raisins Inc (US)
- Sun-Maid Growers of California (US)
- Bergin Fruit and Nut Company Inc. (US)
- Paradise Fruits (Germany)
Recent Development
- In June 2024, Kiantama Oy launched a new product line of organic dried blueberries. This launch aims to cater to the increasing consumer demand for organic and healthy snack options, projecting a 25% increase in their organic product sales by the end of 2025.
- In April 2024, Red River Foods Incorporated secured a $20 million investment in April 2024 to expand their international distribution network. This investment will facilitate the export of their dried fruits to new markets in Europe and Asia, aiming to boost their global market presence by 20% over the next three years.
- In March 2024, Traina Foods introduced a new packaging design that extends the shelf life of its dried fruits by 30%. This innovation is part of their commitment to reducing food waste and providing fresher products to their customers.
Report Scope
Report Features Description Market Value (2023) USD 10.0 Billion Forecast Revenue (2033) USD 18.1 Billion CAGR (2024-2032) 6.3% Base Year for Estimation 2023 Historic Period 2016-2023 Forecast Period 2024-2033 Report Coverage Revenue Forecast, Market Dynamics, COVID-19 Impact, Competitive Landscape, Recent Developments Segments Covered By Product(Apricots, Dates, Raisins, Figs, Berries, Others), By Distribution Channel(Supermarkets & Hypermarkets, Convenience Stores, Online) Regional Analysis North America - The US, Canada, Rest of North America, Europe - Germany, France, The UK, Spain, Italy, Russia, Netherlands, Rest of Europe, Asia-Pacific - China, Japan, South Korea, India, New Zealand, Singapore, Thailand, Vietnam, Rest of Asia Pacific, Latin America - Brazil, Mexico, Rest of Latin America, Middle East & Africa - South Africa, Saudi Arabia, UAE, Rest of Middle East & Africa Competitive Landscape Kiantama Oy (Finland), National Raisin Company (US), Traina Foods (US), Red River Foods Incorporated (US), Dole Food Company Inc (US), Sunbeam Foods Pty Ltd (Australia), Lion Raisins Inc (US), Sun-Maid Growers of California (US), Bergin Fruit and Nut Company Inc. (US), Paradise Fruits (Germany) Customization Scope Customization for segments, region/country-level will be provided. Moreover, additional customization can be done based on the requirements. Purchase Options We have three licenses to opt for Single User License, Multi-User License (Up to 5 Users), Corporate Use License (Unlimited User and Printable PDF) -
- 1. Executive Summary
- 1.1. Definition
- 1.2. Taxonomy
- 1.3. Research Scope
- 1.4. Key Analysis
- 1.5. Key Findings by Major Segments
- 1.6. Top strategies by Major Players
- 2. Global Dried Fruits Market Overview
- 2.1. Dried Fruits Market Dynamics
- 2.1.1. Drivers
- 2.1.2. Opportunities
- 2.1.3. Restraints
- 2.1.4. Challenges
- 2.2. Macro-economic Factors
- 2.3. Regulatory Framework
- 2.4. Market Investment Feasibility Index
- 2.5. PEST Analysis
- 2.6. PORTER’S Five Force Analysis
- 2.7. Drivers & Restraints Impact Analysis
- 2.8. Industry Chain Analysis
- 2.9. Cost Structure Analysis
- 2.10. Marketing Strategy
- 2.11. Russia-Ukraine War Impact Analysis
- 2.12. Opportunity Map Analysis
- 2.13. Market Competition Scenario Analysis
- 2.14. Product Life Cycle Analysis
- 2.15. Opportunity Orbits
- 2.16. Manufacturer Intensity Map
- 2.17. Major Companies sales by Value & Volume
- 2.1. Dried Fruits Market Dynamics
- 3. Global Dried Fruits Market Analysis, Opportunity and Forecast, 2016-2032
- 3.1. Global Dried Fruits Market Analysis, 2016-2021
- 3.2. Global Dried Fruits Market Opportunity and Forecast, 2023-2032
- 3.3. Global Dried Fruits Market Analysis, Opportunity and Forecast, By By Product, 2016-2032
- 3.3.1. Global Dried Fruits Market Analysis by By Product: Introduction
- 3.3.2. Market Size Absolute $ Opportunity Analysis and Forecast, By By Product, 2016-2032
- 3.3.3. Apricots
- 3.3.4. Dates
- 3.3.5. Raisins
- 3.3.6. Figs
- 3.3.7. Berries
- 3.3.8. Others
- 3.4. Global Dried Fruits Market Analysis, Opportunity and Forecast, By By Distribution Channel , 2016-2032
- 3.4.1. Global Dried Fruits Market Analysis by By Distribution Channel : Introduction
- 3.4.2. Market Size Absolute $ Opportunity Analysis and Forecast, By By Distribution Channel , 2016-2032
- 3.4.3. Supermarkets & Hypermarkets
- 3.4.4. Convenience Stores
- 3.4.5. Online
- 4. North America Dried Fruits Market Analysis, Opportunity and Forecast, 2016-2032
- 4.1. North America Dried Fruits Market Analysis, 2016-2021
- 4.2. North America Dried Fruits Market Opportunity and Forecast, 2023-2032
- 4.3. North America Dried Fruits Market Analysis, Opportunity and Forecast, By By Product, 2016-2032
- 4.3.1. North America Dried Fruits Market Analysis by By Product: Introduction
- 4.3.2. Market Size Absolute $ Opportunity Analysis and Forecast, By By Product, 2016-2032
- 4.3.3. Apricots
- 4.3.4. Dates
- 4.3.5. Raisins
- 4.3.6. Figs
- 4.3.7. Berries
- 4.3.8. Others
- 4.4. North America Dried Fruits Market Analysis, Opportunity and Forecast, By By Distribution Channel , 2016-2032
- 4.4.1. North America Dried Fruits Market Analysis by By Distribution Channel : Introduction
- 4.4.2. Market Size Absolute $ Opportunity Analysis and Forecast, By By Distribution Channel , 2016-2032
- 4.4.3. Supermarkets & Hypermarkets
- 4.4.4. Convenience Stores
- 4.4.5. Online
- 4.5. North America Dried Fruits Market Analysis, Opportunity and Forecast, By Country , 2016-2032
- 4.5.1. North America Dried Fruits Market Analysis by Country : Introduction
- 4.5.2. Market Size Absolute $ Opportunity Analysis and Forecast, Country , 2016-2032
- 4.5.2.1. The US
- 4.5.2.2. Canada
- 4.5.2.3. Mexico
- 5. Western Europe Dried Fruits Market Analysis, Opportunity and Forecast, 2016-2032
- 5.1. Western Europe Dried Fruits Market Analysis, 2016-2021
- 5.2. Western Europe Dried Fruits Market Opportunity and Forecast, 2023-2032
- 5.3. Western Europe Dried Fruits Market Analysis, Opportunity and Forecast, By By Product, 2016-2032
- 5.3.1. Western Europe Dried Fruits Market Analysis by By Product: Introduction
- 5.3.2. Market Size Absolute $ Opportunity Analysis and Forecast, By By Product, 2016-2032
- 5.3.3. Apricots
- 5.3.4. Dates
- 5.3.5. Raisins
- 5.3.6. Figs
- 5.3.7. Berries
- 5.3.8. Others
- 5.4. Western Europe Dried Fruits Market Analysis, Opportunity and Forecast, By By Distribution Channel , 2016-2032
- 5.4.1. Western Europe Dried Fruits Market Analysis by By Distribution Channel : Introduction
- 5.4.2. Market Size Absolute $ Opportunity Analysis and Forecast, By By Distribution Channel , 2016-2032
- 5.4.3. Supermarkets & Hypermarkets
- 5.4.4. Convenience Stores
- 5.4.5. Online
- 5.5. Western Europe Dried Fruits Market Analysis, Opportunity and Forecast, By Country , 2016-2032
- 5.5.1. Western Europe Dried Fruits Market Analysis by Country : Introduction
- 5.5.2. Market Size Absolute $ Opportunity Analysis and Forecast, Country , 2016-2032
- 5.5.2.1. Germany
- 5.5.2.2. France
- 5.5.2.3. The UK
- 5.5.2.4. Spain
- 5.5.2.5. Italy
- 5.5.2.6. Portugal
- 5.5.2.7. Ireland
- 5.5.2.8. Austria
- 5.5.2.9. Switzerland
- 5.5.2.10. Benelux
- 5.5.2.11. Nordic
- 5.5.2.12. Rest of Western Europe
- 6. Eastern Europe Dried Fruits Market Analysis, Opportunity and Forecast, 2016-2032
- 6.1. Eastern Europe Dried Fruits Market Analysis, 2016-2021
- 6.2. Eastern Europe Dried Fruits Market Opportunity and Forecast, 2023-2032
- 6.3. Eastern Europe Dried Fruits Market Analysis, Opportunity and Forecast, By By Product, 2016-2032
- 6.3.1. Eastern Europe Dried Fruits Market Analysis by By Product: Introduction
- 6.3.2. Market Size Absolute $ Opportunity Analysis and Forecast, By By Product, 2016-2032
- 6.3.3. Apricots
- 6.3.4. Dates
- 6.3.5. Raisins
- 6.3.6. Figs
- 6.3.7. Berries
- 6.3.8. Others
- 6.4. Eastern Europe Dried Fruits Market Analysis, Opportunity and Forecast, By By Distribution Channel , 2016-2032
- 6.4.1. Eastern Europe Dried Fruits Market Analysis by By Distribution Channel : Introduction
- 6.4.2. Market Size Absolute $ Opportunity Analysis and Forecast, By By Distribution Channel , 2016-2032
- 6.4.3. Supermarkets & Hypermarkets
- 6.4.4. Convenience Stores
- 6.4.5. Online
- 6.5. Eastern Europe Dried Fruits Market Analysis, Opportunity and Forecast, By Country , 2016-2032
- 6.5.1. Eastern Europe Dried Fruits Market Analysis by Country : Introduction
- 6.5.2. Market Size Absolute $ Opportunity Analysis and Forecast, Country , 2016-2032
- 6.5.2.1. Russia
- 6.5.2.2. Poland
- 6.5.2.3. The Czech Republic
- 6.5.2.4. Greece
- 6.5.2.5. Rest of Eastern Europe
- 7. APAC Dried Fruits Market Analysis, Opportunity and Forecast, 2016-2032
- 7.1. APAC Dried Fruits Market Analysis, 2016-2021
- 7.2. APAC Dried Fruits Market Opportunity and Forecast, 2023-2032
- 7.3. APAC Dried Fruits Market Analysis, Opportunity and Forecast, By By Product, 2016-2032
- 7.3.1. APAC Dried Fruits Market Analysis by By Product: Introduction
- 7.3.2. Market Size Absolute $ Opportunity Analysis and Forecast, By By Product, 2016-2032
- 7.3.3. Apricots
- 7.3.4. Dates
- 7.3.5. Raisins
- 7.3.6. Figs
- 7.3.7. Berries
- 7.3.8. Others
- 7.4. APAC Dried Fruits Market Analysis, Opportunity and Forecast, By By Distribution Channel , 2016-2032
- 7.4.1. APAC Dried Fruits Market Analysis by By Distribution Channel : Introduction
- 7.4.2. Market Size Absolute $ Opportunity Analysis and Forecast, By By Distribution Channel , 2016-2032
- 7.4.3. Supermarkets & Hypermarkets
- 7.4.4. Convenience Stores
- 7.4.5. Online
- 7.5. APAC Dried Fruits Market Analysis, Opportunity and Forecast, By Country , 2016-2032
- 7.5.1. APAC Dried Fruits Market Analysis by Country : Introduction
- 7.5.2. Market Size Absolute $ Opportunity Analysis and Forecast, Country , 2016-2032
- 7.5.2.1. China
- 7.5.2.2. Japan
- 7.5.2.3. South Korea
- 7.5.2.4. India
- 7.5.2.5. Australia & New Zeland
- 7.5.2.6. Indonesia
- 7.5.2.7. Malaysia
- 7.5.2.8. Philippines
- 7.5.2.9. Singapore
- 7.5.2.10. Thailand
- 7.5.2.11. Vietnam
- 7.5.2.12. Rest of APAC
- 8. Latin America Dried Fruits Market Analysis, Opportunity and Forecast, 2016-2032
- 8.1. Latin America Dried Fruits Market Analysis, 2016-2021
- 8.2. Latin America Dried Fruits Market Opportunity and Forecast, 2023-2032
- 8.3. Latin America Dried Fruits Market Analysis, Opportunity and Forecast, By By Product, 2016-2032
- 8.3.1. Latin America Dried Fruits Market Analysis by By Product: Introduction
- 8.3.2. Market Size Absolute $ Opportunity Analysis and Forecast, By By Product, 2016-2032
- 8.3.3. Apricots
- 8.3.4. Dates
- 8.3.5. Raisins
- 8.3.6. Figs
- 8.3.7. Berries
- 8.3.8. Others
- 8.4. Latin America Dried Fruits Market Analysis, Opportunity and Forecast, By By Distribution Channel , 2016-2032
- 8.4.1. Latin America Dried Fruits Market Analysis by By Distribution Channel : Introduction
- 8.4.2. Market Size Absolute $ Opportunity Analysis and Forecast, By By Distribution Channel , 2016-2032
- 8.4.3. Supermarkets & Hypermarkets
- 8.4.4. Convenience Stores
- 8.4.5. Online
- 8.5. Latin America Dried Fruits Market Analysis, Opportunity and Forecast, By Country , 2016-2032
- 8.5.1. Latin America Dried Fruits Market Analysis by Country : Introduction
- 8.5.2. Market Size Absolute $ Opportunity Analysis and Forecast, Country , 2016-2032
- 8.5.2.1. Brazil
- 8.5.2.2. Colombia
- 8.5.2.3. Chile
- 8.5.2.4. Argentina
- 8.5.2.5. Costa Rica
- 8.5.2.6. Rest of Latin America
- 9. Middle East & Africa Dried Fruits Market Analysis, Opportunity and Forecast, 2016-2032
- 9.1. Middle East & Africa Dried Fruits Market Analysis, 2016-2021
- 9.2. Middle East & Africa Dried Fruits Market Opportunity and Forecast, 2023-2032
- 9.3. Middle East & Africa Dried Fruits Market Analysis, Opportunity and Forecast, By By Product, 2016-2032
- 9.3.1. Middle East & Africa Dried Fruits Market Analysis by By Product: Introduction
- 9.3.2. Market Size Absolute $ Opportunity Analysis and Forecast, By By Product, 2016-2032
- 9.3.3. Apricots
- 9.3.4. Dates
- 9.3.5. Raisins
- 9.3.6. Figs
- 9.3.7. Berries
- 9.3.8. Others
- 9.4. Middle East & Africa Dried Fruits Market Analysis, Opportunity and Forecast, By By Distribution Channel , 2016-2032
- 9.4.1. Middle East & Africa Dried Fruits Market Analysis by By Distribution Channel : Introduction
- 9.4.2. Market Size Absolute $ Opportunity Analysis and Forecast, By By Distribution Channel , 2016-2032
- 9.4.3. Supermarkets & Hypermarkets
- 9.4.4. Convenience Stores
- 9.4.5. Online
- 9.5. Middle East & Africa Dried Fruits Market Analysis, Opportunity and Forecast, By Country , 2016-2032
- 9.5.1. Middle East & Africa Dried Fruits Market Analysis by Country : Introduction
- 9.5.2. Market Size Absolute $ Opportunity Analysis and Forecast, Country , 2016-2032
- 9.5.2.1. Algeria
- 9.5.2.2. Egypt
- 9.5.2.3. Israel
- 9.5.2.4. Kuwait
- 9.5.2.5. Nigeria
- 9.5.2.6. Saudi Arabia
- 9.5.2.7. South Africa
- 9.5.2.8. Turkey
- 9.5.2.9. The UAE
- 9.5.2.10. Rest of MEA
- 10. Global Dried Fruits Market Analysis, Opportunity and Forecast, By Region , 2016-2032
- 10.1. Global Dried Fruits Market Analysis by Region : Introduction
- 10.2. Market Size Absolute $ Opportunity Analysis and Forecast, By Region , 2016-2032
- 10.2.1. North America
- 10.2.2. Western Europe
- 10.2.3. Eastern Europe
- 10.2.4. APAC
- 10.2.5. Latin America
- 10.2.6. Middle East & Africa
- 11. Global Dried Fruits Market Competitive Landscape, Market Share Analysis, and Company Profiles
- 11.1. Market Share Analysis
- 11.2. Company Profiles
- 11.3. Kiantama Oy (Finland)
- 11.3.1. Company Overview
- 11.3.2. Financial Highlights
- 11.3.3. Product Portfolio
- 11.3.4. SWOT Analysis
- 11.3.5. Key Strategies and Developments
- 11.4. National Raisin Company (US)
- 11.4.1. Company Overview
- 11.4.2. Financial Highlights
- 11.4.3. Product Portfolio
- 11.4.4. SWOT Analysis
- 11.4.5. Key Strategies and Developments
- 11.5. Traina Foods (US)
- 11.5.1. Company Overview
- 11.5.2. Financial Highlights
- 11.5.3. Product Portfolio
- 11.5.4. SWOT Analysis
- 11.5.5. Key Strategies and Developments
- 11.6. Red River Foods Incorporated (US)
- 11.6.1. Company Overview
- 11.6.2. Financial Highlights
- 11.6.3. Product Portfolio
- 11.6.4. SWOT Analysis
- 11.6.5. Key Strategies and Developments
- 11.7. Dole Food Company Inc (US)
- 11.7.1. Company Overview
- 11.7.2. Financial Highlights
- 11.7.3. Product Portfolio
- 11.7.4. SWOT Analysis
- 11.7.5. Key Strategies and Developments
- 11.8. Sunbeam Foods Pty Ltd (Australia)
- 11.8.1. Company Overview
- 11.8.2. Financial Highlights
- 11.8.3. Product Portfolio
- 11.8.4. SWOT Analysis
- 11.8.5. Key Strategies and Developments
- 11.9. Lion Raisins Inc (US)
- 11.9.1. Company Overview
- 11.9.2. Financial Highlights
- 11.9.3. Product Portfolio
- 11.9.4. SWOT Analysis
- 11.9.5. Key Strategies and Developments
- 11.10. Sun-Maid Growers of California (US)
- 11.10.1. Company Overview
- 11.10.2. Financial Highlights
- 11.10.3. Product Portfolio
- 11.10.4. SWOT Analysis
- 11.10.5. Key Strategies and Developments
- 11.11. Bergin Fruit and Nut Company Inc. (US)
- 11.11.1. Company Overview
- 11.11.2. Financial Highlights
- 11.11.3. Product Portfolio
- 11.11.4. SWOT Analysis
- 11.11.5. Key Strategies and Developments
- 11.12. Paradise Fruits (Germany)
- 11.12.1. Company Overview
- 11.12.2. Financial Highlights
- 11.12.3. Product Portfolio
- 11.12.4. SWOT Analysis
- 11.12.5. Key Strategies and Developments
- 11.13.1. Company Overview
- 11.13.2. Financial Highlights
- 11.13.3. Product Portfolio
- 11.13.4. SWOT Analysis
- 11.13.5. Key Strategies and Developments
- 12. Assumptions and Acronyms
- 13. Research Methodology
- 14. Contact
"
- List of Figures
- "
- Figure 1: Global Dried Fruits Market Revenue (US$ Mn) Market Share by By Product in 2022
- Figure 2: Global Dried Fruits Market Market Attractiveness Analysis by By Product, 2016-2032
- Figure 3: Global Dried Fruits Market Revenue (US$ Mn) Market Share by By Distribution Channel in 2022
- Figure 4: Global Dried Fruits Market Market Attractiveness Analysis by By Distribution Channel , 2016-2032
- Figure 5: Global Dried Fruits Market Revenue (US$ Mn) Market Share by Region in 2022
- Figure 6: Global Dried Fruits Market Market Attractiveness Analysis by Region, 2016-2032
- Figure 7: Global Dried Fruits Market Market Revenue (US$ Mn) (2016-2032)
- Figure 8: Global Dried Fruits Market Market Revenue (US$ Mn) Comparison by Region (2016-2032)
- Figure 9: Global Dried Fruits Market Market Revenue (US$ Mn) Comparison by By Product (2016-2032)
- Figure 10: Global Dried Fruits Market Market Revenue (US$ Mn) Comparison by By Distribution Channel (2016-2032)
- Figure 11: Global Dried Fruits Market Market Y-o-Y Growth Rate Comparison by Region (2016-2032)
- Figure 12: Global Dried Fruits Market Market Y-o-Y Growth Rate Comparison by By Product (2016-2032)
- Figure 13: Global Dried Fruits Market Market Y-o-Y Growth Rate Comparison by By Distribution Channel (2016-2032)
- Figure 14: Global Dried Fruits Market Market Share Comparison by Region (2016-2032)
- Figure 15: Global Dried Fruits Market Market Share Comparison by By Product (2016-2032)
- Figure 16: Global Dried Fruits Market Market Share Comparison by By Distribution Channel (2016-2032)
- Figure 17: North America Dried Fruits Market Revenue (US$ Mn) Market Share by By Productin 2022
- Figure 18: North America Dried Fruits Market Market Attractiveness Analysis by By Product, 2016-2032
- Figure 19: North America Dried Fruits Market Revenue (US$ Mn) Market Share by By Distribution Channel in 2022
- Figure 20: North America Dried Fruits Market Market Attractiveness Analysis by By Distribution Channel , 2016-2032
- Figure 21: North America Dried Fruits Market Revenue (US$ Mn) Market Share by Country in 2022
- Figure 22: North America Dried Fruits Market Market Attractiveness Analysis by Country, 2016-2032
- Figure 23: North America Dried Fruits Market Market Revenue (US$ Mn) (2016-2032)
- Figure 24: North America Dried Fruits Market Market Revenue (US$ Mn) Comparison by Country (2016-2032)
- Figure 25: North America Dried Fruits Market Market Revenue (US$ Mn) Comparison by By Product (2016-2032)
- Figure 26: North America Dried Fruits Market Market Revenue (US$ Mn) Comparison by By Distribution Channel (2016-2032)
- Figure 27: North America Dried Fruits Market Market Y-o-Y Growth Rate Comparison by Country (2016-2032)
- Figure 28: North America Dried Fruits Market Market Y-o-Y Growth Rate Comparison by By Product (2016-2032)
- Figure 29: North America Dried Fruits Market Market Y-o-Y Growth Rate Comparison by By Distribution Channel (2016-2032)
- Figure 30: North America Dried Fruits Market Market Share Comparison by Country (2016-2032)
- Figure 31: North America Dried Fruits Market Market Share Comparison by By Product (2016-2032)
- Figure 32: North America Dried Fruits Market Market Share Comparison by By Distribution Channel (2016-2032)
- Figure 33: Western Europe Dried Fruits Market Revenue (US$ Mn) Market Share by By Productin 2022
- Figure 34: Western Europe Dried Fruits Market Market Attractiveness Analysis by By Product, 2016-2032
- Figure 35: Western Europe Dried Fruits Market Revenue (US$ Mn) Market Share by By Distribution Channel in 2022
- Figure 36: Western Europe Dried Fruits Market Market Attractiveness Analysis by By Distribution Channel , 2016-2032
- Figure 37: Western Europe Dried Fruits Market Revenue (US$ Mn) Market Share by Country in 2022
- Figure 38: Western Europe Dried Fruits Market Market Attractiveness Analysis by Country, 2016-2032
- Figure 39: Western Europe Dried Fruits Market Market Revenue (US$ Mn) (2016-2032)
- Figure 40: Western Europe Dried Fruits Market Market Revenue (US$ Mn) Comparison by Country (2016-2032)
- Figure 41: Western Europe Dried Fruits Market Market Revenue (US$ Mn) Comparison by By Product (2016-2032)
- Figure 42: Western Europe Dried Fruits Market Market Revenue (US$ Mn) Comparison by By Distribution Channel (2016-2032)
- Figure 43: Western Europe Dried Fruits Market Market Y-o-Y Growth Rate Comparison by Country (2016-2032)
- Figure 44: Western Europe Dried Fruits Market Market Y-o-Y Growth Rate Comparison by By Product (2016-2032)
- Figure 45: Western Europe Dried Fruits Market Market Y-o-Y Growth Rate Comparison by By Distribution Channel (2016-2032)
- Figure 46: Western Europe Dried Fruits Market Market Share Comparison by Country (2016-2032)
- Figure 47: Western Europe Dried Fruits Market Market Share Comparison by By Product (2016-2032)
- Figure 48: Western Europe Dried Fruits Market Market Share Comparison by By Distribution Channel (2016-2032)
- Figure 49: Eastern Europe Dried Fruits Market Revenue (US$ Mn) Market Share by By Productin 2022
- Figure 50: Eastern Europe Dried Fruits Market Market Attractiveness Analysis by By Product, 2016-2032
- Figure 51: Eastern Europe Dried Fruits Market Revenue (US$ Mn) Market Share by By Distribution Channel in 2022
- Figure 52: Eastern Europe Dried Fruits Market Market Attractiveness Analysis by By Distribution Channel , 2016-2032
- Figure 53: Eastern Europe Dried Fruits Market Revenue (US$ Mn) Market Share by Country in 2022
- Figure 54: Eastern Europe Dried Fruits Market Market Attractiveness Analysis by Country, 2016-2032
- Figure 55: Eastern Europe Dried Fruits Market Market Revenue (US$ Mn) (2016-2032)
- Figure 56: Eastern Europe Dried Fruits Market Market Revenue (US$ Mn) Comparison by Country (2016-2032)
- Figure 57: Eastern Europe Dried Fruits Market Market Revenue (US$ Mn) Comparison by By Product (2016-2032)
- Figure 58: Eastern Europe Dried Fruits Market Market Revenue (US$ Mn) Comparison by By Distribution Channel (2016-2032)
- Figure 59: Eastern Europe Dried Fruits Market Market Y-o-Y Growth Rate Comparison by Country (2016-2032)
- Figure 60: Eastern Europe Dried Fruits Market Market Y-o-Y Growth Rate Comparison by By Product (2016-2032)
- Figure 61: Eastern Europe Dried Fruits Market Market Y-o-Y Growth Rate Comparison by By Distribution Channel (2016-2032)
- Figure 62: Eastern Europe Dried Fruits Market Market Share Comparison by Country (2016-2032)
- Figure 63: Eastern Europe Dried Fruits Market Market Share Comparison by By Product (2016-2032)
- Figure 64: Eastern Europe Dried Fruits Market Market Share Comparison by By Distribution Channel (2016-2032)
- Figure 65: APAC Dried Fruits Market Revenue (US$ Mn) Market Share by By Productin 2022
- Figure 66: APAC Dried Fruits Market Market Attractiveness Analysis by By Product, 2016-2032
- Figure 67: APAC Dried Fruits Market Revenue (US$ Mn) Market Share by By Distribution Channel in 2022
- Figure 68: APAC Dried Fruits Market Market Attractiveness Analysis by By Distribution Channel , 2016-2032
- Figure 69: APAC Dried Fruits Market Revenue (US$ Mn) Market Share by Country in 2022
- Figure 70: APAC Dried Fruits Market Market Attractiveness Analysis by Country, 2016-2032
- Figure 71: APAC Dried Fruits Market Market Revenue (US$ Mn) (2016-2032)
- Figure 72: APAC Dried Fruits Market Market Revenue (US$ Mn) Comparison by Country (2016-2032)
- Figure 73: APAC Dried Fruits Market Market Revenue (US$ Mn) Comparison by By Product (2016-2032)
- Figure 74: APAC Dried Fruits Market Market Revenue (US$ Mn) Comparison by By Distribution Channel (2016-2032)
- Figure 75: APAC Dried Fruits Market Market Y-o-Y Growth Rate Comparison by Country (2016-2032)
- Figure 76: APAC Dried Fruits Market Market Y-o-Y Growth Rate Comparison by By Product (2016-2032)
- Figure 77: APAC Dried Fruits Market Market Y-o-Y Growth Rate Comparison by By Distribution Channel (2016-2032)
- Figure 78: APAC Dried Fruits Market Market Share Comparison by Country (2016-2032)
- Figure 79: APAC Dried Fruits Market Market Share Comparison by By Product (2016-2032)
- Figure 80: APAC Dried Fruits Market Market Share Comparison by By Distribution Channel (2016-2032)
- Figure 81: Latin America Dried Fruits Market Revenue (US$ Mn) Market Share by By Productin 2022
- Figure 82: Latin America Dried Fruits Market Market Attractiveness Analysis by By Product, 2016-2032
- Figure 83: Latin America Dried Fruits Market Revenue (US$ Mn) Market Share by By Distribution Channel in 2022
- Figure 84: Latin America Dried Fruits Market Market Attractiveness Analysis by By Distribution Channel , 2016-2032
- Figure 85: Latin America Dried Fruits Market Revenue (US$ Mn) Market Share by Country in 2022
- Figure 86: Latin America Dried Fruits Market Market Attractiveness Analysis by Country, 2016-2032
- Figure 87: Latin America Dried Fruits Market Market Revenue (US$ Mn) (2016-2032)
- Figure 88: Latin America Dried Fruits Market Market Revenue (US$ Mn) Comparison by Country (2016-2032)
- Figure 89: Latin America Dried Fruits Market Market Revenue (US$ Mn) Comparison by By Product (2016-2032)
- Figure 90: Latin America Dried Fruits Market Market Revenue (US$ Mn) Comparison by By Distribution Channel (2016-2032)
- Figure 91: Latin America Dried Fruits Market Market Y-o-Y Growth Rate Comparison by Country (2016-2032)
- Figure 92: Latin America Dried Fruits Market Market Y-o-Y Growth Rate Comparison by By Product (2016-2032)
- Figure 93: Latin America Dried Fruits Market Market Y-o-Y Growth Rate Comparison by By Distribution Channel (2016-2032)
- Figure 94: Latin America Dried Fruits Market Market Share Comparison by Country (2016-2032)
- Figure 95: Latin America Dried Fruits Market Market Share Comparison by By Product (2016-2032)
- Figure 96: Latin America Dried Fruits Market Market Share Comparison by By Distribution Channel (2016-2032)
- Figure 97: Middle East & Africa Dried Fruits Market Revenue (US$ Mn) Market Share by By Productin 2022
- Figure 98: Middle East & Africa Dried Fruits Market Market Attractiveness Analysis by By Product, 2016-2032
- Figure 99: Middle East & Africa Dried Fruits Market Revenue (US$ Mn) Market Share by By Distribution Channel in 2022
- Figure 100: Middle East & Africa Dried Fruits Market Market Attractiveness Analysis by By Distribution Channel , 2016-2032
- Figure 101: Middle East & Africa Dried Fruits Market Revenue (US$ Mn) Market Share by Country in 2022
- Figure 102: Middle East & Africa Dried Fruits Market Market Attractiveness Analysis by Country, 2016-2032
- Figure 103: Middle East & Africa Dried Fruits Market Market Revenue (US$ Mn) (2016-2032)
- Figure 104: Middle East & Africa Dried Fruits Market Market Revenue (US$ Mn) Comparison by Country (2016-2032)
- Figure 105: Middle East & Africa Dried Fruits Market Market Revenue (US$ Mn) Comparison by By Product (2016-2032)
- Figure 106: Middle East & Africa Dried Fruits Market Market Revenue (US$ Mn) Comparison by By Distribution Channel (2016-2032)
- Figure 107: Middle East & Africa Dried Fruits Market Market Y-o-Y Growth Rate Comparison by Country (2016-2032)
- Figure 108: Middle East & Africa Dried Fruits Market Market Y-o-Y Growth Rate Comparison by By Product (2016-2032)
- Figure 109: Middle East & Africa Dried Fruits Market Market Y-o-Y Growth Rate Comparison by By Distribution Channel (2016-2032)
- Figure 110: Middle East & Africa Dried Fruits Market Market Share Comparison by Country (2016-2032)
- Figure 111: Middle East & Africa Dried Fruits Market Market Share Comparison by By Product (2016-2032)
- Figure 112: Middle East & Africa Dried Fruits Market Market Share Comparison by By Distribution Channel (2016-2032)
"
- List of Tables
- "
- Table 1: Global Dried Fruits Market Market Comparison by By Product (2016-2032)
- Table 2: Global Dried Fruits Market Market Comparison by By Distribution Channel (2016-2032)
- Table 3: Global Dried Fruits Market Revenue (US$ Mn) Comparison by Region (2016-2032)
- Table 4: Global Dried Fruits Market Market Revenue (US$ Mn) (2016-2032)
- Table 5: Global Dried Fruits Market Market Revenue (US$ Mn) Comparison by Region (2016-2032)
- Table 6: Global Dried Fruits Market Market Revenue (US$ Mn) Comparison by By Product (2016-2032)
- Table 7: Global Dried Fruits Market Market Revenue (US$ Mn) Comparison by By Distribution Channel (2016-2032)
- Table 8: Global Dried Fruits Market Market Y-o-Y Growth Rate Comparison by Region (2016-2032)
- Table 9: Global Dried Fruits Market Market Y-o-Y Growth Rate Comparison by By Product (2016-2032)
- Table 10: Global Dried Fruits Market Market Y-o-Y Growth Rate Comparison by By Distribution Channel (2016-2032)
- Table 11: Global Dried Fruits Market Market Share Comparison by Region (2016-2032)
- Table 12: Global Dried Fruits Market Market Share Comparison by By Product (2016-2032)
- Table 13: Global Dried Fruits Market Market Share Comparison by By Distribution Channel (2016-2032)
- Table 14: North America Dried Fruits Market Market Comparison by By Distribution Channel (2016-2032)
- Table 15: North America Dried Fruits Market Revenue (US$ Mn) Comparison by Country (2016-2032)
- Table 16: North America Dried Fruits Market Market Revenue (US$ Mn) (2016-2032)
- Table 17: North America Dried Fruits Market Market Revenue (US$ Mn) Comparison by Country (2016-2032)
- Table 18: North America Dried Fruits Market Market Revenue (US$ Mn) Comparison by By Product (2016-2032)
- Table 19: North America Dried Fruits Market Market Revenue (US$ Mn) Comparison by By Distribution Channel (2016-2032)
- Table 20: North America Dried Fruits Market Market Y-o-Y Growth Rate Comparison by Country (2016-2032)
- Table 21: North America Dried Fruits Market Market Y-o-Y Growth Rate Comparison by By Product (2016-2032)
- Table 22: North America Dried Fruits Market Market Y-o-Y Growth Rate Comparison by By Distribution Channel (2016-2032)
- Table 23: North America Dried Fruits Market Market Share Comparison by Country (2016-2032)
- Table 24: North America Dried Fruits Market Market Share Comparison by By Product (2016-2032)
- Table 25: North America Dried Fruits Market Market Share Comparison by By Distribution Channel (2016-2032)
- Table 26: Western Europe Dried Fruits Market Market Comparison by By Product (2016-2032)
- Table 27: Western Europe Dried Fruits Market Market Comparison by By Distribution Channel (2016-2032)
- Table 28: Western Europe Dried Fruits Market Revenue (US$ Mn) Comparison by Country (2016-2032)
- Table 29: Western Europe Dried Fruits Market Market Revenue (US$ Mn) (2016-2032)
- Table 30: Western Europe Dried Fruits Market Market Revenue (US$ Mn) Comparison by Country (2016-2032)
- Table 31: Western Europe Dried Fruits Market Market Revenue (US$ Mn) Comparison by By Product (2016-2032)
- Table 32: Western Europe Dried Fruits Market Market Revenue (US$ Mn) Comparison by By Distribution Channel (2016-2032)
- Table 33: Western Europe Dried Fruits Market Market Y-o-Y Growth Rate Comparison by Country (2016-2032)
- Table 34: Western Europe Dried Fruits Market Market Y-o-Y Growth Rate Comparison by By Product (2016-2032)
- Table 35: Western Europe Dried Fruits Market Market Y-o-Y Growth Rate Comparison by By Distribution Channel (2016-2032)
- Table 36: Western Europe Dried Fruits Market Market Share Comparison by Country (2016-2032)
- Table 37: Western Europe Dried Fruits Market Market Share Comparison by By Product (2016-2032)
- Table 38: Western Europe Dried Fruits Market Market Share Comparison by By Distribution Channel (2016-2032)
- Table 39: Eastern Europe Dried Fruits Market Market Comparison by By Product (2016-2032)
- Table 40: Eastern Europe Dried Fruits Market Market Comparison by By Distribution Channel (2016-2032)
- Table 41: Eastern Europe Dried Fruits Market Revenue (US$ Mn) Comparison by Country (2016-2032)
- Table 42: Eastern Europe Dried Fruits Market Market Revenue (US$ Mn) (2016-2032)
- Table 43: Eastern Europe Dried Fruits Market Market Revenue (US$ Mn) Comparison by Country (2016-2032)
- Table 44: Eastern Europe Dried Fruits Market Market Revenue (US$ Mn) Comparison by By Product (2016-2032)
- Table 45: Eastern Europe Dried Fruits Market Market Revenue (US$ Mn) Comparison by By Distribution Channel (2016-2032)
- Table 46: Eastern Europe Dried Fruits Market Market Y-o-Y Growth Rate Comparison by Country (2016-2032)
- Table 47: Eastern Europe Dried Fruits Market Market Y-o-Y Growth Rate Comparison by By Product (2016-2032)
- Table 48: Eastern Europe Dried Fruits Market Market Y-o-Y Growth Rate Comparison by By Distribution Channel (2016-2032)
- Table 49: Eastern Europe Dried Fruits Market Market Share Comparison by Country (2016-2032)
- Table 50: Eastern Europe Dried Fruits Market Market Share Comparison by By Product (2016-2032)
- Table 51: Eastern Europe Dried Fruits Market Market Share Comparison by By Distribution Channel (2016-2032)
- Table 52: APAC Dried Fruits Market Market Comparison by By Product (2016-2032)
- Table 53: APAC Dried Fruits Market Market Comparison by By Distribution Channel (2016-2032)
- Table 54: APAC Dried Fruits Market Revenue (US$ Mn) Comparison by Country (2016-2032)
- Table 55: APAC Dried Fruits Market Market Revenue (US$ Mn) (2016-2032)
- Table 56: APAC Dried Fruits Market Market Revenue (US$ Mn) Comparison by Country (2016-2032)
- Table 57: APAC Dried Fruits Market Market Revenue (US$ Mn) Comparison by By Product (2016-2032)
- Table 58: APAC Dried Fruits Market Market Revenue (US$ Mn) Comparison by By Distribution Channel (2016-2032)
- Table 59: APAC Dried Fruits Market Market Y-o-Y Growth Rate Comparison by Country (2016-2032)
- Table 60: APAC Dried Fruits Market Market Y-o-Y Growth Rate Comparison by By Product (2016-2032)
- Table 61: APAC Dried Fruits Market Market Y-o-Y Growth Rate Comparison by By Distribution Channel (2016-2032)
- Table 62: APAC Dried Fruits Market Market Share Comparison by Country (2016-2032)
- Table 63: APAC Dried Fruits Market Market Share Comparison by By Product (2016-2032)
- Table 64: APAC Dried Fruits Market Market Share Comparison by By Distribution Channel (2016-2032)
- Table 65: Latin America Dried Fruits Market Market Comparison by By Product (2016-2032)
- Table 66: Latin America Dried Fruits Market Market Comparison by By Distribution Channel (2016-2032)
- Table 67: Latin America Dried Fruits Market Revenue (US$ Mn) Comparison by Country (2016-2032)
- Table 68: Latin America Dried Fruits Market Market Revenue (US$ Mn) (2016-2032)
- Table 69: Latin America Dried Fruits Market Market Revenue (US$ Mn) Comparison by Country (2016-2032)
- Table 70: Latin America Dried Fruits Market Market Revenue (US$ Mn) Comparison by By Product (2016-2032)
- Table 71: Latin America Dried Fruits Market Market Revenue (US$ Mn) Comparison by By Distribution Channel (2016-2032)
- Table 72: Latin America Dried Fruits Market Market Y-o-Y Growth Rate Comparison by Country (2016-2032)
- Table 73: Latin America Dried Fruits Market Market Y-o-Y Growth Rate Comparison by By Product (2016-2032)
- Table 74: Latin America Dried Fruits Market Market Y-o-Y Growth Rate Comparison by By Distribution Channel (2016-2032)
- Table 75: Latin America Dried Fruits Market Market Share Comparison by Country (2016-2032)
- Table 76: Latin America Dried Fruits Market Market Share Comparison by By Product (2016-2032)
- Table 77: Latin America Dried Fruits Market Market Share Comparison by By Distribution Channel (2016-2032)
- Table 78: Middle East & Africa Dried Fruits Market Market Comparison by By Product (2016-2032)
- Table 79: Middle East & Africa Dried Fruits Market Market Comparison by By Distribution Channel (2016-2032)
- Table 80: Middle East & Africa Dried Fruits Market Revenue (US$ Mn) Comparison by Country (2016-2032)
- Table 81: Middle East & Africa Dried Fruits Market Market Revenue (US$ Mn) (2016-2032)
- Table 82: Middle East & Africa Dried Fruits Market Market Revenue (US$ Mn) Comparison by Country (2016-2032)
- Table 83: Middle East & Africa Dried Fruits Market Market Revenue (US$ Mn) Comparison by By Product (2016-2032)
- Table 84: Middle East & Africa Dried Fruits Market Market Revenue (US$ Mn) Comparison by By Distribution Channel (2016-2032)
- Table 85: Middle East & Africa Dried Fruits Market Market Y-o-Y Growth Rate Comparison by Country (2016-2032)
- Table 86: Middle East & Africa Dried Fruits Market Market Y-o-Y Growth Rate Comparison by By Product (2016-2032)
- Table 87: Middle East & Africa Dried Fruits Market Market Y-o-Y Growth Rate Comparison by By Distribution Channel (2016-2032)
- Table 88: Middle East & Africa Dried Fruits Market Market Share Comparison by Country (2016-2032)
- Table 89: Middle East & Africa Dried Fruits Market Market Share Comparison by By Product (2016-2032)
- Table 90: Middle East & Africa Dried Fruits Market Market Share Comparison by By Distribution Channel (2016-2032)
- 1. Executive Summary
-
- Kiantama Oy (Finland)
- National Raisin Company (US)
- Traina Foods (US)
- Red River Foods Incorporated (US)
- Dole Food Company Inc (US)
- Sunbeam Foods Pty Ltd (Australia)
- Lion Raisins Inc (US)
- Sun-Maid Growers of California (US)
- Bergin Fruit and Nut Company Inc. (US)
- Paradise Fruits (Germany)
Our Clients


View Our Licence Options
