DRAM Market By Type (Synchronous DRAM, BEDO (Burst Extended Data Output), EDO (Extended Data Output), Asynchronous DRAM, and FPM (Fast Page Mode)), By Technology (DDR4, DDR3, DDR5/GDDR5, and DDR2), By Application, By Region and Companies - Industry Segment Outlook, Market Assessment, Competition Scenario, Trends, and Forecast 2023-2032
-
40226
-
July 2023
-
137
-


-
This report was compiled by Vishwa Gaul Vishwa is an experienced market research and consulting professional with over 8 years of expertise in the ICT industry, contributing to over 700 reports across telecommunications, software, hardware, and digital solutions. Correspondence Team Lead- ICT Linkedin | Detailed Market research Methodology Our methodology involves a mix of primary research, including interviews with leading mental health experts, and secondary research from reputable medical journals and databases. View Detailed Methodology Page
-
Quick Navigation
Report Overview
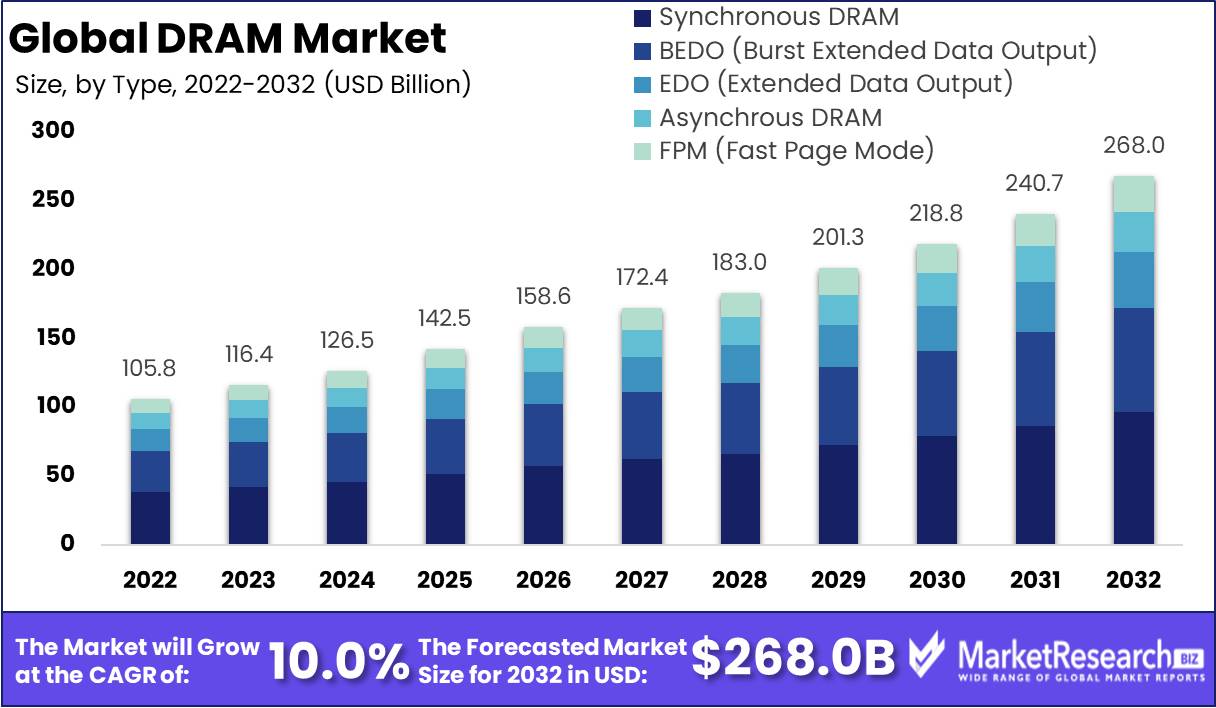
DRAM Market size is expected to be worth around USD 268.0 Bn by 2032 from USD 105.8 Bn in 2022, growing at a CAGR of 10.0% during the forecast period from 2023 to 2032.
The DRAM is a type of dynamic random-access memory that stores data in every bit arrangement on an individual capacitor. Static RAM (SRAM) includes stored data that remains secured using static memory. A DRAM can store more data as compared to an SRAM chip of the same size. DRAM stores the data effectively because it expects less physical space to store equal data compared to statically stored. The DRAM can be considered as external data output (EDO), asynchronous DRAM, synchronous DRAM (SDRAM), fast page mode (FPM), and burst extended data output (BEDO).
Driving factors
Growing Intrest in Cloud Computing and High-Speed Communication
The rising demand for DRAM, principally in data center infrastructures, is anticipated to cause rising interest in cloud computing and the need for high-speed communication. Dynamic Random Access Memory is a high-density, less-power memory technology that manages cloud services' coolings, high-speed data transfers, and backup needs. In addition, growing smartphone, laptop/PC, tablet, digital camera, and other device sellings are anticipated to support the DRAM market. The revenue share of the DRAM market is also rising as a result of the growing demand for processing technologies with more processing capability and decreasing power consumption.
Restraining Factors
High Cost Can be a Restrain for the DRAM Market
The constant market growth is restrained by the high cost of Dynamic Random Access Memory chips, which have a harmful effect on DRAM sales and usage during the forecast period. Due to more individuals working from home caused by the COVID-19 pandemic, manufacturers are concentrating on improving manufacturing abilities to fulfill with demand for mobile PCs. Dynamic Random Access Memory consumes more power than Static Random Access Memory due to its capacitors requiring to be recharged frequently to maintain their charge. Extensive power consumption is a major element that is anticipated to present substantial obstacles to the growth of the Dynamic Random Access Memory market.
Type Analysis
The synchronous DRAM dominated the type segment of the global DRAM market.
Based on type, the market for Dynamic RAM (DRAM) is segmented into, Synchronous DRAM, Asynchronous DRAM, FPM (Fast Page Mode), and BEDO (Burst Extended Data Output). The memory whose workings are simultaneous with the microprocessor’s clock speed is recognized as Synchronous DRAM (SDRAM). The Synchronous DRAM is projected to witness significant growth during the forecast period. SDRAMs speed is calculated in MHz and needs continuous refreshes to maintain the data. Synchronous DRAM utilizes an externally supplied clock signal to coordinate the control of its external pin supply. Synchronous DRAM is faster and operates more efficiently than Asynchronous DRAM.
Technology Analysis
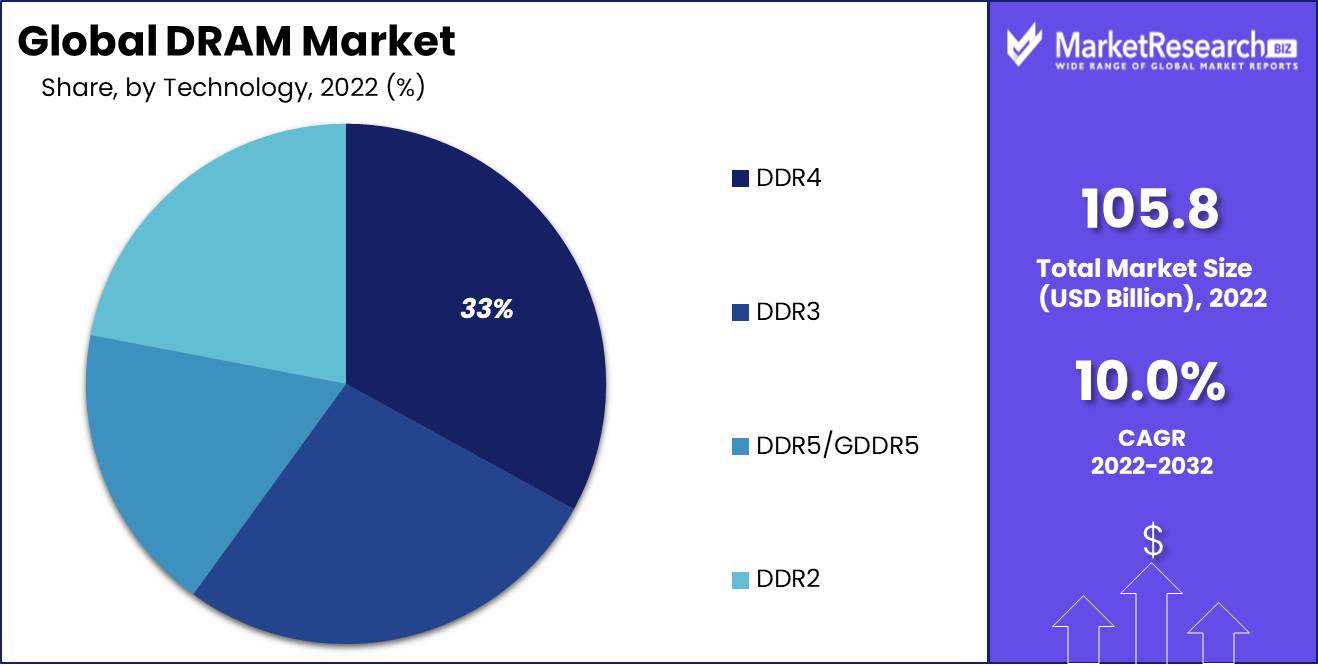
DDR4 technology conquered the technological segment of the DRAM market
Based on technologies, the DRAM market is segregated into DDR3, DDR4, DDR5/GDDR5, and DDR2. DDR4 is expected to record the largest share of the global Dynamic RAM (DRAM) market. DDR4 was initially launched in 2014 with the fluctuating bus clock speed from 800 to 1600 MHz. Its storage capacity ranges from 4 to 128 GB per DIMM. DDR4 advances a broader range of timings and clock rates, uses less power, and has lower downtime overall than DDR3 segments, which is one of the major advantages. The DDR4 advances long-term system strength since it processes more data concurrently than former RAM alternatives. It is also a secure alternative for overclocking experiments because it deals with more data without becoming overburdened. At last, it releases the burden on the entire computer system.
DDR4 effectively works on 1.2 V, whereas DDR3 controls in the wide range of 1.5 to 1.65 V. DDR4 memory segments are available in DIMM and SO-DIMM. SO-DIMM is created for all-in-one desktop computers and laptops. DDR4 DIMMs are invented with curved edge technology, which helps to make it easier to remove and put them from the slots. DDR4 memory aids data transfer speeds fluctuating from 1600 Mbps to 3200 Mbps.
Application Analysis
The PC and laptops segment is anticipated to record the maximum CAGR over the forecast period.
Based on application, the DRAM market is separated into PC/Laptops, Mobile Phones, Gaming Consoles, and Networking Devices. The PC and laptops segment is anticipated to record the maximum CAGR over the forecast period. The major advantage of a laptop as compared to a desktop computer is its lightness. The laptop's internal battery, small size, and light weight make it easy to move from one place to another. Multiple versions are normally used in public venues, such as cafes, parks, or being transported in vehicles. The laptop may be used efficiently without other accessories. Everything is built-in technology, including speakers, a built-in mouse, a touchpad, a keyboard, a camera, and a microphone in multiple laptops.
DDR3, DDR4, and DDR5 memories have exchanged DDR2 in PCs and laptops. These memory chips are used in PCs and laptops to run applications and operating systems smoothly and quickly. DDR4 and DDR3 are the most popular and high-end DRAMs crucial for image editing, HD video editing, graphic designs, gaming, multitasking & manipulating, and processing enormous amounts of data. The implementation of DDR5 DRAM is still in progress for PC and laptop applications. DDR5 DRAM is anticipated to dominate the DRAM market during the forecast period. PCs/Laptops will consume less power that can extend the battery life with the help of DDR5 DRAM.
Key Market Segments
Based on Type
- Synchronous DRAM
- BEDO (Burst Extended Data Output)
- EDO (Extended Data Output)
- Asynchronous DRAM
- FPM (Fast Page Mode)
Based on Technology
- DDR4
- DDR3
- DDR5/GDDR5
- DDR2
Based on Application
- PC/Laptops
- Mobile Phones
- Gaming Consoles
- Networking Devices
Growth Opportunity
Introduction of 5G Processors, Which Power New Smartphones, Increases Sales
The DRAM market is anticipating the launch of 5G processors, which will be able to power new smartphones, increasing sales of mobile application microprocessors. The mass 5G processors are built using cutting-edge, more costly 5nm process technology. Dynamic Random Access Memory sales grow extensively compared to other communications-related IC product sectors, consequently due to the sophisticated and rapid 5G smartphone market growth.
Dynamic Random Access Memory has been the dominating revenue-generating IC sector, and it is estimated that it will remain dominant in the IC industry during the forecast period. Computer systems underwent modifications as consumers and businesses shifted to work-from-home-based online activities. In addition, a surge in the shipment of servers for data centers that process and store data will benefit sales of DRAM. The rise in smartphone application microprocessor sales in the forecast period has been mostly recognized as the sale of more costly 5G chipset processors in the forecast period.
Latest Trends
The rising number of social media networking platforms, IoT devices, and other devices has caused the generation of large volumes of data that have led to an increase in the launch of various data center facilities across the globe. In addition, the rising requirement for cloud computing has grown the data centers' economic impact and overall size. In North America, investments in data center construction involve some of the key service providers, namely Amazon, Google, Facebook, and Microsoft.
Regional Analysis
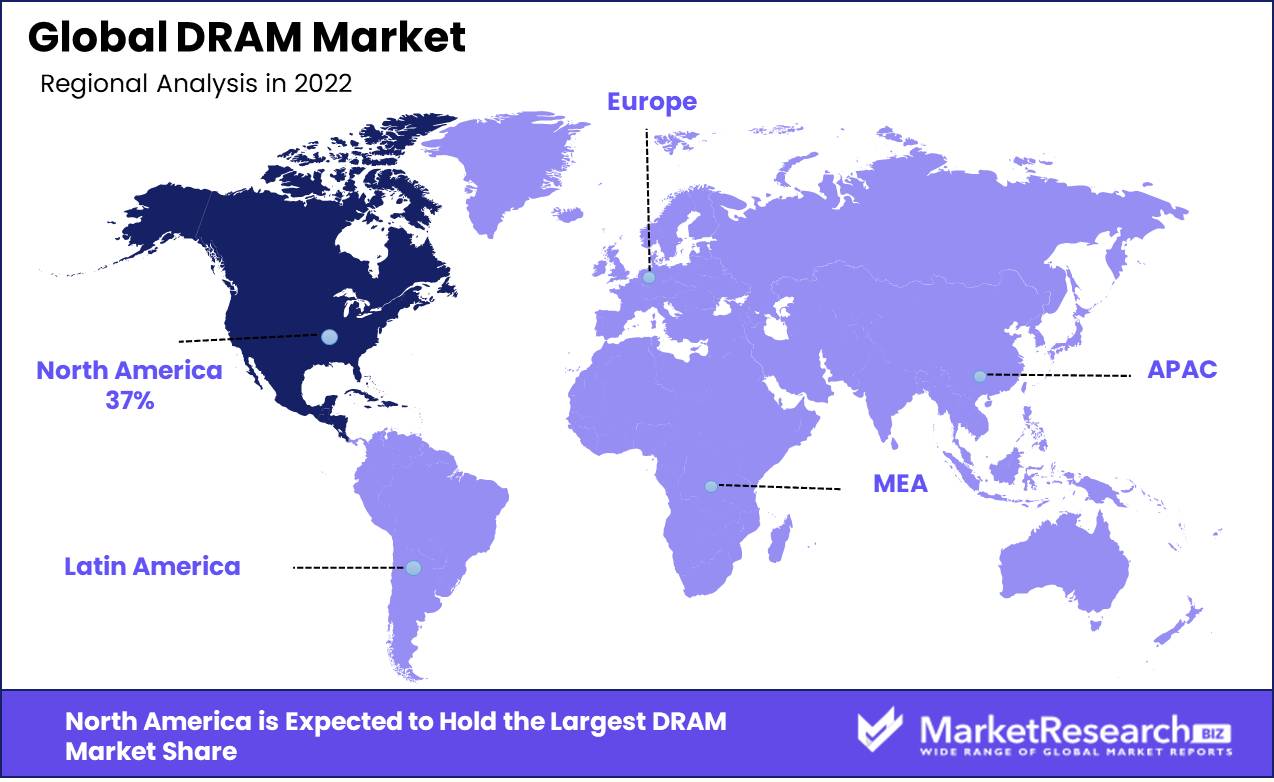
Based on the region, the market in North America holds the major DRAM market share of 37% and the largest growth rate and is anticipated to maintain its position in the forecast period. Green energy is growing in residential, industrial, and consumer verticals in North America. After building and home automation, transportation and industrial are the key applications using energy harvesting systems.
The market size of Asia Pacific is estimated to dominate the market in the projected period due to the rapid industrialization in countries such as China and India. Energy harvesting is reliant on the rapidly increasing renovation and industrialization growing in the Asia Pacific region. Major players are also moving their production facilities to Asia Pacific. This region is expected to dominate the DRAM market during the forecast period due to the quick increase tech-savvy population and population in general.
The market of North America is expected to grow rapidly in the forecast period due to the early acceptance of technological advancements. North America has a huge consumer base for applications that are dependent on harvested energy. The energy harvesting market is expected to record a significant CAGR in the anticipated period due to the previously established large energy market.
Key Regions and Countries
North America
- US
- Canada
- Mexico
Western Europe
- Germany
- France
- The UK
- Spain
- Italy
- Portugal
- Ireland
- Austria
- Switzerland
- Benelux
- Nordic
- Rest of Western Europe
Eastern Europe
- Russia
- Poland
- The Czech Republic
- Greece
- Rest of Eastern Europe
APAC
- China
- Japan
- South Korea
- India
- Australia & New Zealand
- Indonesia
- Malaysia
- Philippines
- Singapore
- Thailand
- Vietnam
- Rest of APAC
Latin America
- Brazil
- Colombia
- Chile
- Argentina
- Costa Rica
- Rest of Latin America
Middle East & Africa
- Algeria
- Egypt
- Israel
- Kuwait
- Nigeria
- Saudi Arabia
- South Africa
- Turkey
- United Arab Emirates
- Rest of MEA
Key Players Analysis
The DRAM market shows an oligopolistic expenditure, with some suppliers and a high level of price competition. Multiple key market players are competing to get a competitive advantage by leveraging innovative processing technology to decrease unit costs. For instance, Samsung Electronics inaugurated mass production of DRAM in March 2014 by using the 20nm process technology. Such technology allows the company to produce DDR3 memory at better energy efficiency and cheap manufacturing costs.
Top Key Players in DRAM Market
- ABB Ltd
- Fujitsu
- Cypress Semiconductor Corp.
- Green Peak Technologies
- Honeywell International Inc.
- Levant Power Corporation
- Marlow Industries
- Microcheap Technology Inc.
- G24 Innopvations Ltd.
- SolarEdge Technologies Inc.
- Micron Technology Inc.
- Other Key Players
Recent Development
- In February 2023, A team of 100 engineers, with an average age of 28 to 30 years, developed a chip – a 12GB LPDDR4 (low power double data rate) DRAM – that can operate at a bandwidth of 4266 Mbps with 1.1v input supply. Micron says this chip will be the primary choice for automotive applications globally through 2030.
- In December 2022, Samsung Electronics announced the development of the industry’s first DDR5 RAM based on the 12nm-class process technology. The company confirmed that the compatibility evaluation with AMD on its ‘Zen’ products have also been completed.
Report Scope:
Report Features Description Market Value (2022) USD 105.8 Bn Forecast Revenue (2032) USD 268.0 Bn CAGR (2023-2032) 10.0% Base Year for Estimation 2022 Historic Period 2016-2022 Forecast Period 2023-2032 Report Coverage Revenue Forecast, Market Dynamics, COVID-19 Impact, Competitive Landscape, Recent Developments Segments Covered By Type- Synchronous DRAM, BEDO (Burst Extended Data Output), EDO (Extended Data Output), Asynchronous DRAM, and FPM (Fast Page Mode); By Technology- DDR4, DDR3, DDR5/GDDR5, and DDR2; By Application- PC/Laptops, Mobile Phones, Gaming Consoles, and Networking Devices Regional Analysis North America – The US, Canada, & Mexico; Western Europe – Germany, France, The UK, Spain, Italy, Portugal, Ireland, Austria, Switzerland, Benelux, Nordic, & Rest of Western Europe; Eastern Europe – Russia, Poland, The Czech Republic, Greece, & Rest of Eastern Europe; APAC – China, Japan, South Korea, India, Australia & New Zealand, Indonesia, Malaysia, Philippines, Singapore, Thailand, Vietnam, & Rest of APAC; Latin America – Brazil, Colombia, Chile, Argentina, Costa Rica, & Rest of Latin America; Middle East & Africa – Algeria, Egypt, Israel, Kuwait, Nigeria, Saudi Arabia, South Africa, Turkey, United Arab Emirates, & Rest of MEA Competitive Landscape ABB Ltd, Fujitsu, Cypress Semiconductor Corp., Green Peak Technologies, Honeywell International Inc., Levant Power Corporation, Marlow Industries, Microcheap Technology Inc., G24 Innovations Ltd., SolarEdge Technologies Inc., Micron Technology Inc., and Other Key Players Customization Scope Customization for segments, region/country-level will be provided. Moreover, additional customization can be done based on the requirements. Purchase Options We have three licenses to opt for: Single User License, Multi-User License (Up to 5 Users), Corporate Use License (Unlimited User and Printable PDF) -
- 1. Executive Summary
- 1.1. Definition
- 1.2. Taxonomy
- 1.3. Research Scope
- 1.4. Key Analysis
- 1.5. Key Findings by Major Segments
- 1.6. Top strategies by Major Players
- 2. Global Global DRAM Market Overview
- 2.1. Global DRAM Market Dynamics
- 2.1.1. Drivers
- 2.1.2. Opportunities
- 2.1.3. Restraints
- 2.1.4. Challenges
- 2.2. Macro-economic Factors
- 2.3. Regulatory Framework
- 2.4. Market Investment Feasibility Index
- 2.5. PEST Analysis
- 2.6. PORTER’S Five Force Analysis
- 2.7. Drivers & Restraints Impact Analysis
- 2.8. Industry Chain Analysis
- 2.9. Cost Structure Analysis
- 2.10. Marketing Strategy
- 2.11. Russia-Ukraine War Impact Analysis
- 2.12. Opportunity Map Analysis
- 2.13. Market Competition Scenario Analysis
- 2.14. Product Life Cycle Analysis
- 2.15. Opportunity Orbits
- 2.16. Manufacturer Intensity Map
- 2.17. Major Companies sales by Value & Volume
- 2.1. Global DRAM Market Dynamics
- 3. Global Global DRAM Market Analysis, Opportunity and Forecast, 2016-2032
- 3.1. Global Global DRAM Market Analysis, 2016-2021
- 3.2. Global Global DRAM Market Opportunity and Forecast, 2023-2032
- 3.3. Global Global DRAM Market Analysis, Opportunity and Forecast, By Type, 2016-2032
- 3.3.1. Global Global DRAM Market Analysis by Type: Introduction
- 3.3.2. Market Size Absolute $ Opportunity Analysis and Forecast, By Type, 2016-2032
- 3.3.3. Synchronous DRAM
- 3.3.4. BEDO (Burst Extended Data Output)
- 3.3.5. EDO (Extended Data Output)
- 3.3.6. Asynchronous DRAM
- 3.3.7. FPM (Fast Page Mode)
- 3.4. Global Global DRAM Market Analysis, Opportunity and Forecast, By Technology, 2016-2032
- 3.4.1. Global Global DRAM Market Analysis by Technology: Introduction
- 3.4.2. Market Size Absolute $ Opportunity Analysis and Forecast, By Technology, 2016-2032
- 3.4.3. DDR4
- 3.4.4. DDR3
- 3.4.5. DDR5/GDDR5
- 3.4.6. DDR2
- 3.5. Global Global DRAM Market Analysis, Opportunity and Forecast, By Application, 2016-2032
- 3.5.1. Global Global DRAM Market Analysis by Application: Introduction
- 3.5.2. Market Size Absolute $ Opportunity Analysis and Forecast, By Application, 2016-2032
- 3.5.3. PC/Laptops
- 3.5.4. Mobile Phones
- 3.5.5. Gaming Consoles
- 3.5.6. Networking Devices
- 4. North America Global DRAM Market Analysis, Opportunity and Forecast, 2016-2032
- 4.1. North America Global DRAM Market Analysis, 2016-2021
- 4.2. North America Global DRAM Market Opportunity and Forecast, 2023-2032
- 4.3. North America Global DRAM Market Analysis, Opportunity and Forecast, By Type, 2016-2032
- 4.3.1. North America Global DRAM Market Analysis by Type: Introduction
- 4.3.2. Market Size Absolute $ Opportunity Analysis and Forecast, By Type, 2016-2032
- 4.3.3. Synchronous DRAM
- 4.3.4. BEDO (Burst Extended Data Output)
- 4.3.5. EDO (Extended Data Output)
- 4.3.6. Asynchronous DRAM
- 4.3.7. FPM (Fast Page Mode)
- 4.4. North America Global DRAM Market Analysis, Opportunity and Forecast, By Technology, 2016-2032
- 4.4.1. North America Global DRAM Market Analysis by Technology: Introduction
- 4.4.2. Market Size Absolute $ Opportunity Analysis and Forecast, By Technology, 2016-2032
- 4.4.3. DDR4
- 4.4.4. DDR3
- 4.4.5. DDR5/GDDR5
- 4.4.6. DDR2
- 4.5. North America Global DRAM Market Analysis, Opportunity and Forecast, By Application, 2016-2032
- 4.5.1. North America Global DRAM Market Analysis by Application: Introduction
- 4.5.2. Market Size Absolute $ Opportunity Analysis and Forecast, By Application, 2016-2032
- 4.5.3. PC/Laptops
- 4.5.4. Mobile Phones
- 4.5.5. Gaming Consoles
- 4.5.6. Networking Devices
- 4.6. North America Global DRAM Market Analysis, Opportunity and Forecast, By Country , 2016-2032
- 4.6.1. North America Global DRAM Market Analysis by Country : Introduction
- 4.6.2. Market Size Absolute $ Opportunity Analysis and Forecast, Country , 2016-2032
- 4.6.2.1. The US
- 4.6.2.2. Canada
- 4.6.2.3. Mexico
- 5. Western Europe Global DRAM Market Analysis, Opportunity and Forecast, 2016-2032
- 5.1. Western Europe Global DRAM Market Analysis, 2016-2021
- 5.2. Western Europe Global DRAM Market Opportunity and Forecast, 2023-2032
- 5.3. Western Europe Global DRAM Market Analysis, Opportunity and Forecast, By Type, 2016-2032
- 5.3.1. Western Europe Global DRAM Market Analysis by Type: Introduction
- 5.3.2. Market Size Absolute $ Opportunity Analysis and Forecast, By Type, 2016-2032
- 5.3.3. Synchronous DRAM
- 5.3.4. BEDO (Burst Extended Data Output)
- 5.3.5. EDO (Extended Data Output)
- 5.3.6. Asynchronous DRAM
- 5.3.7. FPM (Fast Page Mode)
- 5.4. Western Europe Global DRAM Market Analysis, Opportunity and Forecast, By Technology, 2016-2032
- 5.4.1. Western Europe Global DRAM Market Analysis by Technology: Introduction
- 5.4.2. Market Size Absolute $ Opportunity Analysis and Forecast, By Technology, 2016-2032
- 5.4.3. DDR4
- 5.4.4. DDR3
- 5.4.5. DDR5/GDDR5
- 5.4.6. DDR2
- 5.5. Western Europe Global DRAM Market Analysis, Opportunity and Forecast, By Application, 2016-2032
- 5.5.1. Western Europe Global DRAM Market Analysis by Application: Introduction
- 5.5.2. Market Size Absolute $ Opportunity Analysis and Forecast, By Application, 2016-2032
- 5.5.3. PC/Laptops
- 5.5.4. Mobile Phones
- 5.5.5. Gaming Consoles
- 5.5.6. Networking Devices
- 5.6. Western Europe Global DRAM Market Analysis, Opportunity and Forecast, By Country , 2016-2032
- 5.6.1. Western Europe Global DRAM Market Analysis by Country : Introduction
- 5.6.2. Market Size Absolute $ Opportunity Analysis and Forecast, Country , 2016-2032
- 5.6.2.1. Germany
- 5.6.2.2. France
- 5.6.2.3. The UK
- 5.6.2.4. Spain
- 5.6.2.5. Italy
- 5.6.2.6. Portugal
- 5.6.2.7. Ireland
- 5.6.2.8. Austria
- 5.6.2.9. Switzerland
- 5.6.2.10. Benelux
- 5.6.2.11. Nordic
- 5.6.2.12. Rest of Western Europe
- 6. Eastern Europe Global DRAM Market Analysis, Opportunity and Forecast, 2016-2032
- 6.1. Eastern Europe Global DRAM Market Analysis, 2016-2021
- 6.2. Eastern Europe Global DRAM Market Opportunity and Forecast, 2023-2032
- 6.3. Eastern Europe Global DRAM Market Analysis, Opportunity and Forecast, By Type, 2016-2032
- 6.3.1. Eastern Europe Global DRAM Market Analysis by Type: Introduction
- 6.3.2. Market Size Absolute $ Opportunity Analysis and Forecast, By Type, 2016-2032
- 6.3.3. Synchronous DRAM
- 6.3.4. BEDO (Burst Extended Data Output)
- 6.3.5. EDO (Extended Data Output)
- 6.3.6. Asynchronous DRAM
- 6.3.7. FPM (Fast Page Mode)
- 6.4. Eastern Europe Global DRAM Market Analysis, Opportunity and Forecast, By Technology, 2016-2032
- 6.4.1. Eastern Europe Global DRAM Market Analysis by Technology: Introduction
- 6.4.2. Market Size Absolute $ Opportunity Analysis and Forecast, By Technology, 2016-2032
- 6.4.3. DDR4
- 6.4.4. DDR3
- 6.4.5. DDR5/GDDR5
- 6.4.6. DDR2
- 6.5. Eastern Europe Global DRAM Market Analysis, Opportunity and Forecast, By Application, 2016-2032
- 6.5.1. Eastern Europe Global DRAM Market Analysis by Application: Introduction
- 6.5.2. Market Size Absolute $ Opportunity Analysis and Forecast, By Application, 2016-2032
- 6.5.3. PC/Laptops
- 6.5.4. Mobile Phones
- 6.5.5. Gaming Consoles
- 6.5.6. Networking Devices
- 6.6. Eastern Europe Global DRAM Market Analysis, Opportunity and Forecast, By Country , 2016-2032
- 6.6.1. Eastern Europe Global DRAM Market Analysis by Country : Introduction
- 6.6.2. Market Size Absolute $ Opportunity Analysis and Forecast, Country , 2016-2032
- 6.6.2.1. Russia
- 6.6.2.2. Poland
- 6.6.2.3. The Czech Republic
- 6.6.2.4. Greece
- 6.6.2.5. Rest of Eastern Europe
- 7. APAC Global DRAM Market Analysis, Opportunity and Forecast, 2016-2032
- 7.1. APAC Global DRAM Market Analysis, 2016-2021
- 7.2. APAC Global DRAM Market Opportunity and Forecast, 2023-2032
- 7.3. APAC Global DRAM Market Analysis, Opportunity and Forecast, By Type, 2016-2032
- 7.3.1. APAC Global DRAM Market Analysis by Type: Introduction
- 7.3.2. Market Size Absolute $ Opportunity Analysis and Forecast, By Type, 2016-2032
- 7.3.3. Synchronous DRAM
- 7.3.4. BEDO (Burst Extended Data Output)
- 7.3.5. EDO (Extended Data Output)
- 7.3.6. Asynchronous DRAM
- 7.3.7. FPM (Fast Page Mode)
- 7.4. APAC Global DRAM Market Analysis, Opportunity and Forecast, By Technology, 2016-2032
- 7.4.1. APAC Global DRAM Market Analysis by Technology: Introduction
- 7.4.2. Market Size Absolute $ Opportunity Analysis and Forecast, By Technology, 2016-2032
- 7.4.3. DDR4
- 7.4.4. DDR3
- 7.4.5. DDR5/GDDR5
- 7.4.6. DDR2
- 7.5. APAC Global DRAM Market Analysis, Opportunity and Forecast, By Application, 2016-2032
- 7.5.1. APAC Global DRAM Market Analysis by Application: Introduction
- 7.5.2. Market Size Absolute $ Opportunity Analysis and Forecast, By Application, 2016-2032
- 7.5.3. PC/Laptops
- 7.5.4. Mobile Phones
- 7.5.5. Gaming Consoles
- 7.5.6. Networking Devices
- 7.6. APAC Global DRAM Market Analysis, Opportunity and Forecast, By Country , 2016-2032
- 7.6.1. APAC Global DRAM Market Analysis by Country : Introduction
- 7.6.2. Market Size Absolute $ Opportunity Analysis and Forecast, Country , 2016-2032
- 7.6.2.1. China
- 7.6.2.2. Japan
- 7.6.2.3. South Korea
- 7.6.2.4. India
- 7.6.2.5. Australia & New Zeland
- 7.6.2.6. Indonesia
- 7.6.2.7. Malaysia
- 7.6.2.8. Philippines
- 7.6.2.9. Singapore
- 7.6.2.10. Thailand
- 7.6.2.11. Vietnam
- 7.6.2.12. Rest of APAC
- 8. Latin America Global DRAM Market Analysis, Opportunity and Forecast, 2016-2032
- 8.1. Latin America Global DRAM Market Analysis, 2016-2021
- 8.2. Latin America Global DRAM Market Opportunity and Forecast, 2023-2032
- 8.3. Latin America Global DRAM Market Analysis, Opportunity and Forecast, By Type, 2016-2032
- 8.3.1. Latin America Global DRAM Market Analysis by Type: Introduction
- 8.3.2. Market Size Absolute $ Opportunity Analysis and Forecast, By Type, 2016-2032
- 8.3.3. Synchronous DRAM
- 8.3.4. BEDO (Burst Extended Data Output)
- 8.3.5. EDO (Extended Data Output)
- 8.3.6. Asynchronous DRAM
- 8.3.7. FPM (Fast Page Mode)
- 8.4. Latin America Global DRAM Market Analysis, Opportunity and Forecast, By Technology, 2016-2032
- 8.4.1. Latin America Global DRAM Market Analysis by Technology: Introduction
- 8.4.2. Market Size Absolute $ Opportunity Analysis and Forecast, By Technology, 2016-2032
- 8.4.3. DDR4
- 8.4.4. DDR3
- 8.4.5. DDR5/GDDR5
- 8.4.6. DDR2
- 8.5. Latin America Global DRAM Market Analysis, Opportunity and Forecast, By Application, 2016-2032
- 8.5.1. Latin America Global DRAM Market Analysis by Application: Introduction
- 8.5.2. Market Size Absolute $ Opportunity Analysis and Forecast, By Application, 2016-2032
- 8.5.3. PC/Laptops
- 8.5.4. Mobile Phones
- 8.5.5. Gaming Consoles
- 8.5.6. Networking Devices
- 8.6. Latin America Global DRAM Market Analysis, Opportunity and Forecast, By Country , 2016-2032
- 8.6.1. Latin America Global DRAM Market Analysis by Country : Introduction
- 8.6.2. Market Size Absolute $ Opportunity Analysis and Forecast, Country , 2016-2032
- 8.6.2.1. Brazil
- 8.6.2.2. Colombia
- 8.6.2.3. Chile
- 8.6.2.4. Argentina
- 8.6.2.5. Costa Rica
- 8.6.2.6. Rest of Latin America
- 9. Middle East & Africa Global DRAM Market Analysis, Opportunity and Forecast, 2016-2032
- 9.1. Middle East & Africa Global DRAM Market Analysis, 2016-2021
- 9.2. Middle East & Africa Global DRAM Market Opportunity and Forecast, 2023-2032
- 9.3. Middle East & Africa Global DRAM Market Analysis, Opportunity and Forecast, By Type, 2016-2032
- 9.3.1. Middle East & Africa Global DRAM Market Analysis by Type: Introduction
- 9.3.2. Market Size Absolute $ Opportunity Analysis and Forecast, By Type, 2016-2032
- 9.3.3. Synchronous DRAM
- 9.3.4. BEDO (Burst Extended Data Output)
- 9.3.5. EDO (Extended Data Output)
- 9.3.6. Asynchronous DRAM
- 9.3.7. FPM (Fast Page Mode)
- 9.4. Middle East & Africa Global DRAM Market Analysis, Opportunity and Forecast, By Technology, 2016-2032
- 9.4.1. Middle East & Africa Global DRAM Market Analysis by Technology: Introduction
- 9.4.2. Market Size Absolute $ Opportunity Analysis and Forecast, By Technology, 2016-2032
- 9.4.3. DDR4
- 9.4.4. DDR3
- 9.4.5. DDR5/GDDR5
- 9.4.6. DDR2
- 9.5. Middle East & Africa Global DRAM Market Analysis, Opportunity and Forecast, By Application, 2016-2032
- 9.5.1. Middle East & Africa Global DRAM Market Analysis by Application: Introduction
- 9.5.2. Market Size Absolute $ Opportunity Analysis and Forecast, By Application, 2016-2032
- 9.5.3. PC/Laptops
- 9.5.4. Mobile Phones
- 9.5.5. Gaming Consoles
- 9.5.6. Networking Devices
- 9.6. Middle East & Africa Global DRAM Market Analysis, Opportunity and Forecast, By Country , 2016-2032
- 9.6.1. Middle East & Africa Global DRAM Market Analysis by Country : Introduction
- 9.6.2. Market Size Absolute $ Opportunity Analysis and Forecast, Country , 2016-2032
- 9.6.2.1. Algeria
- 9.6.2.2. Egypt
- 9.6.2.3. Israel
- 9.6.2.4. Kuwait
- 9.6.2.5. Nigeria
- 9.6.2.6. Saudi Arabia
- 9.6.2.7. South Africa
- 9.6.2.8. Turkey
- 9.6.2.9. The UAE
- 9.6.2.10. Rest of MEA
- 10. Global Global DRAM Market Analysis, Opportunity and Forecast, By Region , 2016-2032
- 10.1. Global Global DRAM Market Analysis by Region : Introduction
- 10.2. Market Size Absolute $ Opportunity Analysis and Forecast, By Region , 2016-2032
- 10.2.1. North America
- 10.2.2. Western Europe
- 10.2.3. Eastern Europe
- 10.2.4. APAC
- 10.2.5. Latin America
- 10.2.6. Middle East & Africa
- 11. Global Global DRAM Market Competitive Landscape, Market Share Analysis, and Company Profiles
- 11.1. Market Share Analysis
- 11.2. Company Profiles
- 11.3. ABB Ltd
- 11.3.1. Company Overview
- 11.3.2. Financial Highlights
- 11.3.3. Product Portfolio
- 11.3.4. SWOT Analysis
- 11.3.5. Key Strategies and Developments
- 11.4. Fujitsu
- 11.4.1. Company Overview
- 11.4.2. Financial Highlights
- 11.4.3. Product Portfolio
- 11.4.4. SWOT Analysis
- 11.4.5. Key Strategies and Developments
- 11.5. Cypress Semiconductor Corp.
- 11.5.1. Company Overview
- 11.5.2. Financial Highlights
- 11.5.3. Product Portfolio
- 11.5.4. SWOT Analysis
- 11.5.5. Key Strategies and Developments
- 11.6. Green Peak Technologies
- 11.6.1. Company Overview
- 11.6.2. Financial Highlights
- 11.6.3. Product Portfolio
- 11.6.4. SWOT Analysis
- 11.6.5. Key Strategies and Developments
- 11.7. Honeywell International Inc.
- 11.7.1. Company Overview
- 11.7.2. Financial Highlights
- 11.7.3. Product Portfolio
- 11.7.4. SWOT Analysis
- 11.7.5. Key Strategies and Developments
- 11.8. Levant Power Corporation
- 11.8.1. Company Overview
- 11.8.2. Financial Highlights
- 11.8.3. Product Portfolio
- 11.8.4. SWOT Analysis
- 11.8.5. Key Strategies and Developments
- 11.9. Marlow Industries
- 11.9.1. Company Overview
- 11.9.2. Financial Highlights
- 11.9.3. Product Portfolio
- 11.9.4. SWOT Analysis
- 11.9.5. Key Strategies and Developments
- 11.10. Microcheap Technology Inc.
- 11.10.1. Company Overview
- 11.10.2. Financial Highlights
- 11.10.3. Product Portfolio
- 11.10.4. SWOT Analysis
- 11.10.5. Key Strategies and Developments
- 11.11. G24 Innopvations Ltd.
- 11.11.1. Company Overview
- 11.11.2. Financial Highlights
- 11.11.3. Product Portfolio
- 11.11.4. SWOT Analysis
- 11.11.5. Key Strategies and Developments
- 11.12. SolarEdge Technologies Inc.
- 11.12.1. Company Overview
- 11.12.2. Financial Highlights
- 11.12.3. Product Portfolio
- 11.12.4. SWOT Analysis
- 11.12.5. Key Strategies and Developments
- 11.13. Other Key Players
- 11.13.1. Company Overview
- 11.13.2. Financial Highlights
- 11.13.3. Product Portfolio
- 11.13.4. SWOT Analysis
- 11.13.5. Key Strategies and Developments
- 12. Assumptions and Acronyms
- 13. Research Methodology
- 14. Contact
- List of Figures
- Figure 1: Global Global DRAM Market Revenue (US$ Mn) Market Share by Type in 2022
- Figure 2: Global Global DRAM Market Attractiveness Analysis by Type, 2016-2032
- Figure 3: Global Global DRAM Market Revenue (US$ Mn) Market Share by Technologyin 2022
- Figure 4: Global Global DRAM Market Attractiveness Analysis by Technology, 2016-2032
- Figure 5: Global Global DRAM Market Revenue (US$ Mn) Market Share by Applicationin 2022
- Figure 6: Global Global DRAM Market Attractiveness Analysis by Application, 2016-2032
- Figure 7: Global Global DRAM Market Revenue (US$ Mn) Market Share by Region in 2022
- Figure 8: Global Global DRAM Market Attractiveness Analysis by Region, 2016-2032
- Figure 9: Global Global DRAM Market Revenue (US$ Mn) (2016-2032)
- Figure 10: Global Global DRAM Market Revenue (US$ Mn) Comparison by Region (2016-2032)
- Figure 11: Global Global DRAM Market Revenue (US$ Mn) Comparison by Type (2016-2032)
- Figure 12: Global Global DRAM Market Revenue (US$ Mn) Comparison by Technology (2016-2032)
- Figure 13: Global Global DRAM Market Revenue (US$ Mn) Comparison by Application (2016-2032)
- Figure 14: Global Global DRAM Market Y-o-Y Growth Rate Comparison by Region (2016-2032)
- Figure 15: Global Global DRAM Market Y-o-Y Growth Rate Comparison by Type (2016-2032)
- Figure 16: Global Global DRAM Market Y-o-Y Growth Rate Comparison by Technology (2016-2032)
- Figure 17: Global Global DRAM Market Y-o-Y Growth Rate Comparison by Application (2016-2032)
- Figure 18: Global Global DRAM Market Share Comparison by Region (2016-2032)
- Figure 19: Global Global DRAM Market Share Comparison by Type (2016-2032)
- Figure 20: Global Global DRAM Market Share Comparison by Technology (2016-2032)
- Figure 21: Global Global DRAM Market Share Comparison by Application (2016-2032)
- Figure 22: North America Global DRAM Market Revenue (US$ Mn) Market Share by Typein 2022
- Figure 23: North America Global DRAM Market Attractiveness Analysis by Type, 2016-2032
- Figure 24: North America Global DRAM Market Revenue (US$ Mn) Market Share by Technologyin 2022
- Figure 25: North America Global DRAM Market Attractiveness Analysis by Technology, 2016-2032
- Figure 26: North America Global DRAM Market Revenue (US$ Mn) Market Share by Applicationin 2022
- Figure 27: North America Global DRAM Market Attractiveness Analysis by Application, 2016-2032
- Figure 28: North America Global DRAM Market Revenue (US$ Mn) Market Share by Country in 2022
- Figure 29: North America Global DRAM Market Attractiveness Analysis by Country, 2016-2032
- Figure 30: North America Global DRAM Market Revenue (US$ Mn) (2016-2032)
- Figure 31: North America Global DRAM Market Revenue (US$ Mn) Comparison by Country (2016-2032)
- Figure 32: North America Global DRAM Market Revenue (US$ Mn) Comparison by Type (2016-2032)
- Figure 33: North America Global DRAM Market Revenue (US$ Mn) Comparison by Technology (2016-2032)
- Figure 34: North America Global DRAM Market Revenue (US$ Mn) Comparison by Application (2016-2032)
- Figure 35: North America Global DRAM Market Y-o-Y Growth Rate Comparison by Country (2016-2032)
- Figure 36: North America Global DRAM Market Y-o-Y Growth Rate Comparison by Type (2016-2032)
- Figure 37: North America Global DRAM Market Y-o-Y Growth Rate Comparison by Technology (2016-2032)
- Figure 38: North America Global DRAM Market Y-o-Y Growth Rate Comparison by Application (2016-2032)
- Figure 39: North America Global DRAM Market Share Comparison by Country (2016-2032)
- Figure 40: North America Global DRAM Market Share Comparison by Type (2016-2032)
- Figure 41: North America Global DRAM Market Share Comparison by Technology (2016-2032)
- Figure 42: North America Global DRAM Market Share Comparison by Application (2016-2032)
- Figure 43: Western Europe Global DRAM Market Revenue (US$ Mn) Market Share by Typein 2022
- Figure 44: Western Europe Global DRAM Market Attractiveness Analysis by Type, 2016-2032
- Figure 45: Western Europe Global DRAM Market Revenue (US$ Mn) Market Share by Technologyin 2022
- Figure 46: Western Europe Global DRAM Market Attractiveness Analysis by Technology, 2016-2032
- Figure 47: Western Europe Global DRAM Market Revenue (US$ Mn) Market Share by Applicationin 2022
- Figure 48: Western Europe Global DRAM Market Attractiveness Analysis by Application, 2016-2032
- Figure 49: Western Europe Global DRAM Market Revenue (US$ Mn) Market Share by Country in 2022
- Figure 50: Western Europe Global DRAM Market Attractiveness Analysis by Country, 2016-2032
- Figure 51: Western Europe Global DRAM Market Revenue (US$ Mn) (2016-2032)
- Figure 52: Western Europe Global DRAM Market Revenue (US$ Mn) Comparison by Country (2016-2032)
- Figure 53: Western Europe Global DRAM Market Revenue (US$ Mn) Comparison by Type (2016-2032)
- Figure 54: Western Europe Global DRAM Market Revenue (US$ Mn) Comparison by Technology (2016-2032)
- Figure 55: Western Europe Global DRAM Market Revenue (US$ Mn) Comparison by Application (2016-2032)
- Figure 56: Western Europe Global DRAM Market Y-o-Y Growth Rate Comparison by Country (2016-2032)
- Figure 57: Western Europe Global DRAM Market Y-o-Y Growth Rate Comparison by Type (2016-2032)
- Figure 58: Western Europe Global DRAM Market Y-o-Y Growth Rate Comparison by Technology (2016-2032)
- Figure 59: Western Europe Global DRAM Market Y-o-Y Growth Rate Comparison by Application (2016-2032)
- Figure 60: Western Europe Global DRAM Market Share Comparison by Country (2016-2032)
- Figure 61: Western Europe Global DRAM Market Share Comparison by Type (2016-2032)
- Figure 62: Western Europe Global DRAM Market Share Comparison by Technology (2016-2032)
- Figure 63: Western Europe Global DRAM Market Share Comparison by Application (2016-2032)
- Figure 64: Eastern Europe Global DRAM Market Revenue (US$ Mn) Market Share by Typein 2022
- Figure 65: Eastern Europe Global DRAM Market Attractiveness Analysis by Type, 2016-2032
- Figure 66: Eastern Europe Global DRAM Market Revenue (US$ Mn) Market Share by Technologyin 2022
- Figure 67: Eastern Europe Global DRAM Market Attractiveness Analysis by Technology, 2016-2032
- Figure 68: Eastern Europe Global DRAM Market Revenue (US$ Mn) Market Share by Applicationin 2022
- Figure 69: Eastern Europe Global DRAM Market Attractiveness Analysis by Application, 2016-2032
- Figure 70: Eastern Europe Global DRAM Market Revenue (US$ Mn) Market Share by Country in 2022
- Figure 71: Eastern Europe Global DRAM Market Attractiveness Analysis by Country, 2016-2032
- Figure 72: Eastern Europe Global DRAM Market Revenue (US$ Mn) (2016-2032)
- Figure 73: Eastern Europe Global DRAM Market Revenue (US$ Mn) Comparison by Country (2016-2032)
- Figure 74: Eastern Europe Global DRAM Market Revenue (US$ Mn) Comparison by Type (2016-2032)
- Figure 75: Eastern Europe Global DRAM Market Revenue (US$ Mn) Comparison by Technology (2016-2032)
- Figure 76: Eastern Europe Global DRAM Market Revenue (US$ Mn) Comparison by Application (2016-2032)
- Figure 77: Eastern Europe Global DRAM Market Y-o-Y Growth Rate Comparison by Country (2016-2032)
- Figure 78: Eastern Europe Global DRAM Market Y-o-Y Growth Rate Comparison by Type (2016-2032)
- Figure 79: Eastern Europe Global DRAM Market Y-o-Y Growth Rate Comparison by Technology (2016-2032)
- Figure 80: Eastern Europe Global DRAM Market Y-o-Y Growth Rate Comparison by Application (2016-2032)
- Figure 81: Eastern Europe Global DRAM Market Share Comparison by Country (2016-2032)
- Figure 82: Eastern Europe Global DRAM Market Share Comparison by Type (2016-2032)
- Figure 83: Eastern Europe Global DRAM Market Share Comparison by Technology (2016-2032)
- Figure 84: Eastern Europe Global DRAM Market Share Comparison by Application (2016-2032)
- Figure 85: APAC Global DRAM Market Revenue (US$ Mn) Market Share by Typein 2022
- Figure 86: APAC Global DRAM Market Attractiveness Analysis by Type, 2016-2032
- Figure 87: APAC Global DRAM Market Revenue (US$ Mn) Market Share by Technologyin 2022
- Figure 88: APAC Global DRAM Market Attractiveness Analysis by Technology, 2016-2032
- Figure 89: APAC Global DRAM Market Revenue (US$ Mn) Market Share by Applicationin 2022
- Figure 90: APAC Global DRAM Market Attractiveness Analysis by Application, 2016-2032
- Figure 91: APAC Global DRAM Market Revenue (US$ Mn) Market Share by Country in 2022
- Figure 92: APAC Global DRAM Market Attractiveness Analysis by Country, 2016-2032
- Figure 93: APAC Global DRAM Market Revenue (US$ Mn) (2016-2032)
- Figure 94: APAC Global DRAM Market Revenue (US$ Mn) Comparison by Country (2016-2032)
- Figure 95: APAC Global DRAM Market Revenue (US$ Mn) Comparison by Type (2016-2032)
- Figure 96: APAC Global DRAM Market Revenue (US$ Mn) Comparison by Technology (2016-2032)
- Figure 97: APAC Global DRAM Market Revenue (US$ Mn) Comparison by Application (2016-2032)
- Figure 98: APAC Global DRAM Market Y-o-Y Growth Rate Comparison by Country (2016-2032)
- Figure 99: APAC Global DRAM Market Y-o-Y Growth Rate Comparison by Type (2016-2032)
- Figure 100: APAC Global DRAM Market Y-o-Y Growth Rate Comparison by Technology (2016-2032)
- Figure 101: APAC Global DRAM Market Y-o-Y Growth Rate Comparison by Application (2016-2032)
- Figure 102: APAC Global DRAM Market Share Comparison by Country (2016-2032)
- Figure 103: APAC Global DRAM Market Share Comparison by Type (2016-2032)
- Figure 104: APAC Global DRAM Market Share Comparison by Technology (2016-2032)
- Figure 105: APAC Global DRAM Market Share Comparison by Application (2016-2032)
- Figure 106: Latin America Global DRAM Market Revenue (US$ Mn) Market Share by Typein 2022
- Figure 107: Latin America Global DRAM Market Attractiveness Analysis by Type, 2016-2032
- Figure 108: Latin America Global DRAM Market Revenue (US$ Mn) Market Share by Technologyin 2022
- Figure 109: Latin America Global DRAM Market Attractiveness Analysis by Technology, 2016-2032
- Figure 110: Latin America Global DRAM Market Revenue (US$ Mn) Market Share by Applicationin 2022
- Figure 111: Latin America Global DRAM Market Attractiveness Analysis by Application, 2016-2032
- Figure 112: Latin America Global DRAM Market Revenue (US$ Mn) Market Share by Country in 2022
- Figure 113: Latin America Global DRAM Market Attractiveness Analysis by Country, 2016-2032
- Figure 114: Latin America Global DRAM Market Revenue (US$ Mn) (2016-2032)
- Figure 115: Latin America Global DRAM Market Revenue (US$ Mn) Comparison by Country (2016-2032)
- Figure 116: Latin America Global DRAM Market Revenue (US$ Mn) Comparison by Type (2016-2032)
- Figure 117: Latin America Global DRAM Market Revenue (US$ Mn) Comparison by Technology (2016-2032)
- Figure 118: Latin America Global DRAM Market Revenue (US$ Mn) Comparison by Application (2016-2032)
- Figure 119: Latin America Global DRAM Market Y-o-Y Growth Rate Comparison by Country (2016-2032)
- Figure 120: Latin America Global DRAM Market Y-o-Y Growth Rate Comparison by Type (2016-2032)
- Figure 121: Latin America Global DRAM Market Y-o-Y Growth Rate Comparison by Technology (2016-2032)
- Figure 122: Latin America Global DRAM Market Y-o-Y Growth Rate Comparison by Application (2016-2032)
- Figure 123: Latin America Global DRAM Market Share Comparison by Country (2016-2032)
- Figure 124: Latin America Global DRAM Market Share Comparison by Type (2016-2032)
- Figure 125: Latin America Global DRAM Market Share Comparison by Technology (2016-2032)
- Figure 126: Latin America Global DRAM Market Share Comparison by Application (2016-2032)
- Figure 127: Middle East & Africa Global DRAM Market Revenue (US$ Mn) Market Share by Typein 2022
- Figure 128: Middle East & Africa Global DRAM Market Attractiveness Analysis by Type, 2016-2032
- Figure 129: Middle East & Africa Global DRAM Market Revenue (US$ Mn) Market Share by Technologyin 2022
- Figure 130: Middle East & Africa Global DRAM Market Attractiveness Analysis by Technology, 2016-2032
- Figure 131: Middle East & Africa Global DRAM Market Revenue (US$ Mn) Market Share by Applicationin 2022
- Figure 132: Middle East & Africa Global DRAM Market Attractiveness Analysis by Application, 2016-2032
- Figure 133: Middle East & Africa Global DRAM Market Revenue (US$ Mn) Market Share by Country in 2022
- Figure 134: Middle East & Africa Global DRAM Market Attractiveness Analysis by Country, 2016-2032
- Figure 135: Middle East & Africa Global DRAM Market Revenue (US$ Mn) (2016-2032)
- Figure 136: Middle East & Africa Global DRAM Market Revenue (US$ Mn) Comparison by Country (2016-2032)
- Figure 137: Middle East & Africa Global DRAM Market Revenue (US$ Mn) Comparison by Type (2016-2032)
- Figure 138: Middle East & Africa Global DRAM Market Revenue (US$ Mn) Comparison by Technology (2016-2032)
- Figure 139: Middle East & Africa Global DRAM Market Revenue (US$ Mn) Comparison by Application (2016-2032)
- Figure 140: Middle East & Africa Global DRAM Market Y-o-Y Growth Rate Comparison by Country (2016-2032)
- Figure 141: Middle East & Africa Global DRAM Market Y-o-Y Growth Rate Comparison by Type (2016-2032)
- Figure 142: Middle East & Africa Global DRAM Market Y-o-Y Growth Rate Comparison by Technology (2016-2032)
- Figure 143: Middle East & Africa Global DRAM Market Y-o-Y Growth Rate Comparison by Application (2016-2032)
- Figure 144: Middle East & Africa Global DRAM Market Share Comparison by Country (2016-2032)
- Figure 145: Middle East & Africa Global DRAM Market Share Comparison by Type (2016-2032)
- Figure 146: Middle East & Africa Global DRAM Market Share Comparison by Technology (2016-2032)
- Figure 147: Middle East & Africa Global DRAM Market Share Comparison by Application (2016-2032)
- List of Tables
- Table 1: Global Global DRAM Market Comparison by Type (2016-2032)
- Table 2: Global Global DRAM Market Comparison by Technology (2016-2032)
- Table 3: Global Global DRAM Market Comparison by Application (2016-2032)
- Table 4: Global Global DRAM Market Revenue (US$ Mn) Comparison by Region (2016-2032)
- Table 5: Global Global DRAM Market Revenue (US$ Mn) (2016-2032)
- Table 6: Global Global DRAM Market Revenue (US$ Mn) Comparison by Region (2016-2032)
- Table 7: Global Global DRAM Market Revenue (US$ Mn) Comparison by Type (2016-2032)
- Table 8: Global Global DRAM Market Revenue (US$ Mn) Comparison by Technology (2016-2032)
- Table 9: Global Global DRAM Market Revenue (US$ Mn) Comparison by Application (2016-2032)
- Table 10: Global Global DRAM Market Y-o-Y Growth Rate Comparison by Region (2016-2032)
- Table 11: Global Global DRAM Market Y-o-Y Growth Rate Comparison by Type (2016-2032)
- Table 12: Global Global DRAM Market Y-o-Y Growth Rate Comparison by Technology (2016-2032)
- Table 13: Global Global DRAM Market Y-o-Y Growth Rate Comparison by Application (2016-2032)
- Table 14: Global Global DRAM Market Share Comparison by Region (2016-2032)
- Table 15: Global Global DRAM Market Share Comparison by Type (2016-2032)
- Table 16: Global Global DRAM Market Share Comparison by Technology (2016-2032)
- Table 17: Global Global DRAM Market Share Comparison by Application (2016-2032)
- Table 18: North America Global DRAM Market Comparison by Technology (2016-2032)
- Table 19: North America Global DRAM Market Comparison by Application (2016-2032)
- Table 20: North America Global DRAM Market Revenue (US$ Mn) Comparison by Country (2016-2032)
- Table 21: North America Global DRAM Market Revenue (US$ Mn) (2016-2032)
- Table 22: North America Global DRAM Market Revenue (US$ Mn) Comparison by Country (2016-2032)
- Table 23: North America Global DRAM Market Revenue (US$ Mn) Comparison by Type (2016-2032)
- Table 24: North America Global DRAM Market Revenue (US$ Mn) Comparison by Technology (2016-2032)
- Table 25: North America Global DRAM Market Revenue (US$ Mn) Comparison by Application (2016-2032)
- Table 26: North America Global DRAM Market Y-o-Y Growth Rate Comparison by Country (2016-2032)
- Table 27: North America Global DRAM Market Y-o-Y Growth Rate Comparison by Type (2016-2032)
- Table 28: North America Global DRAM Market Y-o-Y Growth Rate Comparison by Technology (2016-2032)
- Table 29: North America Global DRAM Market Y-o-Y Growth Rate Comparison by Application (2016-2032)
- Table 30: North America Global DRAM Market Share Comparison by Country (2016-2032)
- Table 31: North America Global DRAM Market Share Comparison by Type (2016-2032)
- Table 32: North America Global DRAM Market Share Comparison by Technology (2016-2032)
- Table 33: North America Global DRAM Market Share Comparison by Application (2016-2032)
- Table 34: Western Europe Global DRAM Market Comparison by Type (2016-2032)
- Table 35: Western Europe Global DRAM Market Comparison by Technology (2016-2032)
- Table 36: Western Europe Global DRAM Market Comparison by Application (2016-2032)
- Table 37: Western Europe Global DRAM Market Revenue (US$ Mn) Comparison by Country (2016-2032)
- Table 38: Western Europe Global DRAM Market Revenue (US$ Mn) (2016-2032)
- Table 39: Western Europe Global DRAM Market Revenue (US$ Mn) Comparison by Country (2016-2032)
- Table 40: Western Europe Global DRAM Market Revenue (US$ Mn) Comparison by Type (2016-2032)
- Table 41: Western Europe Global DRAM Market Revenue (US$ Mn) Comparison by Technology (2016-2032)
- Table 42: Western Europe Global DRAM Market Revenue (US$ Mn) Comparison by Application (2016-2032)
- Table 43: Western Europe Global DRAM Market Y-o-Y Growth Rate Comparison by Country (2016-2032)
- Table 44: Western Europe Global DRAM Market Y-o-Y Growth Rate Comparison by Type (2016-2032)
- Table 45: Western Europe Global DRAM Market Y-o-Y Growth Rate Comparison by Technology (2016-2032)
- Table 46: Western Europe Global DRAM Market Y-o-Y Growth Rate Comparison by Application (2016-2032)
- Table 47: Western Europe Global DRAM Market Share Comparison by Country (2016-2032)
- Table 48: Western Europe Global DRAM Market Share Comparison by Type (2016-2032)
- Table 49: Western Europe Global DRAM Market Share Comparison by Technology (2016-2032)
- Table 50: Western Europe Global DRAM Market Share Comparison by Application (2016-2032)
- Table 51: Eastern Europe Global DRAM Market Comparison by Type (2016-2032)
- Table 52: Eastern Europe Global DRAM Market Comparison by Technology (2016-2032)
- Table 53: Eastern Europe Global DRAM Market Comparison by Application (2016-2032)
- Table 54: Eastern Europe Global DRAM Market Revenue (US$ Mn) Comparison by Country (2016-2032)
- Table 55: Eastern Europe Global DRAM Market Revenue (US$ Mn) (2016-2032)
- Table 56: Eastern Europe Global DRAM Market Revenue (US$ Mn) Comparison by Country (2016-2032)
- Table 57: Eastern Europe Global DRAM Market Revenue (US$ Mn) Comparison by Type (2016-2032)
- Table 58: Eastern Europe Global DRAM Market Revenue (US$ Mn) Comparison by Technology (2016-2032)
- Table 59: Eastern Europe Global DRAM Market Revenue (US$ Mn) Comparison by Application (2016-2032)
- Table 60: Eastern Europe Global DRAM Market Y-o-Y Growth Rate Comparison by Country (2016-2032)
- Table 61: Eastern Europe Global DRAM Market Y-o-Y Growth Rate Comparison by Type (2016-2032)
- Table 62: Eastern Europe Global DRAM Market Y-o-Y Growth Rate Comparison by Technology (2016-2032)
- Table 63: Eastern Europe Global DRAM Market Y-o-Y Growth Rate Comparison by Application (2016-2032)
- Table 64: Eastern Europe Global DRAM Market Share Comparison by Country (2016-2032)
- Table 65: Eastern Europe Global DRAM Market Share Comparison by Type (2016-2032)
- Table 66: Eastern Europe Global DRAM Market Share Comparison by Technology (2016-2032)
- Table 67: Eastern Europe Global DRAM Market Share Comparison by Application (2016-2032)
- Table 68: APAC Global DRAM Market Comparison by Type (2016-2032)
- Table 69: APAC Global DRAM Market Comparison by Technology (2016-2032)
- Table 70: APAC Global DRAM Market Comparison by Application (2016-2032)
- Table 71: APAC Global DRAM Market Revenue (US$ Mn) Comparison by Country (2016-2032)
- Table 72: APAC Global DRAM Market Revenue (US$ Mn) (2016-2032)
- Table 73: APAC Global DRAM Market Revenue (US$ Mn) Comparison by Country (2016-2032)
- Table 74: APAC Global DRAM Market Revenue (US$ Mn) Comparison by Type (2016-2032)
- Table 75: APAC Global DRAM Market Revenue (US$ Mn) Comparison by Technology (2016-2032)
- Table 76: APAC Global DRAM Market Revenue (US$ Mn) Comparison by Application (2016-2032)
- Table 77: APAC Global DRAM Market Y-o-Y Growth Rate Comparison by Country (2016-2032)
- Table 78: APAC Global DRAM Market Y-o-Y Growth Rate Comparison by Type (2016-2032)
- Table 79: APAC Global DRAM Market Y-o-Y Growth Rate Comparison by Technology (2016-2032)
- Table 80: APAC Global DRAM Market Y-o-Y Growth Rate Comparison by Application (2016-2032)
- Table 81: APAC Global DRAM Market Share Comparison by Country (2016-2032)
- Table 82: APAC Global DRAM Market Share Comparison by Type (2016-2032)
- Table 83: APAC Global DRAM Market Share Comparison by Technology (2016-2032)
- Table 84: APAC Global DRAM Market Share Comparison by Application (2016-2032)
- Table 85: Latin America Global DRAM Market Comparison by Type (2016-2032)
- Table 86: Latin America Global DRAM Market Comparison by Technology (2016-2032)
- Table 87: Latin America Global DRAM Market Comparison by Application (2016-2032)
- Table 88: Latin America Global DRAM Market Revenue (US$ Mn) Comparison by Country (2016-2032)
- Table 89: Latin America Global DRAM Market Revenue (US$ Mn) (2016-2032)
- Table 90: Latin America Global DRAM Market Revenue (US$ Mn) Comparison by Country (2016-2032)
- Table 91: Latin America Global DRAM Market Revenue (US$ Mn) Comparison by Type (2016-2032)
- Table 92: Latin America Global DRAM Market Revenue (US$ Mn) Comparison by Technology (2016-2032)
- Table 93: Latin America Global DRAM Market Revenue (US$ Mn) Comparison by Application (2016-2032)
- Table 94: Latin America Global DRAM Market Y-o-Y Growth Rate Comparison by Country (2016-2032)
- Table 95: Latin America Global DRAM Market Y-o-Y Growth Rate Comparison by Type (2016-2032)
- Table 96: Latin America Global DRAM Market Y-o-Y Growth Rate Comparison by Technology (2016-2032)
- Table 97: Latin America Global DRAM Market Y-o-Y Growth Rate Comparison by Application (2016-2032)
- Table 98: Latin America Global DRAM Market Share Comparison by Country (2016-2032)
- Table 99: Latin America Global DRAM Market Share Comparison by Type (2016-2032)
- Table 100: Latin America Global DRAM Market Share Comparison by Technology (2016-2032)
- Table 101: Latin America Global DRAM Market Share Comparison by Application (2016-2032)
- Table 102: Middle East & Africa Global DRAM Market Comparison by Type (2016-2032)
- Table 103: Middle East & Africa Global DRAM Market Comparison by Technology (2016-2032)
- Table 104: Middle East & Africa Global DRAM Market Comparison by Application (2016-2032)
- Table 105: Middle East & Africa Global DRAM Market Revenue (US$ Mn) Comparison by Country (2016-2032)
- Table 106: Middle East & Africa Global DRAM Market Revenue (US$ Mn) (2016-2032)
- Table 107: Middle East & Africa Global DRAM Market Revenue (US$ Mn) Comparison by Country (2016-2032)
- Table 108: Middle East & Africa Global DRAM Market Revenue (US$ Mn) Comparison by Type (2016-2032)
- Table 109: Middle East & Africa Global DRAM Market Revenue (US$ Mn) Comparison by Technology (2016-2032)
- Table 110: Middle East & Africa Global DRAM Market Revenue (US$ Mn) Comparison by Application (2016-2032)
- Table 111: Middle East & Africa Global DRAM Market Y-o-Y Growth Rate Comparison by Country (2016-2032)
- Table 112: Middle East & Africa Global DRAM Market Y-o-Y Growth Rate Comparison by Type (2016-2032)
- Table 113: Middle East & Africa Global DRAM Market Y-o-Y Growth Rate Comparison by Technology (2016-2032)
- Table 114: Middle East & Africa Global DRAM Market Y-o-Y Growth Rate Comparison by Application (2016-2032)
- Table 115: Middle East & Africa Global DRAM Market Share Comparison by Country (2016-2032)
- Table 116: Middle East & Africa Global DRAM Market Share Comparison by Type (2016-2032)
- Table 117: Middle East & Africa Global DRAM Market Share Comparison by Technology (2016-2032)
- Table 118: Middle East & Africa Global DRAM Market Share Comparison by Application (2016-2032)
- 1. Executive Summary
-
- ABB Ltd
- Fujitsu
- Cypress Semiconductor Corp.
- Green Peak Technologies
- Honeywell International Inc.
- Levant Power Corporation
- Marlow Industries
- Microcheap Technology Inc.
- G24 Innopvations Ltd.
- SolarEdge Technologies Inc.
- Micron Technology Inc.
- Other Key Players
Our Clients


View Our Licence Options
