
Global Cycloplegic Agents Market By Mechanism (Atropine, Cyclopentolate, Cyclomidril, Phenylephrine), By Root (Oral, Topical), By Indication(Amblyopic Therapy, Palliative Care for Phthisis, Uveitis), By Distribution Channel (Hospital, Online, Retail), By Region And Companies - Industry Segment Outlook, Market Assessment, Competition Scenario, Trends, And Forecast 2023-2032
-
38204
-
June 2023
-
179
-


-
This report was compiled by Correspondence Linkedin | Detailed Market research Methodology Our methodology involves a mix of primary research, including interviews with leading mental health experts, and secondary research from reputable medical journals and databases. View Detailed Methodology Page
-
Quick Navigation
Report Overview
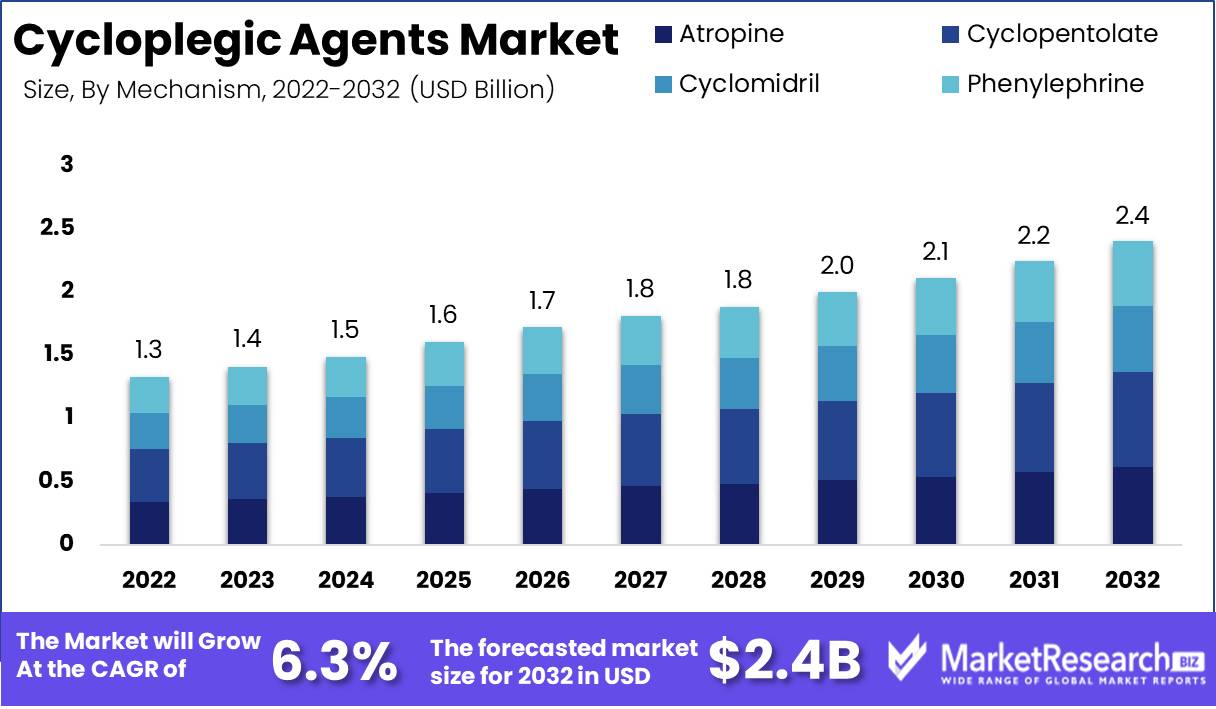
Global Cycloplegic Agents Market size is expected to be worth around USD 2.4 Bn by 2032 from USD 1.3 Bn in 2022, growing at a CAGR of 6.3% during the forecast period from 2023 to 2032.
Diverse industries, investors, and end-users have been captivated by the rapidly expanding and captivating global market for cycloplegic agents. This market is centered on the production and distribution of cycloplegic agents, which perform the dual function of pupil dilation and transient paralysis of the ciliary muscle, an essential eye muscle.
We learn that these drugs are used in a variety of eye examinations and surgeries as we delve deeper into this highly specialized market. Recent growth is attributable to the rising demand for sophisticated eye care treatments, as cycloplegic agents contribute to relieving eye strain and enhancing vision during examinations. In addition, their therapeutic applications include the treatment of a variety of eye conditions, including uveitis and iritis.
Significant innovations have permeated the global market for cycloplegic agents, giving it a new lease on life. The introduction of novel drugs has resulted in enhanced efficacy and diminished adverse effects. For many years, atropine was the preferred cycloplegic agent, but newer alternatives such as tropicamide and cyclopentolate have supplanted it due to their more favorable adverse effect profiles. Concurrently, innovative drug delivery systems, such as eye drops and ointments, have emerged, streamlining and simplifying the administration process.
The global market for cycloplegic agents has received a boost from a surge in investments. Significant resources have been invested by prominent pharmaceutical companies in the development of innovative drugs and delivery systems. Concurrently, these drugs have made their way into a plethora of eye care products and services, enhancing the overall efficacy of eye drops, ointments, and even the protocols implemented in eye care clinics and hospitals, where they are used for eye examinations and surgeries.
Multiple industries are funneling investments into the global market for cycloplegic agents, thereby enhancing its potential. At the vanguard of these investments, the pharmaceutical industry is actively engaged in the research, development, and marketing of drugs used in eye care treatments. Concurrently, the medical devices industry is actively investing in the development of cutting-edge drug delivery systems, with an emphasis on augmenting the administration process via innovations such as eye drops and ointments.
The ethical aspects surrounding the global market for cycloplegic agents warrant our attention, particularly in terms of transparency, explainability, and accountability. In the context of eye care treatments, patients must be kept apprised of the potential adverse effects and risks associated with drug use. In addition, it is essential to ensure the explainability of these drugs by providing patients with a thorough comprehension of their purpose, mechanism of action, and inherent risks and benefits.
The extensive scope of the global market for cycloplegic agents encompasses numerous business domains. Pharmaceutical companies are uniquely positioned to develop and market drugs tailored to eye care treatments, while eye care clinics and hospitals can utilize these drugs to optimize the efficacy of their eye examinations, surgical procedures, and therapeutic interventions. Concurrently, the medical device industry can invest in innovative drug delivery systems, transforming the administration landscape.
Driving factors
Global Cycloplegic Agents Market Growth Is Strong
The global market for cycloplegic agents is expanding and for good reason. Refractive errors, such as myopia and hyperopia, are becoming more prevalent worldwide. This has led to a surge in demand for cycloplegic tests, which accurately diagnose and treat these eye conditions. In addition, recent advances in ophthalmology have led to the development of more effective and efficient cycloplegic agents, thereby accelerating the growth of this market.
Regulatory Changes Influence the Market for Cycloplegic Agents
The market for cycloplegic agents may be impacted in the immediate future, however, by a number of potential regulatory changes. For instance, the FDA is considering imposing stricter requirements for the approval of new medicines, which could impede the development and adoption of new cycloplegic agents. Despite this, the overall outlook for this market remains optimistic, as numerous emerging technologies have the potential to have a significant impact on the industry.
AI Transforms Cycloplegic Treatments Future Prospects
One such technology is artificial intelligence, which is currently used to aid in the diagnosis and treatment of eye diseases. With additional AI advancements, it may be possible to create cycloplegic remedies that are more precise and individualized for each patient. In addition, there are a number of potential disruptors that may alter the competitive landscape in this market, such as the emergence of new drug delivery methods and the entrance of new participants.
Market Dynamics for Cycloplegic Agents Shifting Consumer Behavior
Finally, it is important to note that emerging trends and changes in consumer behavior may have an impact on the market for cycloplegic agents. For instance, an increasing number of individuals are choosing corrective eye surgery over spectacles or contacts. This may appear to be a threat to the market for cycloplegic agents, but it may present new opportunities for companies that can develop effective and safe post-operative remedies.
Restraining Factors
Global Market for Cycloplegic Agents Side Effect Difficulties
Side effects are one of the most significant restraints on the global cycloplegic agents market. Typical side effects of eye drops used to dilate the pupil are red eyes, dry saliva, blurred vision, and light sensitivity. In addition, long-term use of certain drugs can lead to more severe side effects such as hypertension, vertigo, and nausea. Due to these side effects, many people avoid using eye drops, which leads to a decrease in the pool of potential customers.
Patient Compliance Issues Cycloplegic Agents
The term patient compliance challenges refer to the difficulties encountered by patients who have been prescribed medication but do not follow the instructions. It can be challenging for many patients to accurately follow the dosage regimen for cycloplegic agents. This reduces the medication's effectiveness and may also cause unwanted side effects. Lack of patient compliance is also a significant challenge for healthcare providers who must ensure patients strictly follow instructions. In turn, this impacts the total market potential for these drugs.
Regulatory Obstacles in the Market for Cycloplegic Agents
Regulatory requirements play an important role in the market for cycloplegic agents. A strong regulatory authority oversees the evaluation and approval of drugs, and stringent regulatory requirements can delay or, in the worst-case scenario, prevent drug approval altogether. In addition, regulatory requirements add a significant layer of complexity to the process of obtaining approval for a drug, which can lead to a delay in product launch.
Competitive Environment for Cycloplegic Agents
The market for cycloplegic agents is extremely competitive, with numerous players competing for the same market share. Due to their existing customer base, brand value, and capital, established players have a significant advantage over new entrants. This makes it challenging for new players to enter the market and establish themselves.
Mechanism Analysis
The global market for cycloplegic agents is segmented into cyclopentolate, tropicamide, and homatropine. Due to its efficiency in temporarily paralyzing the ciliary muscles and dilating the pupils, the cyclopentolate segment leads the global market segment. Cyclopentolate-based cycloplegic agents dominate other segments due to their easy availability and low cost.
The increasing economies of India and China have been driving the cyclopentolate segment increase. Along with the rise in the aging population, there has been a rise in the prevalence of eye disorders such as myopia, hyperopia, and astigmatism in these economies. As a result, demand for eye exams and procedures has increased, providing a great chance for the cyclopentolate segment to grow in these regions.
The cyclopentolate segment is mostly used by ophthalmologists, optometrists, and hospitals for cycloplegic treatments. The increasing awareness of eye health has led to an increase in demand for ophthalmic medications, particularly cycloplegic agents, resulting in higher sales and revenue for the cyclopentolate segment.
The demand for eye exams and surgeries is rising, thus ophthalmologists and optometrists are using cycloplegic agents to help with their treatments, especially in emerging economies. The cyclopentolate segment, which is the most effective of all the segments in the global cycloplegic agents market, is anticipated to develop at the quickest rate in the coming years. The simple availability of generic cyclopentolate formulations at low rates is expected to attract a wider audience, fueling the segment's growth in the global cycloplegic agents market.
Root Analysis
The oral segment of the global cycloplegic agents market involves oral administration of the medicine in liquid or tablet form. The oral segment dominates the global market due to its cost-effectiveness, ease of administration, and relative safety compared to other drug delivery routes.
Emerging countries' economic growth has led to an increase in the prevalence of eye disorders, driving demand for cycloplegic agents. Oral cycloplegic agents dominate the global market segment. The vast availability of oral formulations in various dosages and ease of administration have made it a popular choice among ophthalmologists and optometrists, particularly in emerging economies.
Hospitals, clinics, and patients with cycloplegic eye disorders who require cycloplegic operations make up the bulk of the oral segment's consumers. The ease with which oral formulations of cycloplegic agents can be delivered has made the oral segment a favored choice among consumers.
Growing demand for oral cycloplegic agents has been led by increased awareness of eye health and the necessity for routine eye exams, especially in emerging economies. This, together with the cost-effectiveness of cycloplegic formulations, has led to the cycloplegic segment's dominance in the global cycloplegic agents market.
Indication Analysis
Uveitis affects the middle layer of the eye, the uvea, and can lead to blindness. The uveitis segment dominates the global cycloplegic agents market because they are crucial for treating uveitis symptoms such as discomfort, light sensitivity, and tissue damage.
Emerging economies now prioritize population health. Uveitis is a growing problem across all ages due to the ease of autoimmune and viral disorders. This has led to an increase in medical services and cures, providing the uveitis segment with a large increase in the global cycloplegic agents market.
Uveitis is a serious condition that can lead to blindness and requires prompt medical intervention. Consumers of the uveitis segment include mostly hospitals, ophthalmologists, and those who suffer from the condition.
Consumer behavior has been influenced by uveitis, driving the growth of the uveitis segment in the global cycloplegic agents market. This is due to increased awareness of eye health and the desire to prevent vision loss caused by uveitis.
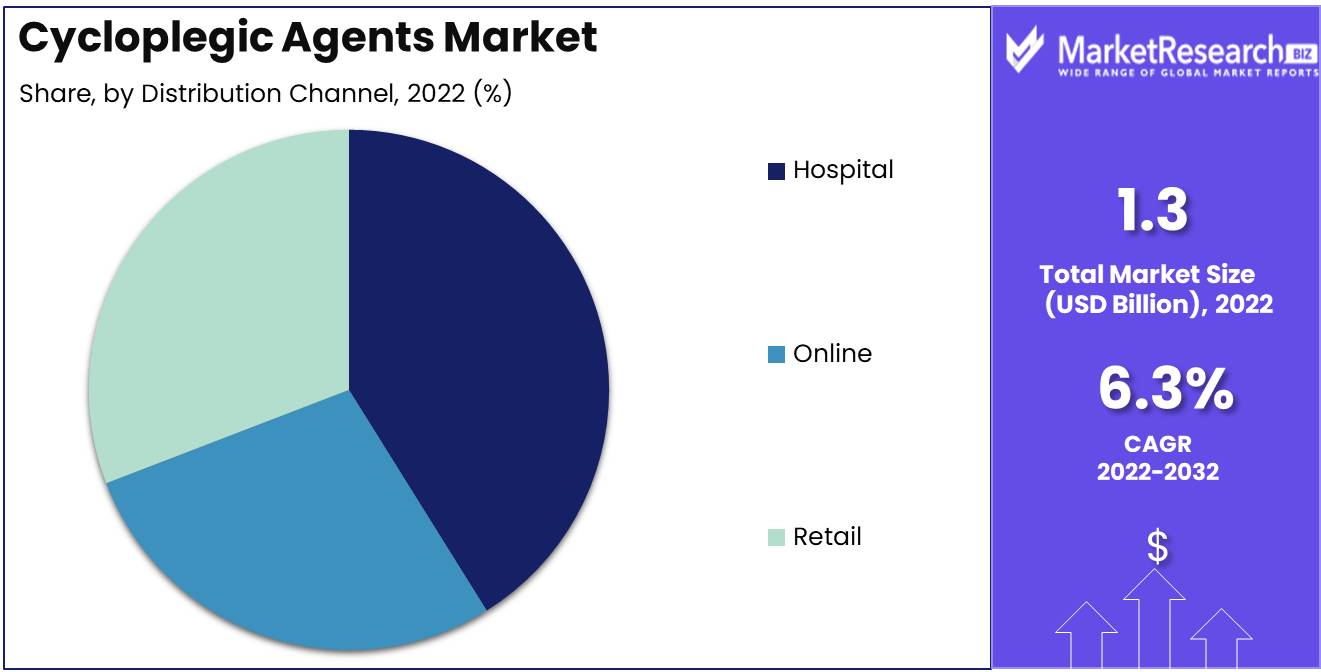
Distribution Channel Analysis
The global market for cycloplegic agents is segmented into hospitals, ophthalmology clinics, and others. The hospital segment dominates the global market due to providing eye disorders. Hospitals contain advanced medical technology, specialists, and support services to treat eye disorders quickly.
Emerging economies have seen an increase in medical service development. The rise in the prevalence of eye disorders in emerging nations has led to the development of more hospitals and clinics, which has significantly increased the growth of the hospital segment in the global cycloplegic agents market.
Consumers in the hospital segment have eye disorders. The demand for medical services linked to eye disorders has increased as a result of the global cycloplegic agents market's growing awareness of eye health, which has fueled the growth of the hospital segment.
The availability of advanced medical equipment and specialists has helped facilitate the timely diagnosis and treatment of eye disorders, further driving consumer behavior toward hospitals and fueling the growth of the hospital segment in the global cycloplegic agents market.
Key Market Segments
By Mechanism
- Atropine
- Cyclopentolate
- Cyclomidril
- Phenylephrine
By Root
- Oral
- Topical
By Indication
- Amblyopic Therapy
- Palliative Care for Phthisis
- Uveitis
By Distribution Channel
- Hospital
- Online
- Retail
Growth Opportunity
Demand for Cycloplegic Agents Fuels Market Growth
The global cycloplegic agents market has grown rapidly in recent years and is likely to continue growing. Cycloplegic agents are in demand because myopia and hyperopia are rising.
Safer Agents Fuel Global Cycloplegic Market Growth
Safer, patient-friendly agents, expanded product portfolios, collaborations, education, and other factors are driving market expansion. In this piece, we'll examine how each of these factors has been instrumental in shaping the global cycloplegic agents market.
Adding Products Market Cycloplegic Agents
Recent developments in cycloplegic medicines with fewer adverse effects have boosted the global market. Manufacturers have reduced the severe negative effects of earlier agents. The newest drugs are mildly concentrated for patient comfort.
Collaborations Create Cycloplegic Agents
There has been great progress in the development of new formulations and products as manufacturers try to meet demand. Product portfolios have grown at a healthy rate, which has resulted in increased market rivalry. Product differentiation, pricing, branding, and strategic alliances have helped manufacturers increase product penetration.
Education Boosts Cycloplegic Agents' Market Growth.
Collaboration among manufacturers resulted in the pooling of resources, experience, and knowledge. This led to the development of more effective cycloplegic drugs. This has driven the worldwide cycloplegic agents market, and as collaborations continue, we may expect better products.
Latest Trends
Adaptive Ophthalmology Rise of Cycloplegic Agents
As the healthcare industry continues to evolve, the importance of cycloplegic agents in the field of ophthalmology has grown. In recent years, the global market for cycloplegic agents has expanded significantly due to the introduction of a novel combination of eye drops and agents with a shorter duration of action. In addition, there is a growing interest in teleophthalmology integration and individualized protocols, which are anticipated to influence the industry's future.
Combination Eye Drops Offer Effectiveness and Convenience
Combination eye drops have become a popular option for healthcare professionals. These eye drops contain a combination of two or more medications for a rapid onset of action and prolonged duration of effect. Due to their efficacy and convenience, the use of combination eye drops has increased in popularity, as they provide a more practicable alternative to administering several individual drops to patients. The treatment of ocular inflammation, dilation, and cycloplegia with a combination of eye drops has been shown to be effective.
Shorter-Acting Agents Transform Therapy
In recent years, there has also been an increase in the use of agents with a shorter duration of action. Traditional cycloplegic agents are notorious for their long duration of action, which makes them unsuitable for certain patient populations, such as children. Shorter-acting agents have the benefit of a quicker onset of action and a shorter duration of effect, which reduces the likelihood of undesirable side effects. Significant progress has been made in the field with the introduction of these agents, which offer healthcare professionals greater dosing and administration flexibility.
Transformation of Teleophthalmology Remote Treatment
In recent years, teleophthalmology integration has been a thrilling development that has altered how healthcare professionals provide medical care. Teleophthalmology is the utilization of telecommunication technologies to provide remote medical consultations and assessments. This technology has made it easier for medical professionals to consult with and treat patients regardless of their location. Teleophthalmology has been instrumental in expanding access to specialized care, especially in underserved and remote areas.
Protocols that are Personalized Improve Patient Outcomes.
In the field of ophthalmology, customized protocols are also gaining significance. These protocols permit healthcare professionals to tailor their treatment plans to the unique requirements of individual patients. This has been instrumental in enhancing patient outcomes, as it enables more individualized and targeted treatment. It has also been shown that customized protocols reduce the risk of adverse events and increase patient satisfaction.
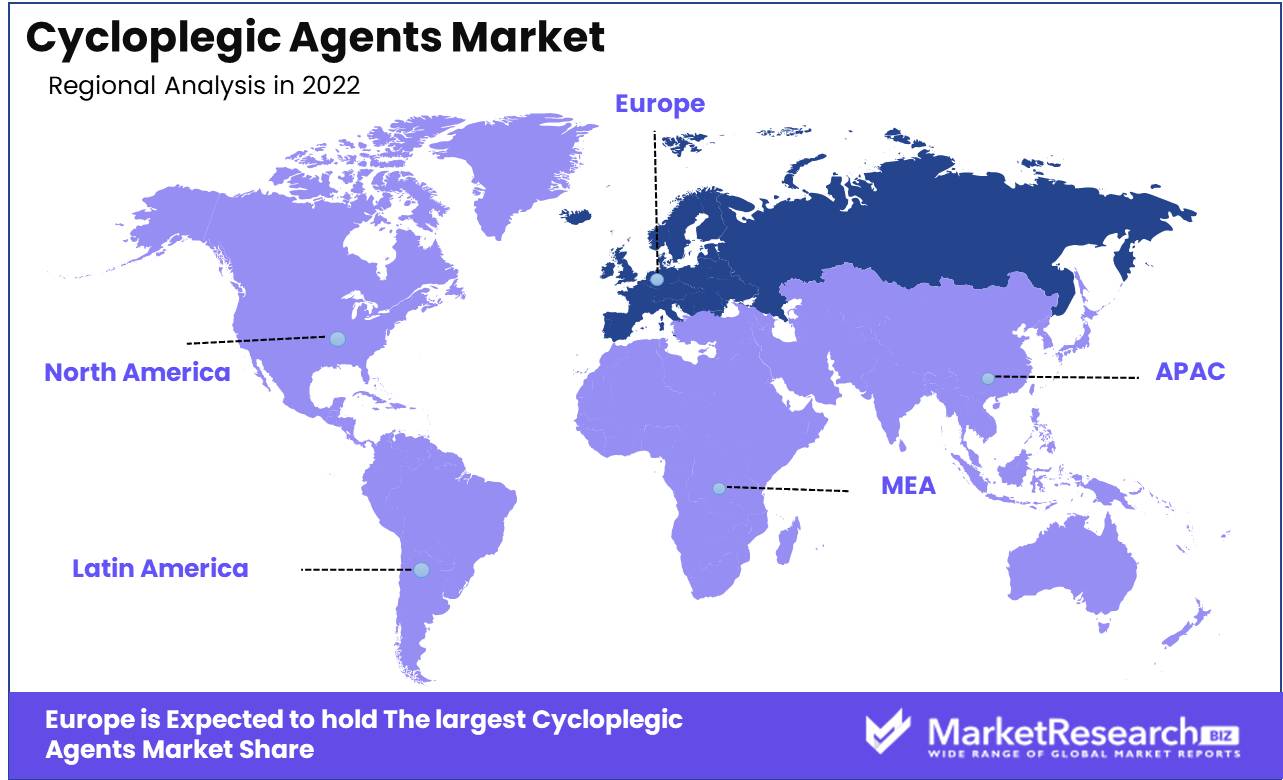
Regional Analysis
Europe dominates the market for cycloplegic agents. As the global healthcare industry continues to expand, the use of cycloplegic agents in ophthalmology has become increasingly significant. These agents are utilized to paralyze the ciliary muscles in the eye, allowing for a more thorough examination of the eye.
In recent years, the use of cycloplegic agents has increased in Europe, which now dominates the market in comparison with other regions. This is due to a number of factors, including technological advancements and increased investment in the healthcare industry.
Europe's dominance in the cycloplegic agents market is largely attributable to the presence of a number of significant pharmaceutical companies in the region. These companies are able to invest significantly in research and development, allowing them to produce cycloplegic agents of superior quality and effectiveness.
The increasing demand for ophthalmic treatments and procedures in the region is another factor contributing to Europe's dominance in the market. In Europe, there is a growing demand for effective cycloplegic agents due to the aging of the population and the increasing prevalence of vision-related diseases such as myopia and cataracts.
In addition, the increasing use of advanced technologies such as optical coherence tomography (OCT) and fundus photography has contributed to the expansion of the cycloplegic agents market in Europe. These technologies have allowed ophthalmologists to more accurately diagnose and treat a variety of eye conditions, thereby increasing the demand for effective cycloplegic agents.
Key Regions and Countries
North America
- US
- Canada
- Mexico
Western Europe
- Germany
- France
- The UK
- Spain
- Italy
- Portugal
- Ireland
- Austria
- Switzerland
- Benelux
- Nordic
- Rest of Western Europe
Eastern Europe
- Russia
- Poland
- The Czech Republic
- Greece
- Rest of Eastern Europe
APAC
- China
- Japan
- South Korea
- India
- Australia & New Zealand
- Indonesia
- Malaysia
- Philippines
- Singapore
- Thailand
- Vietnam
- Rest of APAC
Latin America
- Brazil
- Colombia
- Chile
- Argentina
- Costa Rica
- Rest of Latin America
Middle East & Africa
- Algeria
- Egypt
- Israel
- Kuwait
- Nigeria
- Saudi Arabia
- South Africa
- Turkey
- United Arab Emirates
- Rest of MEA
Key Players Analysis
Several major players compete in the global cycloplegic agents market. To introduce new drugs and increase market share, these players are actively researching and developing. Novartis International AG, Alcon Inc., Bausch Health Companies, Inc., Santen Pharmaceutical Co. Ltd., and Akorn, Inc. are among the market's top players.
Due to its extensive range of products and excellent distribution network, Novartis International AG is one of the top players in the global cycloplegic agents market. Alcon Inc., a subsidiary of the company, offers a range of ophthalmic products, including cycloplegic agents.
Bausch Health Companies, Inc., formerly Valeant Pharmaceuticals International, is another global market leader. The company offers ophthalmic products such as cycloplegic agents like cyclopentolate.
Japan-based Santen Pharmaceutical Co. Ltd. develops, markets, and researches ophthalmic drugs. Its cycloplegic agents, such as atropine sulfate, are among the company's best-selling products and are utilized in pediatric and adult eye exams.
Akorn, Inc., a US pharmaceutical company, offers a wide range of ophthalmic products, including cycloplegic agents like tropicamide and cyclopentolate. The company's global market position is maintained by product innovation and strategic collaborations.
The global cycloplegic agents market is extremely competitive, and these main players are projected to dominate it in the future years with their innovation, product development, and growth strategies.
Top Key Players in Cycloplegic Agents Market
- Pfizer Inc. (U.S.)
- Novartis International AG
- Alcon Inc.
- Bausch Health Companies, Inc.
- Santen Pharmaceutical Co. Ltd.
- Akorn, Inc.
- Novartis International AG
- Henry Schein, Inc (U.S.)
- Actiza Pharmaceutical Private Limited (India)
- hameln pharma gmbh (Germany)
- Sigma Pharmaceuticals, LLC (U.S.)
- Biomedica (India)
- Prudence Pharma Chem (India)
- Heer Pharma Pvt. Ltd. (India)
- Fresenius Kabi AG (Germany)
- Other Key Players
Recent Development
- In 2023, Personalized Protocols and Cycloplegic Agents will be available. In recent years, ophthalmology has placed a greater emphasis on personalized treatment protocols, including the use of cycloplegic agents.
- In 2022, Advancements in Drug Delivery Systems Significant advancements have been made in cycloplegic drug delivery systems.
- In 2021, Teleophthalmology Integration and Cycloplegic Agents Cycloplegic agents became increasingly integrated into teleophthalmology practices.
- In 2020, There was a notable shift towards the use of cycloplegic agents with a reduced duration of action, and reduced-Acting Agents for Enhanced Flexibility.
- In 2019, the healthcare industry witnessed the introduction of novel combination eye drops to treat cycloplegia.
Report Scope:
Report Features Description Market Value (2022) USD 1.3 Bn Forecast Revenue (2032) USD 2.4 Bn CAGR (2023-2032) 6.3% Base Year for Estimation 2022 Historic Period 2016-2022 Forecast Period 2023-2032 Report Coverage Revenue Forecast, Market Dynamics, COVID-19 Impact, Competitive Landscape, Recent Developments Segments Covered By Mechanism (Atropine, Cyclopentolate, Cyclomidril, Phenylephrine), By Root (Oral, Topical), By Indication (Amblyopic Therapy, Palliative Care for Phthisis, Uveitis), By Distribution Channel (Hospital, Online, Retail) Regional Analysis North America – The US, Canada, & Mexico; Western Europe – Germany, France, The UK, Spain, Italy, Portugal, Ireland, Austria, Switzerland, Benelux, Nordic, & Rest of Western Europe; Eastern Europe – Russia, Poland, The Czech Republic, Greece, & Rest of Eastern Europe; APAC – China, Japan, South Korea, India, Australia & New Zealand, Indonesia, Malaysia, Philippines, Singapore, Thailand, Vietnam, & Rest of APAC; Latin America – Brazil, Colombia, Chile, Argentina, Costa Rica, & Rest of Latin America; Middle East & Africa – Algeria, Egypt, Israel, Kuwait, Nigeria, Saudi Arabia, South Africa, Turkey, United Arab Emirates, & Rest of MEA Competitive Landscape Pfizer Inc. (U.S.), Novartis International AG, Alcon Inc., Bausch Health Companies, Inc., Santen Pharmaceutical Co. Ltd., Akorn, Inc., Novartis International AG, Henry Schein, Inc (U.S.), Actiza Pharmaceutical Private Limited (India), hameln pharma gmbh (Germany), Sigma Pharmaceuticals, LLC (U.S.), Biomedica (India), Prudence Pharma Chem (India), Heer Pharma Pvt. Ltd. (India), Fresenius Kabi AG (Germany), Other Key Players Customization Scope Customization for segments, region/country-level will be provided. Moreover, additional customization can be done based on the requirements. Purchase Options We have three licenses to opt for: Single User License, Multi-User License (Up to 5 Users), Corporate Use License (Unlimited User and Printable PDF) -
- 1. Executive Summary
- 1.1. Definition
- 1.2. Taxonomy
- 1.3. Research Scope
- 1.4. Key Analysis
- 1.5. Key Findings by Major Segments
- 1.6. Top strategies by Major Players
- 2. Global Cycloplegic Agents Market Overview
- 2.1. Cycloplegic Agents Market Dynamics
- 2.1.1. Drivers
- 2.1.2. Opportunities
- 2.1.3. Restraints
- 2.1.4. Challenges
- 2.2. Macro-economic Factors
- 2.3. Regulatory Framework
- 2.4. Market Investment Feasibility Index
- 2.5. PEST Analysis
- 2.6. PORTER’S Five Force Analysis
- 2.7. Drivers & Restraints Impact Analysis
- 2.8. Industry Chain Analysis
- 2.9. Cost Structure Analysis
- 2.10. Marketing Strategy
- 2.11. Russia-Ukraine War Impact Analysis
- 2.12. Opportunity Map Analysis
- 2.13. Market Competition Scenario Analysis
- 2.14. Product Life Cycle Analysis
- 2.15. Opportunity Orbits
- 2.16. Manufacturer Intensity Map
- 2.17. Major Companies sales by Value & Volume
- 2.1. Cycloplegic Agents Market Dynamics
- 3. Global Cycloplegic Agents Market Analysis, Opportunity and Forecast, 2016-2032
- 3.1. Global Cycloplegic Agents Market Analysis, 2016-2021
- 3.2. Global Cycloplegic Agents Market Opportunity and Forecast, 2023-2032
- 3.3. Global Cycloplegic Agents Market Analysis, Opportunity and Forecast, By By Mechanism , 2016-2032
- 3.3.1. Global Cycloplegic Agents Market Analysis by By Mechanism : Introduction
- 3.3.2. Market Size Absolute $ Opportunity Analysis and Forecast, By By Mechanism , 2016-2032
- 3.3.3. Atropine
- 3.3.4. Cyclopentolate
- 3.3.5. Cyclomidril
- 3.3.6. Phenylephrine
- 3.4. Global Cycloplegic Agents Market Analysis, Opportunity and Forecast, By By Root, 2016-2032
- 3.4.1. Global Cycloplegic Agents Market Analysis by By Root: Introduction
- 3.4.2. Market Size Absolute $ Opportunity Analysis and Forecast, By By Root, 2016-2032
- 3.4.3. Oral
- 3.4.4. Topical
- 3.5. Global Cycloplegic Agents Market Analysis, Opportunity and Forecast, By By Indication, 2016-2032
- 3.5.1. Global Cycloplegic Agents Market Analysis by By Indication: Introduction
- 3.5.2. Market Size Absolute $ Opportunity Analysis and Forecast, By By Indication, 2016-2032
- 3.5.3. Amblyopic Therapy
- 3.5.4. Palliative Care for Phthisis
- 3.5.5. Uveitis
- 3.6. Global Cycloplegic Agents Market Analysis, Opportunity and Forecast, By By Distribution Channel, 2016-2032
- 3.6.1. Global Cycloplegic Agents Market Analysis by By Distribution Channel: Introduction
- 3.6.2. Market Size Absolute $ Opportunity Analysis and Forecast, By By Distribution Channel, 2016-2032
- 3.6.3. Hospital
- 3.6.4. Online
- 3.6.5. Retail
- 4. North America Cycloplegic Agents Market Analysis, Opportunity and Forecast, 2016-2032
- 4.1. North America Cycloplegic Agents Market Analysis, 2016-2021
- 4.2. North America Cycloplegic Agents Market Opportunity and Forecast, 2023-2032
- 4.3. North America Cycloplegic Agents Market Analysis, Opportunity and Forecast, By By Mechanism , 2016-2032
- 4.3.1. North America Cycloplegic Agents Market Analysis by By Mechanism : Introduction
- 4.3.2. Market Size Absolute $ Opportunity Analysis and Forecast, By By Mechanism , 2016-2032
- 4.3.3. Atropine
- 4.3.4. Cyclopentolate
- 4.3.5. Cyclomidril
- 4.3.6. Phenylephrine
- 4.4. North America Cycloplegic Agents Market Analysis, Opportunity and Forecast, By By Root, 2016-2032
- 4.4.1. North America Cycloplegic Agents Market Analysis by By Root: Introduction
- 4.4.2. Market Size Absolute $ Opportunity Analysis and Forecast, By By Root, 2016-2032
- 4.4.3. Oral
- 4.4.4. Topical
- 4.5. North America Cycloplegic Agents Market Analysis, Opportunity and Forecast, By By Indication, 2016-2032
- 4.5.1. North America Cycloplegic Agents Market Analysis by By Indication: Introduction
- 4.5.2. Market Size Absolute $ Opportunity Analysis and Forecast, By By Indication, 2016-2032
- 4.5.3. Amblyopic Therapy
- 4.5.4. Palliative Care for Phthisis
- 4.5.5. Uveitis
- 4.6. North America Cycloplegic Agents Market Analysis, Opportunity and Forecast, By By Distribution Channel, 2016-2032
- 4.6.1. North America Cycloplegic Agents Market Analysis by By Distribution Channel: Introduction
- 4.6.2. Market Size Absolute $ Opportunity Analysis and Forecast, By By Distribution Channel, 2016-2032
- 4.6.3. Hospital
- 4.6.4. Online
- 4.6.5. Retail
- 4.7. North America Cycloplegic Agents Market Analysis, Opportunity and Forecast, By Country , 2016-2032
- 4.7.1. North America Cycloplegic Agents Market Analysis by Country : Introduction
- 4.7.2. Market Size Absolute $ Opportunity Analysis and Forecast, Country , 2016-2032
- 4.7.2.1. The US
- 4.7.2.2. Canada
- 4.7.2.3. Mexico
- 5. Western Europe Cycloplegic Agents Market Analysis, Opportunity and Forecast, 2016-2032
- 5.1. Western Europe Cycloplegic Agents Market Analysis, 2016-2021
- 5.2. Western Europe Cycloplegic Agents Market Opportunity and Forecast, 2023-2032
- 5.3. Western Europe Cycloplegic Agents Market Analysis, Opportunity and Forecast, By By Mechanism , 2016-2032
- 5.3.1. Western Europe Cycloplegic Agents Market Analysis by By Mechanism : Introduction
- 5.3.2. Market Size Absolute $ Opportunity Analysis and Forecast, By By Mechanism , 2016-2032
- 5.3.3. Atropine
- 5.3.4. Cyclopentolate
- 5.3.5. Cyclomidril
- 5.3.6. Phenylephrine
- 5.4. Western Europe Cycloplegic Agents Market Analysis, Opportunity and Forecast, By By Root, 2016-2032
- 5.4.1. Western Europe Cycloplegic Agents Market Analysis by By Root: Introduction
- 5.4.2. Market Size Absolute $ Opportunity Analysis and Forecast, By By Root, 2016-2032
- 5.4.3. Oral
- 5.4.4. Topical
- 5.5. Western Europe Cycloplegic Agents Market Analysis, Opportunity and Forecast, By By Indication, 2016-2032
- 5.5.1. Western Europe Cycloplegic Agents Market Analysis by By Indication: Introduction
- 5.5.2. Market Size Absolute $ Opportunity Analysis and Forecast, By By Indication, 2016-2032
- 5.5.3. Amblyopic Therapy
- 5.5.4. Palliative Care for Phthisis
- 5.5.5. Uveitis
- 5.6. Western Europe Cycloplegic Agents Market Analysis, Opportunity and Forecast, By By Distribution Channel, 2016-2032
- 5.6.1. Western Europe Cycloplegic Agents Market Analysis by By Distribution Channel: Introduction
- 5.6.2. Market Size Absolute $ Opportunity Analysis and Forecast, By By Distribution Channel, 2016-2032
- 5.6.3. Hospital
- 5.6.4. Online
- 5.6.5. Retail
- 5.7. Western Europe Cycloplegic Agents Market Analysis, Opportunity and Forecast, By Country , 2016-2032
- 5.7.1. Western Europe Cycloplegic Agents Market Analysis by Country : Introduction
- 5.7.2. Market Size Absolute $ Opportunity Analysis and Forecast, Country , 2016-2032
- 5.7.2.1. Germany
- 5.7.2.2. France
- 5.7.2.3. The UK
- 5.7.2.4. Spain
- 5.7.2.5. Italy
- 5.7.2.6. Portugal
- 5.7.2.7. Ireland
- 5.7.2.8. Austria
- 5.7.2.9. Switzerland
- 5.7.2.10. Benelux
- 5.7.2.11. Nordic
- 5.7.2.12. Rest of Western Europe
- 6. Eastern Europe Cycloplegic Agents Market Analysis, Opportunity and Forecast, 2016-2032
- 6.1. Eastern Europe Cycloplegic Agents Market Analysis, 2016-2021
- 6.2. Eastern Europe Cycloplegic Agents Market Opportunity and Forecast, 2023-2032
- 6.3. Eastern Europe Cycloplegic Agents Market Analysis, Opportunity and Forecast, By By Mechanism , 2016-2032
- 6.3.1. Eastern Europe Cycloplegic Agents Market Analysis by By Mechanism : Introduction
- 6.3.2. Market Size Absolute $ Opportunity Analysis and Forecast, By By Mechanism , 2016-2032
- 6.3.3. Atropine
- 6.3.4. Cyclopentolate
- 6.3.5. Cyclomidril
- 6.3.6. Phenylephrine
- 6.4. Eastern Europe Cycloplegic Agents Market Analysis, Opportunity and Forecast, By By Root, 2016-2032
- 6.4.1. Eastern Europe Cycloplegic Agents Market Analysis by By Root: Introduction
- 6.4.2. Market Size Absolute $ Opportunity Analysis and Forecast, By By Root, 2016-2032
- 6.4.3. Oral
- 6.4.4. Topical
- 6.5. Eastern Europe Cycloplegic Agents Market Analysis, Opportunity and Forecast, By By Indication, 2016-2032
- 6.5.1. Eastern Europe Cycloplegic Agents Market Analysis by By Indication: Introduction
- 6.5.2. Market Size Absolute $ Opportunity Analysis and Forecast, By By Indication, 2016-2032
- 6.5.3. Amblyopic Therapy
- 6.5.4. Palliative Care for Phthisis
- 6.5.5. Uveitis
- 6.6. Eastern Europe Cycloplegic Agents Market Analysis, Opportunity and Forecast, By By Distribution Channel, 2016-2032
- 6.6.1. Eastern Europe Cycloplegic Agents Market Analysis by By Distribution Channel: Introduction
- 6.6.2. Market Size Absolute $ Opportunity Analysis and Forecast, By By Distribution Channel, 2016-2032
- 6.6.3. Hospital
- 6.6.4. Online
- 6.6.5. Retail
- 6.7. Eastern Europe Cycloplegic Agents Market Analysis, Opportunity and Forecast, By Country , 2016-2032
- 6.7.1. Eastern Europe Cycloplegic Agents Market Analysis by Country : Introduction
- 6.7.2. Market Size Absolute $ Opportunity Analysis and Forecast, Country , 2016-2032
- 6.7.2.1. Russia
- 6.7.2.2. Poland
- 6.7.2.3. The Czech Republic
- 6.7.2.4. Greece
- 6.7.2.5. Rest of Eastern Europe
- 7. APAC Cycloplegic Agents Market Analysis, Opportunity and Forecast, 2016-2032
- 7.1. APAC Cycloplegic Agents Market Analysis, 2016-2021
- 7.2. APAC Cycloplegic Agents Market Opportunity and Forecast, 2023-2032
- 7.3. APAC Cycloplegic Agents Market Analysis, Opportunity and Forecast, By By Mechanism , 2016-2032
- 7.3.1. APAC Cycloplegic Agents Market Analysis by By Mechanism : Introduction
- 7.3.2. Market Size Absolute $ Opportunity Analysis and Forecast, By By Mechanism , 2016-2032
- 7.3.3. Atropine
- 7.3.4. Cyclopentolate
- 7.3.5. Cyclomidril
- 7.3.6. Phenylephrine
- 7.4. APAC Cycloplegic Agents Market Analysis, Opportunity and Forecast, By By Root, 2016-2032
- 7.4.1. APAC Cycloplegic Agents Market Analysis by By Root: Introduction
- 7.4.2. Market Size Absolute $ Opportunity Analysis and Forecast, By By Root, 2016-2032
- 7.4.3. Oral
- 7.4.4. Topical
- 7.5. APAC Cycloplegic Agents Market Analysis, Opportunity and Forecast, By By Indication, 2016-2032
- 7.5.1. APAC Cycloplegic Agents Market Analysis by By Indication: Introduction
- 7.5.2. Market Size Absolute $ Opportunity Analysis and Forecast, By By Indication, 2016-2032
- 7.5.3. Amblyopic Therapy
- 7.5.4. Palliative Care for Phthisis
- 7.5.5. Uveitis
- 7.6. APAC Cycloplegic Agents Market Analysis, Opportunity and Forecast, By By Distribution Channel, 2016-2032
- 7.6.1. APAC Cycloplegic Agents Market Analysis by By Distribution Channel: Introduction
- 7.6.2. Market Size Absolute $ Opportunity Analysis and Forecast, By By Distribution Channel, 2016-2032
- 7.6.3. Hospital
- 7.6.4. Online
- 7.6.5. Retail
- 7.7. APAC Cycloplegic Agents Market Analysis, Opportunity and Forecast, By Country , 2016-2032
- 7.7.1. APAC Cycloplegic Agents Market Analysis by Country : Introduction
- 7.7.2. Market Size Absolute $ Opportunity Analysis and Forecast, Country , 2016-2032
- 7.7.2.1. China
- 7.7.2.2. Japan
- 7.7.2.3. South Korea
- 7.7.2.4. India
- 7.7.2.5. Australia & New Zeland
- 7.7.2.6. Indonesia
- 7.7.2.7. Malaysia
- 7.7.2.8. Philippines
- 7.7.2.9. Singapore
- 7.7.2.10. Thailand
- 7.7.2.11. Vietnam
- 7.7.2.12. Rest of APAC
- 8. Latin America Cycloplegic Agents Market Analysis, Opportunity and Forecast, 2016-2032
- 8.1. Latin America Cycloplegic Agents Market Analysis, 2016-2021
- 8.2. Latin America Cycloplegic Agents Market Opportunity and Forecast, 2023-2032
- 8.3. Latin America Cycloplegic Agents Market Analysis, Opportunity and Forecast, By By Mechanism , 2016-2032
- 8.3.1. Latin America Cycloplegic Agents Market Analysis by By Mechanism : Introduction
- 8.3.2. Market Size Absolute $ Opportunity Analysis and Forecast, By By Mechanism , 2016-2032
- 8.3.3. Atropine
- 8.3.4. Cyclopentolate
- 8.3.5. Cyclomidril
- 8.3.6. Phenylephrine
- 8.4. Latin America Cycloplegic Agents Market Analysis, Opportunity and Forecast, By By Root, 2016-2032
- 8.4.1. Latin America Cycloplegic Agents Market Analysis by By Root: Introduction
- 8.4.2. Market Size Absolute $ Opportunity Analysis and Forecast, By By Root, 2016-2032
- 8.4.3. Oral
- 8.4.4. Topical
- 8.5. Latin America Cycloplegic Agents Market Analysis, Opportunity and Forecast, By By Indication, 2016-2032
- 8.5.1. Latin America Cycloplegic Agents Market Analysis by By Indication: Introduction
- 8.5.2. Market Size Absolute $ Opportunity Analysis and Forecast, By By Indication, 2016-2032
- 8.5.3. Amblyopic Therapy
- 8.5.4. Palliative Care for Phthisis
- 8.5.5. Uveitis
- 8.6. Latin America Cycloplegic Agents Market Analysis, Opportunity and Forecast, By By Distribution Channel, 2016-2032
- 8.6.1. Latin America Cycloplegic Agents Market Analysis by By Distribution Channel: Introduction
- 8.6.2. Market Size Absolute $ Opportunity Analysis and Forecast, By By Distribution Channel, 2016-2032
- 8.6.3. Hospital
- 8.6.4. Online
- 8.6.5. Retail
- 8.7. Latin America Cycloplegic Agents Market Analysis, Opportunity and Forecast, By Country , 2016-2032
- 8.7.1. Latin America Cycloplegic Agents Market Analysis by Country : Introduction
- 8.7.2. Market Size Absolute $ Opportunity Analysis and Forecast, Country , 2016-2032
- 8.7.2.1. Brazil
- 8.7.2.2. Colombia
- 8.7.2.3. Chile
- 8.7.2.4. Argentina
- 8.7.2.5. Costa Rica
- 8.7.2.6. Rest of Latin America
- 9. Middle East & Africa Cycloplegic Agents Market Analysis, Opportunity and Forecast, 2016-2032
- 9.1. Middle East & Africa Cycloplegic Agents Market Analysis, 2016-2021
- 9.2. Middle East & Africa Cycloplegic Agents Market Opportunity and Forecast, 2023-2032
- 9.3. Middle East & Africa Cycloplegic Agents Market Analysis, Opportunity and Forecast, By By Mechanism , 2016-2032
- 9.3.1. Middle East & Africa Cycloplegic Agents Market Analysis by By Mechanism : Introduction
- 9.3.2. Market Size Absolute $ Opportunity Analysis and Forecast, By By Mechanism , 2016-2032
- 9.3.3. Atropine
- 9.3.4. Cyclopentolate
- 9.3.5. Cyclomidril
- 9.3.6. Phenylephrine
- 9.4. Middle East & Africa Cycloplegic Agents Market Analysis, Opportunity and Forecast, By By Root, 2016-2032
- 9.4.1. Middle East & Africa Cycloplegic Agents Market Analysis by By Root: Introduction
- 9.4.2. Market Size Absolute $ Opportunity Analysis and Forecast, By By Root, 2016-2032
- 9.4.3. Oral
- 9.4.4. Topical
- 9.5. Middle East & Africa Cycloplegic Agents Market Analysis, Opportunity and Forecast, By By Indication, 2016-2032
- 9.5.1. Middle East & Africa Cycloplegic Agents Market Analysis by By Indication: Introduction
- 9.5.2. Market Size Absolute $ Opportunity Analysis and Forecast, By By Indication, 2016-2032
- 9.5.3. Amblyopic Therapy
- 9.5.4. Palliative Care for Phthisis
- 9.5.5. Uveitis
- 9.6. Middle East & Africa Cycloplegic Agents Market Analysis, Opportunity and Forecast, By By Distribution Channel, 2016-2032
- 9.6.1. Middle East & Africa Cycloplegic Agents Market Analysis by By Distribution Channel: Introduction
- 9.6.2. Market Size Absolute $ Opportunity Analysis and Forecast, By By Distribution Channel, 2016-2032
- 9.6.3. Hospital
- 9.6.4. Online
- 9.6.5. Retail
- 9.7. Middle East & Africa Cycloplegic Agents Market Analysis, Opportunity and Forecast, By Country , 2016-2032
- 9.7.1. Middle East & Africa Cycloplegic Agents Market Analysis by Country : Introduction
- 9.7.2. Market Size Absolute $ Opportunity Analysis and Forecast, Country , 2016-2032
- 9.7.2.1. Algeria
- 9.7.2.2. Egypt
- 9.7.2.3. Israel
- 9.7.2.4. Kuwait
- 9.7.2.5. Nigeria
- 9.7.2.6. Saudi Arabia
- 9.7.2.7. South Africa
- 9.7.2.8. Turkey
- 9.7.2.9. The UAE
- 9.7.2.10. Rest of MEA
- 10. Global Cycloplegic Agents Market Analysis, Opportunity and Forecast, By Region , 2016-2032
- 10.1. Global Cycloplegic Agents Market Analysis by Region : Introduction
- 10.2. Market Size Absolute $ Opportunity Analysis and Forecast, By Region , 2016-2032
- 10.2.1. North America
- 10.2.2. Western Europe
- 10.2.3. Eastern Europe
- 10.2.4. APAC
- 10.2.5. Latin America
- 10.2.6. Middle East & Africa
- 11. Global Cycloplegic Agents Market Competitive Landscape, Market Share Analysis, and Company Profiles
- 11.1. Market Share Analysis
- 11.2. Company Profiles
- 11.3. Pfizer Inc. (U.S.)
- 11.3.1. Company Overview
- 11.3.2. Financial Highlights
- 11.3.3. Product Portfolio
- 11.3.4. SWOT Analysis
- 11.3.5. Key Strategies and Developments
- 11.4. Novartis International AG
- 11.4.1. Company Overview
- 11.4.2. Financial Highlights
- 11.4.3. Product Portfolio
- 11.4.4. SWOT Analysis
- 11.4.5. Key Strategies and Developments
- 11.5. Alcon Inc.
- 11.5.1. Company Overview
- 11.5.2. Financial Highlights
- 11.5.3. Product Portfolio
- 11.5.4. SWOT Analysis
- 11.5.5. Key Strategies and Developments
- 11.6. Bausch Health Companies, Inc.
- 11.6.1. Company Overview
- 11.6.2. Financial Highlights
- 11.6.3. Product Portfolio
- 11.6.4. SWOT Analysis
- 11.6.5. Key Strategies and Developments
- 11.7. Santen Pharmaceutical Co. Ltd.
- 11.7.1. Company Overview
- 11.7.2. Financial Highlights
- 11.7.3. Product Portfolio
- 11.7.4. SWOT Analysis
- 11.7.5. Key Strategies and Developments
- 11.8. Akorn, Inc.
- 11.8.1. Company Overview
- 11.8.2. Financial Highlights
- 11.8.3. Product Portfolio
- 11.8.4. SWOT Analysis
- 11.8.5. Key Strategies and Developments
- 11.9. Novartis International AG
- 11.9.1. Company Overview
- 11.9.2. Financial Highlights
- 11.9.3. Product Portfolio
- 11.9.4. SWOT Analysis
- 11.9.5. Key Strategies and Developments
- 11.10. Henry Schein, Inc (U.S.)
- 11.10.1. Company Overview
- 11.10.2. Financial Highlights
- 11.10.3. Product Portfolio
- 11.10.4. SWOT Analysis
- 11.10.5. Key Strategies and Developments
- 11.11. Actiza Pharmaceutical Private Limited (India)
- 11.11.1. Company Overview
- 11.11.2. Financial Highlights
- 11.11.3. Product Portfolio
- 11.11.4. SWOT Analysis
- 11.11.5. Key Strategies and Developments
- 11.12. hameln pharma gmbh (Germany)
- 11.12.1. Company Overview
- 11.12.2. Financial Highlights
- 11.12.3. Product Portfolio
- 11.12.4. SWOT Analysis
- 11.12.5. Key Strategies and Developments
- 11.13. Sigma Pharmaceuticals, LLC (U.S.)
- 11.13.1. Company Overview
- 11.13.2. Financial Highlights
- 11.13.3. Product Portfolio
- 11.13.4. SWOT Analysis
- 11.13.5. Key Strategies and Developments
- 11.14. Biomedica (India)
- 11.14.1. Company Overview
- 11.14.2. Financial Highlights
- 11.14.3. Product Portfolio
- 11.14.4. SWOT Analysis
- 11.14.5. Key Strategies and Developments
- 11.15. Prudence Pharma Chem (India)
- 11.15.1. Company Overview
- 11.15.2. Financial Highlights
- 11.15.3. Product Portfolio
- 11.15.4. SWOT Analysis
- 11.15.5. Key Strategies and Developments
- 11.16. Heer Pharma Pvt. Ltd. (India)
- 11.16.1. Company Overview
- 11.16.2. Financial Highlights
- 11.16.3. Product Portfolio
- 11.16.4. SWOT Analysis
- 11.16.5. Key Strategies and Developments
- 11.17. Fresenius Kabi AG (Germany)
- 11.17.1. Company Overview
- 11.17.2. Financial Highlights
- 11.17.3. Product Portfolio
- 11.17.4. SWOT Analysis
- 11.17.5. Key Strategies and Developments
- 11.18. Other Key Players
- 11.18.1. Company Overview
- 11.18.2. Financial Highlights
- 11.18.3. Product Portfolio
- 11.18.4. SWOT Analysis
- 11.18.5. Key Strategies and Developments
- 12. Assumptions and Acronyms
- 13. Research Methodology
- 14. Contact
List of Figures
- Figure 1: Global Cycloplegic Agents Market Revenue (US$ Mn) Market Share by By Mechanism in 2022
- Figure 2: Global Cycloplegic Agents Market Attractiveness Analysis by By Mechanism , 2016-2032
- Figure 3: Global Cycloplegic Agents Market Revenue (US$ Mn) Market Share by By Rootin 2022
- Figure 4: Global Cycloplegic Agents Market Attractiveness Analysis by By Root, 2016-2032
- Figure 5: Global Cycloplegic Agents Market Revenue (US$ Mn) Market Share by By Indicationin 2022
- Figure 6: Global Cycloplegic Agents Market Attractiveness Analysis by By Indication, 2016-2032
- Figure 7: Global Cycloplegic Agents Market Revenue (US$ Mn) Market Share by By Distribution Channelin 2022
- Figure 8: Global Cycloplegic Agents Market Attractiveness Analysis by By Distribution Channel, 2016-2032
- Figure 9: Global Cycloplegic Agents Market Revenue (US$ Mn) Market Share by Region in 2022
- Figure 10: Global Cycloplegic Agents Market Attractiveness Analysis by Region, 2016-2032
- Figure 11: Global Cycloplegic Agents Market Revenue (US$ Mn) (2016-2032)
- Figure 12: Global Cycloplegic Agents Market Revenue (US$ Mn) Comparison by Region (2016-2032)
- Figure 13: Global Cycloplegic Agents Market Revenue (US$ Mn) Comparison by By Mechanism (2016-2032)
- Figure 14: Global Cycloplegic Agents Market Revenue (US$ Mn) Comparison by By Root (2016-2032)
- Figure 15: Global Cycloplegic Agents Market Revenue (US$ Mn) Comparison by By Indication (2016-2032)
- Figure 16: Global Cycloplegic Agents Market Revenue (US$ Mn) Comparison by By Distribution Channel (2016-2032)
- Figure 17: Global Cycloplegic Agents Market Y-o-Y Growth Rate Comparison by Region (2016-2032)
- Figure 18: Global Cycloplegic Agents Market Y-o-Y Growth Rate Comparison by By Mechanism (2016-2032)
- Figure 19: Global Cycloplegic Agents Market Y-o-Y Growth Rate Comparison by By Root (2016-2032)
- Figure 20: Global Cycloplegic Agents Market Y-o-Y Growth Rate Comparison by By Indication (2016-2032)
- Figure 21: Global Cycloplegic Agents Market Y-o-Y Growth Rate Comparison by By Distribution Channel (2016-2032)
- Figure 22: Global Cycloplegic Agents Market Share Comparison by Region (2016-2032)
- Figure 23: Global Cycloplegic Agents Market Share Comparison by By Mechanism (2016-2032)
- Figure 24: Global Cycloplegic Agents Market Share Comparison by By Root (2016-2032)
- Figure 25: Global Cycloplegic Agents Market Share Comparison by By Indication (2016-2032)
- Figure 26: Global Cycloplegic Agents Market Share Comparison by By Distribution Channel (2016-2032)
- Figure 27: North America Cycloplegic Agents Market Revenue (US$ Mn) Market Share by By Mechanism in 2022
- Figure 28: North America Cycloplegic Agents Market Attractiveness Analysis by By Mechanism , 2016-2032
- Figure 29: North America Cycloplegic Agents Market Revenue (US$ Mn) Market Share by By Rootin 2022
- Figure 30: North America Cycloplegic Agents Market Attractiveness Analysis by By Root, 2016-2032
- Figure 31: North America Cycloplegic Agents Market Revenue (US$ Mn) Market Share by By Indicationin 2022
- Figure 32: North America Cycloplegic Agents Market Attractiveness Analysis by By Indication, 2016-2032
- Figure 33: North America Cycloplegic Agents Market Revenue (US$ Mn) Market Share by By Distribution Channelin 2022
- Figure 34: North America Cycloplegic Agents Market Attractiveness Analysis by By Distribution Channel, 2016-2032
- Figure 35: North America Cycloplegic Agents Market Revenue (US$ Mn) Market Share by Country in 2022
- Figure 36: North America Cycloplegic Agents Market Attractiveness Analysis by Country, 2016-2032
- Figure 37: North America Cycloplegic Agents Market Revenue (US$ Mn) (2016-2032)
- Figure 38: North America Cycloplegic Agents Market Revenue (US$ Mn) Comparison by Country (2016-2032)
- Figure 39: North America Cycloplegic Agents Market Revenue (US$ Mn) Comparison by By Mechanism (2016-2032)
- Figure 40: North America Cycloplegic Agents Market Revenue (US$ Mn) Comparison by By Root (2016-2032)
- Figure 41: North America Cycloplegic Agents Market Revenue (US$ Mn) Comparison by By Indication (2016-2032)
- Figure 42: North America Cycloplegic Agents Market Revenue (US$ Mn) Comparison by By Distribution Channel (2016-2032)
- Figure 43: North America Cycloplegic Agents Market Y-o-Y Growth Rate Comparison by Country (2016-2032)
- Figure 44: North America Cycloplegic Agents Market Y-o-Y Growth Rate Comparison by By Mechanism (2016-2032)
- Figure 45: North America Cycloplegic Agents Market Y-o-Y Growth Rate Comparison by By Root (2016-2032)
- Figure 46: North America Cycloplegic Agents Market Y-o-Y Growth Rate Comparison by By Indication (2016-2032)
- Figure 47: North America Cycloplegic Agents Market Y-o-Y Growth Rate Comparison by By Distribution Channel (2016-2032)
- Figure 48: North America Cycloplegic Agents Market Share Comparison by Country (2016-2032)
- Figure 49: North America Cycloplegic Agents Market Share Comparison by By Mechanism (2016-2032)
- Figure 50: North America Cycloplegic Agents Market Share Comparison by By Root (2016-2032)
- Figure 51: North America Cycloplegic Agents Market Share Comparison by By Indication (2016-2032)
- Figure 52: North America Cycloplegic Agents Market Share Comparison by By Distribution Channel (2016-2032)
- Figure 53: Western Europe Cycloplegic Agents Market Revenue (US$ Mn) Market Share by By Mechanism in 2022
- Figure 54: Western Europe Cycloplegic Agents Market Attractiveness Analysis by By Mechanism , 2016-2032
- Figure 55: Western Europe Cycloplegic Agents Market Revenue (US$ Mn) Market Share by By Rootin 2022
- Figure 56: Western Europe Cycloplegic Agents Market Attractiveness Analysis by By Root, 2016-2032
- Figure 57: Western Europe Cycloplegic Agents Market Revenue (US$ Mn) Market Share by By Indicationin 2022
- Figure 58: Western Europe Cycloplegic Agents Market Attractiveness Analysis by By Indication, 2016-2032
- Figure 59: Western Europe Cycloplegic Agents Market Revenue (US$ Mn) Market Share by By Distribution Channelin 2022
- Figure 60: Western Europe Cycloplegic Agents Market Attractiveness Analysis by By Distribution Channel, 2016-2032
- Figure 61: Western Europe Cycloplegic Agents Market Revenue (US$ Mn) Market Share by Country in 2022
- Figure 62: Western Europe Cycloplegic Agents Market Attractiveness Analysis by Country, 2016-2032
- Figure 63: Western Europe Cycloplegic Agents Market Revenue (US$ Mn) (2016-2032)
- Figure 64: Western Europe Cycloplegic Agents Market Revenue (US$ Mn) Comparison by Country (2016-2032)
- Figure 65: Western Europe Cycloplegic Agents Market Revenue (US$ Mn) Comparison by By Mechanism (2016-2032)
- Figure 66: Western Europe Cycloplegic Agents Market Revenue (US$ Mn) Comparison by By Root (2016-2032)
- Figure 67: Western Europe Cycloplegic Agents Market Revenue (US$ Mn) Comparison by By Indication (2016-2032)
- Figure 68: Western Europe Cycloplegic Agents Market Revenue (US$ Mn) Comparison by By Distribution Channel (2016-2032)
- Figure 69: Western Europe Cycloplegic Agents Market Y-o-Y Growth Rate Comparison by Country (2016-2032)
- Figure 70: Western Europe Cycloplegic Agents Market Y-o-Y Growth Rate Comparison by By Mechanism (2016-2032)
- Figure 71: Western Europe Cycloplegic Agents Market Y-o-Y Growth Rate Comparison by By Root (2016-2032)
- Figure 72: Western Europe Cycloplegic Agents Market Y-o-Y Growth Rate Comparison by By Indication (2016-2032)
- Figure 73: Western Europe Cycloplegic Agents Market Y-o-Y Growth Rate Comparison by By Distribution Channel (2016-2032)
- Figure 74: Western Europe Cycloplegic Agents Market Share Comparison by Country (2016-2032)
- Figure 75: Western Europe Cycloplegic Agents Market Share Comparison by By Mechanism (2016-2032)
- Figure 76: Western Europe Cycloplegic Agents Market Share Comparison by By Root (2016-2032)
- Figure 77: Western Europe Cycloplegic Agents Market Share Comparison by By Indication (2016-2032)
- Figure 78: Western Europe Cycloplegic Agents Market Share Comparison by By Distribution Channel (2016-2032)
- Figure 79: Eastern Europe Cycloplegic Agents Market Revenue (US$ Mn) Market Share by By Mechanism in 2022
- Figure 80: Eastern Europe Cycloplegic Agents Market Attractiveness Analysis by By Mechanism , 2016-2032
- Figure 81: Eastern Europe Cycloplegic Agents Market Revenue (US$ Mn) Market Share by By Rootin 2022
- Figure 82: Eastern Europe Cycloplegic Agents Market Attractiveness Analysis by By Root, 2016-2032
- Figure 83: Eastern Europe Cycloplegic Agents Market Revenue (US$ Mn) Market Share by By Indicationin 2022
- Figure 84: Eastern Europe Cycloplegic Agents Market Attractiveness Analysis by By Indication, 2016-2032
- Figure 85: Eastern Europe Cycloplegic Agents Market Revenue (US$ Mn) Market Share by By Distribution Channelin 2022
- Figure 86: Eastern Europe Cycloplegic Agents Market Attractiveness Analysis by By Distribution Channel, 2016-2032
- Figure 87: Eastern Europe Cycloplegic Agents Market Revenue (US$ Mn) Market Share by Country in 2022
- Figure 88: Eastern Europe Cycloplegic Agents Market Attractiveness Analysis by Country, 2016-2032
- Figure 89: Eastern Europe Cycloplegic Agents Market Revenue (US$ Mn) (2016-2032)
- Figure 90: Eastern Europe Cycloplegic Agents Market Revenue (US$ Mn) Comparison by Country (2016-2032)
- Figure 91: Eastern Europe Cycloplegic Agents Market Revenue (US$ Mn) Comparison by By Mechanism (2016-2032)
- Figure 92: Eastern Europe Cycloplegic Agents Market Revenue (US$ Mn) Comparison by By Root (2016-2032)
- Figure 93: Eastern Europe Cycloplegic Agents Market Revenue (US$ Mn) Comparison by By Indication (2016-2032)
- Figure 94: Eastern Europe Cycloplegic Agents Market Revenue (US$ Mn) Comparison by By Distribution Channel (2016-2032)
- Figure 95: Eastern Europe Cycloplegic Agents Market Y-o-Y Growth Rate Comparison by Country (2016-2032)
- Figure 96: Eastern Europe Cycloplegic Agents Market Y-o-Y Growth Rate Comparison by By Mechanism (2016-2032)
- Figure 97: Eastern Europe Cycloplegic Agents Market Y-o-Y Growth Rate Comparison by By Root (2016-2032)
- Figure 98: Eastern Europe Cycloplegic Agents Market Y-o-Y Growth Rate Comparison by By Indication (2016-2032)
- Figure 99: Eastern Europe Cycloplegic Agents Market Y-o-Y Growth Rate Comparison by By Distribution Channel (2016-2032)
- Figure 100: Eastern Europe Cycloplegic Agents Market Share Comparison by Country (2016-2032)
- Figure 101: Eastern Europe Cycloplegic Agents Market Share Comparison by By Mechanism (2016-2032)
- Figure 102: Eastern Europe Cycloplegic Agents Market Share Comparison by By Root (2016-2032)
- Figure 103: Eastern Europe Cycloplegic Agents Market Share Comparison by By Indication (2016-2032)
- Figure 104: Eastern Europe Cycloplegic Agents Market Share Comparison by By Distribution Channel (2016-2032)
- Figure 105: APAC Cycloplegic Agents Market Revenue (US$ Mn) Market Share by By Mechanism in 2022
- Figure 106: APAC Cycloplegic Agents Market Attractiveness Analysis by By Mechanism , 2016-2032
- Figure 107: APAC Cycloplegic Agents Market Revenue (US$ Mn) Market Share by By Rootin 2022
- Figure 108: APAC Cycloplegic Agents Market Attractiveness Analysis by By Root, 2016-2032
- Figure 109: APAC Cycloplegic Agents Market Revenue (US$ Mn) Market Share by By Indicationin 2022
- Figure 110: APAC Cycloplegic Agents Market Attractiveness Analysis by By Indication, 2016-2032
- Figure 111: APAC Cycloplegic Agents Market Revenue (US$ Mn) Market Share by By Distribution Channelin 2022
- Figure 112: APAC Cycloplegic Agents Market Attractiveness Analysis by By Distribution Channel, 2016-2032
- Figure 113: APAC Cycloplegic Agents Market Revenue (US$ Mn) Market Share by Country in 2022
- Figure 114: APAC Cycloplegic Agents Market Attractiveness Analysis by Country, 2016-2032
- Figure 115: APAC Cycloplegic Agents Market Revenue (US$ Mn) (2016-2032)
- Figure 116: APAC Cycloplegic Agents Market Revenue (US$ Mn) Comparison by Country (2016-2032)
- Figure 117: APAC Cycloplegic Agents Market Revenue (US$ Mn) Comparison by By Mechanism (2016-2032)
- Figure 118: APAC Cycloplegic Agents Market Revenue (US$ Mn) Comparison by By Root (2016-2032)
- Figure 119: APAC Cycloplegic Agents Market Revenue (US$ Mn) Comparison by By Indication (2016-2032)
- Figure 120: APAC Cycloplegic Agents Market Revenue (US$ Mn) Comparison by By Distribution Channel (2016-2032)
- Figure 121: APAC Cycloplegic Agents Market Y-o-Y Growth Rate Comparison by Country (2016-2032)
- Figure 122: APAC Cycloplegic Agents Market Y-o-Y Growth Rate Comparison by By Mechanism (2016-2032)
- Figure 123: APAC Cycloplegic Agents Market Y-o-Y Growth Rate Comparison by By Root (2016-2032)
- Figure 124: APAC Cycloplegic Agents Market Y-o-Y Growth Rate Comparison by By Indication (2016-2032)
- Figure 125: APAC Cycloplegic Agents Market Y-o-Y Growth Rate Comparison by By Distribution Channel (2016-2032)
- Figure 126: APAC Cycloplegic Agents Market Share Comparison by Country (2016-2032)
- Figure 127: APAC Cycloplegic Agents Market Share Comparison by By Mechanism (2016-2032)
- Figure 128: APAC Cycloplegic Agents Market Share Comparison by By Root (2016-2032)
- Figure 129: APAC Cycloplegic Agents Market Share Comparison by By Indication (2016-2032)
- Figure 130: APAC Cycloplegic Agents Market Share Comparison by By Distribution Channel (2016-2032)
- Figure 131: Latin America Cycloplegic Agents Market Revenue (US$ Mn) Market Share by By Mechanism in 2022
- Figure 132: Latin America Cycloplegic Agents Market Attractiveness Analysis by By Mechanism , 2016-2032
- Figure 133: Latin America Cycloplegic Agents Market Revenue (US$ Mn) Market Share by By Rootin 2022
- Figure 134: Latin America Cycloplegic Agents Market Attractiveness Analysis by By Root, 2016-2032
- Figure 135: Latin America Cycloplegic Agents Market Revenue (US$ Mn) Market Share by By Indicationin 2022
- Figure 136: Latin America Cycloplegic Agents Market Attractiveness Analysis by By Indication, 2016-2032
- Figure 137: Latin America Cycloplegic Agents Market Revenue (US$ Mn) Market Share by By Distribution Channelin 2022
- Figure 138: Latin America Cycloplegic Agents Market Attractiveness Analysis by By Distribution Channel, 2016-2032
- Figure 139: Latin America Cycloplegic Agents Market Revenue (US$ Mn) Market Share by Country in 2022
- Figure 140: Latin America Cycloplegic Agents Market Attractiveness Analysis by Country, 2016-2032
- Figure 141: Latin America Cycloplegic Agents Market Revenue (US$ Mn) (2016-2032)
- Figure 142: Latin America Cycloplegic Agents Market Revenue (US$ Mn) Comparison by Country (2016-2032)
- Figure 143: Latin America Cycloplegic Agents Market Revenue (US$ Mn) Comparison by By Mechanism (2016-2032)
- Figure 144: Latin America Cycloplegic Agents Market Revenue (US$ Mn) Comparison by By Root (2016-2032)
- Figure 145: Latin America Cycloplegic Agents Market Revenue (US$ Mn) Comparison by By Indication (2016-2032)
- Figure 146: Latin America Cycloplegic Agents Market Revenue (US$ Mn) Comparison by By Distribution Channel (2016-2032)
- Figure 147: Latin America Cycloplegic Agents Market Y-o-Y Growth Rate Comparison by Country (2016-2032)
- Figure 148: Latin America Cycloplegic Agents Market Y-o-Y Growth Rate Comparison by By Mechanism (2016-2032)
- Figure 149: Latin America Cycloplegic Agents Market Y-o-Y Growth Rate Comparison by By Root (2016-2032)
- Figure 150: Latin America Cycloplegic Agents Market Y-o-Y Growth Rate Comparison by By Indication (2016-2032)
- Figure 151: Latin America Cycloplegic Agents Market Y-o-Y Growth Rate Comparison by By Distribution Channel (2016-2032)
- Figure 152: Latin America Cycloplegic Agents Market Share Comparison by Country (2016-2032)
- Figure 153: Latin America Cycloplegic Agents Market Share Comparison by By Mechanism (2016-2032)
- Figure 154: Latin America Cycloplegic Agents Market Share Comparison by By Root (2016-2032)
- Figure 155: Latin America Cycloplegic Agents Market Share Comparison by By Indication (2016-2032)
- Figure 156: Latin America Cycloplegic Agents Market Share Comparison by By Distribution Channel (2016-2032)
- Figure 157: Middle East & Africa Cycloplegic Agents Market Revenue (US$ Mn) Market Share by By Mechanism in 2022
- Figure 158: Middle East & Africa Cycloplegic Agents Market Attractiveness Analysis by By Mechanism , 2016-2032
- Figure 159: Middle East & Africa Cycloplegic Agents Market Revenue (US$ Mn) Market Share by By Rootin 2022
- Figure 160: Middle East & Africa Cycloplegic Agents Market Attractiveness Analysis by By Root, 2016-2032
- Figure 161: Middle East & Africa Cycloplegic Agents Market Revenue (US$ Mn) Market Share by By Indicationin 2022
- Figure 162: Middle East & Africa Cycloplegic Agents Market Attractiveness Analysis by By Indication, 2016-2032
- Figure 163: Middle East & Africa Cycloplegic Agents Market Revenue (US$ Mn) Market Share by By Distribution Channelin 2022
- Figure 164: Middle East & Africa Cycloplegic Agents Market Attractiveness Analysis by By Distribution Channel, 2016-2032
- Figure 165: Middle East & Africa Cycloplegic Agents Market Revenue (US$ Mn) Market Share by Country in 2022
- Figure 166: Middle East & Africa Cycloplegic Agents Market Attractiveness Analysis by Country, 2016-2032
- Figure 167: Middle East & Africa Cycloplegic Agents Market Revenue (US$ Mn) (2016-2032)
- Figure 168: Middle East & Africa Cycloplegic Agents Market Revenue (US$ Mn) Comparison by Country (2016-2032)
- Figure 169: Middle East & Africa Cycloplegic Agents Market Revenue (US$ Mn) Comparison by By Mechanism (2016-2032)
- Figure 170: Middle East & Africa Cycloplegic Agents Market Revenue (US$ Mn) Comparison by By Root (2016-2032)
- Figure 171: Middle East & Africa Cycloplegic Agents Market Revenue (US$ Mn) Comparison by By Indication (2016-2032)
- Figure 172: Middle East & Africa Cycloplegic Agents Market Revenue (US$ Mn) Comparison by By Distribution Channel (2016-2032)
- Figure 173: Middle East & Africa Cycloplegic Agents Market Y-o-Y Growth Rate Comparison by Country (2016-2032)
- Figure 174: Middle East & Africa Cycloplegic Agents Market Y-o-Y Growth Rate Comparison by By Mechanism (2016-2032)
- Figure 175: Middle East & Africa Cycloplegic Agents Market Y-o-Y Growth Rate Comparison by By Root (2016-2032)
- Figure 176: Middle East & Africa Cycloplegic Agents Market Y-o-Y Growth Rate Comparison by By Indication (2016-2032)
- Figure 177: Middle East & Africa Cycloplegic Agents Market Y-o-Y Growth Rate Comparison by By Distribution Channel (2016-2032)
- Figure 178: Middle East & Africa Cycloplegic Agents Market Share Comparison by Country (2016-2032)
- Figure 179: Middle East & Africa Cycloplegic Agents Market Share Comparison by By Mechanism (2016-2032)
- Figure 180: Middle East & Africa Cycloplegic Agents Market Share Comparison by By Root (2016-2032)
- Figure 181: Middle East & Africa Cycloplegic Agents Market Share Comparison by By Indication (2016-2032)
- Figure 182: Middle East & Africa Cycloplegic Agents Market Share Comparison by By Distribution Channel (2016-2032)
List of Tables
-
- Table 1: Global Cycloplegic Agents Market Comparison by By Mechanism (2016-2032)
- Table 2: Global Cycloplegic Agents Market Comparison by By Root (2016-2032)
- Table 3: Global Cycloplegic Agents Market Comparison by By Indication (2016-2032)
- Table 4: Global Cycloplegic Agents Market Comparison by By Distribution Channel (2016-2032)
- Table 5: Global Cycloplegic Agents Market Revenue (US$ Mn) Comparison by Region (2016-2032)
- Table 6: Global Cycloplegic Agents Market Revenue (US$ Mn) (2016-2032)
- Table 7: Global Cycloplegic Agents Market Revenue (US$ Mn) Comparison by Region (2016-2032)
- Table 8: Global Cycloplegic Agents Market Revenue (US$ Mn) Comparison by By Mechanism (2016-2032)
- Table 9: Global Cycloplegic Agents Market Revenue (US$ Mn) Comparison by By Root (2016-2032)
- Table 10: Global Cycloplegic Agents Market Revenue (US$ Mn) Comparison by By Indication (2016-2032)
- Table 11: Global Cycloplegic Agents Market Revenue (US$ Mn) Comparison by By Distribution Channel (2016-2032)
- Table 12: Global Cycloplegic Agents Market Y-o-Y Growth Rate Comparison by Region (2016-2032)
- Table 13: Global Cycloplegic Agents Market Y-o-Y Growth Rate Comparison by By Mechanism (2016-2032)
- Table 14: Global Cycloplegic Agents Market Y-o-Y Growth Rate Comparison by By Root (2016-2032)
- Table 15: Global Cycloplegic Agents Market Y-o-Y Growth Rate Comparison by By Indication (2016-2032)
- Table 16: Global Cycloplegic Agents Market Y-o-Y Growth Rate Comparison by By Distribution Channel (2016-2032)
- Table 17: Global Cycloplegic Agents Market Share Comparison by Region (2016-2032)
- Table 18: Global Cycloplegic Agents Market Share Comparison by By Mechanism (2016-2032)
- Table 19: Global Cycloplegic Agents Market Share Comparison by By Root (2016-2032)
- Table 20: Global Cycloplegic Agents Market Share Comparison by By Indication (2016-2032)
- Table 21: Global Cycloplegic Agents Market Share Comparison by By Distribution Channel (2016-2032)
- Table 22: North America Cycloplegic Agents Market Comparison by By Root (2016-2032)
- Table 23: North America Cycloplegic Agents Market Comparison by By Indication (2016-2032)
- Table 24: North America Cycloplegic Agents Market Comparison by By Distribution Channel (2016-2032)
- Table 25: North America Cycloplegic Agents Market Revenue (US$ Mn) Comparison by Country (2016-2032)
- Table 26: North America Cycloplegic Agents Market Revenue (US$ Mn) (2016-2032)
- Table 27: North America Cycloplegic Agents Market Revenue (US$ Mn) Comparison by Country (2016-2032)
- Table 28: North America Cycloplegic Agents Market Revenue (US$ Mn) Comparison by By Mechanism (2016-2032)
- Table 29: North America Cycloplegic Agents Market Revenue (US$ Mn) Comparison by By Root (2016-2032)
- Table 30: North America Cycloplegic Agents Market Revenue (US$ Mn) Comparison by By Indication (2016-2032)
- Table 31: North America Cycloplegic Agents Market Revenue (US$ Mn) Comparison by By Distribution Channel (2016-2032)
- Table 32: North America Cycloplegic Agents Market Y-o-Y Growth Rate Comparison by Country (2016-2032)
- Table 33: North America Cycloplegic Agents Market Y-o-Y Growth Rate Comparison by By Mechanism (2016-2032)
- Table 34: North America Cycloplegic Agents Market Y-o-Y Growth Rate Comparison by By Root (2016-2032)
- Table 35: North America Cycloplegic Agents Market Y-o-Y Growth Rate Comparison by By Indication (2016-2032)
- Table 36: North America Cycloplegic Agents Market Y-o-Y Growth Rate Comparison by By Distribution Channel (2016-2032)
- Table 37: North America Cycloplegic Agents Market Share Comparison by Country (2016-2032)
- Table 38: North America Cycloplegic Agents Market Share Comparison by By Mechanism (2016-2032)
- Table 39: North America Cycloplegic Agents Market Share Comparison by By Root (2016-2032)
- Table 40: North America Cycloplegic Agents Market Share Comparison by By Indication (2016-2032)
- Table 41: North America Cycloplegic Agents Market Share Comparison by By Distribution Channel (2016-2032)
- Table 42: Western Europe Cycloplegic Agents Market Comparison by By Mechanism (2016-2032)
- Table 43: Western Europe Cycloplegic Agents Market Comparison by By Root (2016-2032)
- Table 44: Western Europe Cycloplegic Agents Market Comparison by By Indication (2016-2032)
- Table 45: Western Europe Cycloplegic Agents Market Comparison by By Distribution Channel (2016-2032)
- Table 46: Western Europe Cycloplegic Agents Market Revenue (US$ Mn) Comparison by Country (2016-2032)
- Table 47: Western Europe Cycloplegic Agents Market Revenue (US$ Mn) (2016-2032)
- Table 48: Western Europe Cycloplegic Agents Market Revenue (US$ Mn) Comparison by Country (2016-2032)
- Table 49: Western Europe Cycloplegic Agents Market Revenue (US$ Mn) Comparison by By Mechanism (2016-2032)
- Table 50: Western Europe Cycloplegic Agents Market Revenue (US$ Mn) Comparison by By Root (2016-2032)
- Table 51: Western Europe Cycloplegic Agents Market Revenue (US$ Mn) Comparison by By Indication (2016-2032)
- Table 52: Western Europe Cycloplegic Agents Market Revenue (US$ Mn) Comparison by By Distribution Channel (2016-2032)
- Table 53: Western Europe Cycloplegic Agents Market Y-o-Y Growth Rate Comparison by Country (2016-2032)
- Table 54: Western Europe Cycloplegic Agents Market Y-o-Y Growth Rate Comparison by By Mechanism (2016-2032)
- Table 55: Western Europe Cycloplegic Agents Market Y-o-Y Growth Rate Comparison by By Root (2016-2032)
- Table 56: Western Europe Cycloplegic Agents Market Y-o-Y Growth Rate Comparison by By Indication (2016-2032)
- Table 57: Western Europe Cycloplegic Agents Market Y-o-Y Growth Rate Comparison by By Distribution Channel (2016-2032)
- Table 58: Western Europe Cycloplegic Agents Market Share Comparison by Country (2016-2032)
- Table 59: Western Europe Cycloplegic Agents Market Share Comparison by By Mechanism (2016-2032)
- Table 60: Western Europe Cycloplegic Agents Market Share Comparison by By Root (2016-2032)
- Table 61: Western Europe Cycloplegic Agents Market Share Comparison by By Indication (2016-2032)
- Table 62: Western Europe Cycloplegic Agents Market Share Comparison by By Distribution Channel (2016-2032)
- Table 63: Eastern Europe Cycloplegic Agents Market Comparison by By Mechanism (2016-2032)
- Table 64: Eastern Europe Cycloplegic Agents Market Comparison by By Root (2016-2032)
- Table 65: Eastern Europe Cycloplegic Agents Market Comparison by By Indication (2016-2032)
- Table 66: Eastern Europe Cycloplegic Agents Market Comparison by By Distribution Channel (2016-2032)
- Table 67: Eastern Europe Cycloplegic Agents Market Revenue (US$ Mn) Comparison by Country (2016-2032)
- Table 68: Eastern Europe Cycloplegic Agents Market Revenue (US$ Mn) (2016-2032)
- Table 69: Eastern Europe Cycloplegic Agents Market Revenue (US$ Mn) Comparison by Country (2016-2032)
- Table 70: Eastern Europe Cycloplegic Agents Market Revenue (US$ Mn) Comparison by By Mechanism (2016-2032)
- Table 71: Eastern Europe Cycloplegic Agents Market Revenue (US$ Mn) Comparison by By Root (2016-2032)
- Table 72: Eastern Europe Cycloplegic Agents Market Revenue (US$ Mn) Comparison by By Indication (2016-2032)
- Table 73: Eastern Europe Cycloplegic Agents Market Revenue (US$ Mn) Comparison by By Distribution Channel (2016-2032)
- Table 74: Eastern Europe Cycloplegic Agents Market Y-o-Y Growth Rate Comparison by Country (2016-2032)
- Table 75: Eastern Europe Cycloplegic Agents Market Y-o-Y Growth Rate Comparison by By Mechanism (2016-2032)
- Table 76: Eastern Europe Cycloplegic Agents Market Y-o-Y Growth Rate Comparison by By Root (2016-2032)
- Table 77: Eastern Europe Cycloplegic Agents Market Y-o-Y Growth Rate Comparison by By Indication (2016-2032)
- Table 78: Eastern Europe Cycloplegic Agents Market Y-o-Y Growth Rate Comparison by By Distribution Channel (2016-2032)
- Table 79: Eastern Europe Cycloplegic Agents Market Share Comparison by Country (2016-2032)
- Table 80: Eastern Europe Cycloplegic Agents Market Share Comparison by By Mechanism (2016-2032)
- Table 81: Eastern Europe Cycloplegic Agents Market Share Comparison by By Root (2016-2032)
- Table 82: Eastern Europe Cycloplegic Agents Market Share Comparison by By Indication (2016-2032)
- Table 83: Eastern Europe Cycloplegic Agents Market Share Comparison by By Distribution Channel (2016-2032)
- Table 84: APAC Cycloplegic Agents Market Comparison by By Mechanism (2016-2032)
- Table 85: APAC Cycloplegic Agents Market Comparison by By Root (2016-2032)
- Table 86: APAC Cycloplegic Agents Market Comparison by By Indication (2016-2032)
- Table 87: APAC Cycloplegic Agents Market Comparison by By Distribution Channel (2016-2032)
- Table 88: APAC Cycloplegic Agents Market Revenue (US$ Mn) Comparison by Country (2016-2032)
- Table 89: APAC Cycloplegic Agents Market Revenue (US$ Mn) (2016-2032)
- Table 90: APAC Cycloplegic Agents Market Revenue (US$ Mn) Comparison by Country (2016-2032)
- Table 91: APAC Cycloplegic Agents Market Revenue (US$ Mn) Comparison by By Mechanism (2016-2032)
- Table 92: APAC Cycloplegic Agents Market Revenue (US$ Mn) Comparison by By Root (2016-2032)
- Table 93: APAC Cycloplegic Agents Market Revenue (US$ Mn) Comparison by By Indication (2016-2032)
- Table 94: APAC Cycloplegic Agents Market Revenue (US$ Mn) Comparison by By Distribution Channel (2016-2032)
- Table 95: APAC Cycloplegic Agents Market Y-o-Y Growth Rate Comparison by Country (2016-2032)
- Table 96: APAC Cycloplegic Agents Market Y-o-Y Growth Rate Comparison by By Mechanism (2016-2032)
- Table 97: APAC Cycloplegic Agents Market Y-o-Y Growth Rate Comparison by By Root (2016-2032)
- Table 98: APAC Cycloplegic Agents Market Y-o-Y Growth Rate Comparison by By Indication (2016-2032)
- Table 99: APAC Cycloplegic Agents Market Y-o-Y Growth Rate Comparison by By Distribution Channel (2016-2032)
- Table 100: APAC Cycloplegic Agents Market Share Comparison by Country (2016-2032)
- Table 101: APAC Cycloplegic Agents Market Share Comparison by By Mechanism (2016-2032)
- Table 102: APAC Cycloplegic Agents Market Share Comparison by By Root (2016-2032)
- Table 103: APAC Cycloplegic Agents Market Share Comparison by By Indication (2016-2032)
- Table 104: APAC Cycloplegic Agents Market Share Comparison by By Distribution Channel (2016-2032)
- Table 105: Latin America Cycloplegic Agents Market Comparison by By Mechanism (2016-2032)
- Table 106: Latin America Cycloplegic Agents Market Comparison by By Root (2016-2032)
- Table 107: Latin America Cycloplegic Agents Market Comparison by By Indication (2016-2032)
- Table 108: Latin America Cycloplegic Agents Market Comparison by By Distribution Channel (2016-2032)
- Table 109: Latin America Cycloplegic Agents Market Revenue (US$ Mn) Comparison by Country (2016-2032)
- Table 110: Latin America Cycloplegic Agents Market Revenue (US$ Mn) (2016-2032)
- Table 111: Latin America Cycloplegic Agents Market Revenue (US$ Mn) Comparison by Country (2016-2032)
- Table 112: Latin America Cycloplegic Agents Market Revenue (US$ Mn) Comparison by By Mechanism (2016-2032)
- Table 113: Latin America Cycloplegic Agents Market Revenue (US$ Mn) Comparison by By Root (2016-2032)
- Table 114: Latin America Cycloplegic Agents Market Revenue (US$ Mn) Comparison by By Indication (2016-2032)
- Table 115: Latin America Cycloplegic Agents Market Revenue (US$ Mn) Comparison by By Distribution Channel (2016-2032)
- Table 116: Latin America Cycloplegic Agents Market Y-o-Y Growth Rate Comparison by Country (2016-2032)
- Table 117: Latin America Cycloplegic Agents Market Y-o-Y Growth Rate Comparison by By Mechanism (2016-2032)
- Table 118: Latin America Cycloplegic Agents Market Y-o-Y Growth Rate Comparison by By Root (2016-2032)
- Table 119: Latin America Cycloplegic Agents Market Y-o-Y Growth Rate Comparison by By Indication (2016-2032)
- Table 120: Latin America Cycloplegic Agents Market Y-o-Y Growth Rate Comparison by By Distribution Channel (2016-2032)
- Table 121: Latin America Cycloplegic Agents Market Share Comparison by Country (2016-2032)
- Table 122: Latin America Cycloplegic Agents Market Share Comparison by By Mechanism (2016-2032)
- Table 123: Latin America Cycloplegic Agents Market Share Comparison by By Root (2016-2032)
- Table 124: Latin America Cycloplegic Agents Market Share Comparison by By Indication (2016-2032)
- Table 125: Latin America Cycloplegic Agents Market Share Comparison by By Distribution Channel (2016-2032)
- Table 126: Middle East & Africa Cycloplegic Agents Market Comparison by By Mechanism (2016-2032)
- Table 127: Middle East & Africa Cycloplegic Agents Market Comparison by By Root (2016-2032)
- Table 128: Middle East & Africa Cycloplegic Agents Market Comparison by By Indication (2016-2032)
- Table 129: Middle East & Africa Cycloplegic Agents Market Comparison by By Distribution Channel (2016-2032)
- Table 130: Middle East & Africa Cycloplegic Agents Market Revenue (US$ Mn) Comparison by Country (2016-2032)
- Table 131: Middle East & Africa Cycloplegic Agents Market Revenue (US$ Mn) (2016-2032)
- Table 132: Middle East & Africa Cycloplegic Agents Market Revenue (US$ Mn) Comparison by Country (2016-2032)
- Table 133: Middle East & Africa Cycloplegic Agents Market Revenue (US$ Mn) Comparison by By Mechanism (2016-2032)
- Table 134: Middle East & Africa Cycloplegic Agents Market Revenue (US$ Mn) Comparison by By Root (2016-2032)
- Table 135: Middle East & Africa Cycloplegic Agents Market Revenue (US$ Mn) Comparison by By Indication (2016-2032)
- Table 136: Middle East & Africa Cycloplegic Agents Market Revenue (US$ Mn) Comparison by By Distribution Channel (2016-2032)
- Table 137: Middle East & Africa Cycloplegic Agents Market Y-o-Y Growth Rate Comparison by Country (2016-2032)
- Table 138: Middle East & Africa Cycloplegic Agents Market Y-o-Y Growth Rate Comparison by By Mechanism (2016-2032)
- Table 139: Middle East & Africa Cycloplegic Agents Market Y-o-Y Growth Rate Comparison by By Root (2016-2032)
- Table 140: Middle East & Africa Cycloplegic Agents Market Y-o-Y Growth Rate Comparison by By Indication (2016-2032)
- Table 141: Middle East & Africa Cycloplegic Agents Market Y-o-Y Growth Rate Comparison by By Distribution Channel (2016-2032)
- Table 142: Middle East & Africa Cycloplegic Agents Market Share Comparison by Country (2016-2032)
- Table 143: Middle East & Africa Cycloplegic Agents Market Share Comparison by By Mechanism (2016-2032)
- Table 144: Middle East & Africa Cycloplegic Agents Market Share Comparison by By Root (2016-2032)
- Table 145: Middle East & Africa Cycloplegic Agents Market Share Comparison by By Indication (2016-2032)
- Table 146: Middle East & Africa Cycloplegic Agents Market Share Comparison by By Distribution Channel (2016-2032)
- 1. Executive Summary
-
- Pfizer Inc. (U.S.)
- Novartis International AG
- Alcon Inc.
- Bausch Health Companies, Inc.
- Santen Pharmaceutical Co. Ltd.
- Akorn, Inc.
- Novartis International AG
- Henry Schein, Inc (U.S.)
- Actiza Pharmaceutical Private Limited (India)
- hameln pharma gmbh (Germany)
- Sigma Pharmaceuticals, LLC (U.S.)
- Biomedica (India)
- Prudence Pharma Chem (India)
- Heer Pharma Pvt. Ltd. (India)
- Fresenius Kabi AG (Germany)
- Other Key Players
Our Clients


View Our Licence Options
