
Cross Docking Services Market Report By Service Type (Traditional Cross-Docking, Opportunistic Cross-Docking, Consolidation Cross-Docking, Deconsolidation Cross-Docking), By Technology Integration (Automated Cross-Docking Systems, RFID Tracking Systems, Others, By Ownership Model, By Industry Vertical, By Region and Companies - Industry Segment Outlook, Market Assessment, Competition Scenario, Trends and Forecast 2024-2033
-
22676
-
Feb 2024
-
176
-


-
This report was compiled by Vishwa Gaul Vishwa is an experienced market research and consulting professional with over 8 years of expertise in the ICT industry, contributing to over 700 reports across telecommunications, software, hardware, and digital solutions. Correspondence Team Lead- ICT Linkedin | Detailed Market research Methodology Our methodology involves a mix of primary research, including interviews with leading mental health experts, and secondary research from reputable medical journals and databases. View Detailed Methodology Page
-
Quick Navigation
Report Overview
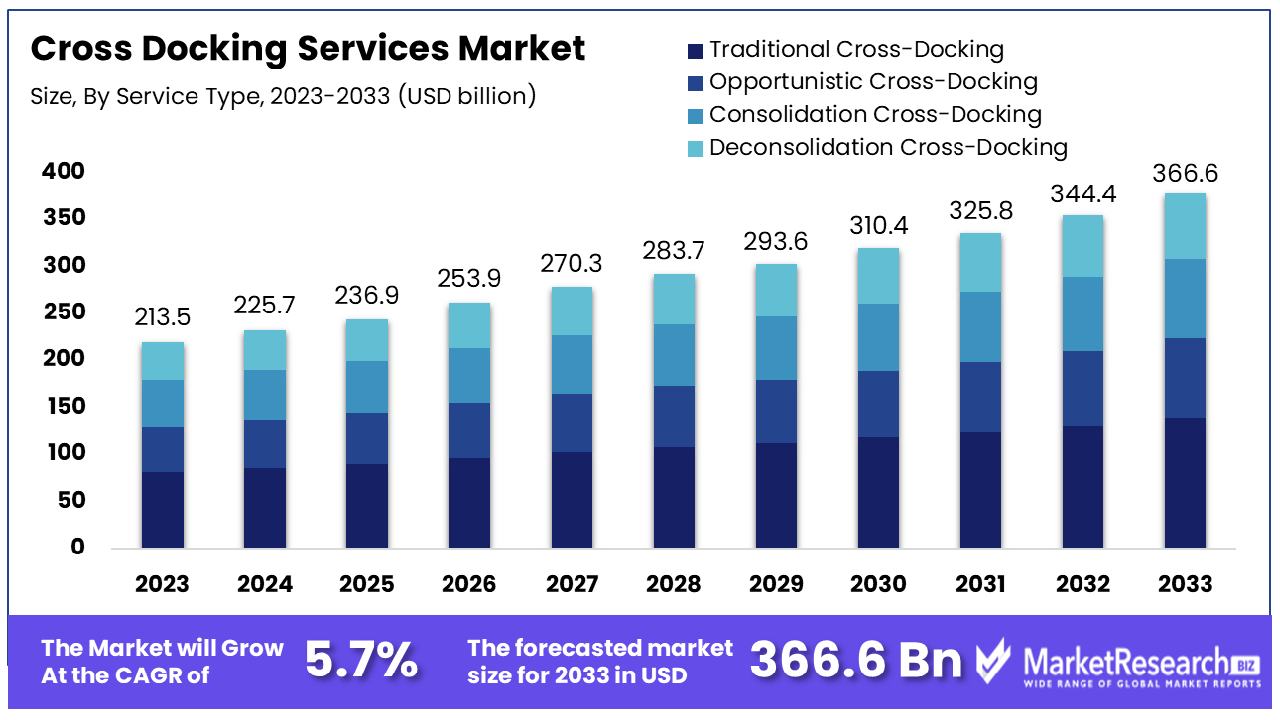
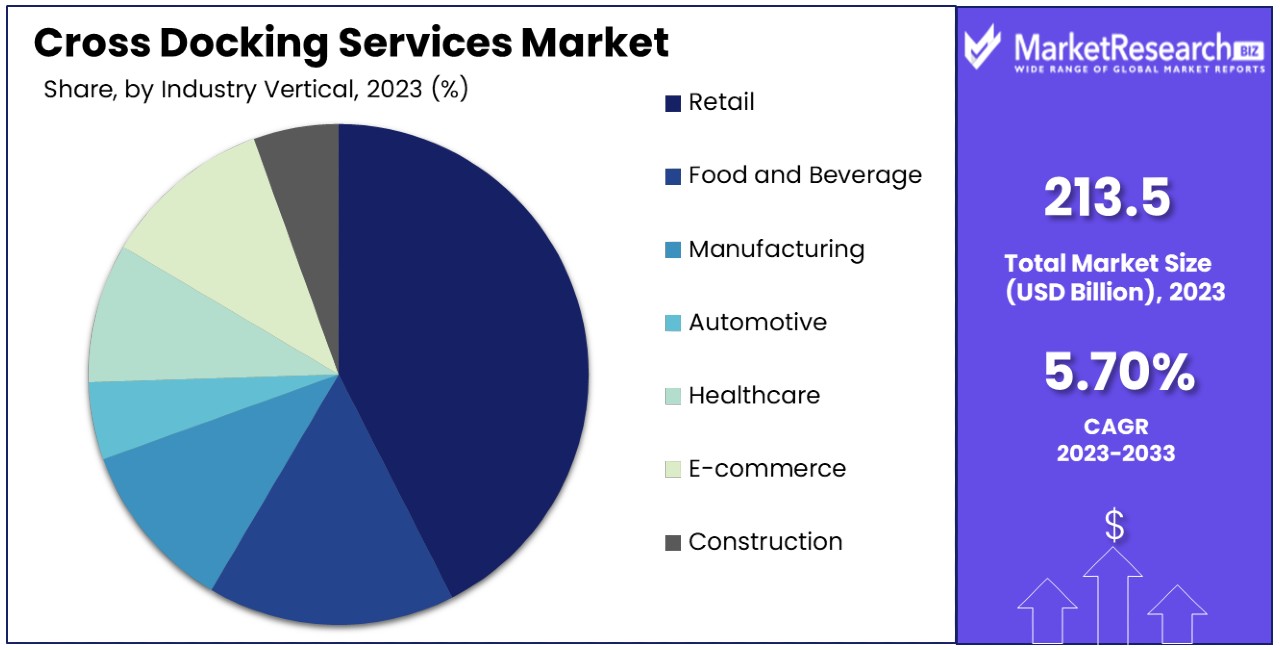
The Global Cross Docking Services Market size is expected to be worth around USD 366.6 Billion by 2033, from USD 213.5 Billion in 2023, growing at a CAGR of 5.70% during the forecast period from 2024 to 2033.
Cross docking services market refers to the logistics strategy where products from a supplier or manufacturing plant are distributed directly to a customer or retail chain with minimal to no handling or storage time. This method significantly reduces the storage and labor costs by eliminating the need for warehouse storage.
Distributor cross docking optimizes inventory flow, enhancing distribution efficiency and minimizing handling costs. It streamlines the supply chain, allowing for quicker delivery times and more efficient inventory management. The market is critical for businesses looking to enhance supply chain efficiency and responsiveness to consumer demand.
The Cross Docking Services Market is poised for substantial growth, underpinned by the resilience of global shipping and trade dynamics. According to the United Nations Conference on Trade and Development (UNCTAD), despite facing significant challenges from the global crises such as the war in Ukraine, maritime trade has shown remarkable resilience.
It is forecasted to expand by 2.4% in 2023 and maintain a growth rate of over 2% annually between 2024 and 2028. This positive trajectory indicates a robust demand for efficient logistics and supply chain solutions, highlighting the pivotal role of cross docking services in this ecosystem.
Furthermore, the United States' export sector has witnessed a notable increase, with goods exports rising by $37.6 billion or 2.5 percent in 2023, as reported by the U.S. Census Bureau and the U.S. Bureau of Economic Analysis. This uptick in trade activities underscores the growing need for cross docking services, which enhance supply chain efficiency by minimizing storage and handling times, thereby reducing costs and improving delivery speeds.
By leveraging these services, businesses can not only streamline their logistics operations but also respond more swiftly to market demands and customer needs. The cross docking services market is at a juncture of strategic importance, with its growth prospects closely aligned with the broader trends in global trade and logistics. As such, it represents a key area for investment and innovation, promising to deliver value across various sectors of the economy.
Key Takeaways
- Robust Market Growth: The Global Cross Docking Services Market is poised for substantial expansion, with the market size expected to reach approximately USD 366.6 Billion by 2033, compared to USD 213.5 Billion in 2023. This growth represents a significant CAGR of 5.70% during the forecast period from 2024 to 2033, indicating strong demand and opportunities within the industry.
- Service Type Dynamics: Traditional Cross-Docking emerges as the dominant service type, reflecting its widespread adoption and efficiency in supply chain operations.
- Technology Integration Trends: Automated Cross-Docking Systems lead in technology integration, driving efficiency and accuracy in cross-docking operations.
- Ownership Model Landscape: Third-Party Logistics (3PL) Providers dominate the ownership model, offering specialized cross-docking services to a diverse range of industries.
- Industry Vertical Insights: The Retail sector emerges as the dominant industry vertical, leveraging cross-docking services to optimize inventory management and meet customer demands efficiently.
- Regional Market Distribution: Asia Pacific holds a significant market share of 32%, indicating the region's growing importance as a hub for cross-docking activities.
- Key Players and Market Influence: Leading players in the Global Cross Docking Services Market include FedEx Corporation, United Parcel Service (UPS), XPO Logistics, Inc., DHL International GmbH, C.H. Robinson Worldwide, Inc., and others.
Driving Factors
E-Commerce Boom Drives Market Growth
The exponential growth of the e-commerce industry serves as a primary catalyst for the expansion of the Cross Docking Services Market. With e-commerce's share of all retail sales in Southeast Asia soaring to 20% from 5%, there's a marked increase in demand for fast and efficient order fulfillment services.
Cross docking, by facilitating the swift movement of products from inbound to outbound transportation, significantly reduces delivery times. This is particularly critical for e-commerce retailers who strive to meet consumer expectations for speed and efficiency in order processing and delivery. The adoption of cross docking in response to e-commerce growth exemplifies how digital market expansion directly influences logistics and supply chain optimization strategies.
Demand for Speedy Deliveries Spurs Growth
The modern consumer's expectation for shorter delivery times places immense pressure on retailers and third-party logistics providers (3PLs) to streamline their operations.
Cross docking emerges as a strategic response to this demand, enabling businesses to achieve same-day or next-day deliveries by minimizing or entirely skipping the warehousing process. This factor not only enhances customer satisfaction but also encourages more businesses to integrate cross docking into their logistics operations, thus fueling market growth.
Cost Efficiency Through Cross Docking
By reducing the need for warehousing and handling, cross docking presents a significant opportunity for companies to lower their supply chain costs. This efficiency is especially valuable in today's competitive market, where cost optimization can be a critical differentiator.
The shift towards cross docking reflects a broader industry trend towards leaner, more agile supply chain models, where reducing time and cost without compromising on service quality is paramount. As companies continue to adopt cross docking, its role in driving down logistics expenses while maintaining operational efficiency is expected to be a key driver of market growth.
Outsourcing Trends Elevate Cross Docking Demand
The increasing trend of outsourcing logistics operations, including transportation and warehousing to 3PLs, has significantly contributed to the growth of the Cross Docking Services Market. This outsourcing not only allows retailers and manufacturers to focus on their core competencies but also drives the demand for value-added services such as cross docking.
Transportation cross docking streamlines supply chains by directly transferring goods from inbound to outbound trucks, reducing storage time. As 3PLs enhance their service offerings to include cross docking, they meet the evolving needs of their clients for more efficient supply chain solutions. This symbiosis between outsourcing logistics operations and the demand for specialized services like cross docking underlines the interconnected nature of the market's growth factors, each amplifying the impact of the other.
Restraining Factors
High Upfront Investment Costs Restrain Market Growth
Implementing cross docking services demands substantial upfront investments in logistics infrastructure, material handling equipment, and advanced technology systems. This financial barrier can significantly deter adoption, particularly among smaller companies with limited capital.
The necessity for such investments not only encompasses the physical assets but also the integration of sophisticated software to manage real-time inventory and shipment tracking. As a result, while cross docking offers long-term savings and efficiency gains, the initial costs pose a considerable challenge, limiting market growth by restricting entry to entities capable of affording these upfront expenses.
Complex Coordination Restrains Market Growth
The effectiveness of cross docking hinges on precise coordination among all parties involved—suppliers, transportation providers, warehouses, and retailers. This coordination is critical to ensure that goods are promptly moved from inbound to outbound transportation without unnecessary delays or storage.
However, achieving such a level of alignment demands sophisticated scheduling systems and impeccable communication channels. Any misalignment or error in this tightly controlled process can lead to significant delays, increased costs, and errors in the supply chain, thereby restraining the market growth. The complexity of orchestrating these operations often places a strain on resources, particularly affecting companies without the necessary expertise or systems, further inhibiting the adoption of cross docking services.
Service Type Analysis
In the Cross Docking Services Market, the dominant sub-segment is Traditional Cross-Docking, which involves transferring goods directly from incoming to outgoing trucks with minimal or no storage time. This method is pivotal for businesses aiming to streamline their supply chain and reduce delivery times. Traditional cross-docking's efficiency in handling high-volume shipments makes it particularly attractive for retailers and manufacturers with time-sensitive products.
Meanwhile, Opportunistic Cross-Docking, which occurs when an opportunity arises to expedite the delivery of goods without a pre-planned schedule, plays a supportive role by offering flexibility in operations. Consolidation Cross-Docking, where goods from multiple suppliers are consolidated into a single shipment, and Deconsolidation Cross-Docking, which involves breaking down large shipments into smaller ones for easier distribution, also contribute to market growth.
These segments cater to specific needs within the logistics sector, such as reducing transportation costs and enhancing delivery efficiency. Each sub-segment, while having its unique role, collectively supports the overall market by offering a range of solutions tailored to different logistical requirements and business models.
Technology Integration Analysis
Automated Cross-Docking Systems dominate the technology integration segment of the Cross Docking Services Market. This technology enables seamless, efficient transfer of goods by minimizing manual handling, which significantly reduces the risk of errors and delays. Generative Artificial intelligence technologies enhance cross docking operations by predicting demand patterns and optimizing routes in real-time.
Automation enhances operational efficiency, making it possible to process large volumes of goods rapidly, which is crucial for meeting the tight delivery schedules demanded by e-commerce and retail sectors.On the other hand, RFID Tracking Systems play a critical role in improving the visibility and traceability of goods throughout the cross-docking process, ensuring accurate and timely deliveries. Warehouse Management Systems (WMS) and Transportation Management Systems (TMS) are integral for orchestrating complex logistics operations, offering tools for inventory management, scheduling, and route optimization.
Although Automated Cross-Docking Systems are at the forefront, the integration of RFID, WMS, and TMS technologies collectively fortifies the market by enabling more sophisticated, data-driven decision-making and operational efficiency. Together, these technologies drive the adoption of cross docking services by providing comprehensive solutions that address the multifaceted challenges of modern supply chains.
Ownership Model Analysis
Within the Cross Docking Services Market, Third-Party Logistics (3PL) Providers represent the dominant sub-segment, largely due to their expertise, scalability, and comprehensive service offerings that cater to a wide range of industries. These providers leverage their vast networks and technology to offer efficient cross-docking solutions that significantly reduce transit times and costs for businesses.
The ability of 3PLs to manage complex logistics operations allows companies to focus on their core activities without investing in logistics infrastructure. In contrast, In-house Cross-Docking Operations are typically adopted by large enterprises that have the volume and resources to justify the investment in their own cross-docking facilities. While this model offers greater control over the logistics process, it requires significant capital investment and operational expertise. The growth in the 3PL segment is fueled by the increasing tendency of businesses to outsource their logistics operations to focus on their core competencies and achieve cost efficiencies. Despite the dominance of 3PLs, in-house operations remain crucial for specific sectors where businesses prefer to maintain direct control over their supply chain for strategic reasons.
Industry Vertical Analysis
The Retail sector stands out as the dominant industry vertical in the Cross Docking Services Market, driven by the retail industry's need for rapid restocking of goods to meet consumer demand. Retailers leverage cross-docking to minimize storage costs and ensure that products reach the sales floor as quickly as possible. The efficiency of cross-docking in handling perishable goods and high-turnover products makes it particularly beneficial for this sector.
Other significant segments include the Food and Beverage industry, which relies on cross-docking to manage the timely distribution of perishable goods; Manufacturing, where it supports just-in-time inventory practices; Automotive, for parts distribution; Healthcare, for critical medical supplies; and E-commerce, which demands fast order fulfillment.
Manufacturing cross docking expedites the transfer of raw materials to production lines, fostering lean manufacturing practices. The Construction sector and other industries also benefit from cross-docking, using it to streamline supply chain operations and reduce project delays. Each vertical contributes to the growth of the market by adopting cross-docking solutions tailored to their specific operational needs and challenges, thereby enhancing overall efficiency and competitiveness in their respective fields.
Key Market Segments
By Service Type
- Traditional Cross-Docking
- Opportunistic Cross-Docking
- Consolidation Cross-Docking
- Deconsolidation Cross-Docking
By Technology Integration
- Automated Cross-Docking Systems
- RFID Tracking Systems
- Warehouse Management Systems (WMS)
- Transportation Management Systems (TMS)
By Ownership Model
- Third-Party Logistics (3PL) Providers
- In-house Cross-Docking Operations
By Industry Vertical
- Retail
- Food and Beverages Sector
- Manufacturing
- Automotive
- Healthcare and Pharmaceuticals
- E-commerce
- Construction
- Others
Growth Opportunities
Transportation/Logistics Industry Growth Offers Growth Opportunity
The expansion of the transportation and logistics industry globally presents significant growth opportunities for the Cross Docking Services Market. As trade volumes continue to rise, spurred by globalization and e-commerce, the demand for efficient, cost-effective logistics solutions like cross docking also increases.
This growth in the logistics sector allows cross docking service providers to expand their operations and tap into new markets. By reducing storage needs and improving supply chain velocity, cross docking becomes an essential service for companies looking to enhance their logistics efficiency. This factor, coupled with the increasing complexity and volume of global trade, positions cross docking as a key strategy for businesses aiming to stay competitive in the rapidly evolving logistics landscape.
Omnichannel Retail Offers Growth Opportunity
The adoption of omnichannel strategies by retailers underscores a significant growth opportunity for the Cross Docking Services Market. Omnichannel retailing, which integrates various shopping channels like online, mobile, and in-store to provide a seamless customer experience, requires efficient inventory management and fulfillment solutions.
Cross docking facilitates the faster processing of orders across these channels by enabling the direct transfer of products from inbound to outbound transportation, thus minimizing handling times and storage requirements. This efficiency is crucial for retailers to synchronize inventory across channels effectively, ensuring that customer expectations for rapid delivery and product availability are met. The growth of omnichannel retailing, therefore, directly contributes to the expansion potential of cross docking services, as businesses seek more agile and responsive supply chain solutions.
Trending Factors
Automation Are Trending Factors
The integration of automation technologies, such as Automated Guided Vehicles (AGVs), Automated Storage and Retrieval Systems (AS/RS), and robots within cross docking operations, is a significant trending factor in the Cross Docking Services Market. These technologies reduce labor costs and enhance accuracy and efficiency in the handling and transfer of goods.
The push towards automation is driven by the need for faster processing times and the reduction of human error, particularly in high-volume environments. As companies continue to seek ways to optimize their supply chains, the deployment of automation in cross docking operations aligns with these objectives by providing scalable and efficient logistics solutions. This trend not only reflects the evolving technological landscape but also the growing demand for more sophisticated, reliable, and cost-effective supply chain practices.
Green Logistics Are Trending Factors
Sustainability concerns are increasingly influencing companies to adopt greener warehousing and logistics practices, making green logistics a key trending factor in the Cross Docking Services Market. Cross docking plays a significant role in this trend by optimizing transportation routes and reducing the need for extended storage, thereby decreasing empty truck miles and emissions.
This approach to logistics not only helps companies minimize their environmental footprint but also aligns with the growing consumer and regulatory demand for more sustainable business practices. The emphasis on green logistics encourages the adoption of cross docking as a strategy to achieve more eco-friendly supply chain operations, highlighting its importance in the shift towards sustainability in the logistics industry.
Regional Analysis
Asia Pacific Dominates with 32% Market Share
The Asia Pacific region commands a significant 32% share of the Cross Docking Services Market, attributable to several key factors. This dominance is driven by the region's robust manufacturing sector, the rapid expansion of e-commerce, and substantial investments in logistics infrastructure.
The dense population centers with increasing consumer demand further contribute to the high volume of goods being transported, necessitating efficient logistics solutions like cross docking. The market dynamics in Asia Pacific are influenced by the region's embrace of technological innovations, such as automation and sustainable logistics practices, which enhance the efficiency of cross docking operations.
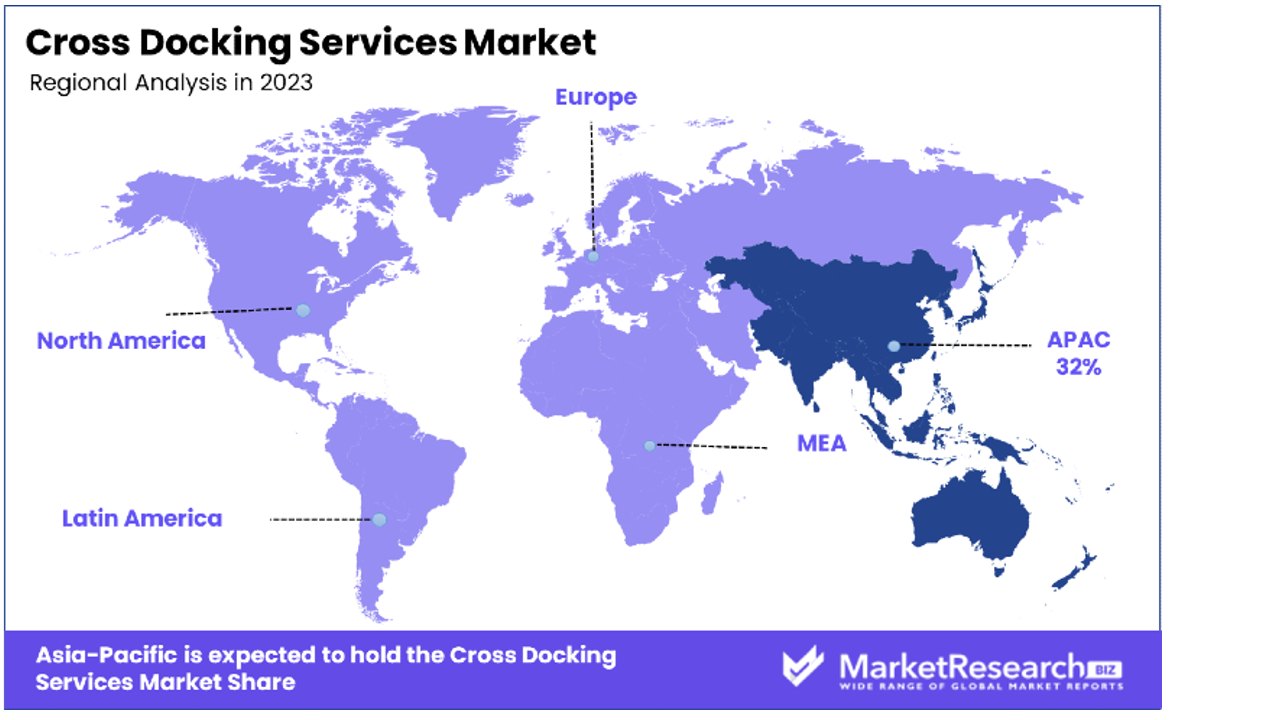
- North America: This region holds a substantial market share, with a focus on advanced logistics solutions driven by a sophisticated retail and e-commerce sector. The emphasis on technology and automation in logistics operations positions North America as a key player, with a market share around 28%.
- Europe: Europe's market share is influenced by its strong regulatory framework for sustainable logistics and advanced supply chain management practices. With a significant focus on reducing carbon emissions and enhancing operational efficiency, Europe holds approximately 25% of the market share.
- Middle East & Africa: Although this region is developing in terms of logistics infrastructure, it is experiencing rapid growth due to increasing trade and investment in logistics technology. The Middle East & Africa currently hold a smaller share of the market, around 8%, but are expected to grow steadily.
- Latin America: With emerging e-commerce platforms and improving logistics infrastructure, Latin America is seeing growth in the cross docking services market. The region currently accounts for around 7% of the market share, with potential for future expansion as it continues to develop its logistics capabilities.
Key Regions and Countries
- North America
- The US
- Canada
- Mexico
- Western Europe
- Germany
- France
- The UK
- Spain
- Italy
- Portugal
- Ireland
- Austria
- Switzerland
- Benelux
- Nordic
- Rest of Western Europe
- Eastern Europe
- Russia
- Poland
- The Czech Republic
- Greece
- Rest of Eastern Europe
- APAC
- China
- Japan
- South Korea
- India
- Australia & New Zealand
- Indonesia
- Malaysia
- Philippines
- Singapore
- Thailand
- Vietnam
- Rest of APAC
- Latin America
- Brazil
- Colombia
- Chile
- Argentina
- Costa Rica
- Rest of Latin America
- Middle East & Africa
- Algeria
- Egypt
- Israel
- Kuwait
- Nigeria
- Saudi Arabia
- South Africa
- Turkey
- United Arab Emirates
- Rest of MEA
Key Players Analysis
Within the Cross Docking Services Market, key players such as FedEx Corporation, United Parcel Service (UPS), XPO Logistics, Inc., and DHL International GmbH significantly shape market dynamics through their strategic positioning and expansive service offerings.
These companies, alongside others like C.H. Robinson Worldwide, Inc., and Maersk Line, leverage extensive logistics networks and advanced technology to offer efficient cross docking solutions globally. Their market influence is underscored by innovative logistics strategies and partnerships that enhance supply chain agility and cost-effectiveness for clients across various industries.
While specific market shares for each company are not provided, their collective impact contributes to the competitive landscape, driving advancements and setting industry standards in cross docking services. The presence of these key players underscores the market's growth potential, with their strategic initiatives aimed at expanding reach and improving service delivery, thereby reinforcing their market influence and positioning within the global logistics ecosystem.
Market Key Players
- FedEx Corporation
- United Parcel Service (UPS)
- XPO Logistics, Inc.
- Kenco Group
- Deutsche Bahn Group
- DHL International GmbH
- C.H. Robinson Worldwide, Inc.
- Schneider National, Inc.
- J.B. Hunt Transport Services, Inc.
- Ryder System, Inc.
- Penske Logistics
- Maersk Line
- Expeditors International of Washington, Inc.
- CEVA Logistics
- Kuehne + Nagel International AG
- Saddle Creek Logistics Services
- Yusen Logistics Co., Ltd.
- Toll Holdings Limited
- Werner Enterprises, Inc.
Recent Developments
- On November 2023, Maersk has initiated the construction of a new large cold storage facility in Rotterdam, the Netherlands. This specialized warehouse, adjacent to the Maasvlakte II terminal operated by Maersk-owned APM Terminals, spans 40,000 m² and is set to be operational in the fourth quarter of 2024.
- On October 2023, Samskip has expanded its operations in the Baltic Sea region by introducing a new direct short-sea service between Finland, Latvia, the United Kingdom, and the Netherlands. Additionally, Samskip will offer customized value-added services, such as customs clearance support and land transport, to deliver a seamless door-to-door service.
- On September 2023, C.H. Robinson has recently opened one of the largest cross-border logistics facilities in Laredo, Texas, enhancing trade across the Mexico border. This facility, spanning 400,000 square feet with 154 dock doors and space for 700 trailers, aims to expedite trade operations in the region.
Report Scope
Report Features Description Market Value (2023) USD 213.5 Billion Forecast Revenue (2033) USD 366.6 Billion CAGR (2024-2033) 5.70% Base Year for Estimation 2023 Historic Period 2018-2023 Forecast Period 2024-2033 Report Coverage Revenue Forecast, Market Dynamics, Competitive Landscape, Recent Developments Segments Covered By Service Type (Traditional Cross-Docking, Opportunistic Cross-Docking, Consolidation Cross-Docking, Deconsolidation Cross-Docking), By Technology Integration (Automated Cross-Docking Systems, RFID Tracking Systems, Warehouse Management Systems (WMS), Transportation Management Systems (TMS)), By Ownership Model (Third-Party Logistics (3PL) Providers, In-house Cross-Docking Operations), By Industry Vertical (Retail, Food and Beverage, Manufacturing, Automotive, Healthcare and Pharmaceuticals, E-commerce, Construction, Others) Regional Analysis North America - The US, Canada, & Mexico; Western Europe - Germany, France, The UK, Spain, Italy, Portugal, Ireland, Austria, Switzerland, Benelux, Nordic, & Rest of Western Europe; Eastern Europe - Russia, Poland, The Czech Republic, Greece, & Rest of Eastern Europe; APAC - China, Japan, South Korea, India, Australia & New Zealand, Indonesia, Malaysia, Philippines, Singapore, Thailand, Vietnam, & Rest of APAC; Latin America - Brazil, Colombia, Chile, Argentina, Costa Rica, & Rest of Latin America; Middle East & Africa - Algeria, Egypt, Israel, Kuwait, Nigeria, Saudi Arabia, South Africa, Turkey, United Arab Emirates, & Rest of MEA Competitive Landscape FedEx Corporation, United Parcel Service (UPS), XPO Logistics, Inc., DHL International GmbH, C.H. Robinson Worldwide, Inc., Kenco Group, Deutsche Bahn Group, Schneider National, Inc., J.B. Hunt Transport Services, Inc., Ryder System, Inc., Penske Logistics, Maersk Line, Expeditors International of Washington, Inc., Saddle Creek Logistics Services, CEVA Logistics, Toll Holdings Limited, Kuehne + Nagel International AG, Yusen Logistics Co., Ltd., Werner Enterprises, Inc. Customization Scope Customization for segments, region/country-level will be provided. Moreover, additional customization can be done based on the requirements. Purchase Options We have three licenses to opt for: Single User License, Multi-User License (Up to 5 Users), Corporate Use License (Unlimited User and Printable PDF) -
- 1. Executive Summary
- 1.1. Definition
- 1.2. Taxonomy
- 1.3. Research Scope
- 1.4. Key Analysis
- 1.5. Key Findings by Major Segments
- 1.6. Top strategies by Major Players
- 2. Global Cross Docking Services Market Overview
- 2.1. Cross Docking Services Market Dynamics
- 2.1.1. Drivers
- 2.1.2. Opportunities
- 2.1.3. Restraints
- 2.1.4. Challenges
- 2.2. Macro-economic Factors
- 2.3. Regulatory Framework
- 2.4. Market Investment Feasibility Index
- 2.5. PEST Analysis
- 2.6. PORTER’S Five Force Analysis
- 2.7. Drivers & Restraints Impact Analysis
- 2.8. Industry Chain Analysis
- 2.9. Cost Structure Analysis
- 2.10. Marketing Strategy
- 2.11. Russia-Ukraine War Impact Analysis
- 2.12. Opportunity Map Analysis
- 2.13. Market Competition Scenario Analysis
- 2.14. Product Life Cycle Analysis
- 2.15. Opportunity Orbits
- 2.16. Manufacturer Intensity Map
- 2.17. Major Companies sales by Value & Volume
- 2.1. Cross Docking Services Market Dynamics
- 3. Global Cross Docking Services Market Analysis, Opportunity and Forecast, 2018-2033
- 3.1. Global Cross Docking Services Market Analysis, 2018-2021
- 3.2. Global Cross Docking Services Market Opportunity and Forecast, 2023-2033
- 3.3. Global Cross Docking Services Market Analysis, Opportunity and Forecast, By Service Type, 2018-2033
- 3.3.1. Global Cross Docking Services Market Analysis by Service Type: Introduction
- 3.3.2. Market Size Absolute $ Opportunity Analysis and Forecast, By Service Type, 2018-2033
- 3.3.3. Traditional Cross-Docking
- 3.3.4. Opportunistic Cross-Docking
- 3.3.5. Consolidation Cross-Docking
- 3.3.6. Deconsolidation Cross-Docking
- 3.4. Global Cross Docking Services Market Analysis, Opportunity and Forecast, By Technology Integration, 2018-2033
- 3.4.1. Global Cross Docking Services Market Analysis by Technology Integration: Introduction
- 3.4.2. Market Size Absolute $ Opportunity Analysis and Forecast, By Technology Integration, 2018-2033
- 3.4.3. Automated Cross-Docking Systems
- 3.4.4. RFID Tracking Systems
- 3.4.5. Warehouse Management Systems (WMS)
- 3.4.6. Transportation Management Systems (TMS)
- 3.4.7. By Ownership Model
- 3.4.8. Third-Party Logistics (3PL) Providers
- 3.4.9. In-house Cross-Docking Operations
- 3.5. Global Cross Docking Services Market Analysis, Opportunity and Forecast, By Industry Vertical, 2018-2033
- 3.5.1. Global Cross Docking Services Market Analysis by Industry Vertical: Introduction
- 3.5.2. Market Size Absolute $ Opportunity Analysis and Forecast, By Industry Vertical, 2018-2033
- 3.5.3. Retail
- 3.5.4. Food and Beverages Sector
- 3.5.5. Manufacturing
- 3.5.6. Automotive
- 3.5.7. Healthcare and Pharmaceuticals
- 3.5.8. E-commerce
- 3.5.9. Construction
- 3.5.10. Others
- 4. North America Cross Docking Services Market Analysis, Opportunity and Forecast, 2018-2033
- 4.1. North America Cross Docking Services Market Analysis, 2018-2021
- 4.2. North America Cross Docking Services Market Opportunity and Forecast, 2023-2033
- 4.3. North America Cross Docking Services Market Analysis, Opportunity and Forecast, By Service Type, 2018-2033
- 4.3.1. North America Cross Docking Services Market Analysis by Service Type: Introduction
- 4.3.2. Market Size Absolute $ Opportunity Analysis and Forecast, By Service Type, 2018-2033
- 4.3.3. Traditional Cross-Docking
- 4.3.4. Opportunistic Cross-Docking
- 4.3.5. Consolidation Cross-Docking
- 4.3.6. Deconsolidation Cross-Docking
- 4.4. North America Cross Docking Services Market Analysis, Opportunity and Forecast, By Technology Integration, 2018-2033
- 4.4.1. North America Cross Docking Services Market Analysis by Technology Integration: Introduction
- 4.4.2. Market Size Absolute $ Opportunity Analysis and Forecast, By Technology Integration, 2018-2033
- 4.4.3. Automated Cross-Docking Systems
- 4.4.4. RFID Tracking Systems
- 4.4.5. Warehouse Management Systems (WMS)
- 4.4.6. Transportation Management Systems (TMS)
- 4.4.7. By Ownership Model
- 4.4.8. Third-Party Logistics (3PL) Providers
- 4.4.9. In-house Cross-Docking Operations
- 4.5. North America Cross Docking Services Market Analysis, Opportunity and Forecast, By Industry Vertical, 2018-2033
- 4.5.1. North America Cross Docking Services Market Analysis by Industry Vertical: Introduction
- 4.5.2. Market Size Absolute $ Opportunity Analysis and Forecast, By Industry Vertical, 2018-2033
- 4.5.3. Retail
- 4.5.4. Food and Beverages Sector
- 4.5.5. Manufacturing
- 4.5.6. Automotive
- 4.5.7. Healthcare and Pharmaceuticals
- 4.5.8. E-commerce
- 4.5.9. Construction
- 4.5.10. Others
- 4.6. North America Cross Docking Services Market Analysis, Opportunity and Forecast, By Country , 2018-2033
- 4.6.1. North America Cross Docking Services Market Analysis by Country : Introduction
- 4.6.2. Market Size Absolute $ Opportunity Analysis and Forecast, Country , 2018-2033
- 4.6.2.1. The US
- 4.6.2.2. Canada
- 4.6.2.3. Mexico
- 5. Western Europe Cross Docking Services Market Analysis, Opportunity and Forecast, 2018-2033
- 5.1. Western Europe Cross Docking Services Market Analysis, 2018-2021
- 5.2. Western Europe Cross Docking Services Market Opportunity and Forecast, 2023-2033
- 5.3. Western Europe Cross Docking Services Market Analysis, Opportunity and Forecast, By Service Type, 2018-2033
- 5.3.1. Western Europe Cross Docking Services Market Analysis by Service Type: Introduction
- 5.3.2. Market Size Absolute $ Opportunity Analysis and Forecast, By Service Type, 2018-2033
- 5.3.3. Traditional Cross-Docking
- 5.3.4. Opportunistic Cross-Docking
- 5.3.5. Consolidation Cross-Docking
- 5.3.6. Deconsolidation Cross-Docking
- 5.4. Western Europe Cross Docking Services Market Analysis, Opportunity and Forecast, By Technology Integration, 2018-2033
- 5.4.1. Western Europe Cross Docking Services Market Analysis by Technology Integration: Introduction
- 5.4.2. Market Size Absolute $ Opportunity Analysis and Forecast, By Technology Integration, 2018-2033
- 5.4.3. Automated Cross-Docking Systems
- 5.4.4. RFID Tracking Systems
- 5.4.5. Warehouse Management Systems (WMS)
- 5.4.6. Transportation Management Systems (TMS)
- 5.4.7. By Ownership Model
- 5.4.8. Third-Party Logistics (3PL) Providers
- 5.4.9. In-house Cross-Docking Operations
- 5.5. Western Europe Cross Docking Services Market Analysis, Opportunity and Forecast, By Industry Vertical, 2018-2033
- 5.5.1. Western Europe Cross Docking Services Market Analysis by Industry Vertical: Introduction
- 5.5.2. Market Size Absolute $ Opportunity Analysis and Forecast, By Industry Vertical, 2018-2033
- 5.5.3. Retail
- 5.5.4. Food and Beverages Sector
- 5.5.5. Manufacturing
- 5.5.6. Automotive
- 5.5.7. Healthcare and Pharmaceuticals
- 5.5.8. E-commerce
- 5.5.9. Construction
- 5.5.10. Others
- 5.6. Western Europe Cross Docking Services Market Analysis, Opportunity and Forecast, By Country , 2018-2033
- 5.6.1. Western Europe Cross Docking Services Market Analysis by Country : Introduction
- 5.6.2. Market Size Absolute $ Opportunity Analysis and Forecast, Country , 2018-2033
- 5.6.2.1. Germany
- 5.6.2.2. France
- 5.6.2.3. The UK
- 5.6.2.4. Spain
- 5.6.2.5. Italy
- 5.6.2.6. Portugal
- 5.6.2.7. Ireland
- 5.6.2.8. Austria
- 5.6.2.9. Switzerland
- 5.6.2.10. Benelux
- 5.6.2.11. Nordic
- 5.6.2.12. Rest of Western Europe
- 6. Eastern Europe Cross Docking Services Market Analysis, Opportunity and Forecast, 2018-2033
- 6.1. Eastern Europe Cross Docking Services Market Analysis, 2018-2021
- 6.2. Eastern Europe Cross Docking Services Market Opportunity and Forecast, 2023-2033
- 6.3. Eastern Europe Cross Docking Services Market Analysis, Opportunity and Forecast, By Service Type, 2018-2033
- 6.3.1. Eastern Europe Cross Docking Services Market Analysis by Service Type: Introduction
- 6.3.2. Market Size Absolute $ Opportunity Analysis and Forecast, By Service Type, 2018-2033
- 6.3.3. Traditional Cross-Docking
- 6.3.4. Opportunistic Cross-Docking
- 6.3.5. Consolidation Cross-Docking
- 6.3.6. Deconsolidation Cross-Docking
- 6.4. Eastern Europe Cross Docking Services Market Analysis, Opportunity and Forecast, By Technology Integration, 2018-2033
- 6.4.1. Eastern Europe Cross Docking Services Market Analysis by Technology Integration: Introduction
- 6.4.2. Market Size Absolute $ Opportunity Analysis and Forecast, By Technology Integration, 2018-2033
- 6.4.3. Automated Cross-Docking Systems
- 6.4.4. RFID Tracking Systems
- 6.4.5. Warehouse Management Systems (WMS)
- 6.4.6. Transportation Management Systems (TMS)
- 6.4.7. By Ownership Model
- 6.4.8. Third-Party Logistics (3PL) Providers
- 6.4.9. In-house Cross-Docking Operations
- 6.5. Eastern Europe Cross Docking Services Market Analysis, Opportunity and Forecast, By Industry Vertical, 2018-2033
- 6.5.1. Eastern Europe Cross Docking Services Market Analysis by Industry Vertical: Introduction
- 6.5.2. Market Size Absolute $ Opportunity Analysis and Forecast, By Industry Vertical, 2018-2033
- 6.5.3. Retail
- 6.5.4. Food and Beverages Sector
- 6.5.5. Manufacturing
- 6.5.6. Automotive
- 6.5.7. Healthcare and Pharmaceuticals
- 6.5.8. E-commerce
- 6.5.9. Construction
- 6.5.10. Others
- 6.6. Eastern Europe Cross Docking Services Market Analysis, Opportunity and Forecast, By Country , 2018-2033
- 6.6.1. Eastern Europe Cross Docking Services Market Analysis by Country : Introduction
- 6.6.2. Market Size Absolute $ Opportunity Analysis and Forecast, Country , 2018-2033
- 6.6.2.1. Russia
- 6.6.2.2. Poland
- 6.6.2.3. The Czech Republic
- 6.6.2.4. Greece
- 6.6.2.5. Rest of Eastern Europe
- 7. APAC Cross Docking Services Market Analysis, Opportunity and Forecast, 2018-2033
- 7.1. APAC Cross Docking Services Market Analysis, 2018-2021
- 7.2. APAC Cross Docking Services Market Opportunity and Forecast, 2023-2033
- 7.3. APAC Cross Docking Services Market Analysis, Opportunity and Forecast, By Service Type, 2018-2033
- 7.3.1. APAC Cross Docking Services Market Analysis by Service Type: Introduction
- 7.3.2. Market Size Absolute $ Opportunity Analysis and Forecast, By Service Type, 2018-2033
- 7.3.3. Traditional Cross-Docking
- 7.3.4. Opportunistic Cross-Docking
- 7.3.5. Consolidation Cross-Docking
- 7.3.6. Deconsolidation Cross-Docking
- 7.4. APAC Cross Docking Services Market Analysis, Opportunity and Forecast, By Technology Integration, 2018-2033
- 7.4.1. APAC Cross Docking Services Market Analysis by Technology Integration: Introduction
- 7.4.2. Market Size Absolute $ Opportunity Analysis and Forecast, By Technology Integration, 2018-2033
- 7.4.3. Automated Cross-Docking Systems
- 7.4.4. RFID Tracking Systems
- 7.4.5. Warehouse Management Systems (WMS)
- 7.4.6. Transportation Management Systems (TMS)
- 7.4.7. By Ownership Model
- 7.4.8. Third-Party Logistics (3PL) Providers
- 7.4.9. In-house Cross-Docking Operations
- 7.5. APAC Cross Docking Services Market Analysis, Opportunity and Forecast, By Industry Vertical, 2018-2033
- 7.5.1. APAC Cross Docking Services Market Analysis by Industry Vertical: Introduction
- 7.5.2. Market Size Absolute $ Opportunity Analysis and Forecast, By Industry Vertical, 2018-2033
- 7.5.3. Retail
- 7.5.4. Food and Beverages Sector
- 7.5.5. Manufacturing
- 7.5.6. Automotive
- 7.5.7. Healthcare and Pharmaceuticals
- 7.5.8. E-commerce
- 7.5.9. Construction
- 7.5.10. Others
- 7.6. APAC Cross Docking Services Market Analysis, Opportunity and Forecast, By Country , 2018-2033
- 7.6.1. APAC Cross Docking Services Market Analysis by Country : Introduction
- 7.6.2. Market Size Absolute $ Opportunity Analysis and Forecast, Country , 2018-2033
- 7.6.2.1. China
- 7.6.2.2. Japan
- 7.6.2.3. South Korea
- 7.6.2.4. India
- 7.6.2.5. Australia & New Zeland
- 7.6.2.6. Indonesia
- 7.6.2.7. Malaysia
- 7.6.2.8. Philippines
- 7.6.2.9. Singapore
- 7.6.2.10. Thailand
- 7.6.2.11. Vietnam
- 7.6.2.12. Rest of APAC
- 8. Latin America Cross Docking Services Market Analysis, Opportunity and Forecast, 2018-2033
- 8.1. Latin America Cross Docking Services Market Analysis, 2018-2021
- 8.2. Latin America Cross Docking Services Market Opportunity and Forecast, 2023-2033
- 8.3. Latin America Cross Docking Services Market Analysis, Opportunity and Forecast, By Service Type, 2018-2033
- 8.3.1. Latin America Cross Docking Services Market Analysis by Service Type: Introduction
- 8.3.2. Market Size Absolute $ Opportunity Analysis and Forecast, By Service Type, 2018-2033
- 8.3.3. Traditional Cross-Docking
- 8.3.4. Opportunistic Cross-Docking
- 8.3.5. Consolidation Cross-Docking
- 8.3.6. Deconsolidation Cross-Docking
- 8.4. Latin America Cross Docking Services Market Analysis, Opportunity and Forecast, By Technology Integration, 2018-2033
- 8.4.1. Latin America Cross Docking Services Market Analysis by Technology Integration: Introduction
- 8.4.2. Market Size Absolute $ Opportunity Analysis and Forecast, By Technology Integration, 2018-2033
- 8.4.3. Automated Cross-Docking Systems
- 8.4.4. RFID Tracking Systems
- 8.4.5. Warehouse Management Systems (WMS)
- 8.4.6. Transportation Management Systems (TMS)
- 8.4.7. By Ownership Model
- 8.4.8. Third-Party Logistics (3PL) Providers
- 8.4.9. In-house Cross-Docking Operations
- 8.5. Latin America Cross Docking Services Market Analysis, Opportunity and Forecast, By Industry Vertical, 2018-2033
- 8.5.1. Latin America Cross Docking Services Market Analysis by Industry Vertical: Introduction
- 8.5.2. Market Size Absolute $ Opportunity Analysis and Forecast, By Industry Vertical, 2018-2033
- 8.5.3. Retail
- 8.5.4. Food and Beverages Sector
- 8.5.5. Manufacturing
- 8.5.6. Automotive
- 8.5.7. Healthcare and Pharmaceuticals
- 8.5.8. E-commerce
- 8.5.9. Construction
- 8.5.10. Others
- 8.6. Latin America Cross Docking Services Market Analysis, Opportunity and Forecast, By Country , 2018-2033
- 8.6.1. Latin America Cross Docking Services Market Analysis by Country : Introduction
- 8.6.2. Market Size Absolute $ Opportunity Analysis and Forecast, Country , 2018-2033
- 8.6.2.1. Brazil
- 8.6.2.2. Colombia
- 8.6.2.3. Chile
- 8.6.2.4. Argentina
- 8.6.2.5. Costa Rica
- 8.6.2.6. Rest of Latin America
- 9. Middle East & Africa Cross Docking Services Market Analysis, Opportunity and Forecast, 2018-2033
- 9.1. Middle East & Africa Cross Docking Services Market Analysis, 2018-2021
- 9.2. Middle East & Africa Cross Docking Services Market Opportunity and Forecast, 2023-2033
- 9.3. Middle East & Africa Cross Docking Services Market Analysis, Opportunity and Forecast, By Service Type, 2018-2033
- 9.3.1. Middle East & Africa Cross Docking Services Market Analysis by Service Type: Introduction
- 9.3.2. Market Size Absolute $ Opportunity Analysis and Forecast, By Service Type, 2018-2033
- 9.3.3. Traditional Cross-Docking
- 9.3.4. Opportunistic Cross-Docking
- 9.3.5. Consolidation Cross-Docking
- 9.3.6. Deconsolidation Cross-Docking
- 9.4. Middle East & Africa Cross Docking Services Market Analysis, Opportunity and Forecast, By Technology Integration, 2018-2033
- 9.4.1. Middle East & Africa Cross Docking Services Market Analysis by Technology Integration: Introduction
- 9.4.2. Market Size Absolute $ Opportunity Analysis and Forecast, By Technology Integration, 2018-2033
- 9.4.3. Automated Cross-Docking Systems
- 9.4.4. RFID Tracking Systems
- 9.4.5. Warehouse Management Systems (WMS)
- 9.4.6. Transportation Management Systems (TMS)
- 9.4.7. By Ownership Model
- 9.4.8. Third-Party Logistics (3PL) Providers
- 9.4.9. In-house Cross-Docking Operations
- 9.5. Middle East & Africa Cross Docking Services Market Analysis, Opportunity and Forecast, By Industry Vertical, 2018-2033
- 9.5.1. Middle East & Africa Cross Docking Services Market Analysis by Industry Vertical: Introduction
- 9.5.2. Market Size Absolute $ Opportunity Analysis and Forecast, By Industry Vertical, 2018-2033
- 9.5.3. Retail
- 9.5.4. Food and Beverages Sector
- 9.5.5. Manufacturing
- 9.5.6. Automotive
- 9.5.7. Healthcare and Pharmaceuticals
- 9.5.8. E-commerce
- 9.5.9. Construction
- 9.5.10. Others
- 9.6. Middle East & Africa Cross Docking Services Market Analysis, Opportunity and Forecast, By Country , 2018-2033
- 9.6.1. Middle East & Africa Cross Docking Services Market Analysis by Country : Introduction
- 9.6.2. Market Size Absolute $ Opportunity Analysis and Forecast, Country , 2018-2033
- 9.6.2.1. Algeria
- 9.6.2.2. Egypt
- 9.6.2.3. Israel
- 9.6.2.4. Kuwait
- 9.6.2.5. Nigeria
- 9.6.2.6. Saudi Arabia
- 9.6.2.7. South Africa
- 9.6.2.8. Turkey
- 9.6.2.9. The UAE
- 9.6.2.10. Rest of MEA
- 10. Global Cross Docking Services Market Analysis, Opportunity and Forecast, By Region , 2018-2033
- 10.1. Global Cross Docking Services Market Analysis by Region : Introduction
- 10.2. Market Size Absolute $ Opportunity Analysis and Forecast, By Region , 2018-2033
- 10.2.1. North America
- 10.2.2. Western Europe
- 10.2.3. Eastern Europe
- 10.2.4. APAC
- 10.2.5. Latin America
- 10.2.6. Middle East & Africa
- 11. Global Cross Docking Services Market Competitive Landscape, Market Share Analysis, and Company Profiles
- 11.1. Market Share Analysis
- 11.2. Company Profiles
- 11.3. FedEx Corporation
- 11.3.1. Company Overview
- 11.3.2. Financial Highlights
- 11.3.3. Product Portfolio
- 11.3.4. SWOT Analysis
- 11.3.5. Key Strategies and Developments
- 11.4. (US$ Mn & Units)ed Parcel Service (UPS)
- 11.4.1. Company Overview
- 11.4.2. Financial Highlights
- 11.4.3. Product Portfolio
- 11.4.4. SWOT Analysis
- 11.4.5. Key Strategies and Developments
- 11.5. XPO Logistics, Inc.
- 11.5.1. Company Overview
- 11.5.2. Financial Highlights
- 11.5.3. Product Portfolio
- 11.5.4. SWOT Analysis
- 11.5.5. Key Strategies and Developments
- 11.6. Kenco Group
- 11.6.1. Company Overview
- 11.6.2. Financial Highlights
- 11.6.3. Product Portfolio
- 11.6.4. SWOT Analysis
- 11.6.5. Key Strategies and Developments
- 11.7. Deutsche Bahn Group
- 11.7.1. Company Overview
- 11.7.2. Financial Highlights
- 11.7.3. Product Portfolio
- 11.7.4. SWOT Analysis
- 11.7.5. Key Strategies and Developments
- 11.8. DHL International GmbH
- 11.8.1. Company Overview
- 11.8.2. Financial Highlights
- 11.8.3. Product Portfolio
- 11.8.4. SWOT Analysis
- 11.8.5. Key Strategies and Developments
- 11.9. C.H. Robinson Worldwide, Inc.
- 11.9.1. Company Overview
- 11.9.2. Financial Highlights
- 11.9.3. Product Portfolio
- 11.9.4. SWOT Analysis
- 11.9.5. Key Strategies and Developments
- 11.10. Schneider National, Inc.
- 11.10.1. Company Overview
- 11.10.2. Financial Highlights
- 11.10.3. Product Portfolio
- 11.10.4. SWOT Analysis
- 11.10.5. Key Strategies and Developments
- 11.11. J.B. Hunt Transport Services, Inc.
- 11.11.1. Company Overview
- 11.11.2. Financial Highlights
- 11.11.3. Product Portfolio
- 11.11.4. SWOT Analysis
- 11.11.5. Key Strategies and Developments
- 11.12. Ryder System, Inc.
- 11.12.1. Company Overview
- 11.12.2. Financial Highlights
- 11.12.3. Product Portfolio
- 11.12.4. SWOT Analysis
- 11.12.5. Key Strategies and Developments
- 11.13.1. Company Overview
- 11.13.2. Financial Highlights
- 11.13.3. Product Portfolio
- 11.13.4. SWOT Analysis
- 11.13.5. Key Strategies and Developments
- 11.14. Penske Logistics
- 11.14.1. Company Overview
- 11.14.2. Financial Highlights
- 11.14.3. Product Portfolio
- 11.14.4. SWOT Analysis
- 11.14.5. Key Strategies and Developments
- 11.15. Expeditors International of Washington, Inc.
- 11.15.1. Company Overview
- 11.15.2. Financial Highlights
- 11.15.3. Product Portfolio
- 11.15.4. SWOT Analysis
- 11.15.5. Key Strategies and Developments
- 11.16. CEVA Logistics
- 11.16.1. Company Overview
- 11.16.2. Financial Highlights
- 11.16.3. Product Portfolio
- 11.16.4. SWOT Analysis
- 11.16.5. Key Strategies and Developments
- 11.17. Kuehne + Nagel International AG
- 11.17.1. Company Overview
- 11.17.2. Financial Highlights
- 11.17.3. Product Portfolio
- 11.17.4. SWOT Analysis
- 11.17.5. Key Strategies and Developments
- 11.18. Saddle Creek Logistics Services
- 11.18.1. Company Overview
- 11.18.2. Financial Highlights
- 11.18.3. Product Portfolio
- 11.18.4. SWOT Analysis
- 11.18.5. Key Strategies and Developments
- 11.19. Yusen Logistics Co., Ltd.
- 11.19.1. Company Overview
- 11.19.2. Financial Highlights
- 11.19.3. Product Portfolio
- 11.19.4. SWOT Analysis
- 11.19.5. Key Strategies and Developments
- 11.20. Toll Holdings Limited
- 11.20.1. Company Overview
- 11.20.2. Financial Highlights
- 11.20.3. Product Portfolio
- 11.20.4. SWOT Analysis
- 11.20.5. Key Strategies and Developments
- 11.21. Werner Enterprises, Inc.
- 11.21.1. Company Overview
- 11.21.2. Financial Highlights
- 11.21.3. Product Portfolio
- 11.21.4. SWOT Analysis
- 11.21.5. Key Strategies and Developments
- 12. Assumptions and Acronyms
- 13. Research Methodology
- 14. Contact
- List of Figures
- Figure 1: Global Cross Docking Services Market Revenue (US$ Mn) Market Share by Service Type in 2022
- Figure 2: Global Cross Docking Services Market Attractiveness Analysis by Service Type, 2018-2033
- Figure 3: Global Cross Docking Services Market Revenue (US$ Mn) Market Share by Technology Integrationin 2022
- Figure 4: Global Cross Docking Services Market Attractiveness Analysis by Technology Integration, 2018-2033
- Figure 5: Global Cross Docking Services Market Revenue (US$ Mn) Market Share by Industry Verticalin 2022
- Figure 6: Global Cross Docking Services Market Attractiveness Analysis by Industry Vertical, 2018-2033
- Figure 7: Global Cross Docking Services Market Revenue (US$ Mn) Market Share by Region in 2022
- Figure 8: Global Cross Docking Services Market Attractiveness Analysis by Region, 2018-2033
- Figure 9: Global Cross Docking Services Market Revenue (US$ Mn) (2018-2033)
- Figure 10: Global Cross Docking Services Market Revenue (US$ Mn) Comparison by Region (2018-2033)
- Figure 11: Global Cross Docking Services Market Revenue (US$ Mn) Comparison by Service Type (2018-2033)
- Figure 12: Global Cross Docking Services Market Revenue (US$ Mn) Comparison by Technology Integration (2018-2033)
- Figure 13: Global Cross Docking Services Market Revenue (US$ Mn) Comparison by Industry Vertical (2018-2033)
- Figure 14: Global Cross Docking Services Market Y-o-Y Growth Rate Comparison by Region (2018-2033)
- Figure 15: Global Cross Docking Services Market Y-o-Y Growth Rate Comparison by Service Type (2018-2033)
- Figure 16: Global Cross Docking Services Market Y-o-Y Growth Rate Comparison by Technology Integration (2018-2033)
- Figure 17: Global Cross Docking Services Market Y-o-Y Growth Rate Comparison by Industry Vertical (2018-2033)
- Figure 18: Global Cross Docking Services Market Share Comparison by Region (2018-2033)
- Figure 19: Global Cross Docking Services Market Share Comparison by Service Type (2018-2033)
- Figure 20: Global Cross Docking Services Market Share Comparison by Technology Integration (2018-2033)
- Figure 21: Global Cross Docking Services Market Share Comparison by Industry Vertical (2018-2033)
- Figure 22: North America Cross Docking Services Market Revenue (US$ Mn) Market Share by Service Typein 2022
- Figure 23: North America Cross Docking Services Market Attractiveness Analysis by Service Type, 2018-2033
- Figure 24: North America Cross Docking Services Market Revenue (US$ Mn) Market Share by Technology Integrationin 2022
- Figure 25: North America Cross Docking Services Market Attractiveness Analysis by Technology Integration, 2018-2033
- Figure 26: North America Cross Docking Services Market Revenue (US$ Mn) Market Share by Industry Verticalin 2022
- Figure 27: North America Cross Docking Services Market Attractiveness Analysis by Industry Vertical, 2018-2033
- Figure 28: North America Cross Docking Services Market Revenue (US$ Mn) Market Share by Country in 2022
- Figure 29: North America Cross Docking Services Market Attractiveness Analysis by Country, 2018-2033
- Figure 30: North America Cross Docking Services Market Revenue (US$ Mn) (2018-2033)
- Figure 31: North America Cross Docking Services Market Revenue (US$ Mn) Comparison by Country (2018-2033)
- Figure 32: North America Cross Docking Services Market Revenue (US$ Mn) Comparison by Service Type (2018-2033)
- Figure 33: North America Cross Docking Services Market Revenue (US$ Mn) Comparison by Technology Integration (2018-2033)
- Figure 34: North America Cross Docking Services Market Revenue (US$ Mn) Comparison by Industry Vertical (2018-2033)
- Figure 35: North America Cross Docking Services Market Y-o-Y Growth Rate Comparison by Country (2018-2033)
- Figure 36: North America Cross Docking Services Market Y-o-Y Growth Rate Comparison by Service Type (2018-2033)
- Figure 37: North America Cross Docking Services Market Y-o-Y Growth Rate Comparison by Technology Integration (2018-2033)
- Figure 38: North America Cross Docking Services Market Y-o-Y Growth Rate Comparison by Industry Vertical (2018-2033)
- Figure 39: North America Cross Docking Services Market Share Comparison by Country (2018-2033)
- Figure 40: North America Cross Docking Services Market Share Comparison by Service Type (2018-2033)
- Figure 41: North America Cross Docking Services Market Share Comparison by Technology Integration (2018-2033)
- Figure 42: North America Cross Docking Services Market Share Comparison by Industry Vertical (2018-2033)
- Figure 43: Western Europe Cross Docking Services Market Revenue (US$ Mn) Market Share by Service Typein 2022
- Figure 44: Western Europe Cross Docking Services Market Attractiveness Analysis by Service Type, 2018-2033
- Figure 45: Western Europe Cross Docking Services Market Revenue (US$ Mn) Market Share by Technology Integrationin 2022
- Figure 46: Western Europe Cross Docking Services Market Attractiveness Analysis by Technology Integration, 2018-2033
- Figure 47: Western Europe Cross Docking Services Market Revenue (US$ Mn) Market Share by Industry Verticalin 2022
- Figure 48: Western Europe Cross Docking Services Market Attractiveness Analysis by Industry Vertical, 2018-2033
- Figure 49: Western Europe Cross Docking Services Market Revenue (US$ Mn) Market Share by Country in 2022
- Figure 50: Western Europe Cross Docking Services Market Attractiveness Analysis by Country, 2018-2033
- Figure 51: Western Europe Cross Docking Services Market Revenue (US$ Mn) (2018-2033)
- Figure 52: Western Europe Cross Docking Services Market Revenue (US$ Mn) Comparison by Country (2018-2033)
- Figure 53: Western Europe Cross Docking Services Market Revenue (US$ Mn) Comparison by Service Type (2018-2033)
- Figure 54: Western Europe Cross Docking Services Market Revenue (US$ Mn) Comparison by Technology Integration (2018-2033)
- Figure 55: Western Europe Cross Docking Services Market Revenue (US$ Mn) Comparison by Industry Vertical (2018-2033)
- Figure 56: Western Europe Cross Docking Services Market Y-o-Y Growth Rate Comparison by Country (2018-2033)
- Figure 57: Western Europe Cross Docking Services Market Y-o-Y Growth Rate Comparison by Service Type (2018-2033)
- Figure 58: Western Europe Cross Docking Services Market Y-o-Y Growth Rate Comparison by Technology Integration (2018-2033)
- Figure 59: Western Europe Cross Docking Services Market Y-o-Y Growth Rate Comparison by Industry Vertical (2018-2033)
- Figure 60: Western Europe Cross Docking Services Market Share Comparison by Country (2018-2033)
- Figure 61: Western Europe Cross Docking Services Market Share Comparison by Service Type (2018-2033)
- Figure 62: Western Europe Cross Docking Services Market Share Comparison by Technology Integration (2018-2033)
- Figure 63: Western Europe Cross Docking Services Market Share Comparison by Industry Vertical (2018-2033)
- Figure 64: Eastern Europe Cross Docking Services Market Revenue (US$ Mn) Market Share by Service Typein 2022
- Figure 65: Eastern Europe Cross Docking Services Market Attractiveness Analysis by Service Type, 2018-2033
- Figure 66: Eastern Europe Cross Docking Services Market Revenue (US$ Mn) Market Share by Technology Integrationin 2022
- Figure 67: Eastern Europe Cross Docking Services Market Attractiveness Analysis by Technology Integration, 2018-2033
- Figure 68: Eastern Europe Cross Docking Services Market Revenue (US$ Mn) Market Share by Industry Verticalin 2022
- Figure 69: Eastern Europe Cross Docking Services Market Attractiveness Analysis by Industry Vertical, 2018-2033
- Figure 70: Eastern Europe Cross Docking Services Market Revenue (US$ Mn) Market Share by Country in 2022
- Figure 71: Eastern Europe Cross Docking Services Market Attractiveness Analysis by Country, 2018-2033
- Figure 72: Eastern Europe Cross Docking Services Market Revenue (US$ Mn) (2018-2033)
- Figure 73: Eastern Europe Cross Docking Services Market Revenue (US$ Mn) Comparison by Country (2018-2033)
- Figure 74: Eastern Europe Cross Docking Services Market Revenue (US$ Mn) Comparison by Service Type (2018-2033)
- Figure 75: Eastern Europe Cross Docking Services Market Revenue (US$ Mn) Comparison by Technology Integration (2018-2033)
- Figure 76: Eastern Europe Cross Docking Services Market Revenue (US$ Mn) Comparison by Industry Vertical (2018-2033)
- Figure 77: Eastern Europe Cross Docking Services Market Y-o-Y Growth Rate Comparison by Country (2018-2033)
- Figure 78: Eastern Europe Cross Docking Services Market Y-o-Y Growth Rate Comparison by Service Type (2018-2033)
- Figure 79: Eastern Europe Cross Docking Services Market Y-o-Y Growth Rate Comparison by Technology Integration (2018-2033)
- Figure 80: Eastern Europe Cross Docking Services Market Y-o-Y Growth Rate Comparison by Industry Vertical (2018-2033)
- Figure 81: Eastern Europe Cross Docking Services Market Share Comparison by Country (2018-2033)
- Figure 82: Eastern Europe Cross Docking Services Market Share Comparison by Service Type (2018-2033)
- Figure 83: Eastern Europe Cross Docking Services Market Share Comparison by Technology Integration (2018-2033)
- Figure 84: Eastern Europe Cross Docking Services Market Share Comparison by Industry Vertical (2018-2033)
- Figure 85: APAC Cross Docking Services Market Revenue (US$ Mn) Market Share by Service Typein 2022
- Figure 86: APAC Cross Docking Services Market Attractiveness Analysis by Service Type, 2018-2033
- Figure 87: APAC Cross Docking Services Market Revenue (US$ Mn) Market Share by Technology Integrationin 2022
- Figure 88: APAC Cross Docking Services Market Attractiveness Analysis by Technology Integration, 2018-2033
- Figure 89: APAC Cross Docking Services Market Revenue (US$ Mn) Market Share by Industry Verticalin 2022
- Figure 90: APAC Cross Docking Services Market Attractiveness Analysis by Industry Vertical, 2018-2033
- Figure 91: APAC Cross Docking Services Market Revenue (US$ Mn) Market Share by Country in 2022
- Figure 92: APAC Cross Docking Services Market Attractiveness Analysis by Country, 2018-2033
- Figure 93: APAC Cross Docking Services Market Revenue (US$ Mn) (2018-2033)
- Figure 94: APAC Cross Docking Services Market Revenue (US$ Mn) Comparison by Country (2018-2033)
- Figure 95: APAC Cross Docking Services Market Revenue (US$ Mn) Comparison by Service Type (2018-2033)
- Figure 96: APAC Cross Docking Services Market Revenue (US$ Mn) Comparison by Technology Integration (2018-2033)
- Figure 97: APAC Cross Docking Services Market Revenue (US$ Mn) Comparison by Industry Vertical (2018-2033)
- Figure 98: APAC Cross Docking Services Market Y-o-Y Growth Rate Comparison by Country (2018-2033)
- Figure 99: APAC Cross Docking Services Market Y-o-Y Growth Rate Comparison by Service Type (2018-2033)
- Figure 100: APAC Cross Docking Services Market Y-o-Y Growth Rate Comparison by Technology Integration (2018-2033)
- Figure 101: APAC Cross Docking Services Market Y-o-Y Growth Rate Comparison by Industry Vertical (2018-2033)
- Figure 102: APAC Cross Docking Services Market Share Comparison by Country (2018-2033)
- Figure 103: APAC Cross Docking Services Market Share Comparison by Service Type (2018-2033)
- Figure 104: APAC Cross Docking Services Market Share Comparison by Technology Integration (2018-2033)
- Figure 105: APAC Cross Docking Services Market Share Comparison by Industry Vertical (2018-2033)
- Figure 106: Latin America Cross Docking Services Market Revenue (US$ Mn) Market Share by Service Typein 2022
- Figure 107: Latin America Cross Docking Services Market Attractiveness Analysis by Service Type, 2018-2033
- Figure 108: Latin America Cross Docking Services Market Revenue (US$ Mn) Market Share by Technology Integrationin 2022
- Figure 109: Latin America Cross Docking Services Market Attractiveness Analysis by Technology Integration, 2018-2033
- Figure 110: Latin America Cross Docking Services Market Revenue (US$ Mn) Market Share by Industry Verticalin 2022
- Figure 111: Latin America Cross Docking Services Market Attractiveness Analysis by Industry Vertical, 2018-2033
- Figure 112: Latin America Cross Docking Services Market Revenue (US$ Mn) Market Share by Country in 2022
- Figure 113: Latin America Cross Docking Services Market Attractiveness Analysis by Country, 2018-2033
- Figure 114: Latin America Cross Docking Services Market Revenue (US$ Mn) (2018-2033)
- Figure 115: Latin America Cross Docking Services Market Revenue (US$ Mn) Comparison by Country (2018-2033)
- Figure 116: Latin America Cross Docking Services Market Revenue (US$ Mn) Comparison by Service Type (2018-2033)
- Figure 117: Latin America Cross Docking Services Market Revenue (US$ Mn) Comparison by Technology Integration (2018-2033)
- Figure 118: Latin America Cross Docking Services Market Revenue (US$ Mn) Comparison by Industry Vertical (2018-2033)
- Figure 119: Latin America Cross Docking Services Market Y-o-Y Growth Rate Comparison by Country (2018-2033)
- Figure 120: Latin America Cross Docking Services Market Y-o-Y Growth Rate Comparison by Service Type (2018-2033)
- Figure 121: Latin America Cross Docking Services Market Y-o-Y Growth Rate Comparison by Technology Integration (2018-2033)
- Figure 122: Latin America Cross Docking Services Market Y-o-Y Growth Rate Comparison by Industry Vertical (2018-2033)
- Figure 123: Latin America Cross Docking Services Market Share Comparison by Country (2018-2033)
- Figure 124: Latin America Cross Docking Services Market Share Comparison by Service Type (2018-2033)
- Figure 125: Latin America Cross Docking Services Market Share Comparison by Technology Integration (2018-2033)
- Figure 126: Latin America Cross Docking Services Market Share Comparison by Industry Vertical (2018-2033)
- Figure 127: Middle East & Africa Cross Docking Services Market Revenue (US$ Mn) Market Share by Service Typein 2022
- Figure 128: Middle East & Africa Cross Docking Services Market Attractiveness Analysis by Service Type, 2018-2033
- Figure 129: Middle East & Africa Cross Docking Services Market Revenue (US$ Mn) Market Share by Technology Integrationin 2022
- Figure 130: Middle East & Africa Cross Docking Services Market Attractiveness Analysis by Technology Integration, 2018-2033
- Figure 131: Middle East & Africa Cross Docking Services Market Revenue (US$ Mn) Market Share by Industry Verticalin 2022
- Figure 132: Middle East & Africa Cross Docking Services Market Attractiveness Analysis by Industry Vertical, 2018-2033
- Figure 133: Middle East & Africa Cross Docking Services Market Revenue (US$ Mn) Market Share by Country in 2022
- Figure 134: Middle East & Africa Cross Docking Services Market Attractiveness Analysis by Country, 2018-2033
- Figure 135: Middle East & Africa Cross Docking Services Market Revenue (US$ Mn) (2018-2033)
- Figure 136: Middle East & Africa Cross Docking Services Market Revenue (US$ Mn) Comparison by Country (2018-2033)
- Figure 137: Middle East & Africa Cross Docking Services Market Revenue (US$ Mn) Comparison by Service Type (2018-2033)
- Figure 138: Middle East & Africa Cross Docking Services Market Revenue (US$ Mn) Comparison by Technology Integration (2018-2033)
- Figure 139: Middle East & Africa Cross Docking Services Market Revenue (US$ Mn) Comparison by Industry Vertical (2018-2033)
- Figure 140: Middle East & Africa Cross Docking Services Market Y-o-Y Growth Rate Comparison by Country (2018-2033)
- Figure 141: Middle East & Africa Cross Docking Services Market Y-o-Y Growth Rate Comparison by Service Type (2018-2033)
- Figure 142: Middle East & Africa Cross Docking Services Market Y-o-Y Growth Rate Comparison by Technology Integration (2018-2033)
- Figure 143: Middle East & Africa Cross Docking Services Market Y-o-Y Growth Rate Comparison by Industry Vertical (2018-2033)
- Figure 144: Middle East & Africa Cross Docking Services Market Share Comparison by Country (2018-2033)
- Figure 145: Middle East & Africa Cross Docking Services Market Share Comparison by Service Type (2018-2033)
- Figure 146: Middle East & Africa Cross Docking Services Market Share Comparison by Technology Integration (2018-2033)
- Figure 147: Middle East & Africa Cross Docking Services Market Share Comparison by Industry Vertical (2018-2033)
- List of Tables
- Table 1: Global Cross Docking Services Market Comparison by Service Type (2018-2033)
- Table 2: Global Cross Docking Services Market Comparison by Technology Integration (2018-2033)
- Table 3: Global Cross Docking Services Market Comparison by Industry Vertical (2018-2033)
- Table 4: Global Cross Docking Services Market Revenue (US$ Mn) Comparison by Region (2018-2033)
- Table 5: Global Cross Docking Services Market Revenue (US$ Mn) (2018-2033)
- Table 6: Global Cross Docking Services Market Revenue (US$ Mn) Comparison by Region (2018-2033)
- Table 7: Global Cross Docking Services Market Revenue (US$ Mn) Comparison by Service Type (2018-2033)
- Table 8: Global Cross Docking Services Market Revenue (US$ Mn) Comparison by Technology Integration (2018-2033)
- Table 9: Global Cross Docking Services Market Revenue (US$ Mn) Comparison by Industry Vertical (2018-2033)
- Table 10: Global Cross Docking Services Market Y-o-Y Growth Rate Comparison by Region (2018-2033)
- Table 11: Global Cross Docking Services Market Y-o-Y Growth Rate Comparison by Service Type (2018-2033)
- Table 12: Global Cross Docking Services Market Y-o-Y Growth Rate Comparison by Technology Integration (2018-2033)
- Table 13: Global Cross Docking Services Market Y-o-Y Growth Rate Comparison by Industry Vertical (2018-2033)
- Table 14: Global Cross Docking Services Market Share Comparison by Region (2018-2033)
- Table 15: Global Cross Docking Services Market Share Comparison by Service Type (2018-2033)
- Table 16: Global Cross Docking Services Market Share Comparison by Technology Integration (2018-2033)
- Table 17: Global Cross Docking Services Market Share Comparison by Industry Vertical (2018-2033)
- Table 18: North America Cross Docking Services Market Comparison by Technology Integration (2018-2033)
- Table 19: North America Cross Docking Services Market Comparison by Industry Vertical (2018-2033)
- Table 20: North America Cross Docking Services Market Revenue (US$ Mn) Comparison by Country (2018-2033)
- Table 21: North America Cross Docking Services Market Revenue (US$ Mn) (2018-2033)
- Table 22: North America Cross Docking Services Market Revenue (US$ Mn) Comparison by Country (2018-2033)
- Table 23: North America Cross Docking Services Market Revenue (US$ Mn) Comparison by Service Type (2018-2033)
- Table 24: North America Cross Docking Services Market Revenue (US$ Mn) Comparison by Technology Integration (2018-2033)
- Table 25: North America Cross Docking Services Market Revenue (US$ Mn) Comparison by Industry Vertical (2018-2033)
- Table 26: North America Cross Docking Services Market Y-o-Y Growth Rate Comparison by Country (2018-2033)
- Table 27: North America Cross Docking Services Market Y-o-Y Growth Rate Comparison by Service Type (2018-2033)
- Table 28: North America Cross Docking Services Market Y-o-Y Growth Rate Comparison by Technology Integration (2018-2033)
- Table 29: North America Cross Docking Services Market Y-o-Y Growth Rate Comparison by Industry Vertical (2018-2033)
- Table 30: North America Cross Docking Services Market Share Comparison by Country (2018-2033)
- Table 31: North America Cross Docking Services Market Share Comparison by Service Type (2018-2033)
- Table 32: North America Cross Docking Services Market Share Comparison by Technology Integration (2018-2033)
- Table 33: North America Cross Docking Services Market Share Comparison by Industry Vertical (2018-2033)
- Table 34: Western Europe Cross Docking Services Market Comparison by Service Type (2018-2033)
- Table 35: Western Europe Cross Docking Services Market Comparison by Technology Integration (2018-2033)
- Table 36: Western Europe Cross Docking Services Market Comparison by Industry Vertical (2018-2033)
- Table 37: Western Europe Cross Docking Services Market Revenue (US$ Mn) Comparison by Country (2018-2033)
- Table 38: Western Europe Cross Docking Services Market Revenue (US$ Mn) (2018-2033)
- Table 39: Western Europe Cross Docking Services Market Revenue (US$ Mn) Comparison by Country (2018-2033)
- Table 40: Western Europe Cross Docking Services Market Revenue (US$ Mn) Comparison by Service Type (2018-2033)
- Table 41: Western Europe Cross Docking Services Market Revenue (US$ Mn) Comparison by Technology Integration (2018-2033)
- Table 42: Western Europe Cross Docking Services Market Revenue (US$ Mn) Comparison by Industry Vertical (2018-2033)
- Table 43: Western Europe Cross Docking Services Market Y-o-Y Growth Rate Comparison by Country (2018-2033)
- Table 44: Western Europe Cross Docking Services Market Y-o-Y Growth Rate Comparison by Service Type (2018-2033)
- Table 45: Western Europe Cross Docking Services Market Y-o-Y Growth Rate Comparison by Technology Integration (2018-2033)
- Table 46: Western Europe Cross Docking Services Market Y-o-Y Growth Rate Comparison by Industry Vertical (2018-2033)
- Table 47: Western Europe Cross Docking Services Market Share Comparison by Country (2018-2033)
- Table 48: Western Europe Cross Docking Services Market Share Comparison by Service Type (2018-2033)
- Table 49: Western Europe Cross Docking Services Market Share Comparison by Technology Integration (2018-2033)
- Table 50: Western Europe Cross Docking Services Market Share Comparison by Industry Vertical (2018-2033)
- Table 51: Eastern Europe Cross Docking Services Market Comparison by Service Type (2018-2033)
- Table 52: Eastern Europe Cross Docking Services Market Comparison by Technology Integration (2018-2033)
- Table 53: Eastern Europe Cross Docking Services Market Comparison by Industry Vertical (2018-2033)
- Table 54: Eastern Europe Cross Docking Services Market Revenue (US$ Mn) Comparison by Country (2018-2033)
- Table 55: Eastern Europe Cross Docking Services Market Revenue (US$ Mn) (2018-2033)
- Table 56: Eastern Europe Cross Docking Services Market Revenue (US$ Mn) Comparison by Country (2018-2033)
- Table 57: Eastern Europe Cross Docking Services Market Revenue (US$ Mn) Comparison by Service Type (2018-2033)
- Table 58: Eastern Europe Cross Docking Services Market Revenue (US$ Mn) Comparison by Technology Integration (2018-2033)
- Table 59: Eastern Europe Cross Docking Services Market Revenue (US$ Mn) Comparison by Industry Vertical (2018-2033)
- Table 60: Eastern Europe Cross Docking Services Market Y-o-Y Growth Rate Comparison by Country (2018-2033)
- Table 61: Eastern Europe Cross Docking Services Market Y-o-Y Growth Rate Comparison by Service Type (2018-2033)
- Table 62: Eastern Europe Cross Docking Services Market Y-o-Y Growth Rate Comparison by Technology Integration (2018-2033)
- Table 63: Eastern Europe Cross Docking Services Market Y-o-Y Growth Rate Comparison by Industry Vertical (2018-2033)
- Table 64: Eastern Europe Cross Docking Services Market Share Comparison by Country (2018-2033)
- Table 65: Eastern Europe Cross Docking Services Market Share Comparison by Service Type (2018-2033)
- Table 66: Eastern Europe Cross Docking Services Market Share Comparison by Technology Integration (2018-2033)
- Table 67: Eastern Europe Cross Docking Services Market Share Comparison by Industry Vertical (2018-2033)
- Table 68: APAC Cross Docking Services Market Comparison by Service Type (2018-2033)
- Table 69: APAC Cross Docking Services Market Comparison by Technology Integration (2018-2033)
- Table 70: APAC Cross Docking Services Market Comparison by Industry Vertical (2018-2033)
- Table 71: APAC Cross Docking Services Market Revenue (US$ Mn) Comparison by Country (2018-2033)
- Table 72: APAC Cross Docking Services Market Revenue (US$ Mn) (2018-2033)
- Table 73: APAC Cross Docking Services Market Revenue (US$ Mn) Comparison by Country (2018-2033)
- Table 74: APAC Cross Docking Services Market Revenue (US$ Mn) Comparison by Service Type (2018-2033)
- Table 75: APAC Cross Docking Services Market Revenue (US$ Mn) Comparison by Technology Integration (2018-2033)
- Table 76: APAC Cross Docking Services Market Revenue (US$ Mn) Comparison by Industry Vertical (2018-2033)
- Table 77: APAC Cross Docking Services Market Y-o-Y Growth Rate Comparison by Country (2018-2033)
- Table 78: APAC Cross Docking Services Market Y-o-Y Growth Rate Comparison by Service Type (2018-2033)
- Table 79: APAC Cross Docking Services Market Y-o-Y Growth Rate Comparison by Technology Integration (2018-2033)
- Table 80: APAC Cross Docking Services Market Y-o-Y Growth Rate Comparison by Industry Vertical (2018-2033)
- Table 81: APAC Cross Docking Services Market Share Comparison by Country (2018-2033)
- Table 82: APAC Cross Docking Services Market Share Comparison by Service Type (2018-2033)
- Table 83: APAC Cross Docking Services Market Share Comparison by Technology Integration (2018-2033)
- Table 84: APAC Cross Docking Services Market Share Comparison by Industry Vertical (2018-2033)
- Table 85: Latin America Cross Docking Services Market Comparison by Service Type (2018-2033)
- Table 86: Latin America Cross Docking Services Market Comparison by Technology Integration (2018-2033)
- Table 87: Latin America Cross Docking Services Market Comparison by Industry Vertical (2018-2033)
- Table 88: Latin America Cross Docking Services Market Revenue (US$ Mn) Comparison by Country (2018-2033)
- Table 89: Latin America Cross Docking Services Market Revenue (US$ Mn) (2018-2033)
- Table 90: Latin America Cross Docking Services Market Revenue (US$ Mn) Comparison by Country (2018-2033)
- Table 91: Latin America Cross Docking Services Market Revenue (US$ Mn) Comparison by Service Type (2018-2033)
- Table 92: Latin America Cross Docking Services Market Revenue (US$ Mn) Comparison by Technology Integration (2018-2033)
- Table 93: Latin America Cross Docking Services Market Revenue (US$ Mn) Comparison by Industry Vertical (2018-2033)
- Table 94: Latin America Cross Docking Services Market Y-o-Y Growth Rate Comparison by Country (2018-2033)
- Table 95: Latin America Cross Docking Services Market Y-o-Y Growth Rate Comparison by Service Type (2018-2033)
- Table 96: Latin America Cross Docking Services Market Y-o-Y Growth Rate Comparison by Technology Integration (2018-2033)
- Table 97: Latin America Cross Docking Services Market Y-o-Y Growth Rate Comparison by Industry Vertical (2018-2033)
- Table 98: Latin America Cross Docking Services Market Share Comparison by Country (2018-2033)
- Table 99: Latin America Cross Docking Services Market Share Comparison by Service Type (2018-2033)
- Table 100: Latin America Cross Docking Services Market Share Comparison by Technology Integration (2018-2033)
- Table 101: Latin America Cross Docking Services Market Share Comparison by Industry Vertical (2018-2033)
- Table 102: Middle East & Africa Cross Docking Services Market Comparison by Service Type (2018-2033)
- Table 103: Middle East & Africa Cross Docking Services Market Comparison by Technology Integration (2018-2033)
- Table 104: Middle East & Africa Cross Docking Services Market Comparison by Industry Vertical (2018-2033)
- Table 105: Middle East & Africa Cross Docking Services Market Revenue (US$ Mn) Comparison by Country (2018-2033)
- Table 106: Middle East & Africa Cross Docking Services Market Revenue (US$ Mn) (2018-2033)
- Table 107: Middle East & Africa Cross Docking Services Market Revenue (US$ Mn) Comparison by Country (2018-2033)
- Table 108: Middle East & Africa Cross Docking Services Market Revenue (US$ Mn) Comparison by Service Type (2018-2033)
- Table 109: Middle East & Africa Cross Docking Services Market Revenue (US$ Mn) Comparison by Technology Integration (2018-2033)
- Table 110: Middle East & Africa Cross Docking Services Market Revenue (US$ Mn) Comparison by Industry Vertical (2018-2033)
- Table 111: Middle East & Africa Cross Docking Services Market Y-o-Y Growth Rate Comparison by Country (2018-2033)
- Table 112: Middle East & Africa Cross Docking Services Market Y-o-Y Growth Rate Comparison by Service Type (2018-2033)
- Table 113: Middle East & Africa Cross Docking Services Market Y-o-Y Growth Rate Comparison by Technology Integration (2018-2033)
- Table 114: Middle East & Africa Cross Docking Services Market Y-o-Y Growth Rate Comparison by Industry Vertical (2018-2033)
- Table 115: Middle East & Africa Cross Docking Services Market Share Comparison by Country (2018-2033)
- Table 116: Middle East & Africa Cross Docking Services Market Share Comparison by Service Type (2018-2033)
- Table 117: Middle East & Africa Cross Docking Services Market Share Comparison by Technology Integration (2018-2033)
- Table 118: Middle East & Africa Cross Docking Services Market Share Comparison by Industry Vertical (2018-2033)
- 1. Executive Summary
-
- FedEx Corporation
- United Parcel Service (UPS)
- XPO Logistics, Inc.
- Kenco Group
- Deutsche Bahn Group
- DHL International GmbH
- C.H. Robinson Worldwide, Inc.
- Schneider National, Inc.
- J.B. Hunt Transport Services, Inc.
- Ryder System, Inc.
- Penske Logistics
- Maersk Line
- Expeditors International of Washington, Inc.
- CEVA Logistics
- Kuehne + Nagel International AG
- Saddle Creek Logistics Services
- Yusen Logistics Co., Ltd.
- Toll Holdings Limited
- Werner Enterprises, Inc.
Our Clients


View Our Licence Options
