Compression Therapy Market By Product Type (Compression Garments, Compression Braces, Compression Pumps, Compression Bandages), By Distribution Channel (Hospital Pharmacies, Retail Pharmacies, Others), By Technology (Static Compression Therapy, Dynamic Compression Therapy), By Application (Venous Leg Ulcer, Lymphedema, Others), By End User, By Region And Companies - Industry Segment Outlook, Market Assessment, Competition Scenario, Trends, And Forecast 2032
-
3338
-
May 2023
-
165
-


-
This report was compiled by Correspondence Linkedin | Detailed Market research Methodology Our methodology involves a mix of primary research, including interviews with leading mental health experts, and secondary research from reputable medical journals and databases. View Detailed Methodology Page
-
Quick Navigation
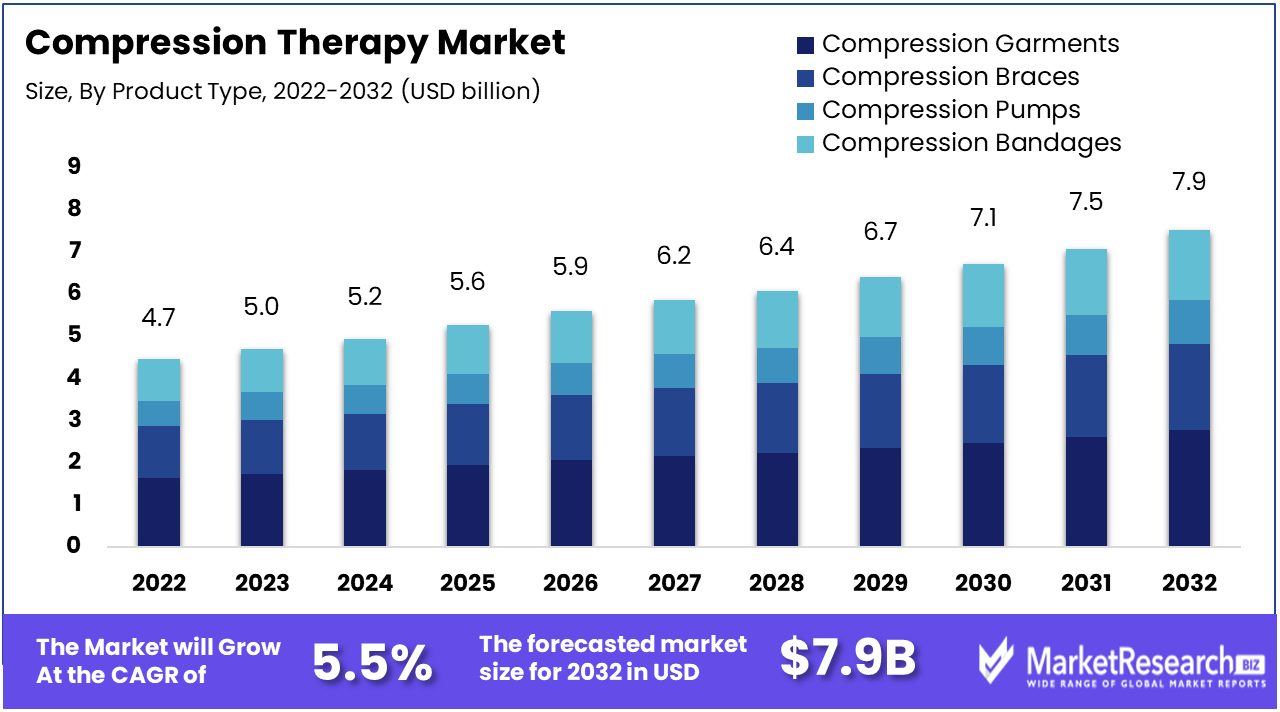
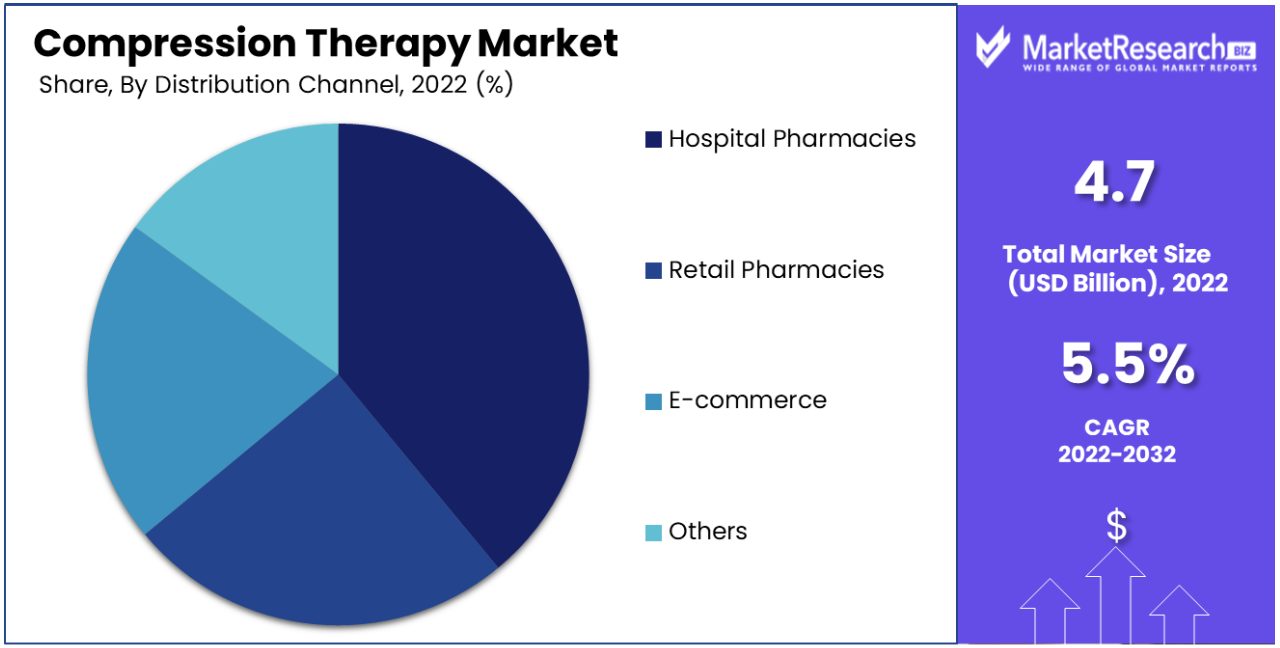
Compression Therapy Market size is expected to be worth around USD 7.9 Bn by 2032 from USD 4.7 Bn in 2022, growing at a CAGR of 5.5% during the forecast period from 2023 to 2032.
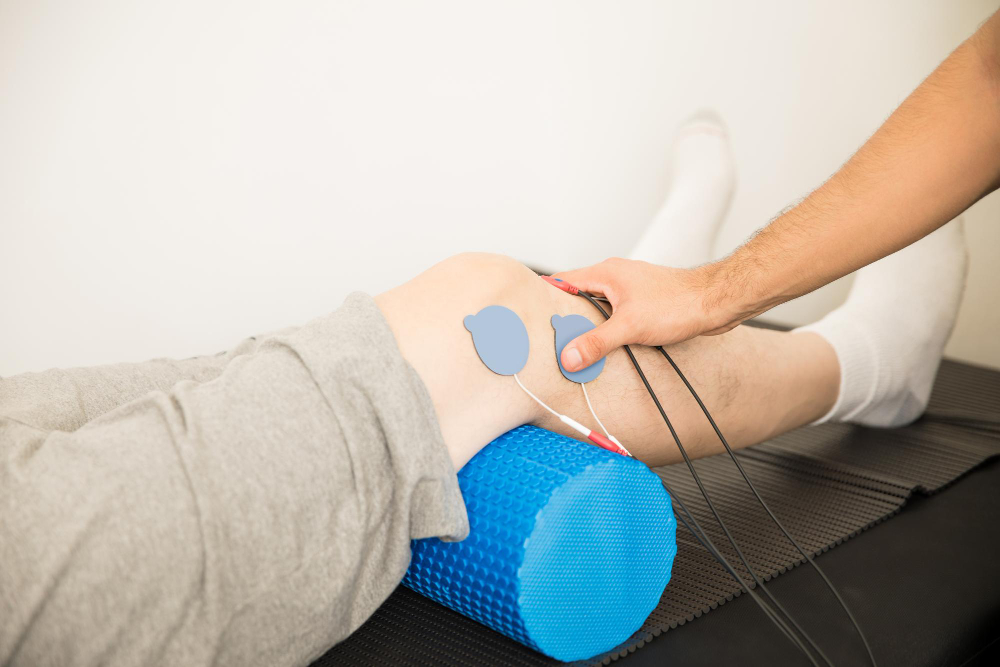
The increase in sports related injuries, chronic venous insufficiency (CVI) among individuals and the sudden change in the treatment facilities from clinic and hospitals to home based treatment. Compression therapy devices are basically used to enhance the process of healing and speed recovery of the patients. Products such as stocking, gloves, sleeves and bandages are used frequently to treat the aforementioned medical disorders, thus helping in expanding the market growth.
Some of the advantages associated with the application of compression therapy products in the treatment of specific disorders like venous reflux, decrease of leg and foot volume and hypertension that impels the market growth. Furthermore, the availability of several substitutes starting from bandages and stockings to pneumatic devices to get an effective treatment for several conditions.
Additionally, the rise in compression garments in sports related medicines is expected to offer an exceptional market expansion. Compression therapy is being widely used to prevent swelling like injury and inflammation. Such products are highly used to enhance the blood circulation and avoid coagulation of liquids in the tissue space, thus improving muscle health.
A 2022 study published in the Journal of Vascular Surgery found that compression therapy was effective in reducing symptoms of CVI, such as swelling and pain. Another study, published in the Journal of the American College of Surgeons, found that compression therapy was effective in preventing DVT after surgery.
Moreover, Static therapy devices are gaining popularity due to its cost-effectiveness, wide availability and ease to use which impels the market growth. Likewise, patients can use these devices while working, which is projected to surge in demand for sports persons like the athletes and fitness instructors.
For example, in hospitals and clinics, patients are under the recovery process from a head injury or leg fracture. Doctors or physicians use the static therapy device to provide quick recovery, stability and immobilization to the affected areas in order for proper healing. When the static therapy device gets combined with the compression therapy it provides more additional benefits such as enhancement in blood circulation, reduces swelling and improves the overall therapeutic results.
Likewise, dynamic technology will also witness a significant growth during the forecasted period as a result of many advantages associated leading to the exceptional market growth in future.
Driving Factors
Higher Adoption of Compression Therapy Products Drives Market Growth
The higher adoption of compression therapy products is a fundamental driver for the expansion of the compression therapy market. This trend is rooted in the growing recognition of the effectiveness of compression therapy in managing various medical conditions, such as venous ulcers, lymphedema, and deep vein thrombosis. As healthcare professionals and patients increasingly acknowledge the benefits of compression therapy for both treatment and preventive care, the demand for these products has risen substantially. In this domain, treating vascular ulcers stands out as a key focus, bringing advanced solutions to boost healing and overall market progress.
This increasing adoption is facilitated by the availability of a wide range of compression therapy products, including stockings, bandages, and pumps, which cater to diverse patient needs and preferences. The trend towards home healthcare and self-management of chronic conditions has also contributed to the growing use of compression therapy products.
The long-term implication of this trend suggests sustained market growth, driven by the ongoing acceptance and integration of compression therapy in standard treatment protocols. There is also potential for continued product innovation, focusing on comfort, ease of use, and efficacy, to further enhance user adoption.
Increasing Hospitalizations Necessitate Compression Therapy
The rise in the hospitalization rate, particularly for conditions requiring vascular and wound care management, significantly boosts the compression therapy market. As the number of patients hospitalized with venous disorders, diabetic ulcers, and post-surgical recovery increases, the demand for compression therapy products in clinical settings escalates. Hospitals and clinics are major end-users of compression therapy products, utilizing them for both inpatient treatment and post-discharge care.
The growing aging population and the prevalence of lifestyle-related health issues contribute to the rising hospitalization rates, thereby influencing the demand for compression therapy. In hospital settings, the need for effective, easy-to-use, and quick-to-apply compression solutions is crucial, driving innovation and adoption in the market.
This trend is likely to continue, with the aging population and increasing prevalence of chronic diseases necessitating sustained demand for compression therapy products in healthcare settings.
R&D Fuels Advanced Compression Therapy Market
High investment in research and development is catalyzing the growth of the compression therapy market. Manufacturers and healthcare companies are investing in R&D to develop more effective, user-friendly, and innovative compression therapy products. This includes the integration of advanced materials, smart technologies, and ergonomic designs to enhance the efficacy and comfort of compression products.
Such innovations are aimed at addressing the limitations of traditional compression therapy products, such as issues with patient compliance and difficulty in application. The development of smart compression devices, which can monitor pressure and adjust therapy accordingly, is an example of how R&D is transforming the market.
Rising Venous Conditions Propel Compression Therapy Need
The growing incidence of venous ulcers and other vein diseases across the world is expanding the compression therapy market. Venous disorders, including varicose veins and chronic venous insufficiency, are becoming increasingly common due to factors such as aging populations, sedentary lifestyles, and obesity. These conditions often require long-term management, for which compression therapy is a key component.
As the prevalence of these venous conditions rises, so does the demand for effective management solutions. Compression therapy is widely recognized as a primary treatment modality for these conditions, helping to alleviate symptoms, promote healing, and prevent recurrence.
Awareness of Advanced Compression Devices Drives Market Growth
The rise in awareness related to advanced device options in compression therapy is stimulating market growth. Patients and healthcare providers are becoming more informed about the various types of compression therapy products available, including advanced options like intermittent pneumatic compression devices and smart compression systems.
Educational initiatives by manufacturers, healthcare institutions, and patient advocacy groups have played a crucial role in this increased awareness. As patients and clinicians become more knowledgeable about the benefits and applications of different compression therapy products, the demand for advanced, specialized devices grows.
Restraining Factors
High Cost of Compression Therapy Products Restrains Market Growth
The high cost of compression therapy products, such as advanced compression bandages and pneumatic compression devices, limits their accessibility and adoption, particularly among patients with limited financial resources. These costs can be prohibitive, discouraging individuals from opting for compression therapy even when medically recommended.
The high price point often results from the cost of materials, design sophistication, and technology integration in these products, which can significantly impact the purchasing decisions of both healthcare providers and patients, thus restraining market growth.
Availability of Alternative Treatment Procedures Restrains Market Growth
The presence of alternative treatment procedures for conditions typically addressed by compression therapy, such as deep vein thrombosis and lymphedema, can limit the market growth.
Treatments like medication, surgical interventions, and other non-compression based therapies provide options for patients and healthcare providers. These alternatives might be preferred due to various factors including efficacy, patient comfort, or familiarity by healthcare providers, thereby impacting the demand for compression therapy products.
Compression Therapy Market Segment Analysis
By Product Type Analysis
Compression garments lead the product type segment in the compression therapy market. Their widespread use is attributed to their effectiveness in managing conditions like venous leg ulcers and lymphedema. Garments such as stockings and sleeves are preferred for their ease of use, comfort, and efficacy in improving blood circulation. The growth in this segment is bolstered by the rising prevalence of chronic venous disorders and an aging population.
Compression braces are essential for musculoskeletal injuries, providing support and stability. Compression pumps are increasingly used in managing severe lymphedema. Compression bandages are commonly used in wound care, particularly in treating venous ulcers, due to their flexibility and adaptability to different body parts.
By Distribution Channel Analysis
Hospital pharmacies dominate the distribution channel for compression therapy products. Their proximity to the point of care and the ability to offer patient-specific advice and fitting services contribute to their leading position.
Retail pharmacies are crucial for patient access post-discharge. E-commerce is growing rapidly, offering convenience and a broader product range. Other channels include specialty clinics and online medical stores.
By Technology Analysis
Static compression therapy is widely used due to its simplicity and effectiveness in treating conditions like venous insufficiency and lymphedema. Static compression garments and bandages are preferred for continuous pressure application, making them ideal for everyday use.
Dynamic compression therapy, though less common, is gaining traction for its ability to provide intermittent pressure, beneficial in certain medical conditions and for patients who cannot tolerate static compression.
By Application Analysis
Venous leg ulcers are a major application area for compression therapy. The effectiveness of compression garments and bandages in healing ulcers and preventing recurrence drives their use in this segment.
Compression therapy is also vital in managing deep vein thrombosis and lymphedema. Other applications include recovery from sports injuries and prevention of blood clots in immobile patients.
By End User Analysis
Hospitals and clinics are the primary end users of compression therapy products. They play a crucial role in the initial diagnosis, treatment planning, and follow-up care, making them central to the compression therapy market.
Nursing care centers use compression therapy for elderly and bedridden patients, while home care settings are increasingly adopting these therapies for long-term care. Other settings include rehabilitation centers and sports clinics.
Key Market Segments
By Product Type
- Compression Garments
- Compression Braces
- Compression Pumps
- Compression Bandages
By Distribution Channel
- Hospital Pharmacies
- Retail Pharmacies
- E-commerce
- Others
By Technology
- Static Compression Therapy
- Dynamic Compression Therapy
By Application
- Venous Leg Ulcer
- Deep Vein Thrombosis
- Lymphedema
- Others
By End User
- Hospitals & Clinics
- Nursing Care Centers
- Home Care
- Others
Growth Opportunities
Increasing Demand for Advanced Compression Therapy Products Expands Market Potential
The increasing demand for advanced compression therapy products is a driving force behind market expansion. Patients and healthcare professionals are seeking more technologically sophisticated compression solutions that offer precise pressure control, ease of use, and enhanced patient compliance. Manufacturers that respond to these demands by developing and offering innovative compression devices and garments stand to benefit from the growing market appetite for advanced products.
Increase in Sports Injuries and Trauma Boosting Growth in Compression Therapy Market
The rise in sports injuries and trauma cases presents a growth opportunity in the compression therapy market. Compression therapy is a valuable component of the treatment and recovery process for athletes and individuals recovering from injuries.
Compression garments help reduce swelling, improve blood circulation, and facilitate faster healing. As sports participation and physical activity levels increase, so does the demand for compression therapy products, contributing to market growth.
Regional Analysis
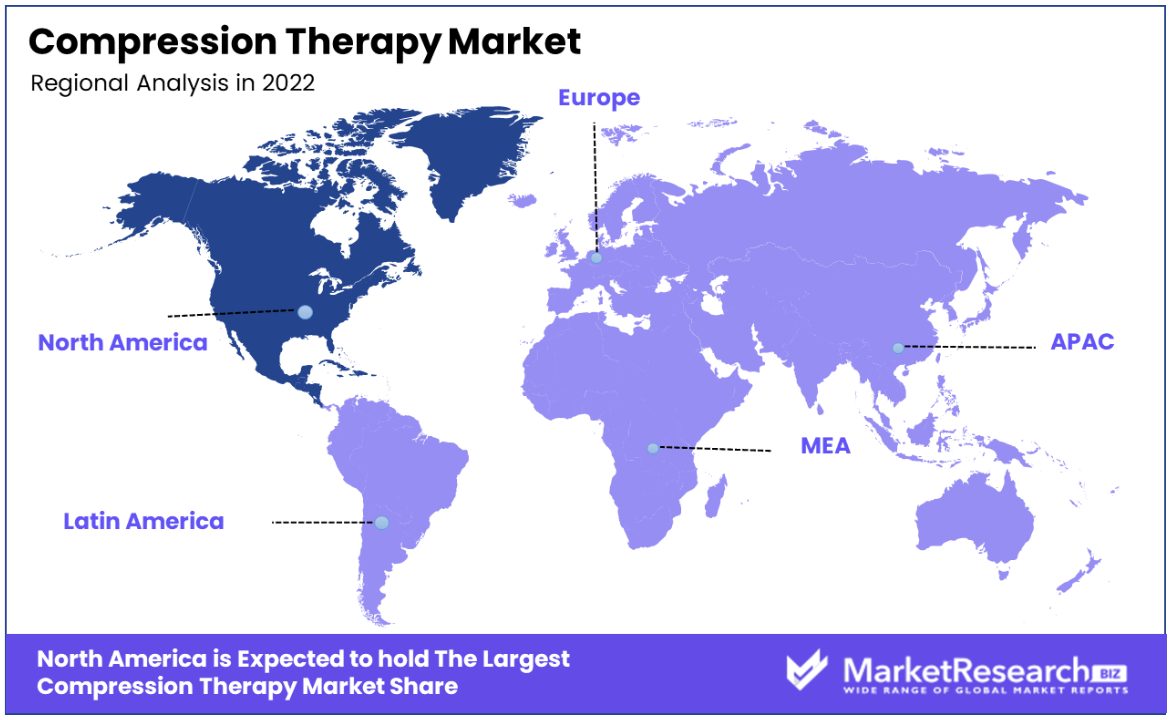
North America Dominates with 48.20% Market Share in the Compression Therapy Market
North America, holding a substantial 48.20% share of the compression therapy market, stands at the forefront of this sector. This dominance is primarily driven by the region's advanced healthcare infrastructure, high prevalence of venous disease conditions, and increasing incidences of sports injuries and obesity-related complications. The market benefits significantly from the strong presence of leading medical device manufacturers, dedicated to continuous innovation in compression therapy products.
The market dynamics are also influenced by the growing aging population, which is more susceptible to chronic venous disorders. Additionally, heightened awareness and acceptance of compression therapy as a preventive and therapeutic measure contribute to its widespread use in the region.
Forecast implications suggest a sustained, if not growing, influence of North America in the compression therapy market. Anticipated advancements in compression therapy technologies and a growing focus on health and wellness are likely to fuel market growth. Additionally, the increasing adoption of telehealth and home care services may amplify the demand for compression therapy products, ensuring ease of access and user convenience.
Europe Regional Analysis
Europe holds a significant position in the global compression therapy market, driven by a high prevalence of venous disorders and a well-established healthcare system. The region benefits from strong government support in healthcare and a high level of awareness about venous diseases among the population.
The European market is expected to grow steadily, supported by the increasing elderly population and ongoing research and development in compression therapy technologies. The adoption of modern compression therapy devices and a focus on quality care are likely to sustain Europe's strong market position.
Asia-Pacific Regional Analysis
The Asia-Pacific region is emerging as a significant market for compression therapy. Factors contributing to this growth include rising healthcare expenditures, growing awareness of venous diseases, and an increasing aging population. Developing economies like China and India are witnessing a surge in healthcare infrastructure development, which provides a conducive environment for the growth of the compression therapy market.
The future of the market in Asia-Pacific looks promising, with potential growth driven by the increasing prevalence of lifestyle diseases and the expansion of healthcare services across the region. The rising middle-class population and growing health consciousness are also expected to boost the demand for compression therapy products.
Key Regions and Countries
North America
- The US
- Canada
- Rest of North America
Europe
- Germany
- France
- The UK
- Spain
- Italy
- Russia
- Netherlands
- Rest of Europe
Asia-Pacific
- China
- Japan
- South Korea
- India
- New Zealand
- Singapore
- Thailand
- Vietnam
- Rest of Asia Pacific
Latin America
- Brazil
- Mexico
- Rest of Latin America
Middle East & Africa
- South Africa
- Saudi Arabia
- UAE
- Rest of Middle East & Africa
Key Player Overview Compression Therapy Market
In the compression therapy market, a diverse group of companies plays a crucial role in shaping industry trends, product innovation, and market reach. 3M Company and Medtronic plc are notable for their global presence and extensive product lines, providing a wide range of compression therapy solutions and influencing market standards worldwide.
Smith & Nephew plc and Cardinal Health are recognized for their strong focus on innovation and patient care, offering advanced compression therapy products that cater to various medical needs. Their strategic positioning is marked by a commitment to quality and efficacy.
Spectrum Healthcare and SIGVARIS have carved out niches in the market with their specialized focus on compression garments and devices, appealing to specific patient demographics and clinical requirements. Bio Compression Systems, Inc. and Julius Zorn GmbH emphasize customized solutions, enhancing their reputation for tailored patient care.
Hartmann AG, Medi GmbH & Co., and BSN Medical GmbH are influential in the European market, with a strong emphasis on quality and user comfort in their product offerings. ArjoHuntleigh and Stryker, known for their broader medical equipment portfolios, have integrated compression therapy into their range, broadening their market impact.
Collectively, these key players drive the compression therapy market through strategic expansion, technological innovation, and a focus on patient-centered solutions, catering to a wide range of medical needs and advancing the field of compression therapy globally.
Major Players in the Compression Therapy Market
- 3M Company
- Medtronic plc
- Smith & Nephew plc
- Spectrum Healthcare
- SIGVARIS
- Bio Compression Systems, Inc.
- Cardinal Health
- Julius Zorn GmbH
- Hartmann AG
- Medi GmbH & Co.
- BSN Medical GmbH
- ArjoHuntleigh
- Stryker
- Gottfried Medical
- Convatec Group PLC
- Juzo
- Paul Hartmann AG
- Tactile Medical
Recent Development
- In July 2022, Sigvaris Group introduced Adjustable Compression Therapy, allowing patients to self-adjust compression with a dial. This offers more customization.
- Tactile Medical acquired affiliate company Wearable Therapeutics in November 2022 to expand in next-gen compression therapy garments for lymphedema patients.
- Medi USA announced in January 2023 it will launch patent-pending Gradient Compression Therapy technology delivering graduated pressure.
- In March 2023, Julius Zorn GmbH plans to unveil compression therapy products with antimicrobial Aqua-Pore textile coating technology.
Report Scope:
Report Features Description Market Value (2022) USD 4.7 Bn Forecast Revenue (2032) USD 7.9 Bn CAGR (2023-2032) 5.5% Base Year for Estimation 2022 Historic Period 2016-2022 Forecast Period 2023-2032 Report Coverage Revenue Forecast, Market Dynamics, COVID-19 Impact, Competitive Landscape, Recent Developments Segments Covered By Product Type (Compression Garments, Compression Braces, Compression Pumps, Compression Bandages), By Distribution Channel (Hospital Pharmacies, Retail Pharmacies, E-commerce, Others), By Technology (Static Compression Therapy, Dynamic Compression Therapy), By Application (Venous Leg Ulcer, Deep Vein Thrombosis, Lymphedema, Others), By End User (Hospitals & Clinics, Nursing Care Centers, Home Care, Others) Regional Analysis North America - The US, Canada, Rest of North America, Europe - Germany, France, The UK, Spain, Italy, Russia, Netherlands, Rest of Europe, Asia-Pacific - China, Japan, South Korea, India, New Zealand, Singapore, Thailand, Vietnam, Rest of Asia Pacific, Latin America - Brazil, Mexico, Rest of Latin America, Middle East & Africa - South Africa, Saudi Arabia, UAE, Rest of Middle East & Africa Competitive Landscape 3M Company, Medtronic plc, Smith & Nephew plc, Spectrum Healthcare, SIGVARIS, Bio Compression Systems, Inc., Cardinal Health, Julius Zorn GmbH, Hartmann AG, Medi GmbH & Co., BSN Medical GmbH, ArjoHuntleigh, Stryker, Gottfried Medical, Convatec Group PLC, Juzo, Paul Hartmann AG, Tactile Medical Customization Scope Customization for segments, region/country-level will be provided. Moreover, additional customization can be done based on the requirements. Purchase Options We have three licenses to opt for: Single User License, Multi-User License (Up to 5 Users), Corporate Use License (Unlimited User and Printable PDF) -
- 1. Executive Summary
- 1.1. Definition
- 1.2. Taxonomy
- 1.3. Research Scope
- 1.4. Key Analysis
- 1.5. Key Findings by Major Segments
- 1.6. Top strategies by Major Players
- 2. Global Compression Therapy Market Overview
- 2.1. Compression Therapy Market Dynamics
- 2.1.1. Drivers
- 2.1.2. Opportunities
- 2.1.3. Restraints
- 2.1.4. Challenges
- 2.2. Macro-economic Factors
- 2.3. Regulatory Framework
- 2.4. Market Investment Feasibility Index
- 2.5. PEST Analysis
- 2.6. PORTER’S Five Force Analysis
- 2.7. Drivers & Restraints Impact Analysis
- 2.8. Industry Chain Analysis
- 2.9. Cost Structure Analysis
- 2.10. Marketing Strategy
- 2.11. Russia-Ukraine War Impact Analysis
- 2.12. Opportunity Map Analysis
- 2.13. Market Competition Scenario Analysis
- 2.14. Product Life Cycle Analysis
- 2.15. Opportunity Orbits
- 2.16. Manufacturer Intensity Map
- 2.17. Major Companies sales by Value & Volume
- 2.1. Compression Therapy Market Dynamics
- 3. Global Compression Therapy Market Analysis, Opportunity and Forecast, 2016-2032
- 3.1. Global Compression Therapy Market Analysis, 2016-2021
- 3.2. Global Compression Therapy Market Opportunity and Forecast, 2023-2032
- 3.3. Global Compression Therapy Market Analysis, Opportunity and Forecast, By Product Type, 2016-2032
- 3.3.1. Global Compression Therapy Market Analysis by Product Type: Introduction
- 3.3.2. Market Size Absolute $ Opportunity Analysis and Forecast, By Product Type, 2016-2032
- 3.3.3. Compression Garments
- 3.3.4. Compression Braces
- 3.3.5. Compression Pumps
- 3.3.6. Compression Bandages
- 3.4. Global Compression Therapy Market Analysis, Opportunity and Forecast, By Distribution Channel, 2016-2032
- 3.4.1. Global Compression Therapy Market Analysis by Distribution Channel: Introduction
- 3.4.2. Market Size Absolute $ Opportunity Analysis and Forecast, By Distribution Channel, 2016-2032
- 3.4.3. Hospital Pharmacies
- 3.4.4. Retail Pharmacies
- 3.4.5. E-commerce
- 3.4.6. Others
- 3.5. Global Compression Therapy Market Analysis, Opportunity and Forecast, By Technology, 2016-2032
- 3.5.1. Global Compression Therapy Market Analysis by Technology: Introduction
- 3.5.2. Market Size Absolute $ Opportunity Analysis and Forecast, By Technology, 2016-2032
- 3.5.3. Static Compression Therapy
- 3.5.4. Dynamic Compression Therapy
- 3.6. Global Compression Therapy Market Analysis, Opportunity and Forecast, By Application, 2016-2032
- 3.6.1. Global Compression Therapy Market Analysis by Application: Introduction
- 3.6.2. Market Size Absolute $ Opportunity Analysis and Forecast, By Application, 2016-2032
- 3.6.3. Venous Leg Ulcer
- 3.6.4. Deep Vein Thrombosis
- 3.6.5. Lymphedema
- 3.6.6. Others
- 3.7. Global Compression Therapy Market Analysis, Opportunity and Forecast, By End User, 2016-2032
- 3.7.1. Global Compression Therapy Market Analysis by End User: Introduction
- 3.7.2. Market Size Absolute $ Opportunity Analysis and Forecast, By End User, 2016-2032
- 3.7.3. Hospitals & Clinics
- 3.7.4. Nursing Care Centers
- 3.7.5. Home Care
- 3.7.6. Others
- 4. North America Compression Therapy Market Analysis, Opportunity and Forecast, 2016-2032
- 4.1. North America Compression Therapy Market Analysis, 2016-2021
- 4.2. North America Compression Therapy Market Opportunity and Forecast, 2023-2032
- 4.3. North America Compression Therapy Market Analysis, Opportunity and Forecast, By Product Type, 2016-2032
- 4.3.1. North America Compression Therapy Market Analysis by Product Type: Introduction
- 4.3.2. Market Size Absolute $ Opportunity Analysis and Forecast, By Product Type, 2016-2032
- 4.3.3. Compression Garments
- 4.3.4. Compression Braces
- 4.3.5. Compression Pumps
- 4.3.6. Compression Bandages
- 4.4. North America Compression Therapy Market Analysis, Opportunity and Forecast, By Distribution Channel, 2016-2032
- 4.4.1. North America Compression Therapy Market Analysis by Distribution Channel: Introduction
- 4.4.2. Market Size Absolute $ Opportunity Analysis and Forecast, By Distribution Channel, 2016-2032
- 4.4.3. Hospital Pharmacies
- 4.4.4. Retail Pharmacies
- 4.4.5. E-commerce
- 4.4.6. Others
- 4.5. North America Compression Therapy Market Analysis, Opportunity and Forecast, By Technology, 2016-2032
- 4.5.1. North America Compression Therapy Market Analysis by Technology: Introduction
- 4.5.2. Market Size Absolute $ Opportunity Analysis and Forecast, By Technology, 2016-2032
- 4.5.3. Static Compression Therapy
- 4.5.4. Dynamic Compression Therapy
- 4.6. North America Compression Therapy Market Analysis, Opportunity and Forecast, By Application, 2016-2032
- 4.6.1. North America Compression Therapy Market Analysis by Application: Introduction
- 4.6.2. Market Size Absolute $ Opportunity Analysis and Forecast, By Application, 2016-2032
- 4.6.3. Venous Leg Ulcer
- 4.6.4. Deep Vein Thrombosis
- 4.6.5. Lymphedema
- 4.6.6. Others
- 4.7. North America Compression Therapy Market Analysis, Opportunity and Forecast, By End User, 2016-2032
- 4.7.1. North America Compression Therapy Market Analysis by End User: Introduction
- 4.7.2. Market Size Absolute $ Opportunity Analysis and Forecast, By End User, 2016-2032
- 4.7.3. Hospitals & Clinics
- 4.7.4. Nursing Care Centers
- 4.7.5. Home Care
- 4.7.6. Others
- 4.8. North America Compression Therapy Market Analysis, Opportunity and Forecast, By Country , 2016-2032
- 4.8.1. North America Compression Therapy Market Analysis by Country : Introduction
- 4.8.2. Market Size Absolute $ Opportunity Analysis and Forecast, Country , 2016-2032
- 4.8.2.1. The US
- 4.8.2.2. Canada
- 4.8.2.3. Mexico
- 5. Western Europe Compression Therapy Market Analysis, Opportunity and Forecast, 2016-2032
- 5.1. Western Europe Compression Therapy Market Analysis, 2016-2021
- 5.2. Western Europe Compression Therapy Market Opportunity and Forecast, 2023-2032
- 5.3. Western Europe Compression Therapy Market Analysis, Opportunity and Forecast, By Product Type, 2016-2032
- 5.3.1. Western Europe Compression Therapy Market Analysis by Product Type: Introduction
- 5.3.2. Market Size Absolute $ Opportunity Analysis and Forecast, By Product Type, 2016-2032
- 5.3.3. Compression Garments
- 5.3.4. Compression Braces
- 5.3.5. Compression Pumps
- 5.3.6. Compression Bandages
- 5.4. Western Europe Compression Therapy Market Analysis, Opportunity and Forecast, By Distribution Channel, 2016-2032
- 5.4.1. Western Europe Compression Therapy Market Analysis by Distribution Channel: Introduction
- 5.4.2. Market Size Absolute $ Opportunity Analysis and Forecast, By Distribution Channel, 2016-2032
- 5.4.3. Hospital Pharmacies
- 5.4.4. Retail Pharmacies
- 5.4.5. E-commerce
- 5.4.6. Others
- 5.5. Western Europe Compression Therapy Market Analysis, Opportunity and Forecast, By Technology, 2016-2032
- 5.5.1. Western Europe Compression Therapy Market Analysis by Technology: Introduction
- 5.5.2. Market Size Absolute $ Opportunity Analysis and Forecast, By Technology, 2016-2032
- 5.5.3. Static Compression Therapy
- 5.5.4. Dynamic Compression Therapy
- 5.6. Western Europe Compression Therapy Market Analysis, Opportunity and Forecast, By Application, 2016-2032
- 5.6.1. Western Europe Compression Therapy Market Analysis by Application: Introduction
- 5.6.2. Market Size Absolute $ Opportunity Analysis and Forecast, By Application, 2016-2032
- 5.6.3. Venous Leg Ulcer
- 5.6.4. Deep Vein Thrombosis
- 5.6.5. Lymphedema
- 5.6.6. Others
- 5.7. Western Europe Compression Therapy Market Analysis, Opportunity and Forecast, By End User, 2016-2032
- 5.7.1. Western Europe Compression Therapy Market Analysis by End User: Introduction
- 5.7.2. Market Size Absolute $ Opportunity Analysis and Forecast, By End User, 2016-2032
- 5.7.3. Hospitals & Clinics
- 5.7.4. Nursing Care Centers
- 5.7.5. Home Care
- 5.7.6. Others
- 5.8. Western Europe Compression Therapy Market Analysis, Opportunity and Forecast, By Country , 2016-2032
- 5.8.1. Western Europe Compression Therapy Market Analysis by Country : Introduction
- 5.8.2. Market Size Absolute $ Opportunity Analysis and Forecast, Country , 2016-2032
- 5.8.2.1. Germany
- 5.8.2.2. France
- 5.8.2.3. The UK
- 5.8.2.4. Spain
- 5.8.2.5. Italy
- 5.8.2.6. Portugal
- 5.8.2.7. Ireland
- 5.8.2.8. Austria
- 5.8.2.9. Switzerland
- 5.8.2.10. Benelux
- 5.8.2.11. Nordic
- 5.8.2.12. Rest of Western Europe
- 6. Eastern Europe Compression Therapy Market Analysis, Opportunity and Forecast, 2016-2032
- 6.1. Eastern Europe Compression Therapy Market Analysis, 2016-2021
- 6.2. Eastern Europe Compression Therapy Market Opportunity and Forecast, 2023-2032
- 6.3. Eastern Europe Compression Therapy Market Analysis, Opportunity and Forecast, By Product Type, 2016-2032
- 6.3.1. Eastern Europe Compression Therapy Market Analysis by Product Type: Introduction
- 6.3.2. Market Size Absolute $ Opportunity Analysis and Forecast, By Product Type, 2016-2032
- 6.3.3. Compression Garments
- 6.3.4. Compression Braces
- 6.3.5. Compression Pumps
- 6.3.6. Compression Bandages
- 6.4. Eastern Europe Compression Therapy Market Analysis, Opportunity and Forecast, By Distribution Channel, 2016-2032
- 6.4.1. Eastern Europe Compression Therapy Market Analysis by Distribution Channel: Introduction
- 6.4.2. Market Size Absolute $ Opportunity Analysis and Forecast, By Distribution Channel, 2016-2032
- 6.4.3. Hospital Pharmacies
- 6.4.4. Retail Pharmacies
- 6.4.5. E-commerce
- 6.4.6. Others
- 6.5. Eastern Europe Compression Therapy Market Analysis, Opportunity and Forecast, By Technology, 2016-2032
- 6.5.1. Eastern Europe Compression Therapy Market Analysis by Technology: Introduction
- 6.5.2. Market Size Absolute $ Opportunity Analysis and Forecast, By Technology, 2016-2032
- 6.5.3. Static Compression Therapy
- 6.5.4. Dynamic Compression Therapy
- 6.6. Eastern Europe Compression Therapy Market Analysis, Opportunity and Forecast, By Application, 2016-2032
- 6.6.1. Eastern Europe Compression Therapy Market Analysis by Application: Introduction
- 6.6.2. Market Size Absolute $ Opportunity Analysis and Forecast, By Application, 2016-2032
- 6.6.3. Venous Leg Ulcer
- 6.6.4. Deep Vein Thrombosis
- 6.6.5. Lymphedema
- 6.6.6. Others
- 6.7. Eastern Europe Compression Therapy Market Analysis, Opportunity and Forecast, By End User, 2016-2032
- 6.7.1. Eastern Europe Compression Therapy Market Analysis by End User: Introduction
- 6.7.2. Market Size Absolute $ Opportunity Analysis and Forecast, By End User, 2016-2032
- 6.7.3. Hospitals & Clinics
- 6.7.4. Nursing Care Centers
- 6.7.5. Home Care
- 6.7.6. Others
- 6.8. Eastern Europe Compression Therapy Market Analysis, Opportunity and Forecast, By Country , 2016-2032
- 6.8.1. Eastern Europe Compression Therapy Market Analysis by Country : Introduction
- 6.8.2. Market Size Absolute $ Opportunity Analysis and Forecast, Country , 2016-2032
- 6.8.2.1. Russia
- 6.8.2.2. Poland
- 6.8.2.3. The Czech Republic
- 6.8.2.4. Greece
- 6.8.2.5. Rest of Eastern Europe
- 7. APAC Compression Therapy Market Analysis, Opportunity and Forecast, 2016-2032
- 7.1. APAC Compression Therapy Market Analysis, 2016-2021
- 7.2. APAC Compression Therapy Market Opportunity and Forecast, 2023-2032
- 7.3. APAC Compression Therapy Market Analysis, Opportunity and Forecast, By Product Type, 2016-2032
- 7.3.1. APAC Compression Therapy Market Analysis by Product Type: Introduction
- 7.3.2. Market Size Absolute $ Opportunity Analysis and Forecast, By Product Type, 2016-2032
- 7.3.3. Compression Garments
- 7.3.4. Compression Braces
- 7.3.5. Compression Pumps
- 7.3.6. Compression Bandages
- 7.4. APAC Compression Therapy Market Analysis, Opportunity and Forecast, By Distribution Channel, 2016-2032
- 7.4.1. APAC Compression Therapy Market Analysis by Distribution Channel: Introduction
- 7.4.2. Market Size Absolute $ Opportunity Analysis and Forecast, By Distribution Channel, 2016-2032
- 7.4.3. Hospital Pharmacies
- 7.4.4. Retail Pharmacies
- 7.4.5. E-commerce
- 7.4.6. Others
- 7.5. APAC Compression Therapy Market Analysis, Opportunity and Forecast, By Technology, 2016-2032
- 7.5.1. APAC Compression Therapy Market Analysis by Technology: Introduction
- 7.5.2. Market Size Absolute $ Opportunity Analysis and Forecast, By Technology, 2016-2032
- 7.5.3. Static Compression Therapy
- 7.5.4. Dynamic Compression Therapy
- 7.6. APAC Compression Therapy Market Analysis, Opportunity and Forecast, By Application, 2016-2032
- 7.6.1. APAC Compression Therapy Market Analysis by Application: Introduction
- 7.6.2. Market Size Absolute $ Opportunity Analysis and Forecast, By Application, 2016-2032
- 7.6.3. Venous Leg Ulcer
- 7.6.4. Deep Vein Thrombosis
- 7.6.5. Lymphedema
- 7.6.6. Others
- 7.7. APAC Compression Therapy Market Analysis, Opportunity and Forecast, By End User, 2016-2032
- 7.7.1. APAC Compression Therapy Market Analysis by End User: Introduction
- 7.7.2. Market Size Absolute $ Opportunity Analysis and Forecast, By End User, 2016-2032
- 7.7.3. Hospitals & Clinics
- 7.7.4. Nursing Care Centers
- 7.7.5. Home Care
- 7.7.6. Others
- 7.8. APAC Compression Therapy Market Analysis, Opportunity and Forecast, By Country , 2016-2032
- 7.8.1. APAC Compression Therapy Market Analysis by Country : Introduction
- 7.8.2. Market Size Absolute $ Opportunity Analysis and Forecast, Country , 2016-2032
- 7.8.2.1. China
- 7.8.2.2. Japan
- 7.8.2.3. South Korea
- 7.8.2.4. India
- 7.8.2.5. Australia & New Zeland
- 7.8.2.6. Indonesia
- 7.8.2.7. Malaysia
- 7.8.2.8. Philippines
- 7.8.2.9. Singapore
- 7.8.2.10. Thailand
- 7.8.2.11. Vietnam
- 7.8.2.12. Rest of APAC
- 8. Latin America Compression Therapy Market Analysis, Opportunity and Forecast, 2016-2032
- 8.1. Latin America Compression Therapy Market Analysis, 2016-2021
- 8.2. Latin America Compression Therapy Market Opportunity and Forecast, 2023-2032
- 8.3. Latin America Compression Therapy Market Analysis, Opportunity and Forecast, By Product Type, 2016-2032
- 8.3.1. Latin America Compression Therapy Market Analysis by Product Type: Introduction
- 8.3.2. Market Size Absolute $ Opportunity Analysis and Forecast, By Product Type, 2016-2032
- 8.3.3. Compression Garments
- 8.3.4. Compression Braces
- 8.3.5. Compression Pumps
- 8.3.6. Compression Bandages
- 8.4. Latin America Compression Therapy Market Analysis, Opportunity and Forecast, By Distribution Channel, 2016-2032
- 8.4.1. Latin America Compression Therapy Market Analysis by Distribution Channel: Introduction
- 8.4.2. Market Size Absolute $ Opportunity Analysis and Forecast, By Distribution Channel, 2016-2032
- 8.4.3. Hospital Pharmacies
- 8.4.4. Retail Pharmacies
- 8.4.5. E-commerce
- 8.4.6. Others
- 8.5. Latin America Compression Therapy Market Analysis, Opportunity and Forecast, By Technology, 2016-2032
- 8.5.1. Latin America Compression Therapy Market Analysis by Technology: Introduction
- 8.5.2. Market Size Absolute $ Opportunity Analysis and Forecast, By Technology, 2016-2032
- 8.5.3. Static Compression Therapy
- 8.5.4. Dynamic Compression Therapy
- 8.6. Latin America Compression Therapy Market Analysis, Opportunity and Forecast, By Application, 2016-2032
- 8.6.1. Latin America Compression Therapy Market Analysis by Application: Introduction
- 8.6.2. Market Size Absolute $ Opportunity Analysis and Forecast, By Application, 2016-2032
- 8.6.3. Venous Leg Ulcer
- 8.6.4. Deep Vein Thrombosis
- 8.6.5. Lymphedema
- 8.6.6. Others
- 8.7. Latin America Compression Therapy Market Analysis, Opportunity and Forecast, By End User, 2016-2032
- 8.7.1. Latin America Compression Therapy Market Analysis by End User: Introduction
- 8.7.2. Market Size Absolute $ Opportunity Analysis and Forecast, By End User, 2016-2032
- 8.7.3. Hospitals & Clinics
- 8.7.4. Nursing Care Centers
- 8.7.5. Home Care
- 8.7.6. Others
- 8.8. Latin America Compression Therapy Market Analysis, Opportunity and Forecast, By Country , 2016-2032
- 8.8.1. Latin America Compression Therapy Market Analysis by Country : Introduction
- 8.8.2. Market Size Absolute $ Opportunity Analysis and Forecast, Country , 2016-2032
- 8.8.2.1. Brazil
- 8.8.2.2. Colombia
- 8.8.2.3. Chile
- 8.8.2.4. Argentina
- 8.8.2.5. Costa Rica
- 8.8.2.6. Rest of Latin America
- 9. Middle East & Africa Compression Therapy Market Analysis, Opportunity and Forecast, 2016-2032
- 9.1. Middle East & Africa Compression Therapy Market Analysis, 2016-2021
- 9.2. Middle East & Africa Compression Therapy Market Opportunity and Forecast, 2023-2032
- 9.3. Middle East & Africa Compression Therapy Market Analysis, Opportunity and Forecast, By Product Type, 2016-2032
- 9.3.1. Middle East & Africa Compression Therapy Market Analysis by Product Type: Introduction
- 9.3.2. Market Size Absolute $ Opportunity Analysis and Forecast, By Product Type, 2016-2032
- 9.3.3. Compression Garments
- 9.3.4. Compression Braces
- 9.3.5. Compression Pumps
- 9.3.6. Compression Bandages
- 9.4. Middle East & Africa Compression Therapy Market Analysis, Opportunity and Forecast, By Distribution Channel, 2016-2032
- 9.4.1. Middle East & Africa Compression Therapy Market Analysis by Distribution Channel: Introduction
- 9.4.2. Market Size Absolute $ Opportunity Analysis and Forecast, By Distribution Channel, 2016-2032
- 9.4.3. Hospital Pharmacies
- 9.4.4. Retail Pharmacies
- 9.4.5. E-commerce
- 9.4.6. Others
- 9.5. Middle East & Africa Compression Therapy Market Analysis, Opportunity and Forecast, By Technology, 2016-2032
- 9.5.1. Middle East & Africa Compression Therapy Market Analysis by Technology: Introduction
- 9.5.2. Market Size Absolute $ Opportunity Analysis and Forecast, By Technology, 2016-2032
- 9.5.3. Static Compression Therapy
- 9.5.4. Dynamic Compression Therapy
- 9.6. Middle East & Africa Compression Therapy Market Analysis, Opportunity and Forecast, By Application, 2016-2032
- 9.6.1. Middle East & Africa Compression Therapy Market Analysis by Application: Introduction
- 9.6.2. Market Size Absolute $ Opportunity Analysis and Forecast, By Application, 2016-2032
- 9.6.3. Venous Leg Ulcer
- 9.6.4. Deep Vein Thrombosis
- 9.6.5. Lymphedema
- 9.6.6. Others
- 9.7. Middle East & Africa Compression Therapy Market Analysis, Opportunity and Forecast, By End User, 2016-2032
- 9.7.1. Middle East & Africa Compression Therapy Market Analysis by End User: Introduction
- 9.7.2. Market Size Absolute $ Opportunity Analysis and Forecast, By End User, 2016-2032
- 9.7.3. Hospitals & Clinics
- 9.7.4. Nursing Care Centers
- 9.7.5. Home Care
- 9.7.6. Others
- 9.8. Middle East & Africa Compression Therapy Market Analysis, Opportunity and Forecast, By Country , 2016-2032
- 9.8.1. Middle East & Africa Compression Therapy Market Analysis by Country : Introduction
- 9.8.2. Market Size Absolute $ Opportunity Analysis and Forecast, Country , 2016-2032
- 9.8.2.1. Algeria
- 9.8.2.2. Egypt
- 9.8.2.3. Israel
- 9.8.2.4. Kuwait
- 9.8.2.5. Nigeria
- 9.8.2.6. Saudi Arabia
- 9.8.2.7. South Africa
- 9.8.2.8. Turkey
- 9.8.2.9. The UAE
- 9.8.2.10. Rest of MEA
- 10. Global Compression Therapy Market Analysis, Opportunity and Forecast, By Region , 2016-2032
- 10.1. Global Compression Therapy Market Analysis by Region : Introduction
- 10.2. Market Size Absolute $ Opportunity Analysis and Forecast, By Region , 2016-2032
- 10.2.1. North America
- 10.2.2. Western Europe
- 10.2.3. Eastern Europe
- 10.2.4. APAC
- 10.2.5. Latin America
- 10.2.6. Middle East & Africa
- 11. Global Compression Therapy Market Competitive Landscape, Market Share Analysis, and Company Profiles
- 11.1. Market Share Analysis
- 11.2. Company Profiles
- 11.3. 3M Company
- 11.3.1. Company Overview
- 11.3.2. Financial Highlights
- 11.3.3. Product Portfolio
- 11.3.4. SWOT Analysis
- 11.3.5. Key Strategies and Developments
- 11.4. Medtronic plc
- 11.4.1. Company Overview
- 11.4.2. Financial Highlights
- 11.4.3. Product Portfolio
- 11.4.4. SWOT Analysis
- 11.4.5. Key Strategies and Developments
- 11.5. Smith & Nephew plc
- 11.5.1. Company Overview
- 11.5.2. Financial Highlights
- 11.5.3. Product Portfolio
- 11.5.4. SWOT Analysis
- 11.5.5. Key Strategies and Developments
- 11.6. Spectrum Healthcare
- 11.6.1. Company Overview
- 11.6.2. Financial Highlights
- 11.6.3. Product Portfolio
- 11.6.4. SWOT Analysis
- 11.6.5. Key Strategies and Developments
- 11.7. SIGVARIS
- 11.7.1. Company Overview
- 11.7.2. Financial Highlights
- 11.7.3. Product Portfolio
- 11.7.4. SWOT Analysis
- 11.7.5. Key Strategies and Developments
- 11.8. Bio Compression Systems, Inc.
- 11.8.1. Company Overview
- 11.8.2. Financial Highlights
- 11.8.3. Product Portfolio
- 11.8.4. SWOT Analysis
- 11.8.5. Key Strategies and Developments
- 11.9. Cardinal Health
- 11.9.1. Company Overview
- 11.9.2. Financial Highlights
- 11.9.3. Product Portfolio
- 11.9.4. SWOT Analysis
- 11.9.5. Key Strategies and Developments
- 11.10. Julius Zorn GmbH
- 11.10.1. Company Overview
- 11.10.2. Financial Highlights
- 11.10.3. Product Portfolio
- 11.10.4. SWOT Analysis
- 11.10.5. Key Strategies and Developments
- 11.11. Hartmann AG
- 11.11.1. Company Overview
- 11.11.2. Financial Highlights
- 11.11.3. Product Portfolio
- 11.11.4. SWOT Analysis
- 11.11.5. Key Strategies and Developments
- 11.12. Medi GmbH & Co.
- 11.12.1. Company Overview
- 11.12.2. Financial Highlights
- 11.12.3. Product Portfolio
- 11.12.4. SWOT Analysis
- 11.12.5. Key Strategies and Developments
- 11.13.1. Company Overview
- 11.13.2. Financial Highlights
- 11.13.3. Product Portfolio
- 11.13.4. SWOT Analysis
- 11.13.5. Key Strategies and Developments
- 11.14. BSN Medical GmbH
- 11.14.1. Company Overview
- 11.14.2. Financial Highlights
- 11.14.3. Product Portfolio
- 11.14.4. SWOT Analysis
- 11.14.5. Key Strategies and Developments
- 11.15. Stryker
- 11.15.1. Company Overview
- 11.15.2. Financial Highlights
- 11.15.3. Product Portfolio
- 11.15.4. SWOT Analysis
- 11.15.5. Key Strategies and Developments
- 11.16. Gottfried Medical
- 11.16.1. Company Overview
- 11.16.2. Financial Highlights
- 11.16.3. Product Portfolio
- 11.16.4. SWOT Analysis
- 11.16.5. Key Strategies and Developments
- 11.17. Convatec Group PLC
- 11.17.1. Company Overview
- 11.17.2. Financial Highlights
- 11.17.3. Product Portfolio
- 11.17.4. SWOT Analysis
- 11.17.5. Key Strategies and Developments
- 11.18. Juzo
- 11.18.1. Company Overview
- 11.18.2. Financial Highlights
- 11.18.3. Product Portfolio
- 11.18.4. SWOT Analysis
- 11.18.5. Key Strategies and Developments
- 11.19. Paul Hartmann AG
- 11.19.1. Company Overview
- 11.19.2. Financial Highlights
- 11.19.3. Product Portfolio
- 11.19.4. SWOT Analysis
- 11.19.5. Key Strategies and Developments
- 11.20. Tactile Medical
- 11.20.1. Company Overview
- 11.20.2. Financial Highlights
- 11.20.3. Product Portfolio
- 11.20.4. SWOT Analysis
- 11.20.5. Key Strategies and Developments
- 11.21. Other Key Players
- 11.21.1. Company Overview
- 11.21.2. Financial Highlights
- 11.21.3. Product Portfolio
- 11.21.4. SWOT Analysis
- 11.21.5. Key Strategies and Developments
- 12. Assumptions and Acronyms
- 13. Research Methodology
- 14. Contact
- List of Figures
- Figure 1: Global Compression Therapy Market Revenue (US$ Mn) Market Share by Product Type in 2022
- Figure 2: Global Compression Therapy Market Attractiveness Analysis by Product Type, 2016-2032
- Figure 3: Global Compression Therapy Market Revenue (US$ Mn) Market Share by Distribution Channelin 2022
- Figure 4: Global Compression Therapy Market Attractiveness Analysis by Distribution Channel, 2016-2032
- Figure 5: Global Compression Therapy Market Revenue (US$ Mn) Market Share by Technologyin 2022
- Figure 6: Global Compression Therapy Market Attractiveness Analysis by Technology, 2016-2032
- Figure 7: Global Compression Therapy Market Revenue (US$ Mn) Market Share by Applicationin 2022
- Figure 8: Global Compression Therapy Market Attractiveness Analysis by Application, 2016-2032
- Figure 9: Global Compression Therapy Market Revenue (US$ Mn) Market Share by End Userin 2022
- Figure 10: Global Compression Therapy Market Attractiveness Analysis by End User, 2016-2032
- Figure 11: Global Compression Therapy Market Revenue (US$ Mn) Market Share by Region in 2022
- Figure 12: Global Compression Therapy Market Attractiveness Analysis by Region, 2016-2032
- Figure 13: Global Compression Therapy Market Revenue (US$ Mn) (2016-2032)
- Figure 14: Global Compression Therapy Market Revenue (US$ Mn) Comparison by Region (2016-2032)
- Figure 15: Global Compression Therapy Market Revenue (US$ Mn) Comparison by Product Type (2016-2032)
- Figure 16: Global Compression Therapy Market Revenue (US$ Mn) Comparison by Distribution Channel (2016-2032)
- Figure 17: Global Compression Therapy Market Revenue (US$ Mn) Comparison by Technology (2016-2032)
- Figure 18: Global Compression Therapy Market Revenue (US$ Mn) Comparison by Application (2016-2032)
- Figure 19: Global Compression Therapy Market Revenue (US$ Mn) Comparison by End User (2016-2032)
- Figure 20: Global Compression Therapy Market Y-o-Y Growth Rate Comparison by Region (2016-2032)
- Figure 21: Global Compression Therapy Market Y-o-Y Growth Rate Comparison by Product Type (2016-2032)
- Figure 22: Global Compression Therapy Market Y-o-Y Growth Rate Comparison by Distribution Channel (2016-2032)
- Figure 23: Global Compression Therapy Market Y-o-Y Growth Rate Comparison by Technology (2016-2032)
- Figure 24: Global Compression Therapy Market Y-o-Y Growth Rate Comparison by Application (2016-2032)
- Figure 25: Global Compression Therapy Market Y-o-Y Growth Rate Comparison by End User (2016-2032)
- Figure 26: Global Compression Therapy Market Share Comparison by Region (2016-2032)
- Figure 27: Global Compression Therapy Market Share Comparison by Product Type (2016-2032)
- Figure 28: Global Compression Therapy Market Share Comparison by Distribution Channel (2016-2032)
- Figure 29: Global Compression Therapy Market Share Comparison by Technology (2016-2032)
- Figure 30: Global Compression Therapy Market Share Comparison by Application (2016-2032)
- Figure 31: Global Compression Therapy Market Share Comparison by End User (2016-2032)
- Figure 32: North America Compression Therapy Market Revenue (US$ Mn) Market Share by Product Typein 2022
- Figure 33: North America Compression Therapy Market Attractiveness Analysis by Product Type, 2016-2032
- Figure 34: North America Compression Therapy Market Revenue (US$ Mn) Market Share by Distribution Channelin 2022
- Figure 35: North America Compression Therapy Market Attractiveness Analysis by Distribution Channel, 2016-2032
- Figure 36: North America Compression Therapy Market Revenue (US$ Mn) Market Share by Technologyin 2022
- Figure 37: North America Compression Therapy Market Attractiveness Analysis by Technology, 2016-2032
- Figure 38: North America Compression Therapy Market Revenue (US$ Mn) Market Share by Applicationin 2022
- Figure 39: North America Compression Therapy Market Attractiveness Analysis by Application, 2016-2032
- Figure 40: North America Compression Therapy Market Revenue (US$ Mn) Market Share by End Userin 2022
- Figure 41: North America Compression Therapy Market Attractiveness Analysis by End User, 2016-2032
- Figure 42: North America Compression Therapy Market Revenue (US$ Mn) Market Share by Country in 2022
- Figure 43: North America Compression Therapy Market Attractiveness Analysis by Country, 2016-2032
- Figure 44: North America Compression Therapy Market Revenue (US$ Mn) (2016-2032)
- Figure 45: North America Compression Therapy Market Revenue (US$ Mn) Comparison by Country (2016-2032)
- Figure 46: North America Compression Therapy Market Revenue (US$ Mn) Comparison by Product Type (2016-2032)
- Figure 47: North America Compression Therapy Market Revenue (US$ Mn) Comparison by Distribution Channel (2016-2032)
- Figure 48: North America Compression Therapy Market Revenue (US$ Mn) Comparison by Technology (2016-2032)
- Figure 49: North America Compression Therapy Market Revenue (US$ Mn) Comparison by Application (2016-2032)
- Figure 50: North America Compression Therapy Market Revenue (US$ Mn) Comparison by End User (2016-2032)
- Figure 51: North America Compression Therapy Market Y-o-Y Growth Rate Comparison by Country (2016-2032)
- Figure 52: North America Compression Therapy Market Y-o-Y Growth Rate Comparison by Product Type (2016-2032)
- Figure 53: North America Compression Therapy Market Y-o-Y Growth Rate Comparison by Distribution Channel (2016-2032)
- Figure 54: North America Compression Therapy Market Y-o-Y Growth Rate Comparison by Technology (2016-2032)
- Figure 55: North America Compression Therapy Market Y-o-Y Growth Rate Comparison by Application (2016-2032)
- Figure 56: North America Compression Therapy Market Y-o-Y Growth Rate Comparison by End User (2016-2032)
- Figure 57: North America Compression Therapy Market Share Comparison by Country (2016-2032)
- Figure 58: North America Compression Therapy Market Share Comparison by Product Type (2016-2032)
- Figure 59: North America Compression Therapy Market Share Comparison by Distribution Channel (2016-2032)
- Figure 60: North America Compression Therapy Market Share Comparison by Technology (2016-2032)
- Figure 61: North America Compression Therapy Market Share Comparison by Application (2016-2032)
- Figure 62: North America Compression Therapy Market Share Comparison by End User (2016-2032)
- Figure 63: Western Europe Compression Therapy Market Revenue (US$ Mn) Market Share by Product Typein 2022
- Figure 64: Western Europe Compression Therapy Market Attractiveness Analysis by Product Type, 2016-2032
- Figure 65: Western Europe Compression Therapy Market Revenue (US$ Mn) Market Share by Distribution Channelin 2022
- Figure 66: Western Europe Compression Therapy Market Attractiveness Analysis by Distribution Channel, 2016-2032
- Figure 67: Western Europe Compression Therapy Market Revenue (US$ Mn) Market Share by Technologyin 2022
- Figure 68: Western Europe Compression Therapy Market Attractiveness Analysis by Technology, 2016-2032
- Figure 69: Western Europe Compression Therapy Market Revenue (US$ Mn) Market Share by Applicationin 2022
- Figure 70: Western Europe Compression Therapy Market Attractiveness Analysis by Application, 2016-2032
- Figure 71: Western Europe Compression Therapy Market Revenue (US$ Mn) Market Share by End Userin 2022
- Figure 72: Western Europe Compression Therapy Market Attractiveness Analysis by End User, 2016-2032
- Figure 73: Western Europe Compression Therapy Market Revenue (US$ Mn) Market Share by Country in 2022
- Figure 74: Western Europe Compression Therapy Market Attractiveness Analysis by Country, 2016-2032
- Figure 75: Western Europe Compression Therapy Market Revenue (US$ Mn) (2016-2032)
- Figure 76: Western Europe Compression Therapy Market Revenue (US$ Mn) Comparison by Country (2016-2032)
- Figure 77: Western Europe Compression Therapy Market Revenue (US$ Mn) Comparison by Product Type (2016-2032)
- Figure 78: Western Europe Compression Therapy Market Revenue (US$ Mn) Comparison by Distribution Channel (2016-2032)
- Figure 79: Western Europe Compression Therapy Market Revenue (US$ Mn) Comparison by Technology (2016-2032)
- Figure 80: Western Europe Compression Therapy Market Revenue (US$ Mn) Comparison by Application (2016-2032)
- Figure 81: Western Europe Compression Therapy Market Revenue (US$ Mn) Comparison by End User (2016-2032)
- Figure 82: Western Europe Compression Therapy Market Y-o-Y Growth Rate Comparison by Country (2016-2032)
- Figure 83: Western Europe Compression Therapy Market Y-o-Y Growth Rate Comparison by Product Type (2016-2032)
- Figure 84: Western Europe Compression Therapy Market Y-o-Y Growth Rate Comparison by Distribution Channel (2016-2032)
- Figure 85: Western Europe Compression Therapy Market Y-o-Y Growth Rate Comparison by Technology (2016-2032)
- Figure 86: Western Europe Compression Therapy Market Y-o-Y Growth Rate Comparison by Application (2016-2032)
- Figure 87: Western Europe Compression Therapy Market Y-o-Y Growth Rate Comparison by End User (2016-2032)
- Figure 88: Western Europe Compression Therapy Market Share Comparison by Country (2016-2032)
- Figure 89: Western Europe Compression Therapy Market Share Comparison by Product Type (2016-2032)
- Figure 90: Western Europe Compression Therapy Market Share Comparison by Distribution Channel (2016-2032)
- Figure 91: Western Europe Compression Therapy Market Share Comparison by Technology (2016-2032)
- Figure 92: Western Europe Compression Therapy Market Share Comparison by Application (2016-2032)
- Figure 93: Western Europe Compression Therapy Market Share Comparison by End User (2016-2032)
- Figure 94: Eastern Europe Compression Therapy Market Revenue (US$ Mn) Market Share by Product Typein 2022
- Figure 95: Eastern Europe Compression Therapy Market Attractiveness Analysis by Product Type, 2016-2032
- Figure 96: Eastern Europe Compression Therapy Market Revenue (US$ Mn) Market Share by Distribution Channelin 2022
- Figure 97: Eastern Europe Compression Therapy Market Attractiveness Analysis by Distribution Channel, 2016-2032
- Figure 98: Eastern Europe Compression Therapy Market Revenue (US$ Mn) Market Share by Technologyin 2022
- Figure 99: Eastern Europe Compression Therapy Market Attractiveness Analysis by Technology, 2016-2032
- Figure 100: Eastern Europe Compression Therapy Market Revenue (US$ Mn) Market Share by Applicationin 2022
- Figure 101: Eastern Europe Compression Therapy Market Attractiveness Analysis by Application, 2016-2032
- Figure 102: Eastern Europe Compression Therapy Market Revenue (US$ Mn) Market Share by End Userin 2022
- Figure 103: Eastern Europe Compression Therapy Market Attractiveness Analysis by End User, 2016-2032
- Figure 104: Eastern Europe Compression Therapy Market Revenue (US$ Mn) Market Share by Country in 2022
- Figure 105: Eastern Europe Compression Therapy Market Attractiveness Analysis by Country, 2016-2032
- Figure 106: Eastern Europe Compression Therapy Market Revenue (US$ Mn) (2016-2032)
- Figure 107: Eastern Europe Compression Therapy Market Revenue (US$ Mn) Comparison by Country (2016-2032)
- Figure 108: Eastern Europe Compression Therapy Market Revenue (US$ Mn) Comparison by Product Type (2016-2032)
- Figure 109: Eastern Europe Compression Therapy Market Revenue (US$ Mn) Comparison by Distribution Channel (2016-2032)
- Figure 110: Eastern Europe Compression Therapy Market Revenue (US$ Mn) Comparison by Technology (2016-2032)
- Figure 111: Eastern Europe Compression Therapy Market Revenue (US$ Mn) Comparison by Application (2016-2032)
- Figure 112: Eastern Europe Compression Therapy Market Revenue (US$ Mn) Comparison by End User (2016-2032)
- Figure 113: Eastern Europe Compression Therapy Market Y-o-Y Growth Rate Comparison by Country (2016-2032)
- Figure 114: Eastern Europe Compression Therapy Market Y-o-Y Growth Rate Comparison by Product Type (2016-2032)
- Figure 115: Eastern Europe Compression Therapy Market Y-o-Y Growth Rate Comparison by Distribution Channel (2016-2032)
- Figure 116: Eastern Europe Compression Therapy Market Y-o-Y Growth Rate Comparison by Technology (2016-2032)
- Figure 117: Eastern Europe Compression Therapy Market Y-o-Y Growth Rate Comparison by Application (2016-2032)
- Figure 118: Eastern Europe Compression Therapy Market Y-o-Y Growth Rate Comparison by End User (2016-2032)
- Figure 119: Eastern Europe Compression Therapy Market Share Comparison by Country (2016-2032)
- Figure 120: Eastern Europe Compression Therapy Market Share Comparison by Product Type (2016-2032)
- Figure 121: Eastern Europe Compression Therapy Market Share Comparison by Distribution Channel (2016-2032)
- Figure 122: Eastern Europe Compression Therapy Market Share Comparison by Technology (2016-2032)
- Figure 123: Eastern Europe Compression Therapy Market Share Comparison by Application (2016-2032)
- Figure 124: Eastern Europe Compression Therapy Market Share Comparison by End User (2016-2032)
- Figure 125: APAC Compression Therapy Market Revenue (US$ Mn) Market Share by Product Typein 2022
- Figure 126: APAC Compression Therapy Market Attractiveness Analysis by Product Type, 2016-2032
- Figure 127: APAC Compression Therapy Market Revenue (US$ Mn) Market Share by Distribution Channelin 2022
- Figure 128: APAC Compression Therapy Market Attractiveness Analysis by Distribution Channel, 2016-2032
- Figure 129: APAC Compression Therapy Market Revenue (US$ Mn) Market Share by Technologyin 2022
- Figure 130: APAC Compression Therapy Market Attractiveness Analysis by Technology, 2016-2032
- Figure 131: APAC Compression Therapy Market Revenue (US$ Mn) Market Share by Applicationin 2022
- Figure 132: APAC Compression Therapy Market Attractiveness Analysis by Application, 2016-2032
- Figure 133: APAC Compression Therapy Market Revenue (US$ Mn) Market Share by End Userin 2022
- Figure 134: APAC Compression Therapy Market Attractiveness Analysis by End User, 2016-2032
- Figure 135: APAC Compression Therapy Market Revenue (US$ Mn) Market Share by Country in 2022
- Figure 136: APAC Compression Therapy Market Attractiveness Analysis by Country, 2016-2032
- Figure 137: APAC Compression Therapy Market Revenue (US$ Mn) (2016-2032)
- Figure 138: APAC Compression Therapy Market Revenue (US$ Mn) Comparison by Country (2016-2032)
- Figure 139: APAC Compression Therapy Market Revenue (US$ Mn) Comparison by Product Type (2016-2032)
- Figure 140: APAC Compression Therapy Market Revenue (US$ Mn) Comparison by Distribution Channel (2016-2032)
- Figure 141: APAC Compression Therapy Market Revenue (US$ Mn) Comparison by Technology (2016-2032)
- Figure 142: APAC Compression Therapy Market Revenue (US$ Mn) Comparison by Application (2016-2032)
- Figure 143: APAC Compression Therapy Market Revenue (US$ Mn) Comparison by End User (2016-2032)
- Figure 144: APAC Compression Therapy Market Y-o-Y Growth Rate Comparison by Country (2016-2032)
- Figure 145: APAC Compression Therapy Market Y-o-Y Growth Rate Comparison by Product Type (2016-2032)
- Figure 146: APAC Compression Therapy Market Y-o-Y Growth Rate Comparison by Distribution Channel (2016-2032)
- Figure 147: APAC Compression Therapy Market Y-o-Y Growth Rate Comparison by Technology (2016-2032)
- Figure 148: APAC Compression Therapy Market Y-o-Y Growth Rate Comparison by Application (2016-2032)
- Figure 149: APAC Compression Therapy Market Y-o-Y Growth Rate Comparison by End User (2016-2032)
- Figure 150: APAC Compression Therapy Market Share Comparison by Country (2016-2032)
- Figure 151: APAC Compression Therapy Market Share Comparison by Product Type (2016-2032)
- Figure 152: APAC Compression Therapy Market Share Comparison by Distribution Channel (2016-2032)
- Figure 153: APAC Compression Therapy Market Share Comparison by Technology (2016-2032)
- Figure 154: APAC Compression Therapy Market Share Comparison by Application (2016-2032)
- Figure 155: APAC Compression Therapy Market Share Comparison by End User (2016-2032)
- Figure 156: Latin America Compression Therapy Market Revenue (US$ Mn) Market Share by Product Typein 2022
- Figure 157: Latin America Compression Therapy Market Attractiveness Analysis by Product Type, 2016-2032
- Figure 158: Latin America Compression Therapy Market Revenue (US$ Mn) Market Share by Distribution Channelin 2022
- Figure 159: Latin America Compression Therapy Market Attractiveness Analysis by Distribution Channel, 2016-2032
- Figure 160: Latin America Compression Therapy Market Revenue (US$ Mn) Market Share by Technologyin 2022
- Figure 161: Latin America Compression Therapy Market Attractiveness Analysis by Technology, 2016-2032
- Figure 162: Latin America Compression Therapy Market Revenue (US$ Mn) Market Share by Applicationin 2022
- Figure 163: Latin America Compression Therapy Market Attractiveness Analysis by Application, 2016-2032
- Figure 164: Latin America Compression Therapy Market Revenue (US$ Mn) Market Share by End Userin 2022
- Figure 165: Latin America Compression Therapy Market Attractiveness Analysis by End User, 2016-2032
- Figure 166: Latin America Compression Therapy Market Revenue (US$ Mn) Market Share by Country in 2022
- Figure 167: Latin America Compression Therapy Market Attractiveness Analysis by Country, 2016-2032
- Figure 168: Latin America Compression Therapy Market Revenue (US$ Mn) (2016-2032)
- Figure 169: Latin America Compression Therapy Market Revenue (US$ Mn) Comparison by Country (2016-2032)
- Figure 170: Latin America Compression Therapy Market Revenue (US$ Mn) Comparison by Product Type (2016-2032)
- Figure 171: Latin America Compression Therapy Market Revenue (US$ Mn) Comparison by Distribution Channel (2016-2032)
- Figure 172: Latin America Compression Therapy Market Revenue (US$ Mn) Comparison by Technology (2016-2032)
- Figure 173: Latin America Compression Therapy Market Revenue (US$ Mn) Comparison by Application (2016-2032)
- Figure 174: Latin America Compression Therapy Market Revenue (US$ Mn) Comparison by End User (2016-2032)
- Figure 175: Latin America Compression Therapy Market Y-o-Y Growth Rate Comparison by Country (2016-2032)
- Figure 176: Latin America Compression Therapy Market Y-o-Y Growth Rate Comparison by Product Type (2016-2032)
- Figure 177: Latin America Compression Therapy Market Y-o-Y Growth Rate Comparison by Distribution Channel (2016-2032)
- Figure 178: Latin America Compression Therapy Market Y-o-Y Growth Rate Comparison by Technology (2016-2032)
- Figure 179: Latin America Compression Therapy Market Y-o-Y Growth Rate Comparison by Application (2016-2032)
- Figure 180: Latin America Compression Therapy Market Y-o-Y Growth Rate Comparison by End User (2016-2032)
- Figure 181: Latin America Compression Therapy Market Share Comparison by Country (2016-2032)
- Figure 182: Latin America Compression Therapy Market Share Comparison by Product Type (2016-2032)
- Figure 183: Latin America Compression Therapy Market Share Comparison by Distribution Channel (2016-2032)
- Figure 184: Latin America Compression Therapy Market Share Comparison by Technology (2016-2032)
- Figure 185: Latin America Compression Therapy Market Share Comparison by Application (2016-2032)
- Figure 186: Latin America Compression Therapy Market Share Comparison by End User (2016-2032)
- Figure 187: Middle East & Africa Compression Therapy Market Revenue (US$ Mn) Market Share by Product Typein 2022
- Figure 188: Middle East & Africa Compression Therapy Market Attractiveness Analysis by Product Type, 2016-2032
- Figure 189: Middle East & Africa Compression Therapy Market Revenue (US$ Mn) Market Share by Distribution Channelin 2022
- Figure 190: Middle East & Africa Compression Therapy Market Attractiveness Analysis by Distribution Channel, 2016-2032
- Figure 191: Middle East & Africa Compression Therapy Market Revenue (US$ Mn) Market Share by Technologyin 2022
- Figure 192: Middle East & Africa Compression Therapy Market Attractiveness Analysis by Technology, 2016-2032
- Figure 193: Middle East & Africa Compression Therapy Market Revenue (US$ Mn) Market Share by Applicationin 2022
- Figure 194: Middle East & Africa Compression Therapy Market Attractiveness Analysis by Application, 2016-2032
- Figure 195: Middle East & Africa Compression Therapy Market Revenue (US$ Mn) Market Share by End Userin 2022
- Figure 196: Middle East & Africa Compression Therapy Market Attractiveness Analysis by End User, 2016-2032
- Figure 197: Middle East & Africa Compression Therapy Market Revenue (US$ Mn) Market Share by Country in 2022
- Figure 198: Middle East & Africa Compression Therapy Market Attractiveness Analysis by Country, 2016-2032
- Figure 199: Middle East & Africa Compression Therapy Market Revenue (US$ Mn) (2016-2032)
- Figure 200: Middle East & Africa Compression Therapy Market Revenue (US$ Mn) Comparison by Country (2016-2032)
- Figure 201: Middle East & Africa Compression Therapy Market Revenue (US$ Mn) Comparison by Product Type (2016-2032)
- Figure 202: Middle East & Africa Compression Therapy Market Revenue (US$ Mn) Comparison by Distribution Channel (2016-2032)
- Figure 203: Middle East & Africa Compression Therapy Market Revenue (US$ Mn) Comparison by Technology (2016-2032)
- Figure 204: Middle East & Africa Compression Therapy Market Revenue (US$ Mn) Comparison by Application (2016-2032)
- Figure 205: Middle East & Africa Compression Therapy Market Revenue (US$ Mn) Comparison by End User (2016-2032)
- Figure 206: Middle East & Africa Compression Therapy Market Y-o-Y Growth Rate Comparison by Country (2016-2032)
- Figure 207: Middle East & Africa Compression Therapy Market Y-o-Y Growth Rate Comparison by Product Type (2016-2032)
- Figure 208: Middle East & Africa Compression Therapy Market Y-o-Y Growth Rate Comparison by Distribution Channel (2016-2032)
- Figure 209: Middle East & Africa Compression Therapy Market Y-o-Y Growth Rate Comparison by Technology (2016-2032)
- Figure 210: Middle East & Africa Compression Therapy Market Y-o-Y Growth Rate Comparison by Application (2016-2032)
- Figure 211: Middle East & Africa Compression Therapy Market Y-o-Y Growth Rate Comparison by End User (2016-2032)
- Figure 212: Middle East & Africa Compression Therapy Market Share Comparison by Country (2016-2032)
- Figure 213: Middle East & Africa Compression Therapy Market Share Comparison by Product Type (2016-2032)
- Figure 214: Middle East & Africa Compression Therapy Market Share Comparison by Distribution Channel (2016-2032)
- Figure 215: Middle East & Africa Compression Therapy Market Share Comparison by Technology (2016-2032)
- Figure 216: Middle East & Africa Compression Therapy Market Share Comparison by Application (2016-2032)
- Figure 217: Middle East & Africa Compression Therapy Market Share Comparison by End User (2016-2032)
- List of Tables
- Table 1: Global Compression Therapy Market Comparison by Product Type (2016-2032)
- Table 2: Global Compression Therapy Market Comparison by Distribution Channel (2016-2032)
- Table 3: Global Compression Therapy Market Comparison by Technology (2016-2032)
- Table 4: Global Compression Therapy Market Comparison by Application (2016-2032)
- Table 5: Global Compression Therapy Market Comparison by End User (2016-2032)
- Table 6: Global Compression Therapy Market Revenue (US$ Mn) Comparison by Region (2016-2032)
- Table 7: Global Compression Therapy Market Revenue (US$ Mn) (2016-2032)
- Table 8: Global Compression Therapy Market Revenue (US$ Mn) Comparison by Region (2016-2032)
- Table 9: Global Compression Therapy Market Revenue (US$ Mn) Comparison by Product Type (2016-2032)
- Table 10: Global Compression Therapy Market Revenue (US$ Mn) Comparison by Distribution Channel (2016-2032)
- Table 11: Global Compression Therapy Market Revenue (US$ Mn) Comparison by Technology (2016-2032)
- Table 12: Global Compression Therapy Market Revenue (US$ Mn) Comparison by Application (2016-2032)
- Table 13: Global Compression Therapy Market Revenue (US$ Mn) Comparison by End User (2016-2032)
- Table 14: Global Compression Therapy Market Y-o-Y Growth Rate Comparison by Region (2016-2032)
- Table 15: Global Compression Therapy Market Y-o-Y Growth Rate Comparison by Product Type (2016-2032)
- Table 16: Global Compression Therapy Market Y-o-Y Growth Rate Comparison by Distribution Channel (2016-2032)
- Table 17: Global Compression Therapy Market Y-o-Y Growth Rate Comparison by Technology (2016-2032)
- Table 18: Global Compression Therapy Market Y-o-Y Growth Rate Comparison by Application (2016-2032)
- Table 19: Global Compression Therapy Market Y-o-Y Growth Rate Comparison by End User (2016-2032)
- Table 20: Global Compression Therapy Market Share Comparison by Region (2016-2032)
- Table 21: Global Compression Therapy Market Share Comparison by Product Type (2016-2032)
- Table 22: Global Compression Therapy Market Share Comparison by Distribution Channel (2016-2032)
- Table 23: Global Compression Therapy Market Share Comparison by Technology (2016-2032)
- Table 24: Global Compression Therapy Market Share Comparison by Application (2016-2032)
- Table 25: Global Compression Therapy Market Share Comparison by End User (2016-2032)
- Table 26: North America Compression Therapy Market Comparison by Distribution Channel (2016-2032)
- Table 27: North America Compression Therapy Market Comparison by Technology (2016-2032)
- Table 28: North America Compression Therapy Market Comparison by Application (2016-2032)
- Table 29: North America Compression Therapy Market Comparison by End User (2016-2032)
- Table 30: North America Compression Therapy Market Revenue (US$ Mn) Comparison by Country (2016-2032)
- Table 31: North America Compression Therapy Market Revenue (US$ Mn) (2016-2032)
- Table 32: North America Compression Therapy Market Revenue (US$ Mn) Comparison by Country (2016-2032)
- Table 33: North America Compression Therapy Market Revenue (US$ Mn) Comparison by Product Type (2016-2032)
- Table 34: North America Compression Therapy Market Revenue (US$ Mn) Comparison by Distribution Channel (2016-2032)
- Table 35: North America Compression Therapy Market Revenue (US$ Mn) Comparison by Technology (2016-2032)
- Table 36: North America Compression Therapy Market Revenue (US$ Mn) Comparison by Application (2016-2032)
- Table 37: North America Compression Therapy Market Revenue (US$ Mn) Comparison by End User (2016-2032)
- Table 38: North America Compression Therapy Market Y-o-Y Growth Rate Comparison by Country (2016-2032)
- Table 39: North America Compression Therapy Market Y-o-Y Growth Rate Comparison by Product Type (2016-2032)
- Table 40: North America Compression Therapy Market Y-o-Y Growth Rate Comparison by Distribution Channel (2016-2032)
- Table 41: North America Compression Therapy Market Y-o-Y Growth Rate Comparison by Technology (2016-2032)
- Table 42: North America Compression Therapy Market Y-o-Y Growth Rate Comparison by Application (2016-2032)
- Table 43: North America Compression Therapy Market Y-o-Y Growth Rate Comparison by End User (2016-2032)
- Table 44: North America Compression Therapy Market Share Comparison by Country (2016-2032)
- Table 45: North America Compression Therapy Market Share Comparison by Product Type (2016-2032)
- Table 46: North America Compression Therapy Market Share Comparison by Distribution Channel (2016-2032)
- Table 47: North America Compression Therapy Market Share Comparison by Technology (2016-2032)
- Table 48: North America Compression Therapy Market Share Comparison by Application (2016-2032)
- Table 49: North America Compression Therapy Market Share Comparison by End User (2016-2032)
- Table 50: Western Europe Compression Therapy Market Comparison by Product Type (2016-2032)
- Table 51: Western Europe Compression Therapy Market Comparison by Distribution Channel (2016-2032)
- Table 52: Western Europe Compression Therapy Market Comparison by Technology (2016-2032)
- Table 53: Western Europe Compression Therapy Market Comparison by Application (2016-2032)
- Table 54: Western Europe Compression Therapy Market Comparison by End User (2016-2032)
- Table 55: Western Europe Compression Therapy Market Revenue (US$ Mn) Comparison by Country (2016-2032)
- Table 56: Western Europe Compression Therapy Market Revenue (US$ Mn) (2016-2032)
- Table 57: Western Europe Compression Therapy Market Revenue (US$ Mn) Comparison by Country (2016-2032)
- Table 58: Western Europe Compression Therapy Market Revenue (US$ Mn) Comparison by Product Type (2016-2032)
- Table 59: Western Europe Compression Therapy Market Revenue (US$ Mn) Comparison by Distribution Channel (2016-2032)
- Table 60: Western Europe Compression Therapy Market Revenue (US$ Mn) Comparison by Technology (2016-2032)
- Table 61: Western Europe Compression Therapy Market Revenue (US$ Mn) Comparison by Application (2016-2032)
- Table 62: Western Europe Compression Therapy Market Revenue (US$ Mn) Comparison by End User (2016-2032)
- Table 63: Western Europe Compression Therapy Market Y-o-Y Growth Rate Comparison by Country (2016-2032)
- Table 64: Western Europe Compression Therapy Market Y-o-Y Growth Rate Comparison by Product Type (2016-2032)
- Table 65: Western Europe Compression Therapy Market Y-o-Y Growth Rate Comparison by Distribution Channel (2016-2032)
- Table 66: Western Europe Compression Therapy Market Y-o-Y Growth Rate Comparison by Technology (2016-2032)
- Table 67: Western Europe Compression Therapy Market Y-o-Y Growth Rate Comparison by Application (2016-2032)
- Table 68: Western Europe Compression Therapy Market Y-o-Y Growth Rate Comparison by End User (2016-2032)
- Table 69: Western Europe Compression Therapy Market Share Comparison by Country (2016-2032)
- Table 70: Western Europe Compression Therapy Market Share Comparison by Product Type (2016-2032)
- Table 71: Western Europe Compression Therapy Market Share Comparison by Distribution Channel (2016-2032)
- Table 72: Western Europe Compression Therapy Market Share Comparison by Technology (2016-2032)
- Table 73: Western Europe Compression Therapy Market Share Comparison by Application (2016-2032)
- Table 74: Western Europe Compression Therapy Market Share Comparison by End User (2016-2032)
- Table 75: Eastern Europe Compression Therapy Market Comparison by Product Type (2016-2032)
- Table 76: Eastern Europe Compression Therapy Market Comparison by Distribution Channel (2016-2032)
- Table 77: Eastern Europe Compression Therapy Market Comparison by Technology (2016-2032)
- Table 78: Eastern Europe Compression Therapy Market Comparison by Application (2016-2032)
- Table 79: Eastern Europe Compression Therapy Market Comparison by End User (2016-2032)
- Table 80: Eastern Europe Compression Therapy Market Revenue (US$ Mn) Comparison by Country (2016-2032)
- Table 81: Eastern Europe Compression Therapy Market Revenue (US$ Mn) (2016-2032)
- Table 82: Eastern Europe Compression Therapy Market Revenue (US$ Mn) Comparison by Country (2016-2032)
- Table 83: Eastern Europe Compression Therapy Market Revenue (US$ Mn) Comparison by Product Type (2016-2032)
- Table 84: Eastern Europe Compression Therapy Market Revenue (US$ Mn) Comparison by Distribution Channel (2016-2032)
- Table 85: Eastern Europe Compression Therapy Market Revenue (US$ Mn) Comparison by Technology (2016-2032)
- Table 86: Eastern Europe Compression Therapy Market Revenue (US$ Mn) Comparison by Application (2016-2032)
- Table 87: Eastern Europe Compression Therapy Market Revenue (US$ Mn) Comparison by End User (2016-2032)
- Table 88: Eastern Europe Compression Therapy Market Y-o-Y Growth Rate Comparison by Country (2016-2032)
- Table 89: Eastern Europe Compression Therapy Market Y-o-Y Growth Rate Comparison by Product Type (2016-2032)
- Table 90: Eastern Europe Compression Therapy Market Y-o-Y Growth Rate Comparison by Distribution Channel (2016-2032)
- Table 91: Eastern Europe Compression Therapy Market Y-o-Y Growth Rate Comparison by Technology (2016-2032)
- Table 92: Eastern Europe Compression Therapy Market Y-o-Y Growth Rate Comparison by Application (2016-2032)
- Table 93: Eastern Europe Compression Therapy Market Y-o-Y Growth Rate Comparison by End User (2016-2032)
- Table 94: Eastern Europe Compression Therapy Market Share Comparison by Country (2016-2032)
- Table 95: Eastern Europe Compression Therapy Market Share Comparison by Product Type (2016-2032)
- Table 96: Eastern Europe Compression Therapy Market Share Comparison by Distribution Channel (2016-2032)
- Table 97: Eastern Europe Compression Therapy Market Share Comparison by Technology (2016-2032)
- Table 98: Eastern Europe Compression Therapy Market Share Comparison by Application (2016-2032)
- Table 99: Eastern Europe Compression Therapy Market Share Comparison by End User (2016-2032)
- Table 100: APAC Compression Therapy Market Comparison by Product Type (2016-2032)
- Table 101: APAC Compression Therapy Market Comparison by Distribution Channel (2016-2032)
- Table 102: APAC Compression Therapy Market Comparison by Technology (2016-2032)
- Table 103: APAC Compression Therapy Market Comparison by Application (2016-2032)
- Table 104: APAC Compression Therapy Market Comparison by End User (2016-2032)
- Table 105: APAC Compression Therapy Market Revenue (US$ Mn) Comparison by Country (2016-2032)
- Table 106: APAC Compression Therapy Market Revenue (US$ Mn) (2016-2032)
- Table 107: APAC Compression Therapy Market Revenue (US$ Mn) Comparison by Country (2016-2032)
- Table 108: APAC Compression Therapy Market Revenue (US$ Mn) Comparison by Product Type (2016-2032)
- Table 109: APAC Compression Therapy Market Revenue (US$ Mn) Comparison by Distribution Channel (2016-2032)
- Table 110: APAC Compression Therapy Market Revenue (US$ Mn) Comparison by Technology (2016-2032)
- Table 111: APAC Compression Therapy Market Revenue (US$ Mn) Comparison by Application (2016-2032)
- Table 112: APAC Compression Therapy Market Revenue (US$ Mn) Comparison by End User (2016-2032)
- Table 113: APAC Compression Therapy Market Y-o-Y Growth Rate Comparison by Country (2016-2032)
- Table 114: APAC Compression Therapy Market Y-o-Y Growth Rate Comparison by Product Type (2016-2032)
- Table 115: APAC Compression Therapy Market Y-o-Y Growth Rate Comparison by Distribution Channel (2016-2032)
- Table 116: APAC Compression Therapy Market Y-o-Y Growth Rate Comparison by Technology (2016-2032)
- Table 117: APAC Compression Therapy Market Y-o-Y Growth Rate Comparison by Application (2016-2032)
- Table 118: APAC Compression Therapy Market Y-o-Y Growth Rate Comparison by End User (2016-2032)
- Table 119: APAC Compression Therapy Market Share Comparison by Country (2016-2032)
- Table 120: APAC Compression Therapy Market Share Comparison by Product Type (2016-2032)
- Table 121: APAC Compression Therapy Market Share Comparison by Distribution Channel (2016-2032)
- Table 122: APAC Compression Therapy Market Share Comparison by Technology (2016-2032)
- Table 123: APAC Compression Therapy Market Share Comparison by Application (2016-2032)
- Table 124: APAC Compression Therapy Market Share Comparison by End User (2016-2032)
- Table 125: Latin America Compression Therapy Market Comparison by Product Type (2016-2032)
- Table 126: Latin America Compression Therapy Market Comparison by Distribution Channel (2016-2032)
- Table 127: Latin America Compression Therapy Market Comparison by Technology (2016-2032)
- Table 128: Latin America Compression Therapy Market Comparison by Application (2016-2032)
- Table 129: Latin America Compression Therapy Market Comparison by End User (2016-2032)
- Table 130: Latin America Compression Therapy Market Revenue (US$ Mn) Comparison by Country (2016-2032)
- Table 131: Latin America Compression Therapy Market Revenue (US$ Mn) (2016-2032)
- Table 132: Latin America Compression Therapy Market Revenue (US$ Mn) Comparison by Country (2016-2032)
- Table 133: Latin America Compression Therapy Market Revenue (US$ Mn) Comparison by Product Type (2016-2032)
- Table 134: Latin America Compression Therapy Market Revenue (US$ Mn) Comparison by Distribution Channel (2016-2032)
- Table 135: Latin America Compression Therapy Market Revenue (US$ Mn) Comparison by Technology (2016-2032)
- Table 136: Latin America Compression Therapy Market Revenue (US$ Mn) Comparison by Application (2016-2032)
- Table 137: Latin America Compression Therapy Market Revenue (US$ Mn) Comparison by End User (2016-2032)
- Table 138: Latin America Compression Therapy Market Y-o-Y Growth Rate Comparison by Country (2016-2032)
- Table 139: Latin America Compression Therapy Market Y-o-Y Growth Rate Comparison by Product Type (2016-2032)
- Table 140: Latin America Compression Therapy Market Y-o-Y Growth Rate Comparison by Distribution Channel (2016-2032)
- Table 141: Latin America Compression Therapy Market Y-o-Y Growth Rate Comparison by Technology (2016-2032)
- Table 142: Latin America Compression Therapy Market Y-o-Y Growth Rate Comparison by Application (2016-2032)
- Table 143: Latin America Compression Therapy Market Y-o-Y Growth Rate Comparison by End User (2016-2032)
- Table 144: Latin America Compression Therapy Market Share Comparison by Country (2016-2032)
- Table 145: Latin America Compression Therapy Market Share Comparison by Product Type (2016-2032)
- Table 146: Latin America Compression Therapy Market Share Comparison by Distribution Channel (2016-2032)
- Table 147: Latin America Compression Therapy Market Share Comparison by Technology (2016-2032)
- Table 148: Latin America Compression Therapy Market Share Comparison by Application (2016-2032)
- Table 149: Latin America Compression Therapy Market Share Comparison by End User (2016-2032)
- Table 150: Middle East & Africa Compression Therapy Market Comparison by Product Type (2016-2032)
- Table 151: Middle East & Africa Compression Therapy Market Comparison by Distribution Channel (2016-2032)
- Table 152: Middle East & Africa Compression Therapy Market Comparison by Technology (2016-2032)
- Table 153: Middle East & Africa Compression Therapy Market Comparison by Application (2016-2032)
- Table 154: Middle East & Africa Compression Therapy Market Comparison by End User (2016-2032)
- Table 155: Middle East & Africa Compression Therapy Market Revenue (US$ Mn) Comparison by Country (2016-2032)
- Table 156: Middle East & Africa Compression Therapy Market Revenue (US$ Mn) (2016-2032)
- Table 157: Middle East & Africa Compression Therapy Market Revenue (US$ Mn) Comparison by Country (2016-2032)
- Table 158: Middle East & Africa Compression Therapy Market Revenue (US$ Mn) Comparison by Product Type (2016-2032)
- Table 159: Middle East & Africa Compression Therapy Market Revenue (US$ Mn) Comparison by Distribution Channel (2016-2032)
- Table 160: Middle East & Africa Compression Therapy Market Revenue (US$ Mn) Comparison by Technology (2016-2032)
- Table 161: Middle East & Africa Compression Therapy Market Revenue (US$ Mn) Comparison by Application (2016-2032)
- Table 162: Middle East & Africa Compression Therapy Market Revenue (US$ Mn) Comparison by End User (2016-2032)
- Table 163: Middle East & Africa Compression Therapy Market Y-o-Y Growth Rate Comparison by Country (2016-2032)
- Table 164: Middle East & Africa Compression Therapy Market Y-o-Y Growth Rate Comparison by Product Type (2016-2032)
- Table 165: Middle East & Africa Compression Therapy Market Y-o-Y Growth Rate Comparison by Distribution Channel (2016-2032)
- Table 166: Middle East & Africa Compression Therapy Market Y-o-Y Growth Rate Comparison by Technology (2016-2032)
- Table 167: Middle East & Africa Compression Therapy Market Y-o-Y Growth Rate Comparison by Application (2016-2032)
- Table 168: Middle East & Africa Compression Therapy Market Y-o-Y Growth Rate Comparison by End User (2016-2032)
- Table 169: Middle East & Africa Compression Therapy Market Share Comparison by Country (2016-2032)
- Table 170: Middle East & Africa Compression Therapy Market Share Comparison by Product Type (2016-2032)
- Table 171: Middle East & Africa Compression Therapy Market Share Comparison by Distribution Channel (2016-2032)
- Table 172: Middle East & Africa Compression Therapy Market Share Comparison by Technology (2016-2032)
- Table 173: Middle East & Africa Compression Therapy Market Share Comparison by Application (2016-2032)
- Table 174: Middle East & Africa Compression Therapy Market Share Comparison by End User (2016-2032)
- 1. Executive Summary
-
- 3M Company
- Medtronic plc
- Smith & Nephew plc
- Spectrum Healthcare
- SIGVARIS
- Bio Compression Systems, Inc.
- Cardinal Health
- Julius Zorn GmbH
- Hartmann AG
- Medi GmbH & Co.
- BSN Medical GmbH
- ArjoHuntleigh
- Stryker
- Gottfried Medical
- Convatec Group PLC
- Juzo
- Paul Hartmann AG
- Tactile Medical
Our Clients


View Our Licence Options
