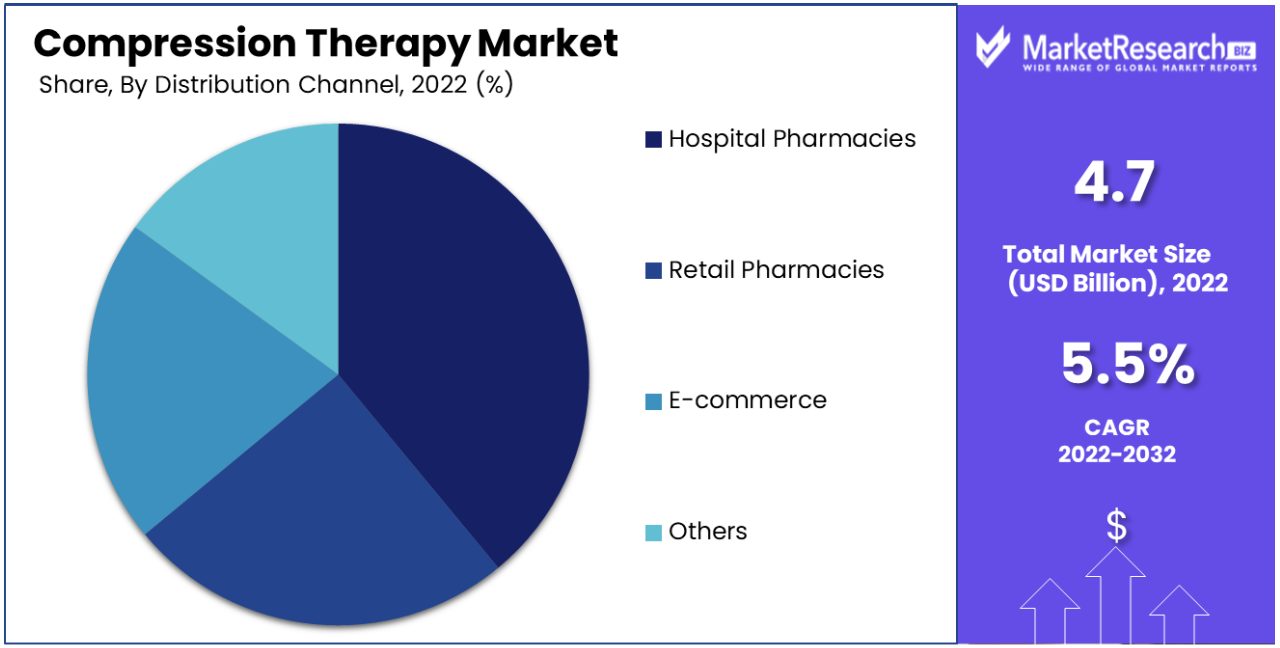
Compression Therapy Market By Technique (Static Compression Therapy, Dynamic Compression Therapy), By Product (Compression Pumps, Compression Stockings, Compression Bandages), By Application (Varicose Vein Treatment, Deep Vein Thrombosis Treatment, Lymphedema Treatment, Others), By Region And Companies - Industry Segment Outlook, Market Assessment, Competition Scenario, Trends, And Forecast 2023-2032
3338
May 2023
165
Report Overview
Compression Therapy Market size is expected to be worth around USD 7.9 Bn by 2032 from USD 4.7 Bn in 2022, growing at a CAGR of 5.5% during the forecast period from 2023 to 2032.
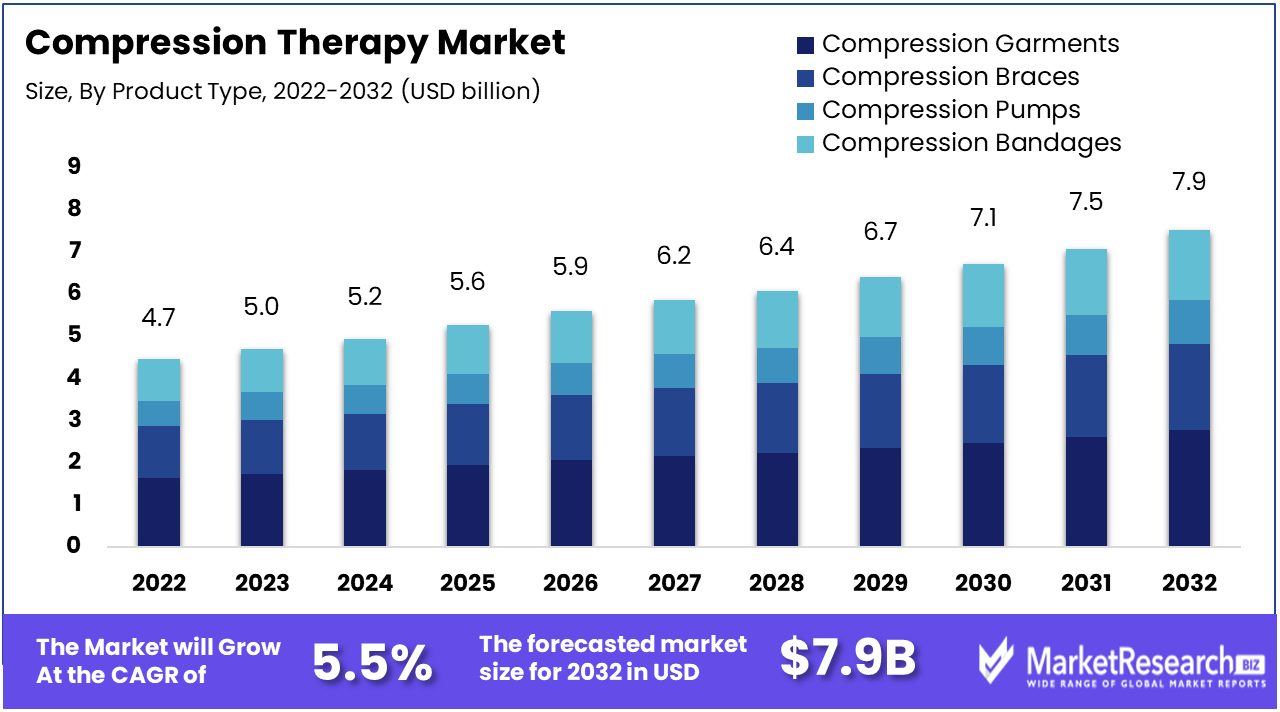
The Compression Therapy market is a burgeoning industry that has undergone significant development in recent years. Compression Therapy entails applying pressure to a body part in order to improve blood circulation, cure injuries, reduce swelling, and alleviate discomfort. Companies have incorporated this technology into their products/services, bringing it to the mainstream market.
The Compression Therapy market report offers a comprehensive analysis of the industry, highlighting key innovations, significant investments, and growth opportunities. The report also examines the industries that have adopted Compression Therapy and the market growth drivers for this treatment.
Compression Therapy is a technique used by medical practitioners to enhance blood circulation, reduce edema, and promote healing. Utilizing compression garments or devices, this method entails applying pressure to a specific body part. Compression Therapy has been utilized to treat a variety of conditions, including lymphedema, deep vein thrombosis, and sports injuries.
Compression Therapy aims to increase blood circulation, decrease edema, and promote healing. Additionally, it can prevent blood clots and edema in the legs, especially during prolonged reclining or standing. Compression Therapy is attainable through compression stockings, pneumatic compression, and static compression.
Compression Therapy is a prevalent treatment in both medical and non-medical settings due to its many advantages. These advantages include enhanced blood circulation, decreased edema, a decreased risk of blood clotting, and overall pain relief. Chronic conditions, such as lymphedema and varicose veins, can also be treated with Compression Therapy.
The Compression Therapy market has witnessed numerous innovations, including the introduction of novel compression garments and devices. These innovations have increased the accessibility, convenience, and comfort of Compression Therapy for patients.
Driving factors
Multiple Factors Driven by a Market's Expansion
Several factors contribute to the growth of Compression Therapy Market. Significant contributors to mortality and disability, sports injuries and automobile accidents are propelling the market forward. An astounding 8.6 million sports injuries occur annually in the United States, increasing the demand for compression therapy products that aid in healing and promote recovery.
Enhanced Global Participation and Awareness
Increasing global participation in sports and fitness activities has contributed to the development of compression therapy. This increase in participation has increased awareness of the significance of sports injury prevention and management, leading to a preference for at-home care and self-treatment alternatives. Innovations in technology and materials have increased the market's accessibility and efficacy, thereby expanding its scope.
Impact of Regulation and Quality Considerations
Regulatory modifications concerning product safety and efficacy may have a substantial impact on the compression therapy market. As more people rely on these products, regulatory bodies may impose stricter testing and approval standards. As a result, products will encounter increased scrutiny and cost increases. However, this could result in higher-quality products, nurturing consumer confidence.
Innovative Technologies and Customization
Wearables and smart fabrics, among other emerging technologies, have the potential to revolutionize the compression therapy market. These developments provide novel methods for monitoring and treating sports injuries. In addition, they enable the development of personalized compression therapy products tailored to the specific needs and requirements of each patient, heralding in a new era of targeted care.
Transforming the Competitive Landscape
Compression Therapy Market could be disrupted by new entrants armed with innovative products or business models. These disruptors have the ability to compete with incumbents and cause a substantial shift in market share. To remain competitive, businesses in the compression therapy industry must closely monitor emergent trends, remain flexible, and cultivate a culture of innovation.
Promising Future Amidst Challenges
In conclusion, the compression therapy market is poised for growth, propelled by the rising volume of sports injuries, changing consumer behavior that favors self-treatment, and technological advancements. To maintain a dominant position in this intensely competitive market, however, businesses must navigate potential regulatory changes and anticipate disruptive forces.
Restraining Factors
Non-Compliance with Compression Products
In recent years, there has been a heightened awareness of the benefits of compression therapy for treating a variety of health conditions, including ulcers, lymphedema, and venous diseases. Compression therapy is the application of compression garments and hosiery to reduce swelling, pain, and inflammation by applying pressure to the afflicted area. However, patient noncompliance with these compression products remains a prevalent problem.
Long-Term Preventive Treatments
It is a well-known fact that the compliance rate of patients declines over time, particularly for long-term preventive treatments. It may be difficult for patients to observe their healthcare provider's instructions and adhere to the prescribed treatment regimen. Therefore, noncompliance may result in negative health outcomes and even exacerbate the patient's condition.
Compression Therapy
Compression therapy is a clinically proven treatment method used to treat a variety of conditions, including ulcers. Compression garments and stockings improve blood flow, reduce inflammation, and prevent fluid accumulation by applying pressure to afflicted areas. However, patients may find these products uncomfortable and unattractive, resulting in noncompliance with the prescribed treatment plan.
Compression Garments
Compression garments may cause discomfort and skin injury by causing pain, edema, and skin irritation. These adverse effects may reduce patient compliance, resulting in suboptimal treatment outcomes. To increase patient compliance with compression therapy, it is essential to resolve these issues.
Individualized Treatment Plans
Compression therapy compliance can be substantially improved by individualized treatment regimens. To increase adherence to the treatment regimen, healthcare providers can tailor the treatment regimen to the patient's specific requirements, preferences, and lifestyle. In addition, healthcare professionals can educate patients on the benefits of compression therapy, its adverse effects, and how to manage them, thereby increasing compliance.
New Technologies and Materials
Many new technologies and materials have been developed in recent years to resolve the diverse issues associated with compression products. Some manufacturers, for instance, have introduced long-wearing compression garments made from breathable and lightweight materials. In addition, some companies have created compression products with innovative fastening systems to reduce skin irritation and enhance comfort.
Product Analysis
Compression bandages Segment dominates Compression Therapy market. Compression therapy is the use of a compression garment to exert pressure on a body part to improve blood flow and promote healing. Compression Therapy Market is composed of a wide range of products, including compression stockings, compression bandages, and medical pumps. However, the compression bandages segment dominates this market due to its benefits and ease of use. Compression bandages are typically made of a stretchy material that exerts pressure on the affected area and can be adjusted to fit the individual's needs.
The consumer trend and behavior towards compression bandages segment show a high degree of satisfaction and loyalty in the product. This is mainly due to the relief they provide to individuals suffering from a wide range of medical conditions. For instance, people with venous insufficiency use compression bandages to improve blood flow and reduce swelling in their legs. Athletes also wear compression bandages to reduce muscle fatigue and enhance recovery. Compression bandages are used in wound care and can improve healing times for injuries. All of these benefits have contributed to the high demand for compression bandages in the market.
Application Analysis
Varicose Vein Treatment Segment Dominates Compression Therapy Market. Varicose vein treatment is one of the most common applications of compression therapy, and it dominates the market due to the high prevalence of varicose veins. Varicose veins are enlarged and twisted veins, which occur due to weakened valves that allow blood to flow back into the vein. Compression therapy helps to improve blood flow in the veins and reduce swelling, providing relief to people who suffer from this condition.
The consumer trend and behavior towards varicose vein treatment segment is on the rise due to increased awareness of varicose veins. People are becoming more educated about the condition and seeking treatment early, which has resulted in the growth of the varicose vein treatment market. Patients are also looking for more effective and convenient treatments, which has fueled the development of new compression therapy products. The varicose vein treatment segment in the compression therapy market is anticipated to register a faster growth rate over the coming years.
Key Market Segments
By Technique
- Static Compression Therapy
- Dynamic Compression Therapy
By Product
- Compression Pumps
- Compression Stockings
- Compression Bandages
- Compression Tapes
By Application
- Varicose Vein Treatment
- Deep Vein Thrombosis Treatment
- Lymphedema Treatment
- Leg Ulcer Treatment
- Others
Growth Opportunity
Prevalence of Venous Disorders and Inactivity
The prevalence of venous disorders, such as deep vein thrombosis and varicose veins, is increasing, primarily as a result of our sedentary lifestyles and lengthy hospital stays. This presents a substantial growth opportunity for the compression therapy market.
Relieving Edema and Hypertension
Compression therapy products serve an essential function in reducing edema, reflux, and arterial hypertension. If left untreated, these conditions can lead to more significant health complications. As these products effectively address these issues, Compression Therapy Market products is growing rapidly.
Orthopedic Interventions and Obesity
Accidents and the rising prevalence of obesity are contributing to an increase in the demand for compression therapy garments during the recovery phase of orthopedic procedures. Compression therapy aides in the alleviation of pain, reduction of swelling, and acceleration of recuperation, making it an essential component of orthopedic care.
Population of Seniors and Varicose Veins
Varicose veins are especially prevalent among the elderly population. The demand for compression therapy products to manage and treat varicose veins is anticipated to increase significantly as this demographic continues to expand.
Orthopedic Operations and Recuperation
Compression therapy is acquiring popularity in orthopedic surgery because it alleviates pain, reduces edema, and expedites recovery. The increasing importance of compression garments in orthopedics presents an opportunity for the market to expand.
Medical Science and Muscle Health
Compression garments are widely used in sports medicine to prevent inflammation and promote muscle health. Athletes and fitness devotees favor these garments, driving demand for compression therapy products and creating lucrative market growth opportunities.
Utilizing Unmet Needs
As the prevalence of medical conditions requiring compression therapy rises, so does the demand for innovative products that effectively meet these requirements. Companies capable of developing and delivering such solutions have the potential to capitalize on unmet patient and healthcare provider requirements.
Latest Trends
Increasing Use of Compression Products
In recent years, there has been an increase in the demand for compression hosiery and dressings due to the prevalence of venous leg ulcers and lymphedema. The adoption of compression products has been influenced by the growing awareness of compression therapy's benefits. Compression stockings and bandages have demonstrated efficacy in alleviating symptoms, preventing recurrence, and enhancing the quality of life of patients.
In addition, the increase in the elderly population has contributed to the expansion of the compression therapy market. Older adults are more likely to develop venous leg ulcers and lymphedema, making them a key target market for compression products.
Strategic Investments in Expanding Treatment Options by Key Players
Major market participants in compression therapy are investing strategically in expanding treatment options. Companies are investing in research and development to create innovative compression products that can speed up the healing process and increase patient comfort. In addition, manufacturers are collaborating with healthcare professionals to develop individualized compression solutions for patients.
New compression technologies with enhanced fit, wearability, and efficacy are being developed and introduced to the market. Some companies, for instance, are developing compression garments with silver ions to inhibit bacterial development and promote skin health.
Tendencies in the Compression Therapy Market
The compression therapy industry is experiencing several market-shifting trends. In compression therapy, the increasing use of mobile technology is one of the most significant trends. To make it simpler for patients to monitor and manage their compression therapy, mobile applications are being developed. These applications allow patients to monitor wearing time, set reminders for garment changes, and receive notifications for symptom changes.
Another market trend is the shift toward at-home compression therapy. Patients choose self-care options that allow them to manage their condition from the convenience of their own homes. Compression products designed for domestic use, such as self-bandaging systems and compression hosiery with simple donning features, are becoming increasingly available on the market.
Regional Analysis
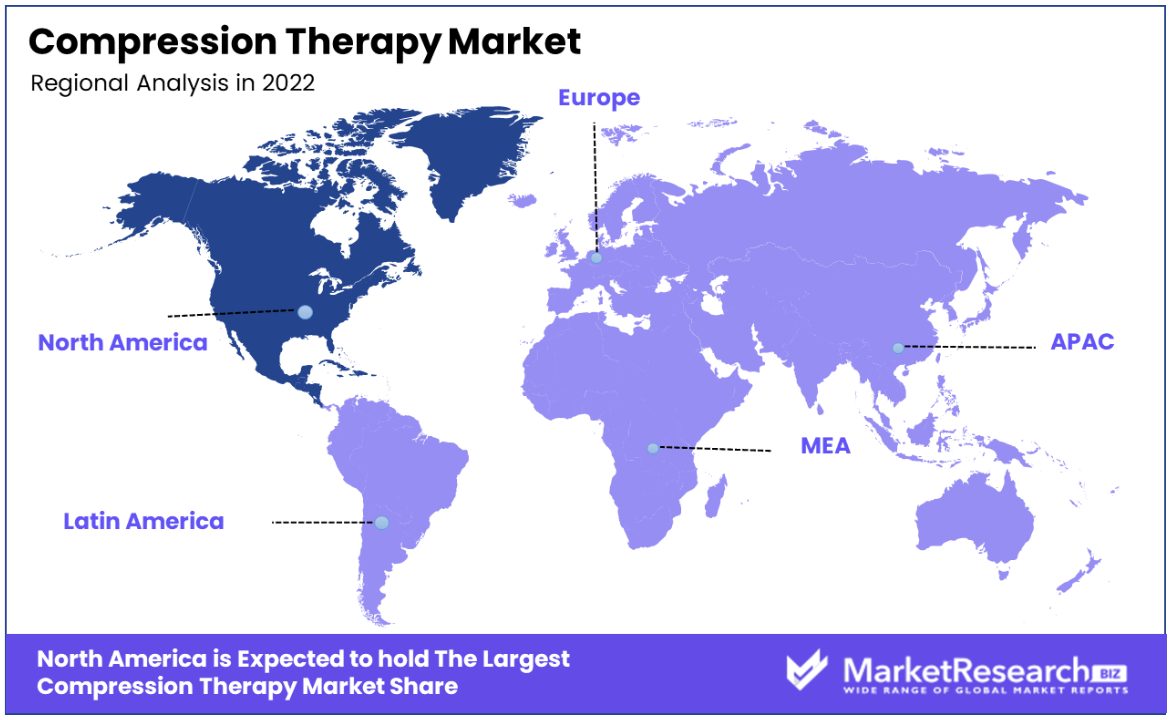
North America will hold the lion's share of the global market. As the global economy develops, distinct markets tend to emerge in various regions. In 2022, North America will hold an enormous 43.0% share of the global market, which it currently controls. This demonstrates the region's robustness and dynamism in their various industries to dominate the market.
North America consists of the United States, Canada, and Mexico. These nations represent the dominant economies on the continent and have been competitive in numerous global industries. The North American region is a global market leader due to its advanced healthcare systems, educational institutions, technology, and infrastructure.
Advanced healthcare systems are one of the major contributors to North America's dominant share of the global market. Due to substantial investments in research and development, cutting-edge technology, and best medical practices, the region's healthcare infrastructure is highly developed.
In addition, North American educational institutions are among the finest in the world, with the United States being the leader in postsecondary education. The education system has made significant contributions to the region's innovation, excellence, and creativity in numerous disciplines, especially science and technology. For example, the United States has some of the finest research facilities that conduct cutting-edge research in disciplines such as biotechnology, information technology, and aerospace technology.
Additionally, the region has a robust and sophisticated technological infrastructure, especially in the United States. This infrastructure has placed the nation at the forefront of the information technology, aerospace, and biotechnology industries. Numerous technological companies such as Google, Apple Inc., and Facebook operate within the borders of the United States, positively impacting both the regional and global economies.
Additionally, the North American region has abundant natural resources that are indispensable to numerous industries. Canada, for example, is renowned for its abundance of natural resources, including minerals, natural gas, and oil, to mention a few. It has an abundance of natural resources, which offers a variety of opportunities in numerous industries that require them, thereby positively impacting the economy.
Key Regions and Countries
North America
- US
- Canada
- Mexico
Western Europe
- Germany
- France
- The UK
- Spain
- Italy
- Portugal
- Ireland
- Austria
- Switzerland
- Benelux
- Nordic
- Rest of Western Europe
Eastern Europe
- Russia
- Poland
- The Czech Republic
- Greece
- Rest of Eastern Europe
APAC
- China
- Japan
- South Korea
- India
- Australia & New Zealand
- Indonesia
- Malaysia
- Philippines
- Singapore
- Thailand
- Vietnam
- Rest of APAC
Latin America
- Brazil
- Colombia
- Chile
- Argentina
- Costa Rica
- Rest of Latin America
Middle East & Africa
- Algeria
- Egypt
- Israel
- Kuwait
- Nigeria
- Saudi Arabia
- South Africa
- Turkey
- United Arab Emirates
- Rest of MEA
Key Players Analysis
Compression therapy is a treatment technique that uses stockings to increase blood flow in the legs and extremities. This method aids in the prevention of blood clotting, the reduction of edema, and the improvement of overall blood circulation. In recent years, the compression therapy market has experienced significant growth, which is anticipated to continue in the future years.
3M Company, Medtronic Plc, BSN Medical GmbH, Sigvaris, Inc., medi GmbH & Co. KG, Tactile Medical, ArjoHuntleigh AB, Therafirm, ConvaTec Group Plc, and Julius Zorn GmbH are the key players in the compression therapy market. These market participants have been developing new and innovative compression therapy products to satisfy the market's growing demand.
The 3M Company is one of the market leaders in compression therapy. The company offers an extensive selection of compression stockings that are designed to offer the highest level of comfort and support. Another market participant that offers compression therapy products, such as pneumatic compression devices and stockings, is Medtronic Plc.
BSN Medical GmbH is a well-established participant in the compression therapy market, offering a variety of high-quality products that effectively alleviate a variety of conditions. Sigvaris, Inc. specializes in the production of compression stockings and is recognized for its innovative designs.
Medi GmbH & Co. KG provides a variety of compression therapy products, such as hosiery, dressings, and sleeves. Tactile Medical is an innovator in the treatment of venous insufficiency and lymphedema. Patients with venous ulcers can purchase compression therapy devices and garments from ArjoHuntleigh AB.
Therafirm offers a variety of compression garments and stockings for athletes, expectant women, and the elderly. ConvaTec Group Plc is well-known for its innovative wound care, ostomy care, and continence care products. Julius Zorn GmbH is an industry leader in the production of compression hosiery, dressings, and sleeves.
Top Key Players in Compression Therapy Market
- BSN medical
- Medi GmbH & Co. KG
- Julius Zorn GmbH
- Sigvaris
- Paul Hartmann AG
- 3M Health Care
- Gottfried Medical, Inc.
- Bio Compression Systems, Inc.
- ArjoHuntleigh
- Spectrum Healthcare, Inc.
Recent Development
In 2022, FDA Approval for Boston Scientific VICI Venous Stent System. The VICI Venous Stent System supports venous reflux disease-related leg vein collapse. The technology allows doctors to do minimally invasive vascular surgery.
In 2021, 3M Acquires Acelity and KCI Subsidiaries, Strengthening Wound Care and Surgical Portfolio. 3M can continue to offer novel wound care and surgical solutions to healthcare professionals with this purchase. Acelity's subsidiary KCI specializes in advanced wound treatment.
In 2020, Smith & Nephew Acquires Integra LifeSciences' Extremity Orthopedics Business, Expanding Foot and Ankle Surgery Orthopedics. Smith & Nephew can provide more orthopedic options after the purchase. Integra LifeSciences' extremities orthopedics division provides foot and ankle implants and fixation devices.
Report Scope:
Report Features Description Market Value (2022) USD 4.7 Bn Forecast Revenue (2032) USD 7.9 Bn CAGR (2023-2032) 5.5% Base Year for Estimation 2022 Historic Period 2016-2022 Forecast Period 2023-2032 Report Coverage Revenue Forecast, Market Dynamics, COVID-19 Impact, Competitive Landscape, Recent Developments Segments Covered By Technique (Static Compression Therapy, Dynamic Compression Therapy)
By Product (Compression Pumps, Compression Stockings, Compression Bandages, Compression Tapes)
By Application (Varicose Vein Treatment, Deep Vein Thrombosis Treatment, Lymphedema Treatment, Leg Ulcer Treatment, Others)Regional Analysis North America – The US, Canada, & Mexico; Western Europe – Germany, France, The UK, Spain, Italy, Portugal, Ireland, Austria, Switzerland, Benelux, Nordic, & Rest of Western Europe; Eastern Europe – Russia, Poland, The Czech Republic, Greece, & Rest of Eastern Europe; APAC – China, Japan, South Korea, India, Australia & New Zealand, Indonesia, Malaysia, Philippines, Singapore, Thailand, Vietnam, & Rest of APAC; Latin America – Brazil, Colombia, Chile, Argentina, Costa Rica, & Rest of Latin America; Middle East & Africa – Algeria, Egypt, Israel, Kuwait, Nigeria, Saudi Arabia, South Africa, Turkey, United Arab Emirates, & Rest of MEA Competitive Landscape BSN medical, Medi GmbH & Co. KG, Julius Zorn GmbH, Sigvaris, Paul Hartmann AG, 3M Health Care, Gottfried Medical, Inc., Bio Compression Systems, Inc., ArjoHuntleigh, Spectrum Healthcare, Inc. Customization Scope Customization for segments, region/country-level will be provided. Moreover, additional customization can be done based on the requirements. Purchase Options We have three licenses to opt for: Single User License, Multi-User License (Up to 5 Users), Corporate Use License (Unlimited User and Printable PDF) - BSN medical
- Medi GmbH & Co. KG
- Julius Zorn GmbH
- Sigvaris
- Paul Hartmann AG
- 3M Health Care
- Gottfried Medical, Inc.
- Bio Compression Systems, Inc.
- ArjoHuntleigh
- Spectrum Healthcare, Inc.
- 1. Executive Summary
- 1.1. Definition
- 1.2. Taxonomy
- 1.3. Research Scope
- 1.4. Key Analysis
- 1.5. Key Findings by Major Segments
- 1.6. Top strategies by Major Players
- 2. Global Compression Therapy Market Overview
- 2.1. Compression Therapy Market Dynamics
- 2.1.1. Drivers
- 2.1.2. Opportunities
- 2.1.3. Restraints
- 2.1.4. Challenges
- 2.2. Macro-economic Factors
- 2.3. Regulatory Framework
- 2.4. Market Investment Feasibility Index
- 2.5. PEST Analysis
- 2.6. PORTER’S Five Force Analysis
- 2.7. Drivers & Restraints Impact Analysis
- 2.8. Industry Chain Analysis
- 2.9. Cost Structure Analysis
- 2.10. Marketing Strategy
- 2.11. Russia-Ukraine War Impact Analysis
- 2.12. Opportunity Map Analysis
- 2.13. Market Competition Scenario Analysis
- 2.14. Product Life Cycle Analysis
- 2.15. Opportunity Orbits
- 2.16. Manufacturer Intensity Map
- 2.17. Major Companies sales by Value & Volume
- 2.1. Compression Therapy Market Dynamics
- 3. Global Compression Therapy Market Analysis, Opportunity and Forecast, 2016-2032
- 3.1. Global Compression Therapy Market Analysis, 2016-2021
- 3.2. Global Compression Therapy Market Opportunity and Forecast, 2023-2032
- 3.3. Global Compression Therapy Market Analysis, Opportunity and Forecast, By By Technique, 2016-2032
- 3.3.1. Global Compression Therapy Market Analysis by By Technique: Introduction
- 3.3.2. Market Size Absolute $ Opportunity Analysis and Forecast, By By Technique, 2016-2032
- 3.3.3. Static Compression Therapy
- 3.3.4. Dynamic Compression Therapy
- 3.4. Global Compression Therapy Market Analysis, Opportunity and Forecast, By By Product, 2016-2032
- 3.4.1. Global Compression Therapy Market Analysis by By Product: Introduction
- 3.4.2. Market Size Absolute $ Opportunity Analysis and Forecast, By By Product, 2016-2032
- 3.4.3. Compression Pumps
- 3.4.4. Compression Stockings
- 3.4.5. Compression Bandages
- 3.4.6. Compression Tapes
- 3.5. Global Compression Therapy Market Analysis, Opportunity and Forecast, By By Application, 2016-2032
- 3.5.1. Global Compression Therapy Market Analysis by By Application: Introduction
- 3.5.2. Market Size Absolute $ Opportunity Analysis and Forecast, By By Application, 2016-2032
- 3.5.3. Varicose Vein Treatment
- 3.5.4. Deep Vein Thrombosis Treatment
- 3.5.5. Lymphedema Treatment
- 3.5.6. Leg Ulcer Treatment
- 3.5.7. Others
- 4. North America Compression Therapy Market Analysis, Opportunity and Forecast, 2016-2032
- 4.1. North America Compression Therapy Market Analysis, 2016-2021
- 4.2. North America Compression Therapy Market Opportunity and Forecast, 2023-2032
- 4.3. North America Compression Therapy Market Analysis, Opportunity and Forecast, By By Technique, 2016-2032
- 4.3.1. North America Compression Therapy Market Analysis by By Technique: Introduction
- 4.3.2. Market Size Absolute $ Opportunity Analysis and Forecast, By By Technique, 2016-2032
- 4.3.3. Static Compression Therapy
- 4.3.4. Dynamic Compression Therapy
- 4.4. North America Compression Therapy Market Analysis, Opportunity and Forecast, By By Product, 2016-2032
- 4.4.1. North America Compression Therapy Market Analysis by By Product: Introduction
- 4.4.2. Market Size Absolute $ Opportunity Analysis and Forecast, By By Product, 2016-2032
- 4.4.3. Compression Pumps
- 4.4.4. Compression Stockings
- 4.4.5. Compression Bandages
- 4.4.6. Compression Tapes
- 4.5. North America Compression Therapy Market Analysis, Opportunity and Forecast, By By Application, 2016-2032
- 4.5.1. North America Compression Therapy Market Analysis by By Application: Introduction
- 4.5.2. Market Size Absolute $ Opportunity Analysis and Forecast, By By Application, 2016-2032
- 4.5.3. Varicose Vein Treatment
- 4.5.4. Deep Vein Thrombosis Treatment
- 4.5.5. Lymphedema Treatment
- 4.5.6. Leg Ulcer Treatment
- 4.5.7. Others
- 4.6. North America Compression Therapy Market Analysis, Opportunity and Forecast, By Country , 2016-2032
- 4.6.1. North America Compression Therapy Market Analysis by Country : Introduction
- 4.6.2. Market Size Absolute $ Opportunity Analysis and Forecast, Country , 2016-2032
- 4.6.2.1. The US
- 4.6.2.2. Canada
- 4.6.2.3. Mexico
- 5. Western Europe Compression Therapy Market Analysis, Opportunity and Forecast, 2016-2032
- 5.1. Western Europe Compression Therapy Market Analysis, 2016-2021
- 5.2. Western Europe Compression Therapy Market Opportunity and Forecast, 2023-2032
- 5.3. Western Europe Compression Therapy Market Analysis, Opportunity and Forecast, By By Technique, 2016-2032
- 5.3.1. Western Europe Compression Therapy Market Analysis by By Technique: Introduction
- 5.3.2. Market Size Absolute $ Opportunity Analysis and Forecast, By By Technique, 2016-2032
- 5.3.3. Static Compression Therapy
- 5.3.4. Dynamic Compression Therapy
- 5.4. Western Europe Compression Therapy Market Analysis, Opportunity and Forecast, By By Product, 2016-2032
- 5.4.1. Western Europe Compression Therapy Market Analysis by By Product: Introduction
- 5.4.2. Market Size Absolute $ Opportunity Analysis and Forecast, By By Product, 2016-2032
- 5.4.3. Compression Pumps
- 5.4.4. Compression Stockings
- 5.4.5. Compression Bandages
- 5.4.6. Compression Tapes
- 5.5. Western Europe Compression Therapy Market Analysis, Opportunity and Forecast, By By Application, 2016-2032
- 5.5.1. Western Europe Compression Therapy Market Analysis by By Application: Introduction
- 5.5.2. Market Size Absolute $ Opportunity Analysis and Forecast, By By Application, 2016-2032
- 5.5.3. Varicose Vein Treatment
- 5.5.4. Deep Vein Thrombosis Treatment
- 5.5.5. Lymphedema Treatment
- 5.5.6. Leg Ulcer Treatment
- 5.5.7. Others
- 5.6. Western Europe Compression Therapy Market Analysis, Opportunity and Forecast, By Country , 2016-2032
- 5.6.1. Western Europe Compression Therapy Market Analysis by Country : Introduction
- 5.6.2. Market Size Absolute $ Opportunity Analysis and Forecast, Country , 2016-2032
- 5.6.2.1. Germany
- 5.6.2.2. France
- 5.6.2.3. The UK
- 5.6.2.4. Spain
- 5.6.2.5. Italy
- 5.6.2.6. Portugal
- 5.6.2.7. Ireland
- 5.6.2.8. Austria
- 5.6.2.9. Switzerland
- 5.6.2.10. Benelux
- 5.6.2.11. Nordic
- 5.6.2.12. Rest of Western Europe
- 6. Eastern Europe Compression Therapy Market Analysis, Opportunity and Forecast, 2016-2032
- 6.1. Eastern Europe Compression Therapy Market Analysis, 2016-2021
- 6.2. Eastern Europe Compression Therapy Market Opportunity and Forecast, 2023-2032
- 6.3. Eastern Europe Compression Therapy Market Analysis, Opportunity and Forecast, By By Technique, 2016-2032
- 6.3.1. Eastern Europe Compression Therapy Market Analysis by By Technique: Introduction
- 6.3.2. Market Size Absolute $ Opportunity Analysis and Forecast, By By Technique, 2016-2032
- 6.3.3. Static Compression Therapy
- 6.3.4. Dynamic Compression Therapy
- 6.4. Eastern Europe Compression Therapy Market Analysis, Opportunity and Forecast, By By Product, 2016-2032
- 6.4.1. Eastern Europe Compression Therapy Market Analysis by By Product: Introduction
- 6.4.2. Market Size Absolute $ Opportunity Analysis and Forecast, By By Product, 2016-2032
- 6.4.3. Compression Pumps
- 6.4.4. Compression Stockings
- 6.4.5. Compression Bandages
- 6.4.6. Compression Tapes
- 6.5. Eastern Europe Compression Therapy Market Analysis, Opportunity and Forecast, By By Application, 2016-2032
- 6.5.1. Eastern Europe Compression Therapy Market Analysis by By Application: Introduction
- 6.5.2. Market Size Absolute $ Opportunity Analysis and Forecast, By By Application, 2016-2032
- 6.5.3. Varicose Vein Treatment
- 6.5.4. Deep Vein Thrombosis Treatment
- 6.5.5. Lymphedema Treatment
- 6.5.6. Leg Ulcer Treatment
- 6.5.7. Others
- 6.6. Eastern Europe Compression Therapy Market Analysis, Opportunity and Forecast, By Country , 2016-2032
- 6.6.1. Eastern Europe Compression Therapy Market Analysis by Country : Introduction
- 6.6.2. Market Size Absolute $ Opportunity Analysis and Forecast, Country , 2016-2032
- 6.6.2.1. Russia
- 6.6.2.2. Poland
- 6.6.2.3. The Czech Republic
- 6.6.2.4. Greece
- 6.6.2.5. Rest of Eastern Europe
- 7. APAC Compression Therapy Market Analysis, Opportunity and Forecast, 2016-2032
- 7.1. APAC Compression Therapy Market Analysis, 2016-2021
- 7.2. APAC Compression Therapy Market Opportunity and Forecast, 2023-2032
- 7.3. APAC Compression Therapy Market Analysis, Opportunity and Forecast, By By Technique, 2016-2032
- 7.3.1. APAC Compression Therapy Market Analysis by By Technique: Introduction
- 7.3.2. Market Size Absolute $ Opportunity Analysis and Forecast, By By Technique, 2016-2032
- 7.3.3. Static Compression Therapy
- 7.3.4. Dynamic Compression Therapy
- 7.4. APAC Compression Therapy Market Analysis, Opportunity and Forecast, By By Product, 2016-2032
- 7.4.1. APAC Compression Therapy Market Analysis by By Product: Introduction
- 7.4.2. Market Size Absolute $ Opportunity Analysis and Forecast, By By Product, 2016-2032
- 7.4.3. Compression Pumps
- 7.4.4. Compression Stockings
- 7.4.5. Compression Bandages
- 7.4.6. Compression Tapes
- 7.5. APAC Compression Therapy Market Analysis, Opportunity and Forecast, By By Application, 2016-2032
- 7.5.1. APAC Compression Therapy Market Analysis by By Application: Introduction
- 7.5.2. Market Size Absolute $ Opportunity Analysis and Forecast, By By Application, 2016-2032
- 7.5.3. Varicose Vein Treatment
- 7.5.4. Deep Vein Thrombosis Treatment
- 7.5.5. Lymphedema Treatment
- 7.5.6. Leg Ulcer Treatment
- 7.5.7. Others
- 7.6. APAC Compression Therapy Market Analysis, Opportunity and Forecast, By Country , 2016-2032
- 7.6.1. APAC Compression Therapy Market Analysis by Country : Introduction
- 7.6.2. Market Size Absolute $ Opportunity Analysis and Forecast, Country , 2016-2032
- 7.6.2.1. China
- 7.6.2.2. Japan
- 7.6.2.3. South Korea
- 7.6.2.4. India
- 7.6.2.5. Australia & New Zeland
- 7.6.2.6. Indonesia
- 7.6.2.7. Malaysia
- 7.6.2.8. Philippines
- 7.6.2.9. Singapore
- 7.6.2.10. Thailand
- 7.6.2.11. Vietnam
- 7.6.2.12. Rest of APAC
- 8. Latin America Compression Therapy Market Analysis, Opportunity and Forecast, 2016-2032
- 8.1. Latin America Compression Therapy Market Analysis, 2016-2021
- 8.2. Latin America Compression Therapy Market Opportunity and Forecast, 2023-2032
- 8.3. Latin America Compression Therapy Market Analysis, Opportunity and Forecast, By By Technique, 2016-2032
- 8.3.1. Latin America Compression Therapy Market Analysis by By Technique: Introduction
- 8.3.2. Market Size Absolute $ Opportunity Analysis and Forecast, By By Technique, 2016-2032
- 8.3.3. Static Compression Therapy
- 8.3.4. Dynamic Compression Therapy
- 8.4. Latin America Compression Therapy Market Analysis, Opportunity and Forecast, By By Product, 2016-2032
- 8.4.1. Latin America Compression Therapy Market Analysis by By Product: Introduction
- 8.4.2. Market Size Absolute $ Opportunity Analysis and Forecast, By By Product, 2016-2032
- 8.4.3. Compression Pumps
- 8.4.4. Compression Stockings
- 8.4.5. Compression Bandages
- 8.4.6. Compression Tapes
- 8.5. Latin America Compression Therapy Market Analysis, Opportunity and Forecast, By By Application, 2016-2032
- 8.5.1. Latin America Compression Therapy Market Analysis by By Application: Introduction
- 8.5.2. Market Size Absolute $ Opportunity Analysis and Forecast, By By Application, 2016-2032
- 8.5.3. Varicose Vein Treatment
- 8.5.4. Deep Vein Thrombosis Treatment
- 8.5.5. Lymphedema Treatment
- 8.5.6. Leg Ulcer Treatment
- 8.5.7. Others
- 8.6. Latin America Compression Therapy Market Analysis, Opportunity and Forecast, By Country , 2016-2032
- 8.6.1. Latin America Compression Therapy Market Analysis by Country : Introduction
- 8.6.2. Market Size Absolute $ Opportunity Analysis and Forecast, Country , 2016-2032
- 8.6.2.1. Brazil
- 8.6.2.2. Colombia
- 8.6.2.3. Chile
- 8.6.2.4. Argentina
- 8.6.2.5. Costa Rica
- 8.6.2.6. Rest of Latin America
- 9. Middle East & Africa Compression Therapy Market Analysis, Opportunity and Forecast, 2016-2032
- 9.1. Middle East & Africa Compression Therapy Market Analysis, 2016-2021
- 9.2. Middle East & Africa Compression Therapy Market Opportunity and Forecast, 2023-2032
- 9.3. Middle East & Africa Compression Therapy Market Analysis, Opportunity and Forecast, By By Technique, 2016-2032
- 9.3.1. Middle East & Africa Compression Therapy Market Analysis by By Technique: Introduction
- 9.3.2. Market Size Absolute $ Opportunity Analysis and Forecast, By By Technique, 2016-2032
- 9.3.3. Static Compression Therapy
- 9.3.4. Dynamic Compression Therapy
- 9.4. Middle East & Africa Compression Therapy Market Analysis, Opportunity and Forecast, By By Product, 2016-2032
- 9.4.1. Middle East & Africa Compression Therapy Market Analysis by By Product: Introduction
- 9.4.2. Market Size Absolute $ Opportunity Analysis and Forecast, By By Product, 2016-2032
- 9.4.3. Compression Pumps
- 9.4.4. Compression Stockings
- 9.4.5. Compression Bandages
- 9.4.6. Compression Tapes
- 9.5. Middle East & Africa Compression Therapy Market Analysis, Opportunity and Forecast, By By Application, 2016-2032
- 9.5.1. Middle East & Africa Compression Therapy Market Analysis by By Application: Introduction
- 9.5.2. Market Size Absolute $ Opportunity Analysis and Forecast, By By Application, 2016-2032
- 9.5.3. Varicose Vein Treatment
- 9.5.4. Deep Vein Thrombosis Treatment
- 9.5.5. Lymphedema Treatment
- 9.5.6. Leg Ulcer Treatment
- 9.5.7. Others
- 9.6. Middle East & Africa Compression Therapy Market Analysis, Opportunity and Forecast, By Country , 2016-2032
- 9.6.1. Middle East & Africa Compression Therapy Market Analysis by Country : Introduction
- 9.6.2. Market Size Absolute $ Opportunity Analysis and Forecast, Country , 2016-2032
- 9.6.2.1. Algeria
- 9.6.2.2. Egypt
- 9.6.2.3. Israel
- 9.6.2.4. Kuwait
- 9.6.2.5. Nigeria
- 9.6.2.6. Saudi Arabia
- 9.6.2.7. South Africa
- 9.6.2.8. Turkey
- 9.6.2.9. The UAE
- 9.6.2.10. Rest of MEA
- 10. Global Compression Therapy Market Analysis, Opportunity and Forecast, By Region , 2016-2032
- 10.1. Global Compression Therapy Market Analysis by Region : Introduction
- 10.2. Market Size Absolute $ Opportunity Analysis and Forecast, By Region , 2016-2032
- 10.2.1. North America
- 10.2.2. Western Europe
- 10.2.3. Eastern Europe
- 10.2.4. APAC
- 10.2.5. Latin America
- 10.2.6. Middle East & Africa
- 11. Global Compression Therapy Market Competitive Landscape, Market Share Analysis, and Company Profiles
- 11.1. Market Share Analysis
- 11.2. Company Profiles
- 11.3. BSN medical
- 11.3.1. Company Overview
- 11.3.2. Financial Highlights
- 11.3.3. Product Portfolio
- 11.3.4. SWOT Analysis
- 11.3.5. Key Strategies and Developments
- 11.4. Medi GmbH & Co. KG
- 11.4.1. Company Overview
- 11.4.2. Financial Highlights
- 11.4.3. Product Portfolio
- 11.4.4. SWOT Analysis
- 11.4.5. Key Strategies and Developments
- 11.5. Julius Zorn GmbH
- 11.5.1. Company Overview
- 11.5.2. Financial Highlights
- 11.5.3. Product Portfolio
- 11.5.4. SWOT Analysis
- 11.5.5. Key Strategies and Developments
- 11.6. Sigvaris
- 11.6.1. Company Overview
- 11.6.2. Financial Highlights
- 11.6.3. Product Portfolio
- 11.6.4. SWOT Analysis
- 11.6.5. Key Strategies and Developments
- 11.7. Paul Hartmann AG
- 11.7.1. Company Overview
- 11.7.2. Financial Highlights
- 11.7.3. Product Portfolio
- 11.7.4. SWOT Analysis
- 11.7.5. Key Strategies and Developments
- 11.8. 3M Health Care
- 11.8.1. Company Overview
- 11.8.2. Financial Highlights
- 11.8.3. Product Portfolio
- 11.8.4. SWOT Analysis
- 11.8.5. Key Strategies and Developments
- 11.9. Gottfried Medical, Inc.
- 11.9.1. Company Overview
- 11.9.2. Financial Highlights
- 11.9.3. Product Portfolio
- 11.9.4. SWOT Analysis
- 11.9.5. Key Strategies and Developments
- 11.10. Bio Compression Systems, Inc.
- 11.10.1. Company Overview
- 11.10.2. Financial Highlights
- 11.10.3. Product Portfolio
- 11.10.4. SWOT Analysis
- 11.10.5. Key Strategies and Developments
- 11.11. ArjoHuntleigh
- 11.11.1. Company Overview
- 11.11.2. Financial Highlights
- 11.11.3. Product Portfolio
- 11.11.4. SWOT Analysis
- 11.11.5. Key Strategies and Developments
- 11.12. Spectrum Healthcare, Inc.
- 11.12.1. Company Overview
- 11.12.2. Financial Highlights
- 11.12.3. Product Portfolio
- 11.12.4. SWOT Analysis
- 11.12.5. Key Strategies and Developments
- 12. Assumptions and Acronyms
- 13. Research Methodology
- 14. Contact
- List of Figures
- Figure 1: Global Compression Therapy Market Revenue (US$ Mn) Market Share by By Technique in 2022
- Figure 2: Global Compression Therapy Market Attractiveness Analysis by By Technique, 2016-2032
- Figure 3: Global Compression Therapy Market Revenue (US$ Mn) Market Share by By Productin 2022
- Figure 4: Global Compression Therapy Market Attractiveness Analysis by By Product, 2016-2032
- Figure 5: Global Compression Therapy Market Revenue (US$ Mn) Market Share by By Applicationin 2022
- Figure 6: Global Compression Therapy Market Attractiveness Analysis by By Application, 2016-2032
- Figure 7: Global Compression Therapy Market Revenue (US$ Mn) Market Share by Region in 2022
- Figure 8: Global Compression Therapy Market Attractiveness Analysis by Region, 2016-2032
- Figure 9: Global Compression Therapy Market Revenue (US$ Mn) (2016-2032)
- Figure 10: Global Compression Therapy Market Revenue (US$ Mn) Comparison by Region (2016-2032)
- Figure 11: Global Compression Therapy Market Revenue (US$ Mn) Comparison by By Technique (2016-2032)
- Figure 12: Global Compression Therapy Market Revenue (US$ Mn) Comparison by By Product (2016-2032)
- Figure 13: Global Compression Therapy Market Revenue (US$ Mn) Comparison by By Application (2016-2032)
- Figure 14: Global Compression Therapy Market Y-o-Y Growth Rate Comparison by Region (2016-2032)
- Figure 15: Global Compression Therapy Market Y-o-Y Growth Rate Comparison by By Technique (2016-2032)
- Figure 16: Global Compression Therapy Market Y-o-Y Growth Rate Comparison by By Product (2016-2032)
- Figure 17: Global Compression Therapy Market Y-o-Y Growth Rate Comparison by By Application (2016-2032)
- Figure 18: Global Compression Therapy Market Share Comparison by Region (2016-2032)
- Figure 19: Global Compression Therapy Market Share Comparison by By Technique (2016-2032)
- Figure 20: Global Compression Therapy Market Share Comparison by By Product (2016-2032)
- Figure 21: Global Compression Therapy Market Share Comparison by By Application (2016-2032)
- Figure 22: North America Compression Therapy Market Revenue (US$ Mn) Market Share by By Techniquein 2022
- Figure 23: North America Compression Therapy Market Attractiveness Analysis by By Technique, 2016-2032
- Figure 24: North America Compression Therapy Market Revenue (US$ Mn) Market Share by By Productin 2022
- Figure 25: North America Compression Therapy Market Attractiveness Analysis by By Product, 2016-2032
- Figure 26: North America Compression Therapy Market Revenue (US$ Mn) Market Share by By Applicationin 2022
- Figure 27: North America Compression Therapy Market Attractiveness Analysis by By Application, 2016-2032
- Figure 28: North America Compression Therapy Market Revenue (US$ Mn) Market Share by Country in 2022
- Figure 29: North America Compression Therapy Market Attractiveness Analysis by Country, 2016-2032
- Figure 30: North America Compression Therapy Market Revenue (US$ Mn) (2016-2032)
- Figure 31: North America Compression Therapy Market Revenue (US$ Mn) Comparison by Country (2016-2032)
- Figure 32: North America Compression Therapy Market Revenue (US$ Mn) Comparison by By Technique (2016-2032)
- Figure 33: North America Compression Therapy Market Revenue (US$ Mn) Comparison by By Product (2016-2032)
- Figure 34: North America Compression Therapy Market Revenue (US$ Mn) Comparison by By Application (2016-2032)
- Figure 35: North America Compression Therapy Market Y-o-Y Growth Rate Comparison by Country (2016-2032)
- Figure 36: North America Compression Therapy Market Y-o-Y Growth Rate Comparison by By Technique (2016-2032)
- Figure 37: North America Compression Therapy Market Y-o-Y Growth Rate Comparison by By Product (2016-2032)
- Figure 38: North America Compression Therapy Market Y-o-Y Growth Rate Comparison by By Application (2016-2032)
- Figure 39: North America Compression Therapy Market Share Comparison by Country (2016-2032)
- Figure 40: North America Compression Therapy Market Share Comparison by By Technique (2016-2032)
- Figure 41: North America Compression Therapy Market Share Comparison by By Product (2016-2032)
- Figure 42: North America Compression Therapy Market Share Comparison by By Application (2016-2032)
- Figure 43: Western Europe Compression Therapy Market Revenue (US$ Mn) Market Share by By Techniquein 2022
- Figure 44: Western Europe Compression Therapy Market Attractiveness Analysis by By Technique, 2016-2032
- Figure 45: Western Europe Compression Therapy Market Revenue (US$ Mn) Market Share by By Productin 2022
- Figure 46: Western Europe Compression Therapy Market Attractiveness Analysis by By Product, 2016-2032
- Figure 47: Western Europe Compression Therapy Market Revenue (US$ Mn) Market Share by By Applicationin 2022
- Figure 48: Western Europe Compression Therapy Market Attractiveness Analysis by By Application, 2016-2032
- Figure 49: Western Europe Compression Therapy Market Revenue (US$ Mn) Market Share by Country in 2022
- Figure 50: Western Europe Compression Therapy Market Attractiveness Analysis by Country, 2016-2032
- Figure 51: Western Europe Compression Therapy Market Revenue (US$ Mn) (2016-2032)
- Figure 52: Western Europe Compression Therapy Market Revenue (US$ Mn) Comparison by Country (2016-2032)
- Figure 53: Western Europe Compression Therapy Market Revenue (US$ Mn) Comparison by By Technique (2016-2032)
- Figure 54: Western Europe Compression Therapy Market Revenue (US$ Mn) Comparison by By Product (2016-2032)
- Figure 55: Western Europe Compression Therapy Market Revenue (US$ Mn) Comparison by By Application (2016-2032)
- Figure 56: Western Europe Compression Therapy Market Y-o-Y Growth Rate Comparison by Country (2016-2032)
- Figure 57: Western Europe Compression Therapy Market Y-o-Y Growth Rate Comparison by By Technique (2016-2032)
- Figure 58: Western Europe Compression Therapy Market Y-o-Y Growth Rate Comparison by By Product (2016-2032)
- Figure 59: Western Europe Compression Therapy Market Y-o-Y Growth Rate Comparison by By Application (2016-2032)
- Figure 60: Western Europe Compression Therapy Market Share Comparison by Country (2016-2032)
- Figure 61: Western Europe Compression Therapy Market Share Comparison by By Technique (2016-2032)
- Figure 62: Western Europe Compression Therapy Market Share Comparison by By Product (2016-2032)
- Figure 63: Western Europe Compression Therapy Market Share Comparison by By Application (2016-2032)
- Figure 64: Eastern Europe Compression Therapy Market Revenue (US$ Mn) Market Share by By Techniquein 2022
- Figure 65: Eastern Europe Compression Therapy Market Attractiveness Analysis by By Technique, 2016-2032
- Figure 66: Eastern Europe Compression Therapy Market Revenue (US$ Mn) Market Share by By Productin 2022
- Figure 67: Eastern Europe Compression Therapy Market Attractiveness Analysis by By Product, 2016-2032
- Figure 68: Eastern Europe Compression Therapy Market Revenue (US$ Mn) Market Share by By Applicationin 2022
- Figure 69: Eastern Europe Compression Therapy Market Attractiveness Analysis by By Application, 2016-2032
- Figure 70: Eastern Europe Compression Therapy Market Revenue (US$ Mn) Market Share by Country in 2022
- Figure 71: Eastern Europe Compression Therapy Market Attractiveness Analysis by Country, 2016-2032
- Figure 72: Eastern Europe Compression Therapy Market Revenue (US$ Mn) (2016-2032)
- Figure 73: Eastern Europe Compression Therapy Market Revenue (US$ Mn) Comparison by Country (2016-2032)
- Figure 74: Eastern Europe Compression Therapy Market Revenue (US$ Mn) Comparison by By Technique (2016-2032)
- Figure 75: Eastern Europe Compression Therapy Market Revenue (US$ Mn) Comparison by By Product (2016-2032)
- Figure 76: Eastern Europe Compression Therapy Market Revenue (US$ Mn) Comparison by By Application (2016-2032)
- Figure 77: Eastern Europe Compression Therapy Market Y-o-Y Growth Rate Comparison by Country (2016-2032)
- Figure 78: Eastern Europe Compression Therapy Market Y-o-Y Growth Rate Comparison by By Technique (2016-2032)
- Figure 79: Eastern Europe Compression Therapy Market Y-o-Y Growth Rate Comparison by By Product (2016-2032)
- Figure 80: Eastern Europe Compression Therapy Market Y-o-Y Growth Rate Comparison by By Application (2016-2032)
- Figure 81: Eastern Europe Compression Therapy Market Share Comparison by Country (2016-2032)
- Figure 82: Eastern Europe Compression Therapy Market Share Comparison by By Technique (2016-2032)
- Figure 83: Eastern Europe Compression Therapy Market Share Comparison by By Product (2016-2032)
- Figure 84: Eastern Europe Compression Therapy Market Share Comparison by By Application (2016-2032)
- Figure 85: APAC Compression Therapy Market Revenue (US$ Mn) Market Share by By Techniquein 2022
- Figure 86: APAC Compression Therapy Market Attractiveness Analysis by By Technique, 2016-2032
- Figure 87: APAC Compression Therapy Market Revenue (US$ Mn) Market Share by By Productin 2022
- Figure 88: APAC Compression Therapy Market Attractiveness Analysis by By Product, 2016-2032
- Figure 89: APAC Compression Therapy Market Revenue (US$ Mn) Market Share by By Applicationin 2022
- Figure 90: APAC Compression Therapy Market Attractiveness Analysis by By Application, 2016-2032
- Figure 91: APAC Compression Therapy Market Revenue (US$ Mn) Market Share by Country in 2022
- Figure 92: APAC Compression Therapy Market Attractiveness Analysis by Country, 2016-2032
- Figure 93: APAC Compression Therapy Market Revenue (US$ Mn) (2016-2032)
- Figure 94: APAC Compression Therapy Market Revenue (US$ Mn) Comparison by Country (2016-2032)
- Figure 95: APAC Compression Therapy Market Revenue (US$ Mn) Comparison by By Technique (2016-2032)
- Figure 96: APAC Compression Therapy Market Revenue (US$ Mn) Comparison by By Product (2016-2032)
- Figure 97: APAC Compression Therapy Market Revenue (US$ Mn) Comparison by By Application (2016-2032)
- Figure 98: APAC Compression Therapy Market Y-o-Y Growth Rate Comparison by Country (2016-2032)
- Figure 99: APAC Compression Therapy Market Y-o-Y Growth Rate Comparison by By Technique (2016-2032)
- Figure 100: APAC Compression Therapy Market Y-o-Y Growth Rate Comparison by By Product (2016-2032)
- Figure 101: APAC Compression Therapy Market Y-o-Y Growth Rate Comparison by By Application (2016-2032)
- Figure 102: APAC Compression Therapy Market Share Comparison by Country (2016-2032)
- Figure 103: APAC Compression Therapy Market Share Comparison by By Technique (2016-2032)
- Figure 104: APAC Compression Therapy Market Share Comparison by By Product (2016-2032)
- Figure 105: APAC Compression Therapy Market Share Comparison by By Application (2016-2032)
- Figure 106: Latin America Compression Therapy Market Revenue (US$ Mn) Market Share by By Techniquein 2022
- Figure 107: Latin America Compression Therapy Market Attractiveness Analysis by By Technique, 2016-2032
- Figure 108: Latin America Compression Therapy Market Revenue (US$ Mn) Market Share by By Productin 2022
- Figure 109: Latin America Compression Therapy Market Attractiveness Analysis by By Product, 2016-2032
- Figure 110: Latin America Compression Therapy Market Revenue (US$ Mn) Market Share by By Applicationin 2022
- Figure 111: Latin America Compression Therapy Market Attractiveness Analysis by By Application, 2016-2032
- Figure 112: Latin America Compression Therapy Market Revenue (US$ Mn) Market Share by Country in 2022
- Figure 113: Latin America Compression Therapy Market Attractiveness Analysis by Country, 2016-2032
- Figure 114: Latin America Compression Therapy Market Revenue (US$ Mn) (2016-2032)
- Figure 115: Latin America Compression Therapy Market Revenue (US$ Mn) Comparison by Country (2016-2032)
- Figure 116: Latin America Compression Therapy Market Revenue (US$ Mn) Comparison by By Technique (2016-2032)
- Figure 117: Latin America Compression Therapy Market Revenue (US$ Mn) Comparison by By Product (2016-2032)
- Figure 118: Latin America Compression Therapy Market Revenue (US$ Mn) Comparison by By Application (2016-2032)
- Figure 119: Latin America Compression Therapy Market Y-o-Y Growth Rate Comparison by Country (2016-2032)
- Figure 120: Latin America Compression Therapy Market Y-o-Y Growth Rate Comparison by By Technique (2016-2032)
- Figure 121: Latin America Compression Therapy Market Y-o-Y Growth Rate Comparison by By Product (2016-2032)
- Figure 122: Latin America Compression Therapy Market Y-o-Y Growth Rate Comparison by By Application (2016-2032)
- Figure 123: Latin America Compression Therapy Market Share Comparison by Country (2016-2032)
- Figure 124: Latin America Compression Therapy Market Share Comparison by By Technique (2016-2032)
- Figure 125: Latin America Compression Therapy Market Share Comparison by By Product (2016-2032)
- Figure 126: Latin America Compression Therapy Market Share Comparison by By Application (2016-2032)
- Figure 127: Middle East & Africa Compression Therapy Market Revenue (US$ Mn) Market Share by By Techniquein 2022
- Figure 128: Middle East & Africa Compression Therapy Market Attractiveness Analysis by By Technique, 2016-2032
- Figure 129: Middle East & Africa Compression Therapy Market Revenue (US$ Mn) Market Share by By Productin 2022
- Figure 130: Middle East & Africa Compression Therapy Market Attractiveness Analysis by By Product, 2016-2032
- Figure 131: Middle East & Africa Compression Therapy Market Revenue (US$ Mn) Market Share by By Applicationin 2022
- Figure 132: Middle East & Africa Compression Therapy Market Attractiveness Analysis by By Application, 2016-2032
- Figure 133: Middle East & Africa Compression Therapy Market Revenue (US$ Mn) Market Share by Country in 2022
- Figure 134: Middle East & Africa Compression Therapy Market Attractiveness Analysis by Country, 2016-2032
- Figure 135: Middle East & Africa Compression Therapy Market Revenue (US$ Mn) (2016-2032)
- Figure 136: Middle East & Africa Compression Therapy Market Revenue (US$ Mn) Comparison by Country (2016-2032)
- Figure 137: Middle East & Africa Compression Therapy Market Revenue (US$ Mn) Comparison by By Technique (2016-2032)
- Figure 138: Middle East & Africa Compression Therapy Market Revenue (US$ Mn) Comparison by By Product (2016-2032)
- Figure 139: Middle East & Africa Compression Therapy Market Revenue (US$ Mn) Comparison by By Application (2016-2032)
- Figure 140: Middle East & Africa Compression Therapy Market Y-o-Y Growth Rate Comparison by Country (2016-2032)
- Figure 141: Middle East & Africa Compression Therapy Market Y-o-Y Growth Rate Comparison by By Technique (2016-2032)
- Figure 142: Middle East & Africa Compression Therapy Market Y-o-Y Growth Rate Comparison by By Product (2016-2032)
- Figure 143: Middle East & Africa Compression Therapy Market Y-o-Y Growth Rate Comparison by By Application (2016-2032)
- Figure 144: Middle East & Africa Compression Therapy Market Share Comparison by Country (2016-2032)
- Figure 145: Middle East & Africa Compression Therapy Market Share Comparison by By Technique (2016-2032)
- Figure 146: Middle East & Africa Compression Therapy Market Share Comparison by By Product (2016-2032)
- Figure 147: Middle East & Africa Compression Therapy Market Share Comparison by By Application (2016-2032)
- List of Tables
- Table 1: Global Compression Therapy Market Comparison by By Technique (2016-2032)
- Table 2: Global Compression Therapy Market Comparison by By Product (2016-2032)
- Table 3: Global Compression Therapy Market Comparison by By Application (2016-2032)
- Table 4: Global Compression Therapy Market Revenue (US$ Mn) Comparison by Region (2016-2032)
- Table 5: Global Compression Therapy Market Revenue (US$ Mn) (2016-2032)
- Table 6: Global Compression Therapy Market Revenue (US$ Mn) Comparison by Region (2016-2032)
- Table 7: Global Compression Therapy Market Revenue (US$ Mn) Comparison by By Technique (2016-2032)
- Table 8: Global Compression Therapy Market Revenue (US$ Mn) Comparison by By Product (2016-2032)
- Table 9: Global Compression Therapy Market Revenue (US$ Mn) Comparison by By Application (2016-2032)
- Table 10: Global Compression Therapy Market Y-o-Y Growth Rate Comparison by Region (2016-2032)
- Table 11: Global Compression Therapy Market Y-o-Y Growth Rate Comparison by By Technique (2016-2032)
- Table 12: Global Compression Therapy Market Y-o-Y Growth Rate Comparison by By Product (2016-2032)
- Table 13: Global Compression Therapy Market Y-o-Y Growth Rate Comparison by By Application (2016-2032)
- Table 14: Global Compression Therapy Market Share Comparison by Region (2016-2032)
- Table 15: Global Compression Therapy Market Share Comparison by By Technique (2016-2032)
- Table 16: Global Compression Therapy Market Share Comparison by By Product (2016-2032)
- Table 17: Global Compression Therapy Market Share Comparison by By Application (2016-2032)
- Table 18: North America Compression Therapy Market Comparison by By Product (2016-2032)
- Table 19: North America Compression Therapy Market Comparison by By Application (2016-2032)
- Table 20: North America Compression Therapy Market Revenue (US$ Mn) Comparison by Country (2016-2032)
- Table 21: North America Compression Therapy Market Revenue (US$ Mn) (2016-2032)
- Table 22: North America Compression Therapy Market Revenue (US$ Mn) Comparison by Country (2016-2032)
- Table 23: North America Compression Therapy Market Revenue (US$ Mn) Comparison by By Technique (2016-2032)
- Table 24: North America Compression Therapy Market Revenue (US$ Mn) Comparison by By Product (2016-2032)
- Table 25: North America Compression Therapy Market Revenue (US$ Mn) Comparison by By Application (2016-2032)
- Table 26: North America Compression Therapy Market Y-o-Y Growth Rate Comparison by Country (2016-2032)
- Table 27: North America Compression Therapy Market Y-o-Y Growth Rate Comparison by By Technique (2016-2032)
- Table 28: North America Compression Therapy Market Y-o-Y Growth Rate Comparison by By Product (2016-2032)
- Table 29: North America Compression Therapy Market Y-o-Y Growth Rate Comparison by By Application (2016-2032)
- Table 30: North America Compression Therapy Market Share Comparison by Country (2016-2032)
- Table 31: North America Compression Therapy Market Share Comparison by By Technique (2016-2032)
- Table 32: North America Compression Therapy Market Share Comparison by By Product (2016-2032)
- Table 33: North America Compression Therapy Market Share Comparison by By Application (2016-2032)
- Table 34: Western Europe Compression Therapy Market Comparison by By Technique (2016-2032)
- Table 35: Western Europe Compression Therapy Market Comparison by By Product (2016-2032)
- Table 36: Western Europe Compression Therapy Market Comparison by By Application (2016-2032)
- Table 37: Western Europe Compression Therapy Market Revenue (US$ Mn) Comparison by Country (2016-2032)
- Table 38: Western Europe Compression Therapy Market Revenue (US$ Mn) (2016-2032)
- Table 39: Western Europe Compression Therapy Market Revenue (US$ Mn) Comparison by Country (2016-2032)
- Table 40: Western Europe Compression Therapy Market Revenue (US$ Mn) Comparison by By Technique (2016-2032)
- Table 41: Western Europe Compression Therapy Market Revenue (US$ Mn) Comparison by By Product (2016-2032)
- Table 42: Western Europe Compression Therapy Market Revenue (US$ Mn) Comparison by By Application (2016-2032)
- Table 43: Western Europe Compression Therapy Market Y-o-Y Growth Rate Comparison by Country (2016-2032)
- Table 44: Western Europe Compression Therapy Market Y-o-Y Growth Rate Comparison by By Technique (2016-2032)
- Table 45: Western Europe Compression Therapy Market Y-o-Y Growth Rate Comparison by By Product (2016-2032)
- Table 46: Western Europe Compression Therapy Market Y-o-Y Growth Rate Comparison by By Application (2016-2032)
- Table 47: Western Europe Compression Therapy Market Share Comparison by Country (2016-2032)
- Table 48: Western Europe Compression Therapy Market Share Comparison by By Technique (2016-2032)
- Table 49: Western Europe Compression Therapy Market Share Comparison by By Product (2016-2032)
- Table 50: Western Europe Compression Therapy Market Share Comparison by By Application (2016-2032)
- Table 51: Eastern Europe Compression Therapy Market Comparison by By Technique (2016-2032)
- Table 52: Eastern Europe Compression Therapy Market Comparison by By Product (2016-2032)
- Table 53: Eastern Europe Compression Therapy Market Comparison by By Application (2016-2032)
- Table 54: Eastern Europe Compression Therapy Market Revenue (US$ Mn) Comparison by Country (2016-2032)
- Table 55: Eastern Europe Compression Therapy Market Revenue (US$ Mn) (2016-2032)
- Table 56: Eastern Europe Compression Therapy Market Revenue (US$ Mn) Comparison by Country (2016-2032)
- Table 57: Eastern Europe Compression Therapy Market Revenue (US$ Mn) Comparison by By Technique (2016-2032)
- Table 58: Eastern Europe Compression Therapy Market Revenue (US$ Mn) Comparison by By Product (2016-2032)
- Table 59: Eastern Europe Compression Therapy Market Revenue (US$ Mn) Comparison by By Application (2016-2032)
- Table 60: Eastern Europe Compression Therapy Market Y-o-Y Growth Rate Comparison by Country (2016-2032)
- Table 61: Eastern Europe Compression Therapy Market Y-o-Y Growth Rate Comparison by By Technique (2016-2032)
- Table 62: Eastern Europe Compression Therapy Market Y-o-Y Growth Rate Comparison by By Product (2016-2032)
- Table 63: Eastern Europe Compression Therapy Market Y-o-Y Growth Rate Comparison by By Application (2016-2032)
- Table 64: Eastern Europe Compression Therapy Market Share Comparison by Country (2016-2032)
- Table 65: Eastern Europe Compression Therapy Market Share Comparison by By Technique (2016-2032)
- Table 66: Eastern Europe Compression Therapy Market Share Comparison by By Product (2016-2032)
- Table 67: Eastern Europe Compression Therapy Market Share Comparison by By Application (2016-2032)
- Table 68: APAC Compression Therapy Market Comparison by By Technique (2016-2032)
- Table 69: APAC Compression Therapy Market Comparison by By Product (2016-2032)
- Table 70: APAC Compression Therapy Market Comparison by By Application (2016-2032)
- Table 71: APAC Compression Therapy Market Revenue (US$ Mn) Comparison by Country (2016-2032)
- Table 72: APAC Compression Therapy Market Revenue (US$ Mn) (2016-2032)
- Table 73: APAC Compression Therapy Market Revenue (US$ Mn) Comparison by Country (2016-2032)
- Table 74: APAC Compression Therapy Market Revenue (US$ Mn) Comparison by By Technique (2016-2032)
- Table 75: APAC Compression Therapy Market Revenue (US$ Mn) Comparison by By Product (2016-2032)
- Table 76: APAC Compression Therapy Market Revenue (US$ Mn) Comparison by By Application (2016-2032)
- Table 77: APAC Compression Therapy Market Y-o-Y Growth Rate Comparison by Country (2016-2032)
- Table 78: APAC Compression Therapy Market Y-o-Y Growth Rate Comparison by By Technique (2016-2032)
- Table 79: APAC Compression Therapy Market Y-o-Y Growth Rate Comparison by By Product (2016-2032)
- Table 80: APAC Compression Therapy Market Y-o-Y Growth Rate Comparison by By Application (2016-2032)
- Table 81: APAC Compression Therapy Market Share Comparison by Country (2016-2032)
- Table 82: APAC Compression Therapy Market Share Comparison by By Technique (2016-2032)
- Table 83: APAC Compression Therapy Market Share Comparison by By Product (2016-2032)
- Table 84: APAC Compression Therapy Market Share Comparison by By Application (2016-2032)
- Table 85: Latin America Compression Therapy Market Comparison by By Technique (2016-2032)
- Table 86: Latin America Compression Therapy Market Comparison by By Product (2016-2032)
- Table 87: Latin America Compression Therapy Market Comparison by By Application (2016-2032)
- Table 88: Latin America Compression Therapy Market Revenue (US$ Mn) Comparison by Country (2016-2032)
- Table 89: Latin America Compression Therapy Market Revenue (US$ Mn) (2016-2032)
- Table 90: Latin America Compression Therapy Market Revenue (US$ Mn) Comparison by Country (2016-2032)
- Table 91: Latin America Compression Therapy Market Revenue (US$ Mn) Comparison by By Technique (2016-2032)
- Table 92: Latin America Compression Therapy Market Revenue (US$ Mn) Comparison by By Product (2016-2032)
- Table 93: Latin America Compression Therapy Market Revenue (US$ Mn) Comparison by By Application (2016-2032)
- Table 94: Latin America Compression Therapy Market Y-o-Y Growth Rate Comparison by Country (2016-2032)
- Table 95: Latin America Compression Therapy Market Y-o-Y Growth Rate Comparison by By Technique (2016-2032)
- Table 96: Latin America Compression Therapy Market Y-o-Y Growth Rate Comparison by By Product (2016-2032)
- Table 97: Latin America Compression Therapy Market Y-o-Y Growth Rate Comparison by By Application (2016-2032)
- Table 98: Latin America Compression Therapy Market Share Comparison by Country (2016-2032)
- Table 99: Latin America Compression Therapy Market Share Comparison by By Technique (2016-2032)
- Table 100: Latin America Compression Therapy Market Share Comparison by By Product (2016-2032)
- Table 101: Latin America Compression Therapy Market Share Comparison by By Application (2016-2032)
- Table 102: Middle East & Africa Compression Therapy Market Comparison by By Technique (2016-2032)
- Table 103: Middle East & Africa Compression Therapy Market Comparison by By Product (2016-2032)
- Table 104: Middle East & Africa Compression Therapy Market Comparison by By Application (2016-2032)
- Table 105: Middle East & Africa Compression Therapy Market Revenue (US$ Mn) Comparison by Country (2016-2032)
- Table 106: Middle East & Africa Compression Therapy Market Revenue (US$ Mn) (2016-2032)
- Table 107: Middle East & Africa Compression Therapy Market Revenue (US$ Mn) Comparison by Country (2016-2032)
- Table 108: Middle East & Africa Compression Therapy Market Revenue (US$ Mn) Comparison by By Technique (2016-2032)
- Table 109: Middle East & Africa Compression Therapy Market Revenue (US$ Mn) Comparison by By Product (2016-2032)
- Table 110: Middle East & Africa Compression Therapy Market Revenue (US$ Mn) Comparison by By Application (2016-2032)
- Table 111: Middle East & Africa Compression Therapy Market Y-o-Y Growth Rate Comparison by Country (2016-2032)
- Table 112: Middle East & Africa Compression Therapy Market Y-o-Y Growth Rate Comparison by By Technique (2016-2032)
- Table 113: Middle East & Africa Compression Therapy Market Y-o-Y Growth Rate Comparison by By Product (2016-2032)
- Table 114: Middle East & Africa Compression Therapy Market Y-o-Y Growth Rate Comparison by By Application (2016-2032)
- Table 115: Middle East & Africa Compression Therapy Market Share Comparison by Country (2016-2032)
- Table 116: Middle East & Africa Compression Therapy Market Share Comparison by By Technique (2016-2032)
- Table 117: Middle East & Africa Compression Therapy Market Share Comparison by By Product (2016-2032)
- Table 118: Middle East & Africa Compression Therapy Market Share Comparison by By Application (2016-2032)
- 1. Executive Summary
Inquiry Form
Why Choose Us
- 360 Degree Approach
- Growth Consulting
- 24/7 Research Support
- Comprehensive-Level of Customization
- Competitive Intelligence
- Single-Country/ Region Intelligence
- Post-Sale Service Assistance
- Access to Lead Analysts
- Available in PDF, Excel, Word/ PPT
Request for Customization
OUR CLIENTS
Don't just take our word. We are trusted by these great companies!