
Complementary And Alternative Medicine Market Intervention Analysis(Traditional Alternatives, Botanicals, Other), Distribution Channel Analysis(Retail Stores, Direct Sales, Other), By Region And Companies - Industry Segment Outlook, Market Assessment, Competition Scenario, Trends, And Forecast 2023-2032
-
14086
-
Jul 2023
-
150
-


-
This report was compiled by Trishita Deb Trishita Deb is an experienced market research and consulting professional with over 7 years of expertise across healthcare, consumer goods, and materials, contributing to over 400 healthcare-related reports. Correspondence Team Lead- Healthcare Linkedin | Detailed Market research Methodology Our methodology involves a mix of primary research, including interviews with leading mental health experts, and secondary research from reputable medical journals and databases. View Detailed Methodology Page
-
Quick Navigation
Report Overview
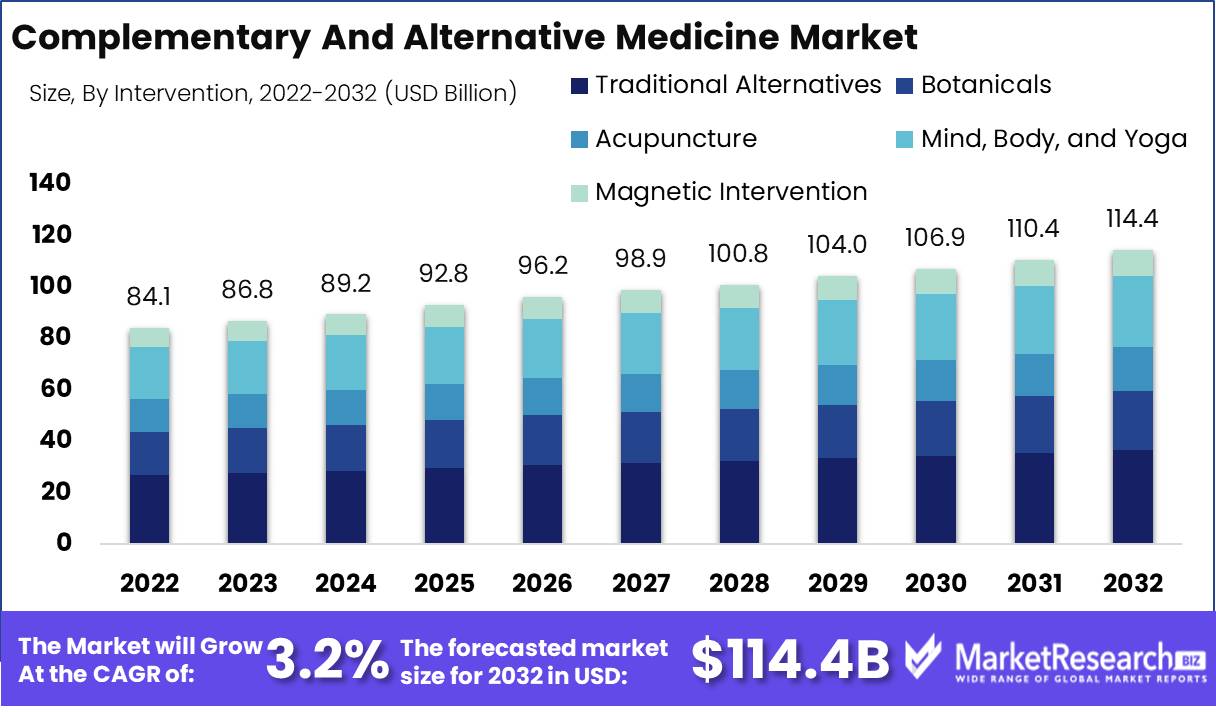
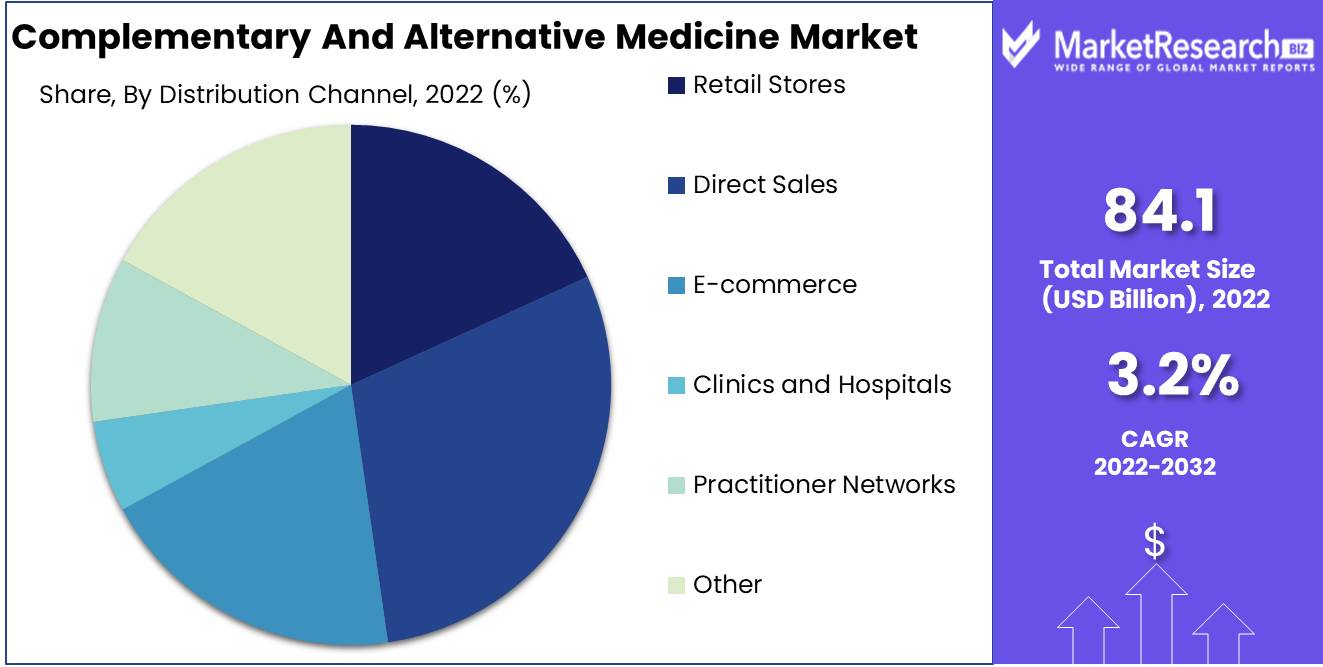
Complementary And Alternative Medicine Market size is expected to be worth around USD 114.4 Bn by 2032 from USD 84.1 Bn in 2022, growing at a CAGR of 3.2% during the forecast period from 2023 to 2032.
Complementary and Alternative Medicine (CAM), a broad term encompassing a vast array of medical practices and products operating outside the conventional healthcare system, is a veritable cornucopia of archaic healing philosophies. CAM, ever devoted to the pursuit of restoring equilibrium and tranquility within the human body, seeks to promote wellness, prevent disease, and employ natural means in its pursuit.
The burgeoning allure of the CAM industry can be attributed to its holistic and organic approach to healthcare, which diverges significantly from the reductionist tenets of conventional medicine. Unlike conventional medicine, complementary and alternative medicine (CAM) treatments aim to address the individual as a whole rather than merely symptomatic manifestations.
Frequently, these practices feature minimal invasiveness and a negligible absence of adverse effects, making them an ideal alternative for those who dislike the rigors of conventional treatments. CAM's potential for synergy with conventional therapies to enhance efficacy and reduce adverse effects is also worthy of recognition.
Notably, the CAM realm has witnessed an irrefutable influx of innovation in recent years, with the incorporation of cutting-edge technology into time-honored practices. The advent of mobile applications and online portals, for instance, has ushered in the era of virtual consultations, allowing seamless access to licensed practitioners versed in a variety of CAM modalities. This technological revolution has democratically empowered residents of remote areas or marginalized regions, democratizing CAM's accessibility.
Driving factors
Growing Demand for Holistic Healthcare
Increasing demand for holistic healthcare approaches is one of the primary factors propelling the CAM market. Numerous individuals seek alternatives to conventional medicine in an effort to treat not only their physical maladies, but also their mental, emotional, and spiritual health. CAM offers a variety of therapies and practices, such as acupuncture, herbal medicine, meditation, and yoga, that treat the individual as a whole rather than merely the symptoms of a particular condition.
Rising Awareness and Acceptance
The growing awareness and acceptance of CAM therapies among the general population is another important factor propelling the CAM market. People are becoming more knowledgeable about CAM modalities and their potential benefits as information becomes more readily available. Additionally, CAM's incorporation into conventional healthcare systems, with healthcare professionals integrating CAM therapies into their practice, has contributed to its increased legitimacy and acceptance.
Emphasis on Prevention and Wellness
In recent years, there has been a notable shift toward preventive healthcare and wellness promotion. CAM modalities frequently emphasize preventative measures and changes in lifestyle to promote overall health and well-being. This is consistent with the growing emphasis on maintaining good health and preventing diseases before they occur. As a result, an increasing number of individuals are utilizing CAM practices for proactive self-care and health maintenance.
Restraining Factors
High medication prices inhibit market expansion
The high price of conventional medications is one of the most significant factors impeding the growth of the CAM market. Because they cannot afford conventional medicine, many individuals are turning to CAM. However, CAM therapies can be costly, making their accessibility challenging for some individuals. This high cost, in conjunction with the absence of insurance coverage for CAM, is a significant barrier to the growth of the CAM market.
The lack of Skilled Professionals in Developing Economies Poses a Challenge
The lack of trained professionals in developing economies is an additional factor inhibiting the growth of the CAM market. In many nations, conventional medicine is the primary source of medical care, rendering CAM therapies relatively unknown. Even in countries where CAM is prevalent, there is a dearth of trained practitioners, making it difficult for individuals to obtain these therapies. This scarcity of qualified professionals is a significant obstacle, as it inhibits the growth of the CAM market in certain regions.
Patient Self-Medication and Lack of Awareness Restrain Growth
In addition to the aforementioned factors, patient self-medication and lack of awareness are also significant market restraints for CAM. Numerous individuals self-medicate with CAM therapies without consulting a trained professional. This can lead to adverse reactions or interactions with conventional medications, which can be hazardous. Moreover, because many individuals are oblivious of the potential benefits of CAM therapies, they do not view them as viable treatment options.
Intervention Analysis
The Traditional Alternatives Segment includes treatments such as acupuncture, Ayurveda, traditional Chinese medicine, and herbal medicine. In recent years, these treatments, which are based on centuries-old practices, have acquired tremendous popularity. Non-invasiveness, minimal adverse effects, and perceived efficacy have contributed to their rise in popularity.
Emerging economies' economic growth is an additional significant factor propelling the adoption of the Traditional Alternatives Segment. As disposable income rises in these nations, more individuals seek alternative treatments.
Additionally, consumer preferences have played a significant influence in the expansion of the Traditional Alternatives Segment. As a supplement to conventional medicine or as a stand-alone treatment for chronic conditions such as pain, anxiety, and depression, many individuals are turning to CAM. Increasing awareness of the benefits of natural or holistic remedies has contributed to the decline of the traditional preference for conventional medicine.
Distribution Channel Analysis
Typically, the Direct Sales Channel Segment entails the direct sale of CAM products between companies and consumers. This segment consists of businesses that sell CAM products through company-owned stores, online auctions, and direct sales. The accessibility of these products has contributed to the expansion of the CAM market.
As with Traditional Alternatives, economic growth in emerging economies has played an important role in the expansion of the Direct Sales Channel Segment. In these countries, direct selling is frequently selected as the distribution method due to factors such as low overhead costs, higher profit margins, and easier access to consumers.
Direct Sales Channels have been successful predominantly due to their capacity to improve CAM product distribution. Companies can communicate directly with their customers, eliminating the need for intermediaries such as pharmacies or health and wellness shops. This direct relationship facilitates the development of client trust, resulting in increased sales and consumer loyalty.
Key Market Segments
Intervention Analysis
- Traditional Alternatives
- Botanicals
- Acupuncture
- Mind, Body, and Yoga
- Magnetic Intervention
Distribution Channel Analysis
- Retail Stores
- Direct Sales
- E-commerce
- Clinics and Hospitals
- Practitioner Networks
- Other
Growth Opportunity
CAM gaining popularity in the treatment & diagnosis of various medical ailments
The use of CAM therapies is gaining acceptance in the mainstream healthcare industry, with several healthcare professionals integrating it into their practice. CAM therapies are used in the treatment and diagnosis of various medical ailments, including chronic pain, anxiety, depression, and sleep disorders. Several studies have also shown that CAM therapies, when used in conjunction with conventional treatments, can improve outcomes.
The rising geriatric population contributing to market growth
The aging population is one of the key drivers of growth in the CAM market. As the baby boomer generation ages and the geriatric population grows, there is a greater demand for complementary and alternative treatments to help manage the symptoms of age-related illnesses. CAM therapies provide a safe and non-invasive treatment option for seniors, who are often hesitant to undergo invasive procedures or take medication.
Healthcare insurance companies offering coverage
The growing acceptance of CAM therapies has led to many healthcare insurance companies now offering coverage for these treatments. This shift in insurance coverage has increased the affordability of CAM treatments, making it accessible to more people. The availability of insurance coverage for CAM treatments has also led to an increase in demand for these therapies, positively impacting the growth of the CAM market.
Latest Trends
Herbal supplements and homeopathic medications
In recent years, herbal supplements and homeopathic medications have become extremely popular. They are effective, natural alternatives to conventional medications that may cause deleterious effects. Herbal supplements like echinacea, ginkgo biloba, and St. John's Wort are known to strengthen the immune system, improve memory, and alleviate tension and anxiety. Homeopathic remedies employ extremely attenuated substances to stimulate the body's natural healing processes. People use these remedies to treat ailments like headaches, allergies, and colds.
Herbal oils and tea
Herbal remedies and tea have grown in popularity due to their many health benefits. Herbal oils, like lavender, peppermint, and tea tree oil, are known to alleviate headaches, muscle discomfort, and stress. Aromatherapy uses them to promote relaxation and enhance mood. Herbal tea is an additional method for integrating natural remedies into our daily lives. Ginger tea can reduce nausea and inflammation, while chamomile tea can promote sleep and digestion.
Medicinal plants and herbs
Medicinal plants and herbs can be processed into different forms, like capsules, powders, tinctures, and extracts. This makes it simpler for people to consume and incorporate these natural remedies into their daily lives. Powders can be added to smoothies and juices, tinctures can be added to water or other beverages, and extracts can be applied topically or ingested. Capsules are pre-measured and convenient to consume.
Therapy incorporates calmness, focus, and concentration
Herbal remedies not only treat physical ailments but also promote mental health. Herbal therapy promotes mental and emotional equilibrium by combining concentration, calmness, and intense focus. It is an effective treatment for anxiety, depression, and other mental disorders. The use of natural remedies like ashwagandha, valerian root, and kava is known to calm the psyche and reduce stress.
Regional Analysis
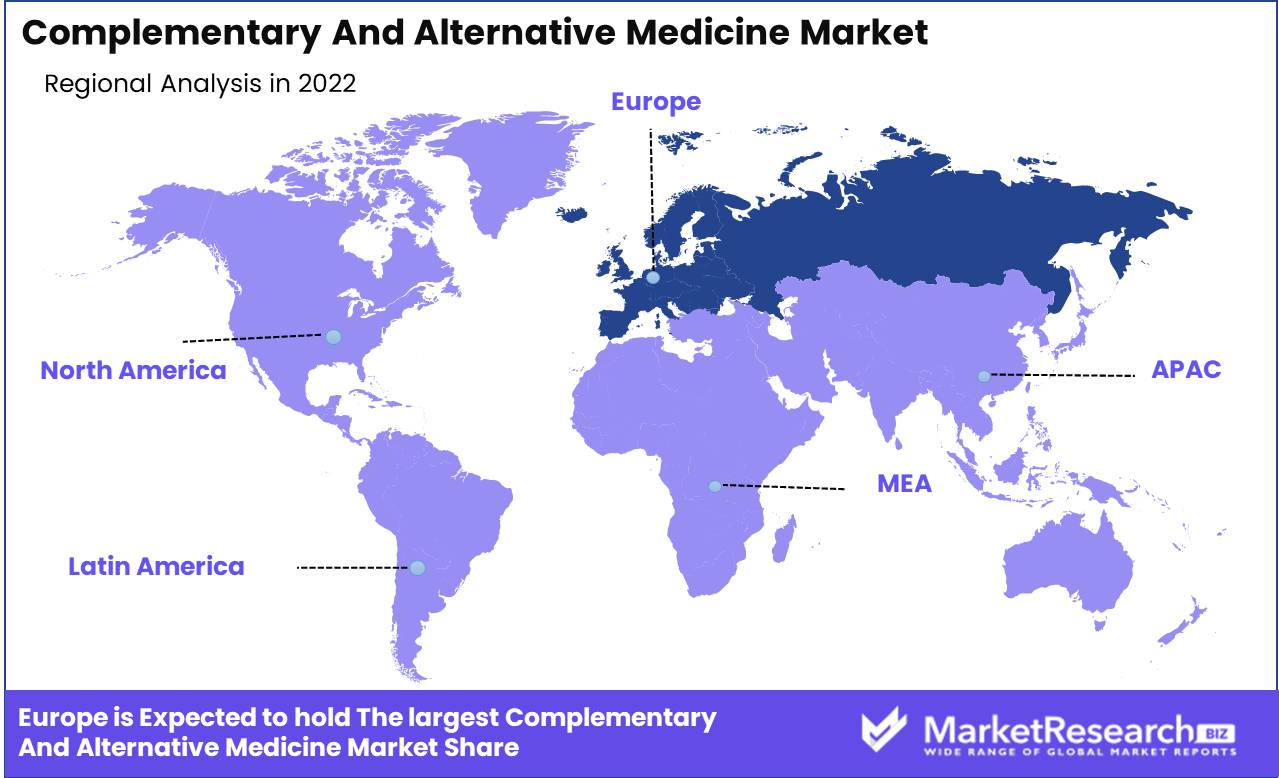
The Global Complementary and Alternative Medicine Market is dominated by Europe.
The market for complementary and alternative medicine (CAM) is expanding rapidly. This demand is driven by rising healthcare costs and an increased preference for non-invasive and natural treatments.
Europe's dominance in the CAM market is attributable to a variety of factors. First, Europeans' increased awareness and acceptance of CAM therapies have played a crucial role. Numerous European nations have a long history of traditional healing practices, which has imparted public confidence and credibility. The high level of government support and regulation of complementary and alternative medicine (CAM) therapies in Europe has fostered an environment of safety and dependability. In addition, a large number of CAM practitioners and clinics offer convenient access to a wide range of therapies throughout Europe.
Homeopathy is one of the most prominent complementary and alternative medicine (CAM) therapies in Europe, with a large number of licensed practitioners and widespread public acceptance. Herbal medicine is also extensively utilized, with a vast selection of herbal supplements widely available throughout Europe. Acupuncture, a traditional Chinese treatment, has also acquired popularity in Europe, where studies have demonstrated its efficacy for a variety of conditions, including chronic pain and mental disorders. Chiropractic, naturopathy, and massage therapy are additional prominent therapies.
Key Regions and Countries
North America
- US
- Canada
- Mexico
Western Europe
- Germany
- France
- The UK
- Spain
- Italy
- Portugal
- Ireland
- Austria
- Switzerland
- Benelux
- Nordic
- Rest of Western Europe
Eastern Europe
- Russia
- Poland
- The Czech Republic
- Greece
- Rest of Eastern Europe
APAC
- China
- Japan
- South Korea
- India
- Australia & New Zealand
- Indonesia
- Malaysia
- Philippines
- Singapore
- Thailand
- Vietnam
- Rest of APAC
Latin America
- Brazil
- Colombia
- Chile
- Argentina
- Costa Rica
- Rest of Latin America
Middle East & Africa
- Algeria
- Egypt
- Israel
- Kuwait
- Nigeria
- Saudi Arabia
- South Africa
- Turkey
- United Arab Emirates
- Rest of MEA
Key Players Analysis
Herb Pharm is a market leader in herbal medication, specializing in the production of high-quality herbal extracts and tinctures. They source their herbs from organic farms that are managed sustainably and employ stringent quality control measures. For their dedication to product efficacy and safety, Herb Pharm has earned a strong reputation. They have a sizable market share and provide a broad range of herbal remedies for a variety of health conditions.
Acupuncture Today is an authoritative publication and online resource devoted to acupuncture and Traditional Chinese Medicine (TCM). They supply acupuncturists and healthcare professionals with current news, research articles, and educational materials. Practitioners in the CAM field have found their platform to be an invaluable source of information and networking opportunities.
NCCIH is a government-funded research institution that conducts and supports scientific research on CAM practices. They strive to provide the general public and healthcare professionals with evidence-based information. The NCCIH plays a crucial role in advancing the comprehension and incorporation of complementary and alternative medicine (CAM) into mainstream healthcare. Their research findings have helped define CAM-related policies and guidelines.
Nature's Sunshine is a global health and wellness company that offers a wide range of complementary and alternative medicine (CAM) products, including dietary supplements, herbal remedies, and essential oils. They have a strong distribution network and an international customer base. Nature's Sunshine places a strong emphasis on quality control and product testing, ensuring that all of its products meet stringent criteria.
Top Key Players in the Complementary and Alternative Medicine Market
- Acupuncture Today
- NCCIH
- Nature's Sunshine
- Dabur India Ltd.
- Weleda AG
- Himalaya Global Holdings Ltd. (Himalaya Herbal Healthcare)
- Spectrum Chemical Manufacturing Corporation
- Quantum-Touch Inc.
- Herb Pharm LLC.
- Arya Vaidya Pharmacy
- Herbal Hills
- PEKANA Naturheilmittel GmbH
- Herbo Nutra
- Unity Woods Yoga Center
Recent Development
- In January 2023, The first acupuncture device for the treatment of chronic pain was approved by the US Food and Drug Administration (FDA). The AqUiRA device employs electrical stimulation to administer acupuncture needles to specific body points.
- In February 2023, the FDA issued a warning letter to a company that was selling tainted botanical supplements. The company was selling products containing controlled substances, including hydrocodone and oxycodone.
- In March 2023, The American College of Physicians (ACP) released new guidelines that recommend yoga as a complementary therapy for chronic low back pain. In people with chronic low back pain, yoga was found to be effective in reducing pain and enhancing function.
- In April 2023, The National Institutes of Health (NIH) announced that it would finance a new study to investigate the efficacy of massage therapy for treating chronic pain. The study will be administered at the University of Pittsburgh and will involve more than one thousand people with chronic pain.
- In May 2023, There is no scientific evidence to support the use of homeopathy for any medical condition, according to a report released by the European Medicines Agency (EMA). Additionally, the EMA determined that some people, including pregnant women and infants, should not take homeopathy.
Report Scope
Report Features Description Market Value (2022) USD 84.1 Bn Forecast Revenue (2032) USD 114.4 Bn CAGR (2023-2032) 3.2% Base Year for Estimation 2022 Historic Period 2016-2022 Forecast Period 2023-2032 Report Coverage Revenue Forecast, Market Dynamics, COVID-19 Impact, Competitive Landscape, Recent Developments Segments Covered Intervention Analysis(Traditional Alternatives, Botanicals, Acupuncture), Distribution Channel Analysis(Retail Stores, Direct Sales, E-commerce, Clinics and Hospitals, Other) Regional Analysis North America – The US, Canada, & Mexico; Western Europe – Germany, France, The UK, Spain, Italy, Portugal, Ireland, Austria, Switzerland, Benelux, Nordic, & Rest of Western Europe; Eastern Europe – Russia, Poland, The Czech Republic, Greece, & Rest of Eastern Europe; APAC – China, Japan, South Korea, India, Australia & New Zealand, Indonesia, Malaysia, Philippines, Singapore, Thailand, Vietnam, & Rest of APAC; Latin America – Brazil, Colombia, Chile, Argentina, Costa Rica, & Rest of Latin America; the Middle East & Africa – Algeria, Egypt, Israel, Kuwait, Nigeria, Saudi Arabia, South Africa, Turkey, United Arab Emirates, & Rest of MEA Competitive Landscape Acupuncture Today, NCCIH, Nature's Sunshine, Dabur India Ltd., Weleda AG, Himalaya Global Holdings Ltd. (Himalaya Herbal Healthcare), Spectrum Chemical Manufacturing Corporation, Quantum-Touch Inc., Herb Pharm LLC., Arya Vaidya Pharmacy, Herbal Hills, PEKANA Naturheilmittel GmbH, Herbo Nutra, Unity Woods Yoga Center Customization Scope Customization for segments, region/country-level will be provided. Moreover, additional customization can be done based on the requirements. Purchase Options We have three licenses to opt for: Single User License, Multi-User License (Up to 5 Users), Corporate Use License (Unlimited User and Printable PDF) -
- 1. Executive Summary
- 1.1. Definition
- 1.2. Taxonomy
- 1.3. Research Scope
- 1.4. Key Analysis
- 1.5. Key Findings by Major Segments
- 1.6. Top strategies by Major Players
- 2. Global Complementary And Alternative Medicine Market Overview
- 2.1. Complementary And Alternative Medicine Market Dynamics
- 2.1.1. Drivers
- 2.1.2. Opportunities
- 2.1.3. Restraints
- 2.1.4. Challenges
- 2.2. Macro-economic Factors
- 2.3. Regulatory Framework
- 2.4. Market Investment Feasibility Index
- 2.5. PEST Analysis
- 2.6. PORTER’S Five Force Analysis
- 2.7. Drivers & Restraints Impact Analysis
- 2.8. Industry Chain Analysis
- 2.9. Cost Structure Analysis
- 2.10. Marketing Strategy
- 2.11. Russia-Ukraine War Impact Analysis
- 2.12. Opportunity Map Analysis
- 2.13. Market Competition Scenario Analysis
- 2.14. Product Life Cycle Analysis
- 2.15. Opportunity Orbits
- 2.16. Manufacturer Intensity Map
- 2.17. Major Companies sales by Value & Volume
- 2.1. Complementary And Alternative Medicine Market Dynamics
- 3. Global Complementary And Alternative Medicine Market Analysis, Opportunity and Forecast, 2016-2032
- 3.1. Global Complementary And Alternative Medicine Market Analysis, 2016-2021
- 3.2. Global Complementary And Alternative Medicine Market Opportunity and Forecast, 2023-2032
- 3.3. Global Complementary And Alternative Medicine Market Analysis, Opportunity and Forecast, By Intervention Analysis, 2016-2032
- 3.3.1. Global Complementary And Alternative Medicine Market Analysis by Intervention Analysis: Introduction
- 3.3.2. Market Size Absolute $ Opportunity Analysis and Forecast, By Intervention Analysis, 2016-2032
- 3.3.3. Traditional Alternatives
- 3.3.4. Botanicals
- 3.3.5. Acupuncture
- 3.3.6. Mind, Body, and Yoga
- 3.3.7. Magnetic Intervention
- 3.4. Global Complementary And Alternative Medicine Market Analysis, Opportunity and Forecast, By Distribution Channel Analysis, 2016-2032
- 3.4.1. Global Complementary And Alternative Medicine Market Analysis by Distribution Channel Analysis: Introduction
- 3.4.2. Market Size Absolute $ Opportunity Analysis and Forecast, By Distribution Channel Analysis, 2016-2032
- 3.4.3. Retail Stores
- 3.4.4. Direct Sales
- 3.4.5. E-commerce
- 3.4.6. Clinics and Hospitals
- 3.4.7. Practitioner Networks
- 3.4.8. Other
- 4. North America Complementary And Alternative Medicine Market Analysis, Opportunity and Forecast, 2016-2032
- 4.1. North America Complementary And Alternative Medicine Market Analysis, 2016-2021
- 4.2. North America Complementary And Alternative Medicine Market Opportunity and Forecast, 2023-2032
- 4.3. North America Complementary And Alternative Medicine Market Analysis, Opportunity and Forecast, By Intervention Analysis, 2016-2032
- 4.3.1. North America Complementary And Alternative Medicine Market Analysis by Intervention Analysis: Introduction
- 4.3.2. Market Size Absolute $ Opportunity Analysis and Forecast, By Intervention Analysis, 2016-2032
- 4.3.3. Traditional Alternatives
- 4.3.4. Botanicals
- 4.3.5. Acupuncture
- 4.3.6. Mind, Body, and Yoga
- 4.3.7. Magnetic Intervention
- 4.4. North America Complementary And Alternative Medicine Market Analysis, Opportunity and Forecast, By Distribution Channel Analysis, 2016-2032
- 4.4.1. North America Complementary And Alternative Medicine Market Analysis by Distribution Channel Analysis: Introduction
- 4.4.2. Market Size Absolute $ Opportunity Analysis and Forecast, By Distribution Channel Analysis, 2016-2032
- 4.4.3. Retail Stores
- 4.4.4. Direct Sales
- 4.4.5. E-commerce
- 4.4.6. Clinics and Hospitals
- 4.4.7. Practitioner Networks
- 4.4.8. Other
- 4.5. North America Complementary And Alternative Medicine Market Analysis, Opportunity and Forecast, By Country , 2016-2032
- 4.5.1. North America Complementary And Alternative Medicine Market Analysis by Country : Introduction
- 4.5.2. Market Size Absolute $ Opportunity Analysis and Forecast, Country , 2016-2032
- 4.5.2.1. The US
- 4.5.2.2. Canada
- 4.5.2.3. Mexico
- 5. Western Europe Complementary And Alternative Medicine Market Analysis, Opportunity and Forecast, 2016-2032
- 5.1. Western Europe Complementary And Alternative Medicine Market Analysis, 2016-2021
- 5.2. Western Europe Complementary And Alternative Medicine Market Opportunity and Forecast, 2023-2032
- 5.3. Western Europe Complementary And Alternative Medicine Market Analysis, Opportunity and Forecast, By Intervention Analysis, 2016-2032
- 5.3.1. Western Europe Complementary And Alternative Medicine Market Analysis by Intervention Analysis: Introduction
- 5.3.2. Market Size Absolute $ Opportunity Analysis and Forecast, By Intervention Analysis, 2016-2032
- 5.3.3. Traditional Alternatives
- 5.3.4. Botanicals
- 5.3.5. Acupuncture
- 5.3.6. Mind, Body, and Yoga
- 5.3.7. Magnetic Intervention
- 5.4. Western Europe Complementary And Alternative Medicine Market Analysis, Opportunity and Forecast, By Distribution Channel Analysis, 2016-2032
- 5.4.1. Western Europe Complementary And Alternative Medicine Market Analysis by Distribution Channel Analysis: Introduction
- 5.4.2. Market Size Absolute $ Opportunity Analysis and Forecast, By Distribution Channel Analysis, 2016-2032
- 5.4.3. Retail Stores
- 5.4.4. Direct Sales
- 5.4.5. E-commerce
- 5.4.6. Clinics and Hospitals
- 5.4.7. Practitioner Networks
- 5.4.8. Other
- 5.5. Western Europe Complementary And Alternative Medicine Market Analysis, Opportunity and Forecast, By Country , 2016-2032
- 5.5.1. Western Europe Complementary And Alternative Medicine Market Analysis by Country : Introduction
- 5.5.2. Market Size Absolute $ Opportunity Analysis and Forecast, Country , 2016-2032
- 5.5.2.1. Germany
- 5.5.2.2. France
- 5.5.2.3. The UK
- 5.5.2.4. Spain
- 5.5.2.5. Italy
- 5.5.2.6. Portugal
- 5.5.2.7. Ireland
- 5.5.2.8. Austria
- 5.5.2.9. Switzerland
- 5.5.2.10. Benelux
- 5.5.2.11. Nordic
- 5.5.2.12. Rest of Western Europe
- 6. Eastern Europe Complementary And Alternative Medicine Market Analysis, Opportunity and Forecast, 2016-2032
- 6.1. Eastern Europe Complementary And Alternative Medicine Market Analysis, 2016-2021
- 6.2. Eastern Europe Complementary And Alternative Medicine Market Opportunity and Forecast, 2023-2032
- 6.3. Eastern Europe Complementary And Alternative Medicine Market Analysis, Opportunity and Forecast, By Intervention Analysis, 2016-2032
- 6.3.1. Eastern Europe Complementary And Alternative Medicine Market Analysis by Intervention Analysis: Introduction
- 6.3.2. Market Size Absolute $ Opportunity Analysis and Forecast, By Intervention Analysis, 2016-2032
- 6.3.3. Traditional Alternatives
- 6.3.4. Botanicals
- 6.3.5. Acupuncture
- 6.3.6. Mind, Body, and Yoga
- 6.3.7. Magnetic Intervention
- 6.4. Eastern Europe Complementary And Alternative Medicine Market Analysis, Opportunity and Forecast, By Distribution Channel Analysis, 2016-2032
- 6.4.1. Eastern Europe Complementary And Alternative Medicine Market Analysis by Distribution Channel Analysis: Introduction
- 6.4.2. Market Size Absolute $ Opportunity Analysis and Forecast, By Distribution Channel Analysis, 2016-2032
- 6.4.3. Retail Stores
- 6.4.4. Direct Sales
- 6.4.5. E-commerce
- 6.4.6. Clinics and Hospitals
- 6.4.7. Practitioner Networks
- 6.4.8. Other
- 6.5. Eastern Europe Complementary And Alternative Medicine Market Analysis, Opportunity and Forecast, By Country , 2016-2032
- 6.5.1. Eastern Europe Complementary And Alternative Medicine Market Analysis by Country : Introduction
- 6.5.2. Market Size Absolute $ Opportunity Analysis and Forecast, Country , 2016-2032
- 6.5.2.1. Russia
- 6.5.2.2. Poland
- 6.5.2.3. The Czech Republic
- 6.5.2.4. Greece
- 6.5.2.5. Rest of Eastern Europe
- 7. APAC Complementary And Alternative Medicine Market Analysis, Opportunity and Forecast, 2016-2032
- 7.1. APAC Complementary And Alternative Medicine Market Analysis, 2016-2021
- 7.2. APAC Complementary And Alternative Medicine Market Opportunity and Forecast, 2023-2032
- 7.3. APAC Complementary And Alternative Medicine Market Analysis, Opportunity and Forecast, By Intervention Analysis, 2016-2032
- 7.3.1. APAC Complementary And Alternative Medicine Market Analysis by Intervention Analysis: Introduction
- 7.3.2. Market Size Absolute $ Opportunity Analysis and Forecast, By Intervention Analysis, 2016-2032
- 7.3.3. Traditional Alternatives
- 7.3.4. Botanicals
- 7.3.5. Acupuncture
- 7.3.6. Mind, Body, and Yoga
- 7.3.7. Magnetic Intervention
- 7.4. APAC Complementary And Alternative Medicine Market Analysis, Opportunity and Forecast, By Distribution Channel Analysis, 2016-2032
- 7.4.1. APAC Complementary And Alternative Medicine Market Analysis by Distribution Channel Analysis: Introduction
- 7.4.2. Market Size Absolute $ Opportunity Analysis and Forecast, By Distribution Channel Analysis, 2016-2032
- 7.4.3. Retail Stores
- 7.4.4. Direct Sales
- 7.4.5. E-commerce
- 7.4.6. Clinics and Hospitals
- 7.4.7. Practitioner Networks
- 7.4.8. Other
- 7.5. APAC Complementary And Alternative Medicine Market Analysis, Opportunity and Forecast, By Country , 2016-2032
- 7.5.1. APAC Complementary And Alternative Medicine Market Analysis by Country : Introduction
- 7.5.2. Market Size Absolute $ Opportunity Analysis and Forecast, Country , 2016-2032
- 7.5.2.1. China
- 7.5.2.2. Japan
- 7.5.2.3. South Korea
- 7.5.2.4. India
- 7.5.2.5. Australia & New Zeland
- 7.5.2.6. Indonesia
- 7.5.2.7. Malaysia
- 7.5.2.8. Philippines
- 7.5.2.9. Singapore
- 7.5.2.10. Thailand
- 7.5.2.11. Vietnam
- 7.5.2.12. Rest of APAC
- 8. Latin America Complementary And Alternative Medicine Market Analysis, Opportunity and Forecast, 2016-2032
- 8.1. Latin America Complementary And Alternative Medicine Market Analysis, 2016-2021
- 8.2. Latin America Complementary And Alternative Medicine Market Opportunity and Forecast, 2023-2032
- 8.3. Latin America Complementary And Alternative Medicine Market Analysis, Opportunity and Forecast, By Intervention Analysis, 2016-2032
- 8.3.1. Latin America Complementary And Alternative Medicine Market Analysis by Intervention Analysis: Introduction
- 8.3.2. Market Size Absolute $ Opportunity Analysis and Forecast, By Intervention Analysis, 2016-2032
- 8.3.3. Traditional Alternatives
- 8.3.4. Botanicals
- 8.3.5. Acupuncture
- 8.3.6. Mind, Body, and Yoga
- 8.3.7. Magnetic Intervention
- 8.4. Latin America Complementary And Alternative Medicine Market Analysis, Opportunity and Forecast, By Distribution Channel Analysis, 2016-2032
- 8.4.1. Latin America Complementary And Alternative Medicine Market Analysis by Distribution Channel Analysis: Introduction
- 8.4.2. Market Size Absolute $ Opportunity Analysis and Forecast, By Distribution Channel Analysis, 2016-2032
- 8.4.3. Retail Stores
- 8.4.4. Direct Sales
- 8.4.5. E-commerce
- 8.4.6. Clinics and Hospitals
- 8.4.7. Practitioner Networks
- 8.4.8. Other
- 8.5. Latin America Complementary And Alternative Medicine Market Analysis, Opportunity and Forecast, By Country , 2016-2032
- 8.5.1. Latin America Complementary And Alternative Medicine Market Analysis by Country : Introduction
- 8.5.2. Market Size Absolute $ Opportunity Analysis and Forecast, Country , 2016-2032
- 8.5.2.1. Brazil
- 8.5.2.2. Colombia
- 8.5.2.3. Chile
- 8.5.2.4. Argentina
- 8.5.2.5. Costa Rica
- 8.5.2.6. Rest of Latin America
- 9. Middle East & Africa Complementary And Alternative Medicine Market Analysis, Opportunity and Forecast, 2016-2032
- 9.1. Middle East & Africa Complementary And Alternative Medicine Market Analysis, 2016-2021
- 9.2. Middle East & Africa Complementary And Alternative Medicine Market Opportunity and Forecast, 2023-2032
- 9.3. Middle East & Africa Complementary And Alternative Medicine Market Analysis, Opportunity and Forecast, By Intervention Analysis, 2016-2032
- 9.3.1. Middle East & Africa Complementary And Alternative Medicine Market Analysis by Intervention Analysis: Introduction
- 9.3.2. Market Size Absolute $ Opportunity Analysis and Forecast, By Intervention Analysis, 2016-2032
- 9.3.3. Traditional Alternatives
- 9.3.4. Botanicals
- 9.3.5. Acupuncture
- 9.3.6. Mind, Body, and Yoga
- 9.3.7. Magnetic Intervention
- 9.4. Middle East & Africa Complementary And Alternative Medicine Market Analysis, Opportunity and Forecast, By Distribution Channel Analysis, 2016-2032
- 9.4.1. Middle East & Africa Complementary And Alternative Medicine Market Analysis by Distribution Channel Analysis: Introduction
- 9.4.2. Market Size Absolute $ Opportunity Analysis and Forecast, By Distribution Channel Analysis, 2016-2032
- 9.4.3. Retail Stores
- 9.4.4. Direct Sales
- 9.4.5. E-commerce
- 9.4.6. Clinics and Hospitals
- 9.4.7. Practitioner Networks
- 9.4.8. Other
- 9.5. Middle East & Africa Complementary And Alternative Medicine Market Analysis, Opportunity and Forecast, By Country , 2016-2032
- 9.5.1. Middle East & Africa Complementary And Alternative Medicine Market Analysis by Country : Introduction
- 9.5.2. Market Size Absolute $ Opportunity Analysis and Forecast, Country , 2016-2032
- 9.5.2.1. Algeria
- 9.5.2.2. Egypt
- 9.5.2.3. Israel
- 9.5.2.4. Kuwait
- 9.5.2.5. Nigeria
- 9.5.2.6. Saudi Arabia
- 9.5.2.7. South Africa
- 9.5.2.8. Turkey
- 9.5.2.9. The UAE
- 9.5.2.10. Rest of MEA
- 10. Global Complementary And Alternative Medicine Market Analysis, Opportunity and Forecast, By Region , 2016-2032
- 10.1. Global Complementary And Alternative Medicine Market Analysis by Region : Introduction
- 10.2. Market Size Absolute $ Opportunity Analysis and Forecast, By Region , 2016-2032
- 10.2.1. North America
- 10.2.2. Western Europe
- 10.2.3. Eastern Europe
- 10.2.4. APAC
- 10.2.5. Latin America
- 10.2.6. Middle East & Africa
- 11. Global Complementary And Alternative Medicine Market Competitive Landscape, Market Share Analysis, and Company Profiles
- 11.1. Market Share Analysis
- 11.2. Company Profiles
- 11.3. Acupuncture Today
- 11.3.1. Company Overview
- 11.3.2. Financial Highlights
- 11.3.3. Product Portfolio
- 11.3.4. SWOT Analysis
- 11.3.5. Key Strategies and Developments
- 11.4. NCCIH
- 11.4.1. Company Overview
- 11.4.2. Financial Highlights
- 11.4.3. Product Portfolio
- 11.4.4. SWOT Analysis
- 11.4.5. Key Strategies and Developments
- 11.5. Nature's Sunshine
- 11.5.1. Company Overview
- 11.5.2. Financial Highlights
- 11.5.3. Product Portfolio
- 11.5.4. SWOT Analysis
- 11.5.5. Key Strategies and Developments
- 11.6. Dabur India Ltd.
- 11.6.1. Company Overview
- 11.6.2. Financial Highlights
- 11.6.3. Product Portfolio
- 11.6.4. SWOT Analysis
- 11.6.5. Key Strategies and Developments
- 11.7. Weleda AG
- 11.7.1. Company Overview
- 11.7.2. Financial Highlights
- 11.7.3. Product Portfolio
- 11.7.4. SWOT Analysis
- 11.7.5. Key Strategies and Developments
- 11.8. Himalaya Global Holdings Ltd. (Himalaya Herbal Healthcare)
- 11.8.1. Company Overview
- 11.8.2. Financial Highlights
- 11.8.3. Product Portfolio
- 11.8.4. SWOT Analysis
- 11.8.5. Key Strategies and Developments
- 11.9. Spectrum Chemical Manufacturing Corporation
- 11.9.1. Company Overview
- 11.9.2. Financial Highlights
- 11.9.3. Product Portfolio
- 11.9.4. SWOT Analysis
- 11.9.5. Key Strategies and Developments
- 11.10. Quantum-Touch Inc.
- 11.10.1. Company Overview
- 11.10.2. Financial Highlights
- 11.10.3. Product Portfolio
- 11.10.4. SWOT Analysis
- 11.10.5. Key Strategies and Developments
- 11.11. Herb Pharm LLC.
- 11.11.1. Company Overview
- 11.11.2. Financial Highlights
- 11.11.3. Product Portfolio
- 11.11.4. SWOT Analysis
- 11.11.5. Key Strategies and Developments
- 11.12. Arya Vaidya Pharmacy
- 11.12.1. Company Overview
- 11.12.2. Financial Highlights
- 11.12.3. Product Portfolio
- 11.12.4. SWOT Analysis
- 11.12.5. Key Strategies and Developments
- 11.13. Herbal Hills
- 11.13.1. Company Overview
- 11.13.2. Financial Highlights
- 11.13.3. Product Portfolio
- 11.13.4. SWOT Analysis
- 11.13.5. Key Strategies and Developments
- 11.14. PEKANA Naturheilmittel GmbH
- 11.14.1. Company Overview
- 11.14.2. Financial Highlights
- 11.14.3. Product Portfolio
- 11.14.4. SWOT Analysis
- 11.14.5. Key Strategies and Developments
- 11.15. Herbo Nutra
- 11.15.1. Company Overview
- 11.15.2. Financial Highlights
- 11.15.3. Product Portfolio
- 11.15.4. SWOT Analysis
- 11.15.5. Key Strategies and Developments
- 11.16. (US$ Mn & Units)y Woods Yoga Center
- 11.16.1. Company Overview
- 11.16.2. Financial Highlights
- 11.16.3. Product Portfolio
- 11.16.4. SWOT Analysis
- 11.16.5. Key Strategies and Developments
- 12. Assumptions and Acronyms
- 13. Research Methodology
- 14. Contact
- List of Figures
- Figure 1: Global Complementary And Alternative Medicine Market Revenue (US$ Mn) Market Share by Intervention Analysis in 2022
- Figure 2: Global Complementary And Alternative Medicine Market Attractiveness Analysis by Intervention Analysis, 2016-2032
- Figure 3: Global Complementary And Alternative Medicine Market Revenue (US$ Mn) Market Share by Distribution Channel Analysisin 2022
- Figure 4: Global Complementary And Alternative Medicine Market Attractiveness Analysis by Distribution Channel Analysis, 2016-2032
- Figure 5: Global Complementary And Alternative Medicine Market Revenue (US$ Mn) Market Share by Region in 2022
- Figure 6: Global Complementary And Alternative Medicine Market Attractiveness Analysis by Region, 2016-2032
- Figure 7: Global Complementary And Alternative Medicine Market Revenue (US$ Mn) (2016-2032)
- Figure 8: Global Complementary And Alternative Medicine Market Revenue (US$ Mn) Comparison by Region (2016-2032)
- Figure 9: Global Complementary And Alternative Medicine Market Revenue (US$ Mn) Comparison by Intervention Analysis (2016-2032)
- Figure 10: Global Complementary And Alternative Medicine Market Revenue (US$ Mn) Comparison by Distribution Channel Analysis (2016-2032)
- Figure 11: Global Complementary And Alternative Medicine Market Y-o-Y Growth Rate Comparison by Region (2016-2032)
- Figure 12: Global Complementary And Alternative Medicine Market Y-o-Y Growth Rate Comparison by Intervention Analysis (2016-2032)
- Figure 13: Global Complementary And Alternative Medicine Market Y-o-Y Growth Rate Comparison by Distribution Channel Analysis (2016-2032)
- Figure 14: Global Complementary And Alternative Medicine Market Share Comparison by Region (2016-2032)
- Figure 15: Global Complementary And Alternative Medicine Market Share Comparison by Intervention Analysis (2016-2032)
- Figure 16: Global Complementary And Alternative Medicine Market Share Comparison by Distribution Channel Analysis (2016-2032)
- Figure 17: North America Complementary And Alternative Medicine Market Revenue (US$ Mn) Market Share by Intervention Analysisin 2022
- Figure 18: North America Complementary And Alternative Medicine Market Attractiveness Analysis by Intervention Analysis, 2016-2032
- Figure 19: North America Complementary And Alternative Medicine Market Revenue (US$ Mn) Market Share by Distribution Channel Analysisin 2022
- Figure 20: North America Complementary And Alternative Medicine Market Attractiveness Analysis by Distribution Channel Analysis, 2016-2032
- Figure 21: North America Complementary And Alternative Medicine Market Revenue (US$ Mn) Market Share by Country in 2022
- Figure 22: North America Complementary And Alternative Medicine Market Attractiveness Analysis by Country, 2016-2032
- Figure 23: North America Complementary And Alternative Medicine Market Revenue (US$ Mn) (2016-2032)
- Figure 24: North America Complementary And Alternative Medicine Market Revenue (US$ Mn) Comparison by Country (2016-2032)
- Figure 25: North America Complementary And Alternative Medicine Market Revenue (US$ Mn) Comparison by Intervention Analysis (2016-2032)
- Figure 26: North America Complementary And Alternative Medicine Market Revenue (US$ Mn) Comparison by Distribution Channel Analysis (2016-2032)
- Figure 27: North America Complementary And Alternative Medicine Market Y-o-Y Growth Rate Comparison by Country (2016-2032)
- Figure 28: North America Complementary And Alternative Medicine Market Y-o-Y Growth Rate Comparison by Intervention Analysis (2016-2032)
- Figure 29: North America Complementary And Alternative Medicine Market Y-o-Y Growth Rate Comparison by Distribution Channel Analysis (2016-2032)
- Figure 30: North America Complementary And Alternative Medicine Market Share Comparison by Country (2016-2032)
- Figure 31: North America Complementary And Alternative Medicine Market Share Comparison by Intervention Analysis (2016-2032)
- Figure 32: North America Complementary And Alternative Medicine Market Share Comparison by Distribution Channel Analysis (2016-2032)
- Figure 33: Western Europe Complementary And Alternative Medicine Market Revenue (US$ Mn) Market Share by Intervention Analysisin 2022
- Figure 34: Western Europe Complementary And Alternative Medicine Market Attractiveness Analysis by Intervention Analysis, 2016-2032
- Figure 35: Western Europe Complementary And Alternative Medicine Market Revenue (US$ Mn) Market Share by Distribution Channel Analysisin 2022
- Figure 36: Western Europe Complementary And Alternative Medicine Market Attractiveness Analysis by Distribution Channel Analysis, 2016-2032
- Figure 37: Western Europe Complementary And Alternative Medicine Market Revenue (US$ Mn) Market Share by Country in 2022
- Figure 38: Western Europe Complementary And Alternative Medicine Market Attractiveness Analysis by Country, 2016-2032
- Figure 39: Western Europe Complementary And Alternative Medicine Market Revenue (US$ Mn) (2016-2032)
- Figure 40: Western Europe Complementary And Alternative Medicine Market Revenue (US$ Mn) Comparison by Country (2016-2032)
- Figure 41: Western Europe Complementary And Alternative Medicine Market Revenue (US$ Mn) Comparison by Intervention Analysis (2016-2032)
- Figure 42: Western Europe Complementary And Alternative Medicine Market Revenue (US$ Mn) Comparison by Distribution Channel Analysis (2016-2032)
- Figure 43: Western Europe Complementary And Alternative Medicine Market Y-o-Y Growth Rate Comparison by Country (2016-2032)
- Figure 44: Western Europe Complementary And Alternative Medicine Market Y-o-Y Growth Rate Comparison by Intervention Analysis (2016-2032)
- Figure 45: Western Europe Complementary And Alternative Medicine Market Y-o-Y Growth Rate Comparison by Distribution Channel Analysis (2016-2032)
- Figure 46: Western Europe Complementary And Alternative Medicine Market Share Comparison by Country (2016-2032)
- Figure 47: Western Europe Complementary And Alternative Medicine Market Share Comparison by Intervention Analysis (2016-2032)
- Figure 48: Western Europe Complementary And Alternative Medicine Market Share Comparison by Distribution Channel Analysis (2016-2032)
- Figure 49: Eastern Europe Complementary And Alternative Medicine Market Revenue (US$ Mn) Market Share by Intervention Analysisin 2022
- Figure 50: Eastern Europe Complementary And Alternative Medicine Market Attractiveness Analysis by Intervention Analysis, 2016-2032
- Figure 51: Eastern Europe Complementary And Alternative Medicine Market Revenue (US$ Mn) Market Share by Distribution Channel Analysisin 2022
- Figure 52: Eastern Europe Complementary And Alternative Medicine Market Attractiveness Analysis by Distribution Channel Analysis, 2016-2032
- Figure 53: Eastern Europe Complementary And Alternative Medicine Market Revenue (US$ Mn) Market Share by Country in 2022
- Figure 54: Eastern Europe Complementary And Alternative Medicine Market Attractiveness Analysis by Country, 2016-2032
- Figure 55: Eastern Europe Complementary And Alternative Medicine Market Revenue (US$ Mn) (2016-2032)
- Figure 56: Eastern Europe Complementary And Alternative Medicine Market Revenue (US$ Mn) Comparison by Country (2016-2032)
- Figure 57: Eastern Europe Complementary And Alternative Medicine Market Revenue (US$ Mn) Comparison by Intervention Analysis (2016-2032)
- Figure 58: Eastern Europe Complementary And Alternative Medicine Market Revenue (US$ Mn) Comparison by Distribution Channel Analysis (2016-2032)
- Figure 59: Eastern Europe Complementary And Alternative Medicine Market Y-o-Y Growth Rate Comparison by Country (2016-2032)
- Figure 60: Eastern Europe Complementary And Alternative Medicine Market Y-o-Y Growth Rate Comparison by Intervention Analysis (2016-2032)
- Figure 61: Eastern Europe Complementary And Alternative Medicine Market Y-o-Y Growth Rate Comparison by Distribution Channel Analysis (2016-2032)
- Figure 62: Eastern Europe Complementary And Alternative Medicine Market Share Comparison by Country (2016-2032)
- Figure 63: Eastern Europe Complementary And Alternative Medicine Market Share Comparison by Intervention Analysis (2016-2032)
- Figure 64: Eastern Europe Complementary And Alternative Medicine Market Share Comparison by Distribution Channel Analysis (2016-2032)
- Figure 65: APAC Complementary And Alternative Medicine Market Revenue (US$ Mn) Market Share by Intervention Analysisin 2022
- Figure 66: APAC Complementary And Alternative Medicine Market Attractiveness Analysis by Intervention Analysis, 2016-2032
- Figure 67: APAC Complementary And Alternative Medicine Market Revenue (US$ Mn) Market Share by Distribution Channel Analysisin 2022
- Figure 68: APAC Complementary And Alternative Medicine Market Attractiveness Analysis by Distribution Channel Analysis, 2016-2032
- Figure 69: APAC Complementary And Alternative Medicine Market Revenue (US$ Mn) Market Share by Country in 2022
- Figure 70: APAC Complementary And Alternative Medicine Market Attractiveness Analysis by Country, 2016-2032
- Figure 71: APAC Complementary And Alternative Medicine Market Revenue (US$ Mn) (2016-2032)
- Figure 72: APAC Complementary And Alternative Medicine Market Revenue (US$ Mn) Comparison by Country (2016-2032)
- Figure 73: APAC Complementary And Alternative Medicine Market Revenue (US$ Mn) Comparison by Intervention Analysis (2016-2032)
- Figure 74: APAC Complementary And Alternative Medicine Market Revenue (US$ Mn) Comparison by Distribution Channel Analysis (2016-2032)
- Figure 75: APAC Complementary And Alternative Medicine Market Y-o-Y Growth Rate Comparison by Country (2016-2032)
- Figure 76: APAC Complementary And Alternative Medicine Market Y-o-Y Growth Rate Comparison by Intervention Analysis (2016-2032)
- Figure 77: APAC Complementary And Alternative Medicine Market Y-o-Y Growth Rate Comparison by Distribution Channel Analysis (2016-2032)
- Figure 78: APAC Complementary And Alternative Medicine Market Share Comparison by Country (2016-2032)
- Figure 79: APAC Complementary And Alternative Medicine Market Share Comparison by Intervention Analysis (2016-2032)
- Figure 80: APAC Complementary And Alternative Medicine Market Share Comparison by Distribution Channel Analysis (2016-2032)
- Figure 81: Latin America Complementary And Alternative Medicine Market Revenue (US$ Mn) Market Share by Intervention Analysisin 2022
- Figure 82: Latin America Complementary And Alternative Medicine Market Attractiveness Analysis by Intervention Analysis, 2016-2032
- Figure 83: Latin America Complementary And Alternative Medicine Market Revenue (US$ Mn) Market Share by Distribution Channel Analysisin 2022
- Figure 84: Latin America Complementary And Alternative Medicine Market Attractiveness Analysis by Distribution Channel Analysis, 2016-2032
- Figure 85: Latin America Complementary And Alternative Medicine Market Revenue (US$ Mn) Market Share by Country in 2022
- Figure 86: Latin America Complementary And Alternative Medicine Market Attractiveness Analysis by Country, 2016-2032
- Figure 87: Latin America Complementary And Alternative Medicine Market Revenue (US$ Mn) (2016-2032)
- Figure 88: Latin America Complementary And Alternative Medicine Market Revenue (US$ Mn) Comparison by Country (2016-2032)
- Figure 89: Latin America Complementary And Alternative Medicine Market Revenue (US$ Mn) Comparison by Intervention Analysis (2016-2032)
- Figure 90: Latin America Complementary And Alternative Medicine Market Revenue (US$ Mn) Comparison by Distribution Channel Analysis (2016-2032)
- Figure 91: Latin America Complementary And Alternative Medicine Market Y-o-Y Growth Rate Comparison by Country (2016-2032)
- Figure 92: Latin America Complementary And Alternative Medicine Market Y-o-Y Growth Rate Comparison by Intervention Analysis (2016-2032)
- Figure 93: Latin America Complementary And Alternative Medicine Market Y-o-Y Growth Rate Comparison by Distribution Channel Analysis (2016-2032)
- Figure 94: Latin America Complementary And Alternative Medicine Market Share Comparison by Country (2016-2032)
- Figure 95: Latin America Complementary And Alternative Medicine Market Share Comparison by Intervention Analysis (2016-2032)
- Figure 96: Latin America Complementary And Alternative Medicine Market Share Comparison by Distribution Channel Analysis (2016-2032)
- Figure 97: Middle East & Africa Complementary And Alternative Medicine Market Revenue (US$ Mn) Market Share by Intervention Analysisin 2022
- Figure 98: Middle East & Africa Complementary And Alternative Medicine Market Attractiveness Analysis by Intervention Analysis, 2016-2032
- Figure 99: Middle East & Africa Complementary And Alternative Medicine Market Revenue (US$ Mn) Market Share by Distribution Channel Analysisin 2022
- Figure 100: Middle East & Africa Complementary And Alternative Medicine Market Attractiveness Analysis by Distribution Channel Analysis, 2016-2032
- Figure 101: Middle East & Africa Complementary And Alternative Medicine Market Revenue (US$ Mn) Market Share by Country in 2022
- Figure 102: Middle East & Africa Complementary And Alternative Medicine Market Attractiveness Analysis by Country, 2016-2032
- Figure 103: Middle East & Africa Complementary And Alternative Medicine Market Revenue (US$ Mn) (2016-2032)
- Figure 104: Middle East & Africa Complementary And Alternative Medicine Market Revenue (US$ Mn) Comparison by Country (2016-2032)
- Figure 105: Middle East & Africa Complementary And Alternative Medicine Market Revenue (US$ Mn) Comparison by Intervention Analysis (2016-2032)
- Figure 106: Middle East & Africa Complementary And Alternative Medicine Market Revenue (US$ Mn) Comparison by Distribution Channel Analysis (2016-2032)
- Figure 107: Middle East & Africa Complementary And Alternative Medicine Market Y-o-Y Growth Rate Comparison by Country (2016-2032)
- Figure 108: Middle East & Africa Complementary And Alternative Medicine Market Y-o-Y Growth Rate Comparison by Intervention Analysis (2016-2032)
- Figure 109: Middle East & Africa Complementary And Alternative Medicine Market Y-o-Y Growth Rate Comparison by Distribution Channel Analysis (2016-2032)
- Figure 110: Middle East & Africa Complementary And Alternative Medicine Market Share Comparison by Country (2016-2032)
- Figure 111: Middle East & Africa Complementary And Alternative Medicine Market Share Comparison by Intervention Analysis (2016-2032)
- Figure 112: Middle East & Africa Complementary And Alternative Medicine Market Share Comparison by Distribution Channel Analysis (2016-2032)
List of Tables
- Table 1: Global Complementary And Alternative Medicine Market Comparison by Intervention Analysis (2016-2032)
- Table 2: Global Complementary And Alternative Medicine Market Comparison by Distribution Channel Analysis (2016-2032)
- Table 3: Global Complementary And Alternative Medicine Market Revenue (US$ Mn) Comparison by Region (2016-2032)
- Table 4: Global Complementary And Alternative Medicine Market Revenue (US$ Mn) (2016-2032)
- Table 5: Global Complementary And Alternative Medicine Market Revenue (US$ Mn) Comparison by Region (2016-2032)
- Table 6: Global Complementary And Alternative Medicine Market Revenue (US$ Mn) Comparison by Intervention Analysis (2016-2032)
- Table 7: Global Complementary And Alternative Medicine Market Revenue (US$ Mn) Comparison by Distribution Channel Analysis (2016-2032)
- Table 8: Global Complementary And Alternative Medicine Market Y-o-Y Growth Rate Comparison by Region (2016-2032)
- Table 9: Global Complementary And Alternative Medicine Market Y-o-Y Growth Rate Comparison by Intervention Analysis (2016-2032)
- Table 10: Global Complementary And Alternative Medicine Market Y-o-Y Growth Rate Comparison by Distribution Channel Analysis (2016-2032)
- Table 11: Global Complementary And Alternative Medicine Market Share Comparison by Region (2016-2032)
- Table 12: Global Complementary And Alternative Medicine Market Share Comparison by Intervention Analysis (2016-2032)
- Table 13: Global Complementary And Alternative Medicine Market Share Comparison by Distribution Channel Analysis (2016-2032)
- Table 14: North America Complementary And Alternative Medicine Market Comparison by Distribution Channel Analysis (2016-2032)
- Table 15: North America Complementary And Alternative Medicine Market Revenue (US$ Mn) Comparison by Country (2016-2032)
- Table 16: North America Complementary And Alternative Medicine Market Revenue (US$ Mn) (2016-2032)
- Table 17: North America Complementary And Alternative Medicine Market Revenue (US$ Mn) Comparison by Country (2016-2032)
- Table 18: North America Complementary And Alternative Medicine Market Revenue (US$ Mn) Comparison by Intervention Analysis (2016-2032)
- Table 19: North America Complementary And Alternative Medicine Market Revenue (US$ Mn) Comparison by Distribution Channel Analysis (2016-2032)
- Table 20: North America Complementary And Alternative Medicine Market Y-o-Y Growth Rate Comparison by Country (2016-2032)
- Table 21: North America Complementary And Alternative Medicine Market Y-o-Y Growth Rate Comparison by Intervention Analysis (2016-2032)
- Table 22: North America Complementary And Alternative Medicine Market Y-o-Y Growth Rate Comparison by Distribution Channel Analysis (2016-2032)
- Table 23: North America Complementary And Alternative Medicine Market Share Comparison by Country (2016-2032)
- Table 24: North America Complementary And Alternative Medicine Market Share Comparison by Intervention Analysis (2016-2032)
- Table 25: North America Complementary And Alternative Medicine Market Share Comparison by Distribution Channel Analysis (2016-2032)
- Table 26: Western Europe Complementary And Alternative Medicine Market Comparison by Intervention Analysis (2016-2032)
- Table 27: Western Europe Complementary And Alternative Medicine Market Comparison by Distribution Channel Analysis (2016-2032)
- Table 28: Western Europe Complementary And Alternative Medicine Market Revenue (US$ Mn) Comparison by Country (2016-2032)
- Table 29: Western Europe Complementary And Alternative Medicine Market Revenue (US$ Mn) (2016-2032)
- Table 30: Western Europe Complementary And Alternative Medicine Market Revenue (US$ Mn) Comparison by Country (2016-2032)
- Table 31: Western Europe Complementary And Alternative Medicine Market Revenue (US$ Mn) Comparison by Intervention Analysis (2016-2032)
- Table 32: Western Europe Complementary And Alternative Medicine Market Revenue (US$ Mn) Comparison by Distribution Channel Analysis (2016-2032)
- Table 33: Western Europe Complementary And Alternative Medicine Market Y-o-Y Growth Rate Comparison by Country (2016-2032)
- Table 34: Western Europe Complementary And Alternative Medicine Market Y-o-Y Growth Rate Comparison by Intervention Analysis (2016-2032)
- Table 35: Western Europe Complementary And Alternative Medicine Market Y-o-Y Growth Rate Comparison by Distribution Channel Analysis (2016-2032)
- Table 36: Western Europe Complementary And Alternative Medicine Market Share Comparison by Country (2016-2032)
- Table 37: Western Europe Complementary And Alternative Medicine Market Share Comparison by Intervention Analysis (2016-2032)
- Table 38: Western Europe Complementary And Alternative Medicine Market Share Comparison by Distribution Channel Analysis (2016-2032)
- Table 39: Eastern Europe Complementary And Alternative Medicine Market Comparison by Intervention Analysis (2016-2032)
- Table 40: Eastern Europe Complementary And Alternative Medicine Market Comparison by Distribution Channel Analysis (2016-2032)
- Table 41: Eastern Europe Complementary And Alternative Medicine Market Revenue (US$ Mn) Comparison by Country (2016-2032)
- Table 42: Eastern Europe Complementary And Alternative Medicine Market Revenue (US$ Mn) (2016-2032)
- Table 43: Eastern Europe Complementary And Alternative Medicine Market Revenue (US$ Mn) Comparison by Country (2016-2032)
- Table 44: Eastern Europe Complementary And Alternative Medicine Market Revenue (US$ Mn) Comparison by Intervention Analysis (2016-2032)
- Table 45: Eastern Europe Complementary And Alternative Medicine Market Revenue (US$ Mn) Comparison by Distribution Channel Analysis (2016-2032)
- Table 46: Eastern Europe Complementary And Alternative Medicine Market Y-o-Y Growth Rate Comparison by Country (2016-2032)
- Table 47: Eastern Europe Complementary And Alternative Medicine Market Y-o-Y Growth Rate Comparison by Intervention Analysis (2016-2032)
- Table 48: Eastern Europe Complementary And Alternative Medicine Market Y-o-Y Growth Rate Comparison by Distribution Channel Analysis (2016-2032)
- Table 49: Eastern Europe Complementary And Alternative Medicine Market Share Comparison by Country (2016-2032)
- Table 50: Eastern Europe Complementary And Alternative Medicine Market Share Comparison by Intervention Analysis (2016-2032)
- Table 51: Eastern Europe Complementary And Alternative Medicine Market Share Comparison by Distribution Channel Analysis (2016-2032)
- Table 52: APAC Complementary And Alternative Medicine Market Comparison by Intervention Analysis (2016-2032)
- Table 53: APAC Complementary And Alternative Medicine Market Comparison by Distribution Channel Analysis (2016-2032)
- Table 54: APAC Complementary And Alternative Medicine Market Revenue (US$ Mn) Comparison by Country (2016-2032)
- Table 55: APAC Complementary And Alternative Medicine Market Revenue (US$ Mn) (2016-2032)
- Table 56: APAC Complementary And Alternative Medicine Market Revenue (US$ Mn) Comparison by Country (2016-2032)
- Table 57: APAC Complementary And Alternative Medicine Market Revenue (US$ Mn) Comparison by Intervention Analysis (2016-2032)
- Table 58: APAC Complementary And Alternative Medicine Market Revenue (US$ Mn) Comparison by Distribution Channel Analysis (2016-2032)
- Table 59: APAC Complementary And Alternative Medicine Market Y-o-Y Growth Rate Comparison by Country (2016-2032)
- Table 60: APAC Complementary And Alternative Medicine Market Y-o-Y Growth Rate Comparison by Intervention Analysis (2016-2032)
- Table 61: APAC Complementary And Alternative Medicine Market Y-o-Y Growth Rate Comparison by Distribution Channel Analysis (2016-2032)
- Table 62: APAC Complementary And Alternative Medicine Market Share Comparison by Country (2016-2032)
- Table 63: APAC Complementary And Alternative Medicine Market Share Comparison by Intervention Analysis (2016-2032)
- Table 64: APAC Complementary And Alternative Medicine Market Share Comparison by Distribution Channel Analysis (2016-2032)
- Table 65: Latin America Complementary And Alternative Medicine Market Comparison by Intervention Analysis (2016-2032)
- Table 66: Latin America Complementary And Alternative Medicine Market Comparison by Distribution Channel Analysis (2016-2032)
- Table 67: Latin America Complementary And Alternative Medicine Market Revenue (US$ Mn) Comparison by Country (2016-2032)
- Table 68: Latin America Complementary And Alternative Medicine Market Revenue (US$ Mn) (2016-2032)
- Table 69: Latin America Complementary And Alternative Medicine Market Revenue (US$ Mn) Comparison by Country (2016-2032)
- Table 70: Latin America Complementary And Alternative Medicine Market Revenue (US$ Mn) Comparison by Intervention Analysis (2016-2032)
- Table 71: Latin America Complementary And Alternative Medicine Market Revenue (US$ Mn) Comparison by Distribution Channel Analysis (2016-2032)
- Table 72: Latin America Complementary And Alternative Medicine Market Y-o-Y Growth Rate Comparison by Country (2016-2032)
- Table 73: Latin America Complementary And Alternative Medicine Market Y-o-Y Growth Rate Comparison by Intervention Analysis (2016-2032)
- Table 74: Latin America Complementary And Alternative Medicine Market Y-o-Y Growth Rate Comparison by Distribution Channel Analysis (2016-2032)
- Table 75: Latin America Complementary And Alternative Medicine Market Share Comparison by Country (2016-2032)
- Table 76: Latin America Complementary And Alternative Medicine Market Share Comparison by Intervention Analysis (2016-2032)
- Table 77: Latin America Complementary And Alternative Medicine Market Share Comparison by Distribution Channel Analysis (2016-2032)
- Table 78: Middle East & Africa Complementary And Alternative Medicine Market Comparison by Intervention Analysis (2016-2032)
- Table 79: Middle East & Africa Complementary And Alternative Medicine Market Comparison by Distribution Channel Analysis (2016-2032)
- Table 80: Middle East & Africa Complementary And Alternative Medicine Market Revenue (US$ Mn) Comparison by Country (2016-2032)
- Table 81: Middle East & Africa Complementary And Alternative Medicine Market Revenue (US$ Mn) (2016-2032)
- Table 82: Middle East & Africa Complementary And Alternative Medicine Market Revenue (US$ Mn) Comparison by Country (2016-2032)
- Table 83: Middle East & Africa Complementary And Alternative Medicine Market Revenue (US$ Mn) Comparison by Intervention Analysis (2016-2032)
- Table 84: Middle East & Africa Complementary And Alternative Medicine Market Revenue (US$ Mn) Comparison by Distribution Channel Analysis (2016-2032)
- Table 85: Middle East & Africa Complementary And Alternative Medicine Market Y-o-Y Growth Rate Comparison by Country (2016-2032)
- Table 86: Middle East & Africa Complementary And Alternative Medicine Market Y-o-Y Growth Rate Comparison by Intervention Analysis (2016-2032)
- Table 87: Middle East & Africa Complementary And Alternative Medicine Market Y-o-Y Growth Rate Comparison by Distribution Channel Analysis (2016-2032)
- Table 88: Middle East & Africa Complementary And Alternative Medicine Market Share Comparison by Country (2016-2032)
- Table 89: Middle East & Africa Complementary And Alternative Medicine Market Share Comparison by Intervention Analysis (2016-2032)
- Table 90: Middle East & Africa Complementary And Alternative Medicine Market Share Comparison by Distribution Channel Analysis (2016-2032)
- 1. Executive Summary
-
- Dabur India Ltd.
- Weleda AG
- Himalaya Global Holdings Ltd. (Himalaya Herbal Healthcare)
- Spectrum Chemical Manufacturing Corporation
- Quantum-Touch Inc.
- Herb Pharm LLC.
- Arya Vaidya Pharmacy
- Herbal Hills
- PEKANA Naturheilmittel GmbH
- Herbo Nutra
- Unity Woods Yoga Center
Our Clients


View Our Licence Options
