Cobalt Market By Product(Cobalt Sulfate, Cobalt Oxide, Cobalt Metal, Others), By Application(Electric Vehicles, Industrial Metals, Industrial Chemicals, Superalloys), By Region And Companies - Industry Segment Outlook, Market Assessment, Competition Scenario, Trends, And Forecast 2024-2033
-
39434
-
Feb 2024
-
179
-


-
This report was compiled by Shreyas Rokade Shreyas Rokade is a seasoned Research Analyst with CMFE, bringing extensive expertise in market research and consulting, with a strong background in Chemical Engineering. Correspondence Team Lead-CMFE Linkedin | Detailed Market research Methodology Our methodology involves a mix of primary research, including interviews with leading mental health experts, and secondary research from reputable medical journals and databases. View Detailed Methodology Page
-
Quick Navigation
Report Overview
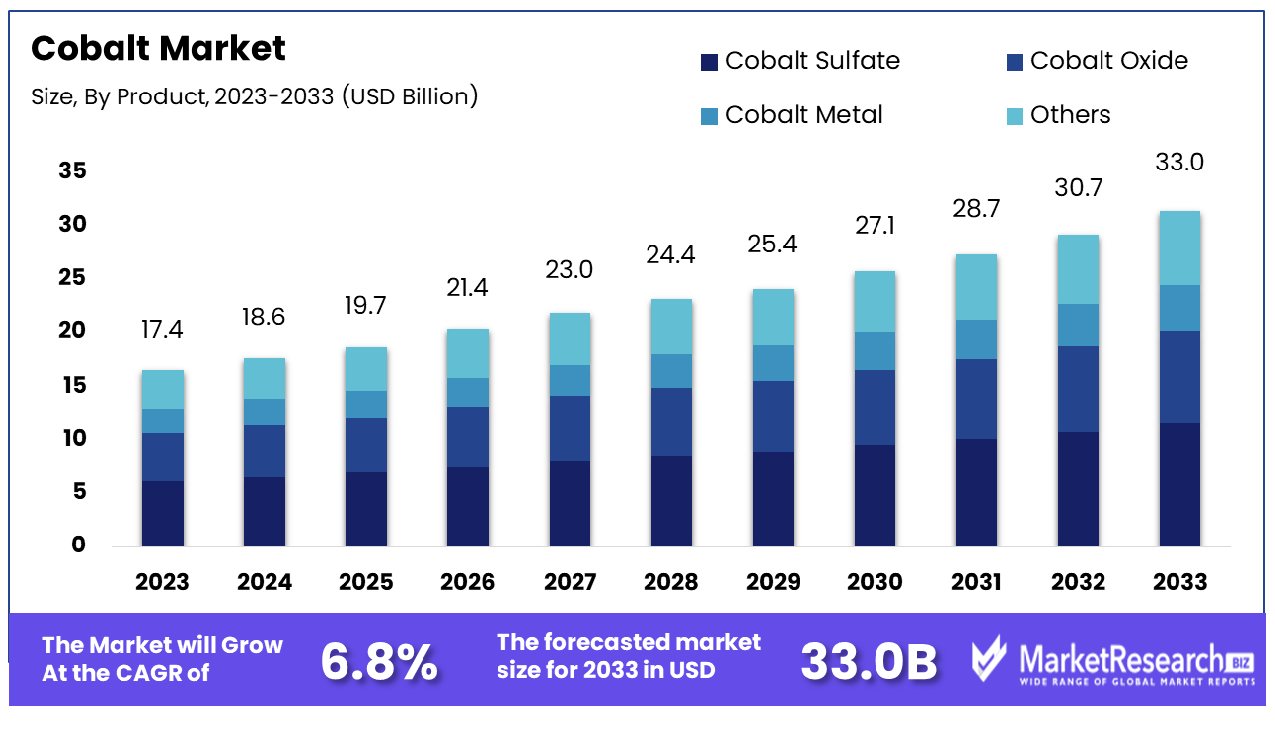
The cobalt market was valued at USD 17.4 billion in 2023. It is expected to reach USD 33.0 billion by 2033, with a CAGR of 6.8% during the forecast period from 2024 to 2033.
The surge in demand for EVs and high investment in the production of lithium batteries are some of the main key driving factors for the cobalt market. Cobalt is defined as a chemical element with the atomic number 27 and the symbol Co. It is a rigid, silver-grey metal and lustrous element that belongs to the change of metals group. It is generally found in the amalgamation with other elements in minerals like cobaltite and erythrite.
It is an important element in the manufacture of rechargeable batteries, specifically in the cathodes of lithium-ion batteries that are present in electric vehicles. Moreover, it plays an important role in the aerospace and medical sectors due to its excellent features and can be used in certain alloys. Regardless of its prominence, certain concerns have risen in the regions where there are issues associated with human rights and environmental sustainability.
According to a report published by Elements. visualcapitalist in January 2023, highlights that the Congo is the largest cobalt producer in the world with 73% global outcome in 2022. Similarly, as per the Cobalt Institute in May 2023, signifies that Indonesia will be the second largest cobalt producer in 2022, by overtaking some of the established countries such as Australia and the Philippines, with 5% of the 2022 supply, Indonesia can augment cobalt production by 10 times by 2030. In 2022, Indonesia’s cobalt production rose by more than 9,500 tonnes from 2,700 tonnes in 2021. Overall, the global cobalt production has reached 197,791 tonnes, with the DRC contributing 145,000 tonnes of that mix. Moreover, in 2022, the electric vehicle (EVs) sector was the top performer and currently it accounts for 40% of the total cobalt market due to its excellent properties. Cobalt-consisting chemistries account for 63% of the cathode demand in 2022.
Cobalt plays a major role in electric vehicles due to its high lithium-ion batteries. The battery cathodes improve the energy density and whole performance. The high energy density permits the EVs to store and offer more power efficiently making the longer driving ranges and enhancing performance.
Key Takeaways
- Market Growth: Cobalt Market was valued at USD 17.4 billion in 2023, It is expected to reach USD 33.0 billion by 2033, with a CAGR of 6.8% during the forecast period from 2024 to 2033.
- By Product: Cobalt sulfate dominates the market segment by product due to its versatile applications and high demand.
- By Application: Electric vehicles dominate the market segment by application, reflecting the growing shift towards sustainable transportation solutions.
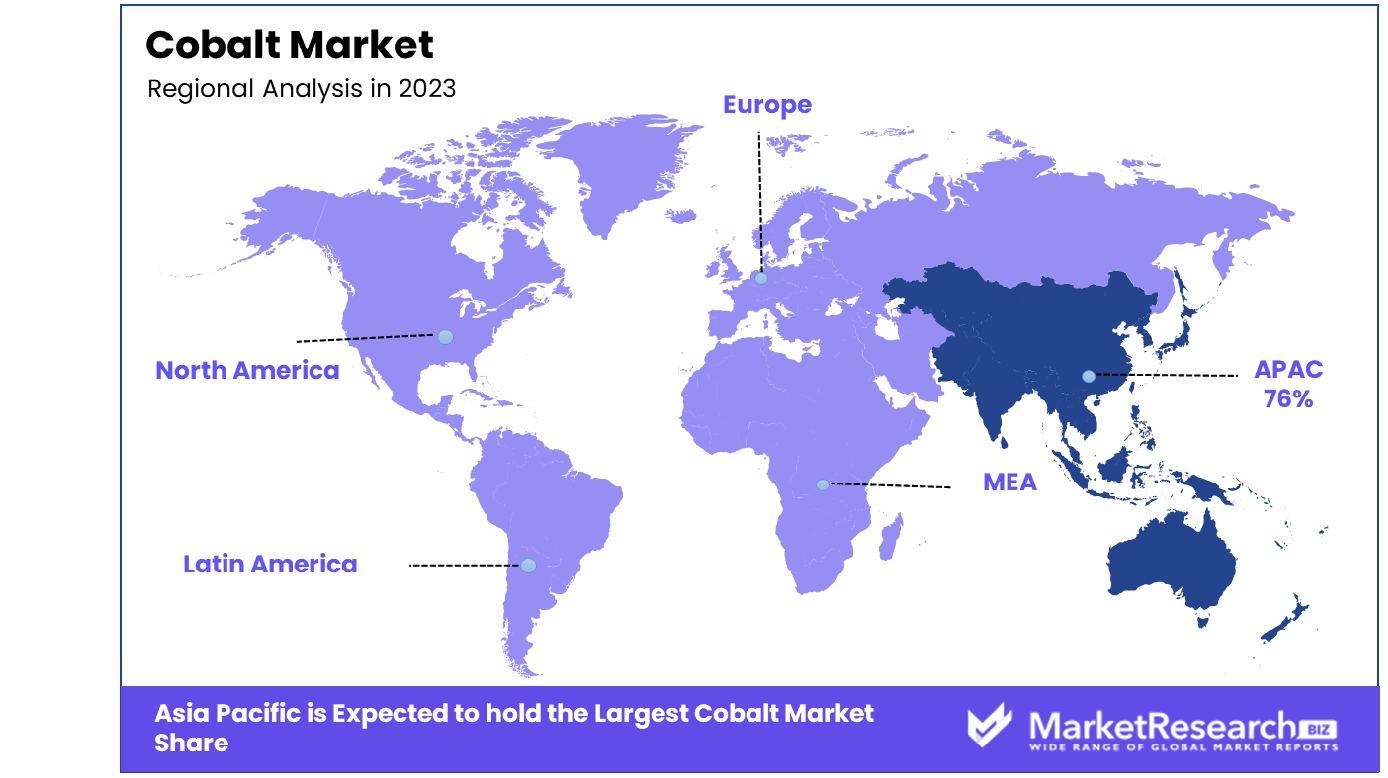
- Regional Dominance: Asia Pacific dominates the cobalt market with a staggering share of 76% in the region.
- Growth Opportunity: The cobalt market expands with rising demand from energy storage systems and aerospace alloys, driven by renewable energy and aerospace innovations.
Driving factors
Lithium-Ion Batteries Fuel Cobalt Market Surge
Cobalt's critical role in lithium-ion battery production underpins its burgeoning demand. These batteries, integral to electric vehicles (EVs) and a plethora of consumer electronics, rely on cobalt for efficient and stable cathodes. The unprecedented rise in EVs and a globally connected digital lifestyle have catapulted lithium-ion batteries to the forefront, directly translating into heightened cobalt consumption. As the world gravitates towards renewable energy and sustainable transportation, this trend is poised to sustain and intensify, underscoring cobalt's indispensability in the modern tech landscape.
Electric Vehicle Revolution Spurs Cobalt Demand
The accelerated global shift towards EVs, propelled by stringent emission standards and governmental subsidies, is a significant catalyst for the cobalt market. With projections suggesting that EV penetration could surpass 30% by 2030, cobalt, a pivotal material in EV batteries, is witnessing escalating demand. This automotive sector revolution, pivoting on environmental sustainability, positions cobalt as an essential commodity, anchoring its market expansion.
Mining Investments Bolster Cobalt Supply
The promising outlook and lucrative prices of cobalt have spurred investments in mining activities, notably in cobalt-rich regions like Africa. Key players like Huayou Cobalt are channeling substantial funds to amplify mining capabilities, projecting a doubling of mining capacity. This surge in mining endeavors is a direct response to cobalt's soaring market demand, ensuring a steady supply chain to meet global needs.
Diverse Applications Broaden Market Reach
Cobalt's utility extends beyond batteries into specialized alloys and superalloys, with growing applications across aerospace, medical, and defense sectors. Its unique properties make it indispensable in high-performance materials, further diversifying its market scope. This expansion into varied industrial realms underscores cobalt's versatility and enduring market relevance.
Restraining Factors
Substitution Risk in Cathode Chemistries Constrains Cobalt Market Expansion
The cobalt market is experiencing a notable challenge due to the evolving nature of cathode chemistries in batteries. To reduce reliance on expensive cobalt, companies like BYD and Tesla are innovating with alternative battery technologies, such as Lithium Iron Phosphate (LFP) and nickel-based batteries. This shift towards cobalt-free or cobalt-reduced solutions presents a substantial substitution risk, potentially curtailing long-term demand for cobalt. As these technologies gain traction and market share, the cobalt industry faces the prospect of diminished demand, reshaping its future growth trajectory.
Geopolitical Risks in Key Producer Regions Impede Cobalt Market Growth
Geopolitical instability and changing mining policies in major cobalt-producing countries, particularly the Democratic Republic of Congo, represent significant risks to the cobalt market. These risks manifest in supply chain disruptions and fluctuations in production output. A notable instance was Glencore's temporary closure of the Mutanda mine in 2019, a response to heightened royalties. Such geopolitical uncertainties create an unstable supply environment, affecting global cobalt availability and pricing. This unpredictability can deter investment and development in the cobalt sector, limiting market growth and leading to cautiousness among stakeholders in the industry.
By Product Analysis
Cobalt Sulfate leads in by by-product segment due to demand.
Cobalt Sulfate stands as the dominant product in the cobalt market. This dominance is primarily attributed to its extensive use in the lithium-ion battery industry, essential for electric vehicles (EVs) and portable electronic devices. Cobalt sulfate offers high thermal stability and enhances the energy density of lithium-ion batteries, making it a crucial component. Its rising demand is closely tied to the burgeoning EV market and the expanding consumer electronics sector.
Other product segments like Cobalt Oxide, Cobalt Metal, and various other cobalt compounds also hold significant positions in the market. Cobalt Oxide is used in ceramics and paints, while Cobalt Metal finds applications in superalloys and tool steels. However, the accelerating shift towards sustainable energy solutions and the growing adoption of EVs globally elevate Cobalt Sulfate as the most sought-after cobalt product.
By Application Analysis
Electric vehicles drive dominance in cobalt's application segment.
Electric Vehicles (EVs) are the dominant application driving the cobalt market. Cobalt, as an integral component of lithium-ion batteries, is pivotal in improving the performance and safety of EV batteries. Its ability to increase energy density and battery life while reducing overheating risks makes it indispensable in the EV sector. The rapid growth of the EV market, spurred by global efforts to reduce carbon emissions and the push for green transportation alternatives, directly influences the demand for cobalt.
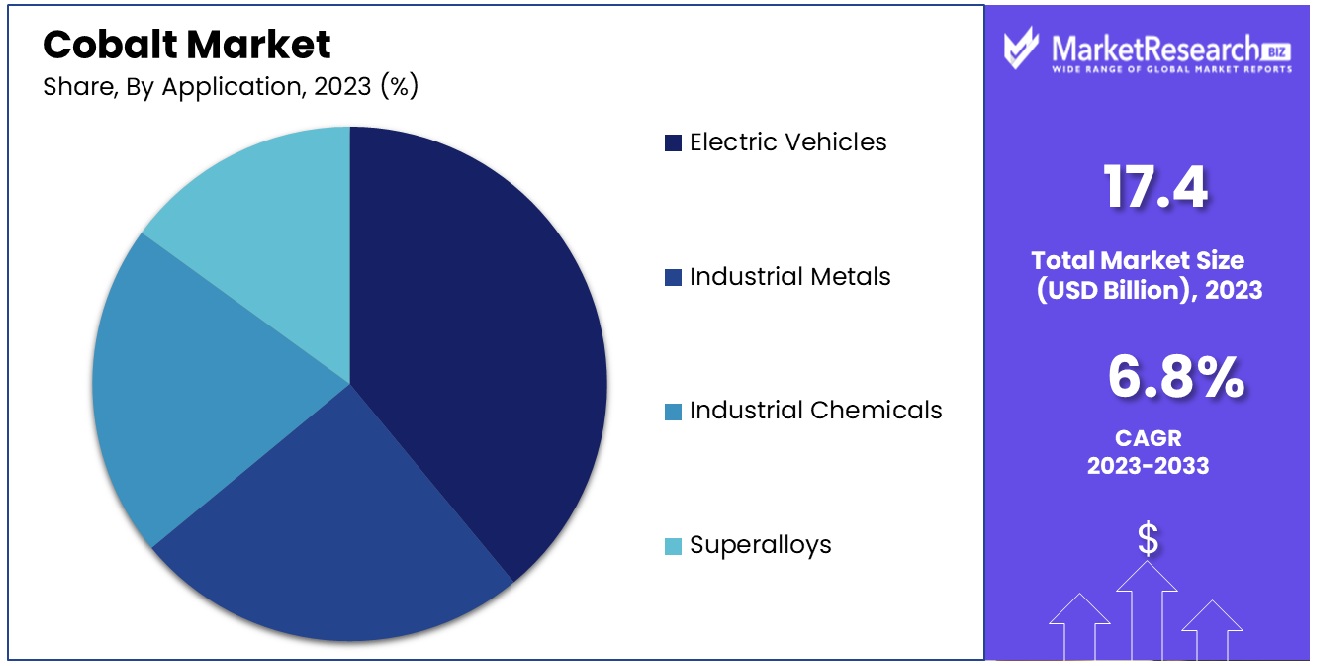
While the Electric Vehicles segment reigns, other applications like Industrial Metals, Industrial Chemicals, and Superalloys also contribute significantly to the cobalt market. Cobalt is a component of Industrial Metals that is used for high-strength alloys, Industrial Chemicals for catalysts and pigments, and also in Superalloys for energy and aerospace applications. However, the rapid growth of EV manufacturing and the vital importance of cobalt within this industry make Electric Vehicles the primary market catalyst for cobalt.
Key Market Segments
By Product
- Cobalt Sulfate
- Cobalt Oxide
- Cobalt Metal
- Others
By Application
- Electric Vehicles
- Industrial Metals
- Industrial Chemicals
- Superalloys
Growth Opportunity
Energy Storage Systems: A Catalyst for Cobalt Market Expansion
The burgeoning demand for energy storage systems, particularly grid-scale lithium-ion batteries, presents a significant opportunity for the cobalt market. With the rapid growth of renewable energy solutions and the need for efficient energy storage, the demand for high-quality, reliable, and ethically sourced cobalt is increasing. Cobalt is a critical component in these batteries, contributing to their stability and efficiency. As governments and industries invest heavily in renewable energy infrastructure, the cobalt market is poised for growth, provided that supply chains can meet the escalating demand while adhering to ethical sourcing practices.
Aerospace Alloys: Fueling Demand in the Cobalt Market
The aerospace industry's shift towards advanced jet engine components and heat-resistant alloys is driving the demand for cobalt. Cobalt's unique properties, including its ability to withstand extreme temperatures and stresses, make it indispensable in next-generation aerospace materials. With companies like Airbus focusing on reducing aircraft CO2 emissions, there is an increasing impetus for innovation in high-performance alloys. This trend not only boosts the cobalt market but also aligns with the broader industry push toward sustainability and efficiency. The commitment to developing more eco-friendly aircraft engines creates a significant growth opportunity for cobalt suppliers.
Latest Trends
Sustainable Sourcing Initiatives
The cobalt market is witnessing a shift towards sustainable sourcing practices, driven by increasing awareness of ethical concerns and environmental impacts. Stakeholders are prioritizing supply chains that adhere to responsible mining practices, including transparency, fair labor standards, and reduced environmental footprint. Companies are actively seeking cobalt from mines with certifications such as the Responsible Cobalt Initiative (RCI) to meet consumer demands for ethically sourced materials.
Technological Advancements in Battery Chemistry
With the rising demand for electric vehicles (EVs) and portable electronics, the cobalt market is experiencing a surge in research and development focused on battery chemistry. Innovations such as cobalt-free and low-cobalt battery technologies are gaining traction, aiming to reduce dependency on cobalt and mitigate supply chain risks. These advancements promise improved battery performance, longevity, and cost-effectiveness, driving the evolution of cobalt usage in energy storage applications.
Regional Analysis
Asia Pacific Dominates with 76% Market Share in the Cobalt Industry
Asia Pacific's overwhelming 76% share in the global cobalt market is primarily driven by its substantial cobalt reserves and the booming electric vehicle (EV) industry, particularly in China. The region is a hub for battery manufacturing, heavily reliant on cobalt for lithium-ion batteries. Additionally, the strong governmental support for EVs and renewable energy initiatives in countries like China and Japan significantly bolsters the demand for cobalt. The presence of major mining and processing facilities, along with growing technological advancements in extraction and processing, further consolidates the region's market dominance.
The cobalt market in Asia Pacific is characterized by a dynamic interplay between supply-demand chains, technological innovation, and regulatory frameworks. The region’s aggressive push towards EVs and sustainable energy solutions has amplified the demand for high-grade cobalt. However, market volatility, ethical sourcing concerns, and fluctuating prices pose challenges. The increasing exploration of cobalt recycling technologies and the development of cobalt-free battery alternatives are also reshaping the market landscape.
Europe’s Position in the Cobalt Market
Europe, with its strong automotive sector, is a significant consumer of cobalt, largely importing from Asia Pacific. The region's commitment to transitioning to electric mobility and the consequent demand for lithium-ion batteries underpin its market position.
North America’s Role in the Cobalt Market
North America, particularly the United States, plays a vital role in the global cobalt market, not only as a consumer but also through its strategic initiatives to secure cobalt supplies for battery production, amidst the burgeoning demand from its automotive and tech industries.
Key Regions and Countries
North America
- The US
- Canada
- Rest of North America
Europe
- Germany
- France
- The UK
- Spain
- Netherlands
- Russia
- Italy
- Rest of Europe
Asia-Pacific
- China
- Japan
- Singapore
- Thailand
- South Korea
- Vietnam
- India
- New Zealand
- Rest of Asia Pacific
Latin America
- Mexico
- Brazil
- Rest of Latin America
Middle East & Africa
- Saudi Arabia
- South Africa
- UAE
- Rest of Middle East & Africa
Key Players Analysis
The cobalt market, critical for the burgeoning electric vehicle (EV) sector and various industrial applications, is shaped by several major players, each with strategic roles across the global supply chain. Glencore PLC stands out due to its vast mining operations and significant contributions to the global cobalt supply, primarily from the Democratic Republic of Congo (DRC), a hotspot for cobalt mining. China Molybdenum Co. Ltd. has also established a strong presence in the DRC, enhancing its global market share through strategic acquisitions and expansion efforts, indicating China's increasing influence in the cobalt sector.
Vale S.A., a diversified mining giant, contributes not only from its cobalt mines but also through nickel operations, where cobalt is a significant byproduct. Gécamines, operating in the DRC, represents state-owned enterprises' pivotal role in the cobalt supply chain, often partnering with international firms to extract and process cobalt. Eurasian Resources Group further solidifies the importance of diversified mining operations in stabilizing cobalt supply, with its activities spread across Africa.
Market Key Players
- Glencore PLC
- China Molybdenum Co. Ltd
- Vale S.A.
- Gécamines
- Eurasian Resources Group
- Zhejiang Huayou Cobalt Co. Ltd
- Umicore
- Jervois Global Limited
- Sherritt International
- Panoramic Resources Limited
- Freeport-McMoRan Inc.
- Cobalt 27 Capital Corp.
- Wheaton Precious Metals Corp.
- Horizonte Minerals Ltd.
- Missouri Cobalt, LLC
Recent Development
- In January 2024, Eurasian Resources Group (ERG) is collaborating with Thara to explore the development of a cobalt sulfate refinery in Saudi Arabia. This initiative aims to strengthen ERG's position as a strategic supplier of cobalt for electric vehicle batteries, aligning with the growing demand for sustainable cobalt sourcing.
- In December 2023, Toshiba Corporation developed a cobalt-free 5V-class high-potential cathode material for lithium-ion batteries, offering enhanced performance, faster charging, and resource conservation, with applications spanning from power tools to electric vehicles.
- In November 2023, Microsoft unveiled Maia and Cobalt chips, entering the AI and general computing hardware markets. Maia targets AI processing, while Cobalt aims for general computing, diversifying Microsoft's offerings and shaping its cloud services.
Report Scope
Report Features Description Market Value (2023) USD 17.4 Billion Forecast Revenue (2033) USD 33.0 Billion CAGR (2024-2032) 6.8% Base Year for Estimation 2023 Historic Period 2016-2023 Forecast Period 2024-2033 Report Coverage Revenue Forecast, Market Dynamics, COVID-19 Impact, Competitive Landscape, Recent Developments Segments Covered By Product(Cobalt Sulfate, Cobalt Oxide, Cobalt Metal, Others), By Application(Electric Vehicles, Industrial Metals, Industrial Chemicals, Superalloys) Regional Analysis North America - The US, Canada, Rest of North America, Europe - Germany, France, The UK, Spain, Italy, Russia, Netherlands, Rest of Europe, Asia-Pacific - China, Japan, South Korea, India, New Zealand, Singapore, Thailand, Vietnam, Rest of Asia Pacific, Latin America - Brazil, Mexico, Rest of Latin America, Middle East & Africa - South Africa, Saudi Arabia, UAE, Rest of Middle East & Africa Competitive Landscape Glencore PLC, China Molybdenum Co. Ltd, Vale S.A., Gécamines, Eurasian Resources Group, Zhejiang Huayou Cobalt Co. Ltd, Umicore, Jervois Global Limited, Sherritt International, Panoramic Resources Limited, Freeport-McMoRan Inc., Cobalt 27 Capital Corp., Wheaton Precious Metals Corp., Horizonte Minerals Ltd., Missouri Cobalt, LLC Customization Scope Customization for segments, region/country-level will be provided. Moreover, additional customization can be done based on the requirements. Purchase Options We have three licenses to opt for Single User License, Multi-User License (Up to 5 Users), Corporate Use License (Unlimited User and Printable PDF) -
-
- Glencore PLC
- China Molybdenum Co. Ltd
- Vale S.A.
- Gécamines
- Eurasian Resources Group
- Zhejiang Huayou Cobalt Co. Ltd
- Umicore
- Jervois Global Limited
- Sherritt International
- Panoramic Resources Limited
- Freeport-McMoRan Inc.
- Cobalt 27 Capital Corp.
- Wheaton Precious Metals Corp.
- Horizonte Minerals Ltd.
- Missouri Cobalt, LLC
Our Clients


View Our Licence Options
