
Chrysin Extract Market Report By Type (Standardized Chrysin Extract, Non-standardized Chrysin Extract), By Application (Anti-inflammatory Supplements, Antioxidant Formulations, Cancer Therapy Adjuvants, Skincare Products), By End Users (Pharmaceutical Companies, Nutraceutical Companies, Cosmetic Companies, Research Institutes), By Region and Companies - Industry Segment Outlook, Market Assessment, Competition Scenario, Trends and Forecast 2024-2033
-
45120
-
April 2024
-
285
-


-
This report was compiled by Trishita Deb Trishita Deb is an experienced market research and consulting professional with over 7 years of expertise across healthcare, consumer goods, and materials, contributing to over 400 healthcare-related reports. Correspondence Team Lead- Healthcare Linkedin | Detailed Market research Methodology Our methodology involves a mix of primary research, including interviews with leading mental health experts, and secondary research from reputable medical journals and databases. View Detailed Methodology Page
-
Quick Navigation
Report Overview
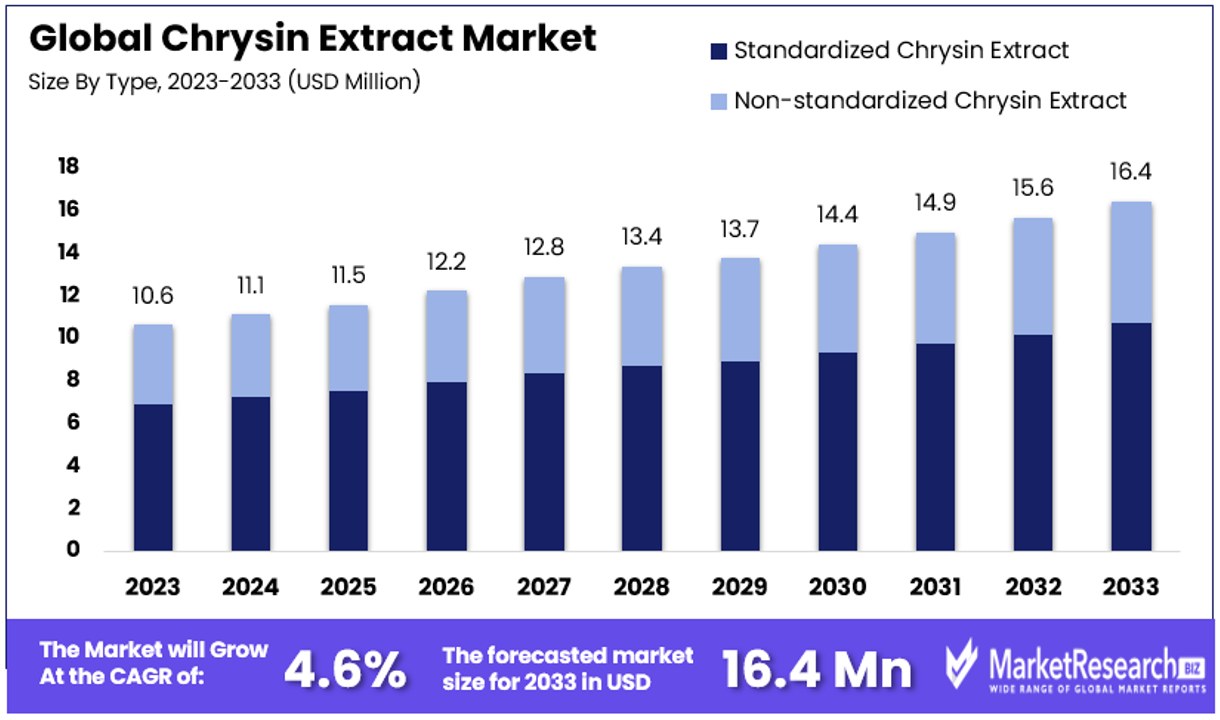
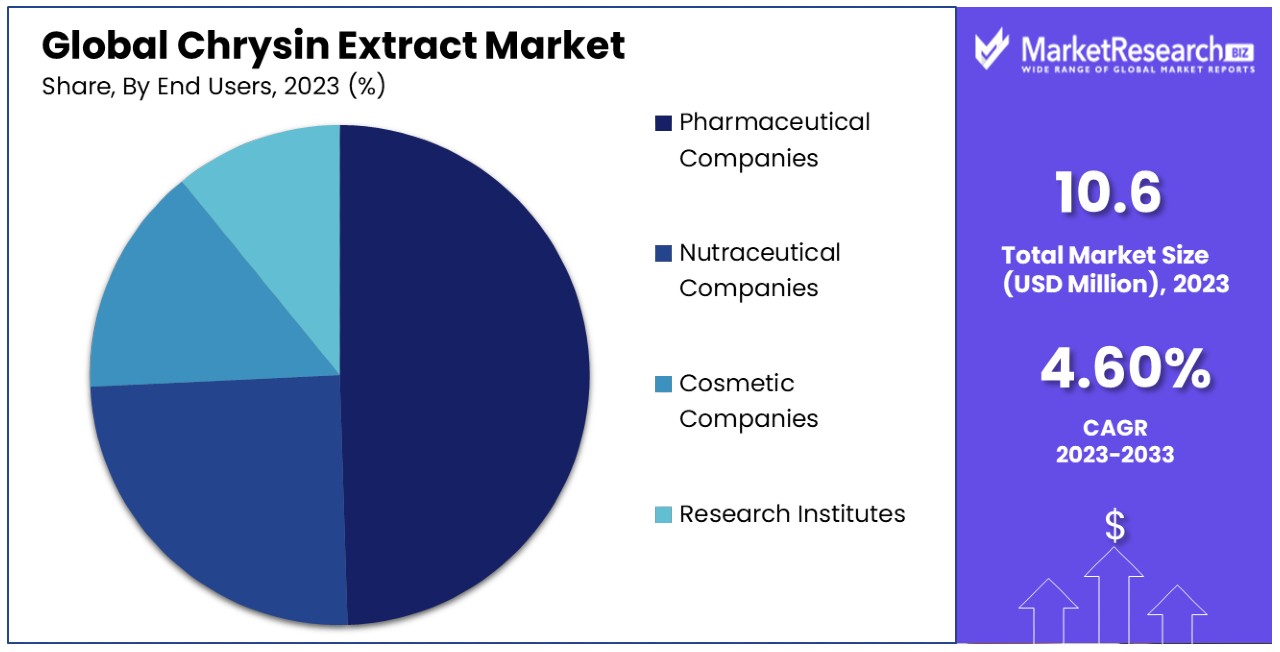
The Global Chrysin Extract Market size is expected to be worth around USD 16.4 Million by 2033, from USD 10.6 Million in 2023, growing at a CAGR of 4.60% during the forecast period from 2024 to 2033.
The Chrysin Extract Market focuses on the production, distribution, and commercialization of chrysin, a naturally occurring flavonoid found in various plants, honey, and propolis. This market serves industries including pharmaceuticals, supplements, and cosmetics, where chrysin is valued for its anti-inflammatory, antioxidant, and potential anti-cancer properties.
Key stakeholders monitor this market for trends in consumer demand, regulatory changes, and technological advancements that may impact product development and strategic positioning. As these leaders navigate the market, they seek opportunities for innovation and competitive differentiation in their respective sectors.
The Chrysin Extract Market is experiencing a notable expansion driven by increasing consumer awareness and demand for natural health products. Primarily extracted from passion flowers, honey, and propolis, chrysin is acclaimed for its anti-inflammatory and antioxidant properties. These features make it a sought-after ingredient in pharmaceuticals, dietary supplements, and cosmetics.
This growth is supported by the rising popularity of natural and organic wellness products among health-conscious consumers. Additionally, ongoing research suggesting potential benefits of chrysin in cancer treatment and hormone balance continues to fuel interest and investment in this sector.
The market's expansion is further catalyzed by improvements in extraction technologies and an increase in the global reach of manufacturers through e-commerce platforms. However, the market faces challenges such as stringent regulatory requirements and the high cost of natural product extraction which may impede market growth.
Product developers and marketers in this sector are advised to focus on strategic collaborations with biotechnology firms and academic institutions to enhance research and development efforts. Furthermore, increasing consumer education about the benefits of chrysin could help in overcoming market penetration barriers.
Staying abreast of the latest market trends, regulatory changes, and technological advancements is crucial. These insights will aid in informed decision-making and strategic planning, ensuring competitive advantage and market leadership in the burgeoning field of natural extracts.
Key Takeaways
- Market Value Projection: The Global Chrysin Extract Market is forecasted to reach USD 16.4 Million by 2033, with a CAGR of 4.60% during the period from 2024 to 2033.
- Type Analysis: Standardized Chrysin Extract holds the majority market share at 65%, driven by its consistent quality and efficacy, especially crucial for pharmaceutical and nutraceutical applications.
- Application Analysis: Anti-inflammatory Supplements lead with a 40% market share, reflecting the growing consumer demand for natural anti-inflammatory products amidst rising health awareness.
- End Users Analysis: Pharmaceutical Companies dominate with a 50% market share, leveraging chrysin in therapeutic formulations due to its potential in treating various ailments and stringent regulatory compliance requirements.
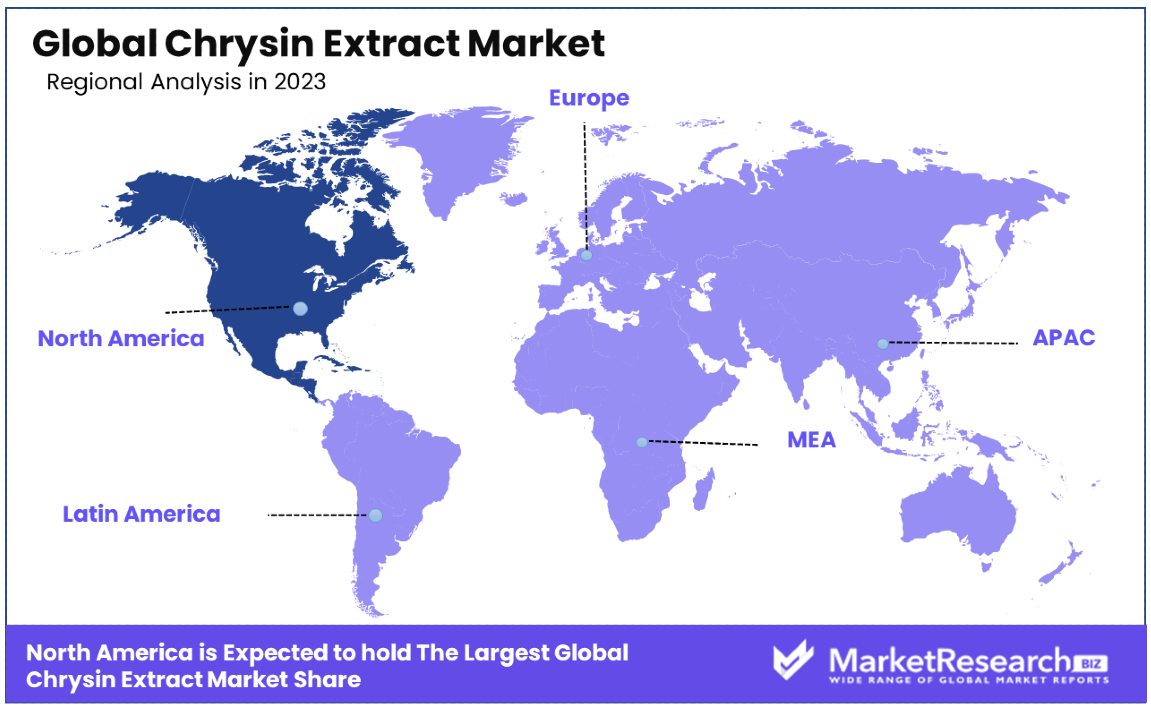
- North America Dominance: North America holds the largest market share at 40%, driven by factors such as stringent regulatory standards, high health awareness, and significant investments in healthcare research and development.
- European Presence: Europe follows closely with a 30% market share, supported by increasing health consciousness and stringent EU regulations favoring natural additives.
- Players: Key players in the Chrysin Extract Market include Xi'an Lyphar Biotech Co., Ltd., Shaanxi Yuantai Biological Technology Co., Ltd., and others, each contributing to the market's growth and innovation.
- Growth Opportunities: There's potential for growth in the non-standardized chrysin extract segment, particularly in less regulated industries like cosmetics, where lower costs may outweigh the need for standardized quality. Exploring new applications beyond traditional uses, such as cancer therapy adjuvants and skincare products, presents opportunities for market expansion and product diversification.
Driving Factors
Rising Demand for Natural Antioxidants Drives Market Growth
The escalating consumer shift towards natural and clean-label products significantly propels the Chrysin Extract Market. Chrysin, a bioflavonoid with potent antioxidant properties, is increasingly utilized in food, beverages, and dietary supplements. This demand is primarily due to chrysin's effectiveness as a natural preservative that enhances the shelf life of perishables such as bakery products and beverages.
As consumers become more health-conscious, they prefer products with ingredients that promise wellness benefits without synthetic additives. This trend not only drives the demand for natural antioxidants but also encourages manufacturers to innovate and expand their natural product lines, thereby boosting market growth.
Pharmaceutical Applications Drive Market Growth
Chrysin's therapeutic potentials in anti-inflammatory, anti-cancer, and neuroprotective treatments are steering its demand in the pharmaceutical sector. Ongoing studies revealing chrysin’s benefits are positioning it as a favorable component in developing pharmaceutical formulations and drugs, especially with the rising prevalence of chronic diseases and conditions like Alzheimer's.
This surge in demand is supported by an increase in healthcare investment and public interest in alternative treatments, integrating chrysin into the broader pharmaceutical industry's growth strategy and fostering a robust development pipeline for chrysin-based medications.
Cosmeceutical Industry Growth Drives Market Growth
The cosmeceutical sector is undergoing rapid growth, fueled by the rising demand for skincare products that are both effective and derived from natural sources. Chrysin extract, known for its anti-aging and skin-brightening properties, is becoming a staple in formulations such as anti-wrinkle creams, serums, and face masks.
This trend is driven by an increasingly informed consumer base that seeks products with specific benefits and transparent ingredient lists. As the cosmeceutical industry thrives, the integration of chrysin extract caters to this niche but growing market segment, enhancing product offerings and contributing to the overall expansion of the market.
Nutraceutical Industry Expansion Drives Market Growth
The nutraceutical industry's steady growth is a testament to the rising health consciousness among consumers worldwide. Chrysin extract is capitalizing on this trend, being incorporated into various dietary supplements and functional foods for its anti-inflammatory and cardioprotective properties.
As consumers increasingly seek health supplements that provide more than basic nutritional benefits, chrysin's inclusion in these products meets the market's demand for multifunctional and health-promoting ingredients. This alignment with consumer preferences and health trends not only enhances product portfolios but also stimulates sustained growth in the nutraceutical market.
Restraining Factors
Regulatory Challenges Restrain Market Growth
The regulatory landscape for natural extracts like chrysin is often complex and varied across different regions. This complexity can significantly hinder the market expansion of chrysin extract. Each industry segment—pharmaceuticals, cosmetics, and food products—faces distinct regulatory frameworks that can delay product launches and increase costs.
Companies are required to invest considerable time and resources to ensure compliance, which can be particularly challenging in regions with stringent and diverse regulations. These regulatory hurdles not only slow down the pace of market entry but also limit the scope of market reach for new and existing chrysin-based products, affecting overall market growth.
Competition from Synthetic Alternatives Restrains Market Growth
Synthetic alternatives present a major challenge to the growth of the natural chrysin extract market. These alternatives often appeal to manufacturers because they are typically less expensive and more readily available than their natural counterparts.
If synthetic compounds can mimic the functional properties of chrysin at a lower cost, industries such as pharmaceuticals and cosmetics might prefer them, especially in cost-sensitive markets. This competition can restrain the market growth of natural chrysin extracts as companies might opt for synthetic options to maintain profitability and price competitiveness. The presence of these alternatives could thus divert potential growth opportunities away from the chrysin extract market.
Type Analysis
Standardized Chrysin Extract dominates with 65% market share due to consistent quality and efficacy.
The Chrysin Extract Market is segmented into standardized and non-standardized extracts, with standardized chrysin extract being the dominant sub-segment. Standardized extracts hold a significant advantage due to their consistent quality and reliable efficacy, which are critical factors in pharmaceutical and nutraceutical applications. These extracts ensure that each batch contains a uniform concentration of chrysin, making them preferable for clinical and therapeutic purposes where dosage accuracy is paramount. This standardization appeals to manufacturers who require consistent product performance to meet regulatory standards and consumer expectations.
Non-standardized chrysin extracts, while cheaper, vary in concentration and potency, making them less desirable for formal medical and health-related applications but more common in less regulated industries such as certain cosmetic applications. The demand for non-standardized extracts depends largely on industries where lower costs outweigh the need for precise bioactive consistency. However, the superior reliability of standardized extracts continues to drive their dominance in the market, particularly as consumers and regulatory bodies push for higher quality standards and traceability in health products.
Application Analysis
Anti-inflammatory Supplements lead with a 40% market share due to the growing consumer demand for natural anti-inflammatory products.
In terms of application, the Chrysin Extract Market sees significant segmentation with anti-inflammatory supplements, antioxidant formulations, cancer therapy adjuvants, and skincare products. Anti-inflammatory supplements are the leading sub-segment, driven by the increasing consumer shift towards natural health solutions and the growing awareness of the adverse effects associated with synthetic anti-inflammatory drugs. Chrysin’s natural anti-inflammatory properties make it a popular choice among consumers seeking safer alternatives for chronic inflammation management, which supports its strong position in the market.
Other notable applications include its use in antioxidant formulations, which capitalize on chrysin's ability to combat oxidative stress and support overall health. In cancer therapy, chrysin is studied as an adjuvant to enhance the efficacy of conventional treatments and reduce side effects. The skincare industry also utilizes chrysin in products aimed at reducing inflammation and enhancing skin appearance. While these segments contribute significantly to the market, the robust growth in the natural supplements sector particularly underscores the dominance of anti-inflammatory products.
End Users Analysis
Pharmaceutical Companies are the largest end-user segment with 50% market share, driven by the integration of chrysin in therapeutic formulations.
The end-user segment of the Chrysin Extract Market is largely dominated by pharmaceutical companies, nutraceutical companies, cosmetic companies, and research institutes. Pharmaceutical companies emerge as the largest segment due to their extensive use of chrysin in developing medications aimed at treating a variety of ailments, including those requiring anti-inflammatory and cancer-fighting properties. The rigorous standards and substantial investments in R&D in the pharmaceutical sector facilitate the high adoption rate of standardized chrysin extracts, which are preferred for their reliability and regulatory compliance.
Nutraceutical companies also represent a significant portion of the market, leveraging chrysin's health-enhancing properties in dietary supplements. Cosmetic companies are incorporating chrysin into skincare products, particularly those aimed at anti-aging and skin health. Research institutes, although a smaller segment, play a crucial role in exploring new applications and benefits of chrysin, which can lead to expanded market opportunities. Despite the strong presence of other end-users, the pharmaceutical sector's stringent requirements and broad consumer base make it the predominant market driver.
Key Market Segments
By Type
- Standardized Chrysin Extract
- Non-standardized Chrysin Extract
By Application
- Anti-inflammatory Supplements
- Antioxidant Formulations
- Cancer Therapy Adjuvants
- Skincare Products
By End Users
- Pharmaceutical Companies
- Nutraceutical Companies
- Cosmetic Companies
- Research Institutes
Growth Opportunities
Product Innovation and Diversification Offers Growth Opportunity
The versatility of chrysin extract in various applications presents significant growth opportunities for the Chrysin Extract Market. This natural compound is increasingly incorporated into diverse product lines including functional foods, beverages, skincare products, and even animal feed additives, expanding its market reach.
For instance, the potential development of chrysin-infused energy drinks or sports nutrition products taps into the growing consumer interest in natural performance enhancers and wellness-oriented products. Such innovation not only meets current market demands but also opens new demographic segments, such as fitness enthusiasts and health-conscious consumers, thereby broadening the potential consumer base and driving market growth.
Strategic Partnerships and Collaborations Offers Growth Opportunity
Strategic partnerships and collaborations are pivotal in catalyzing the Chrysin Extract Market's growth. By aligning with research institutions, ingredient suppliers, and manufacturers, companies can leverage collective expertise and resources, which enhances product development and market penetration.
For example, a collaboration between a chrysin extract supplier and a cosmetics company could lead to the creation of a new anti-aging skincare line. These partnerships facilitate knowledge exchange, improve supply chain efficiencies, and expand distribution networks, ultimately enabling companies to innovate and capture larger market shares. This strategy not only fosters market expansion but also strengthens competitive positioning within the industry.
Trending Factors
Clean Label and Natural Ingredient Demand Are Trending Factors
The demand for clean labels and natural ingredients continues to surge, significantly influencing market trends across the food, beverage, and personal care industries. Chrysin extract, as a natural bioflavonoid, aligns seamlessly with this trend, offering manufacturers an opportunity to incorporate a sought-after ingredient that meets consumer preferences for transparency and minimal processing.
This trend not only supports market expansion by attracting health-conscious consumers but also positions chrysin as a key component in new product developments. The shift towards natural ingredients is a response to the growing consumer awareness of health and wellness, making products containing chrysin extract more appealing to a broad audience.
Personalized Nutrition and Targeted Supplementation Are Trending Factors
The trend towards personalized nutrition and targeted supplementation has become increasingly popular, shaping significant market opportunities in the health and wellness sector. Chrysin extract, known for its anti-inflammatory, cognitive, and skincare benefits, is ideally suited for inclusion in customized supplement formulations.
This trend capitalizes on the consumer's desire for health products tailored to their specific health needs and lifestyle preferences. By integrating chrysin extract into personalized nutrition products, companies can cater to niche markets and individual preferences, expanding their customer base and enhancing product relevance in a competitive market. This approach not only responds to consumer trends but also encourages ongoing innovation within the industry.
Regional Analysis
North America Dominates with 40% Market Share
North America holds a dominant 40% share of the global Chrysin Extract Market, primarily due to the region's strong emphasis on health and wellness, coupled with high consumer spending power. The presence of major pharmaceutical and nutraceutical companies, which are continuously investing in natural and clean-label ingredients, further propels this dominance. Regulatory support for natural supplements and advanced healthcare research infrastructure also play crucial roles in fostering market growth within this region.
The market dynamics in North America are influenced by an increasingly health-conscious population that demands natural and effective supplements for health management. This consumer behavior drives the region's manufacturers to innovate and expand their range of natural products. Additionally, the well-established retail and online distribution channels effectively cater to the growing demand, ensuring easy accessibility of chrysin-containing products to consumers.
North America is expected to maintain its significant influence on the Chrysin Extract Market due to ongoing trends in health and wellness and the aging population. The region's continued investment in research and development is likely to yield advanced chrysin formulations, further cementing its leadership position. The increasing consumer preference for personalized and preventive healthcare solutions will also drive the demand for chrysin-based products.
Regional Market Shares:
- Europe: Europe follows closely with a 30% market share, driven by rising health awareness and stringent EU regulations supporting natural additives.
- Asia Pacific: This region accounts for 20% of the market, with growth fueled by increasing disposable incomes and the expanding presence of local manufacturers.
- Middle East & Africa: Holding 5% of the market, this region's growth is tempered by less developed health supplement markets but shows potential due to rising health awareness.
- Latin America: With 5% market share, Latin America is gradually picking up pace as awareness and demand for natural health products increase.
Key Regions and Countries
- North America
- The US
- Canada
- Mexico
- Western Europe
- Germany
- France
- The UK
- Spain
- Italy
- Portugal
- Ireland
- Austria
- Switzerland
- Benelux
- Nordic
- Rest of Western Europe
- Eastern Europe
- Russia
- Poland
- The Czech Republic
- Greece
- Rest of Eastern Europe
- APAC
- China
- Japan
- South Korea
- India
- Australia & New Zealand
- Indonesia
- Malaysia
- Philippines
- Singapore
- Thailand
- Vietnam
- Rest of APAC
- Latin America
- Brazil
- Colombia
- Chile
- Argentina
- Costa Rica
- Rest of Latin America
- Middle East & Africa
- Algeria
- Egypt
- Israel
- Kuwait
- Nigeria
- Saudi Arabia
- South Africa
- Turkey
- United Arab Emirates
- Rest of MEA
Key Players Analysis
In the burgeoning Chrysin Extract Market, companies like Xi'an Lyphar Biotech Co., Ltd., Shaanxi Yuantai Biological Technology Co., Ltd., Shanghai Soyoung Biotechnology Inc., Xi'an Saina Biological Technology Co., Ltd., Shaanxi Fuheng (FH) Biotechnology Co., Ltd., Changsha Herbway Biotech Co., Ltd., Hunan Nutrmax Inc., Hangzhou Greensky Biological Tech Co., Ltd., Chengdu PRF Medication Research Co., Ltd., and Xi'an Natural Field Bio-Technique Co., Ltd., are key players influencing the industry trends and market scenario.
These firms are recognized for their in-depth analysis and detailed analysis of the market, contributing extensively to the understanding of pharmacological activities associated with Chrysin, particularly its role as an estrogen blocker. Chrysin is celebrated for its health benefits, acting as a rich source of compounds that potentially regulate estrogen levels and stimulate luteinizing hormone and follicle-stimulating hormone—making it a valuable component in both the dietary supplement and bodybuilding industries.
The strategic positioning of these companies leverages their expertise in natural herbs, particularly Organic Herb, which is essential in crafting high-quality, health nutritional products. This positioning is critical as it aligns with the growing demand in the dietary supplement industry and the specific demand in the bodybuilding industry, where the natural enhancement of hormone levels is highly prized.
Market size and competitiveness are driven by these companies' continuous engagement with industry experts and their commitment to quantitative analysis, which ensures they remain aligned with market needs and consumer expectations. Their efforts in research and development not only bolster the market competitive landscape but also ensure they stay at the forefront of market innovations.
As the market for Chrysin Extract expands, these companies are expected to continue their trajectory of growth, fueled by robust industry trends and a deep understanding of market dynamics. Their collective influence is poised to steer the market towards further expansion, cementing their roles as leaders in the natural extract sector.
Market Key Players
- Xi'an Lyphar Biotech Co., Ltd.
- Shaanxi Yuantai Biological Technology Co., Ltd.
- Shanghai Soyoung Biotechnology Inc.
- Xi'an Saina Biological Technology Co., Ltd.
- Shaanxi Fuheng (FH) Biotechnology Co., Ltd.
- Changsha Herbway Biotech Co., Ltd.
- Hunan Nutrmax Inc.
- Hangzhou Greensky Biological Tech Co., Ltd.
- Chengdu PRF Medication Research Co., Ltd.
- Xi'an Natural Field Bio-Technique Co., Ltd.
Recent Developments
- On December 2023, the article "Pyrotinib and chrysin synergistically potentiate autophagy in HER2-positive breast cancer" was published in Signal Transduction and Targeted Therapy. The study found that the combination of pyrotinib and chrysin significantly increased autophagy in HER2-positive breast cancer cells, suggesting a potential therapeutic strategy for this type of cancer.
- On September 2022, the article "Potential protective effects of chrysin against immunotoxicity induced by diazinon" was published in Scientific Reports. The study found that chrysin, a natural flavonoid, may have protective effects against immunotoxicity induced by diazinon, an organophosphorus pesticide.
Report Scope
Report Features Description Market Value (2023) USD 10.6 Million Forecast Revenue (2033) USD 16.4 Million CAGR (2024-2033) 4.60% Base Year for Estimation 2023 Historic Period 2018-2023 Forecast Period 2024-2033 Report Coverage Revenue Forecast, Market Dynamics, Competitive Landscape, Recent Developments Segments Covered By Type (Standardized Chrysin Extract, Non-standardized Chrysin Extract), By Application (Anti-inflammatory Supplements, Antioxidant Formulations, Cancer Therapy Adjuvants, Skincare Products), By End Users (Pharmaceutical Companies, Nutraceutical Companies, Cosmetic Companies, Research Institutes) Regional Analysis North America - The US, Canada, & Mexico; Western Europe - Germany, France, The UK, Spain, Italy, Portugal, Ireland, Austria, Switzerland, Benelux, Nordic, & Rest of Western Europe; Eastern Europe - Russia, Poland, The Czech Republic, Greece, & Rest of Eastern Europe; APAC - China, Japan, South Korea, India, Australia & New Zealand, Indonesia, Malaysia, Philippines, Singapore, Thailand, Vietnam, & Rest of APAC; Latin America - Brazil, Colombia, Chile, Argentina, Costa Rica, & Rest of Latin America; Middle East & Africa - Algeria, Egypt, Israel, Kuwait, Nigeria, Saudi Arabia, South Africa, Turkey, United Arab Emirates, & Rest of MEA Competitive Landscape Xi'an Lyphar Biotech Co., Ltd., Shaanxi Yuantai Biological Technology Co., Ltd., Shanghai Soyoung Biotechnology Inc., Xi'an Saina Biological Technology Co., Ltd., Shaanxi Fuheng (FH) Biotechnology Co., Ltd., Changsha Herbway Biotech Co., Ltd., Hunan Nutrmax Inc., Hangzhou Greensky Biological Tech Co., Ltd., Chengdu PRF Medication Research Co., Ltd., Xi'an Natural Field Bio-Technique Co., Ltd. Customization Scope Customization for segments, region/country-level will be provided. Moreover, additional customization can be done based on the requirements. Purchase Options We have three licenses to opt for: Single User License, Multi-User License (Up to 5 Users), Corporate Use License (Unlimited User and Printable PDF) -
- 1. Executive Summary
- 1.1. Definition
- 1.2. Taxonomy
- 1.3. Research Scope
- 1.4. Key Analysis
- 1.5. Key Findings by Major Segments
- 1.6. Top strategies by Major Players
- 2. Global Chrysin Extract Market Overview
- 2.1. Chrysin Extract Market Dynamics
- 2.1.1. Drivers
- 2.1.2. Opportunities
- 2.1.3. Restraints
- 2.1.4. Challenges
- 2.2. Macro-economic Factors
- 2.3. Regulatory Framework
- 2.4. Market Investment Feasibility Index
- 2.5. PEST Analysis
- 2.6. PORTER’S Five Force Analysis
- 2.7. Drivers & Restraints Impact Analysis
- 2.8. Industry Chain Analysis
- 2.9. Cost Structure Analysis
- 2.10. Marketing Strategy
- 2.11. Russia-Ukraine War Impact Analysis
- 2.12. Opportunity Map Analysis
- 2.13. Market Competition Scenario Analysis
- 2.14. Product Life Cycle Analysis
- 2.15. Opportunity Orbits
- 2.16. Manufacturer Intensity Map
- 2.17. Major Companies sales by Value & Volume
- 2.1. Chrysin Extract Market Dynamics
- 3. Global Chrysin Extract Market Analysis, Opportunity and Forecast, 2016-2032
- 3.1. Global Chrysin Extract Market Analysis, 2016-2021
- 3.2. Global Chrysin Extract Market Opportunity and Forecast, 2023-2032
- 3.3. Global Chrysin Extract Market Analysis, Opportunity and Forecast, By Type, 2016-2032
- 3.3.1. Global Chrysin Extract Market Analysis by Type: Introduction
- 3.3.2. Market Size Absolute $ Opportunity Analysis and Forecast, By Type, 2016-2032
- 3.3.3. Standardized Chrysin Extract
- 3.3.4. Non-standardized Chrysin Extract
- 3.4. Global Chrysin Extract Market Analysis, Opportunity and Forecast, By Application, 2016-2032
- 3.4.1. Global Chrysin Extract Market Analysis by Application: Introduction
- 3.4.2. Market Size Absolute $ Opportunity Analysis and Forecast, By Application, 2016-2032
- 3.4.3. Anti-inflammatory Supplements
- 3.4.4. Antioxidant Formulations
- 3.4.5. Cancer Therapy Adjuvants
- 3.4.6. Skincare Products
- 3.5. Global Chrysin Extract Market Analysis, Opportunity and Forecast, By End Users, 2016-2032
- 3.5.1. Global Chrysin Extract Market Analysis by End Users: Introduction
- 3.5.2. Market Size Absolute $ Opportunity Analysis and Forecast, By End Users, 2016-2032
- 3.5.3. Pharmaceutical Companies
- 3.5.4. Nutraceutical Companies
- 3.5.5. Cosmetic Companies
- 3.5.6. Research Institutes
- 4. North America Chrysin Extract Market Analysis, Opportunity and Forecast, 2016-2032
- 4.1. North America Chrysin Extract Market Analysis, 2016-2021
- 4.2. North America Chrysin Extract Market Opportunity and Forecast, 2023-2032
- 4.3. North America Chrysin Extract Market Analysis, Opportunity and Forecast, By Type, 2016-2032
- 4.3.1. North America Chrysin Extract Market Analysis by Type: Introduction
- 4.3.2. Market Size Absolute $ Opportunity Analysis and Forecast, By Type, 2016-2032
- 4.3.3. Standardized Chrysin Extract
- 4.3.4. Non-standardized Chrysin Extract
- 4.4. North America Chrysin Extract Market Analysis, Opportunity and Forecast, By Application, 2016-2032
- 4.4.1. North America Chrysin Extract Market Analysis by Application: Introduction
- 4.4.2. Market Size Absolute $ Opportunity Analysis and Forecast, By Application, 2016-2032
- 4.4.3. Anti-inflammatory Supplements
- 4.4.4. Antioxidant Formulations
- 4.4.5. Cancer Therapy Adjuvants
- 4.4.6. Skincare Products
- 4.5. North America Chrysin Extract Market Analysis, Opportunity and Forecast, By End Users, 2016-2032
- 4.5.1. North America Chrysin Extract Market Analysis by End Users: Introduction
- 4.5.2. Market Size Absolute $ Opportunity Analysis and Forecast, By End Users, 2016-2032
- 4.5.3. Pharmaceutical Companies
- 4.5.4. Nutraceutical Companies
- 4.5.5. Cosmetic Companies
- 4.5.6. Research Institutes
- 4.6. North America Chrysin Extract Market Analysis, Opportunity and Forecast, By Country , 2016-2032
- 4.6.1. North America Chrysin Extract Market Analysis by Country : Introduction
- 4.6.2. Market Size Absolute $ Opportunity Analysis and Forecast, Country , 2016-2032
- 4.6.2.1. The US
- 4.6.2.2. Canada
- 4.6.2.3. Mexico
- 5. Western Europe Chrysin Extract Market Analysis, Opportunity and Forecast, 2016-2032
- 5.1. Western Europe Chrysin Extract Market Analysis, 2016-2021
- 5.2. Western Europe Chrysin Extract Market Opportunity and Forecast, 2023-2032
- 5.3. Western Europe Chrysin Extract Market Analysis, Opportunity and Forecast, By Type, 2016-2032
- 5.3.1. Western Europe Chrysin Extract Market Analysis by Type: Introduction
- 5.3.2. Market Size Absolute $ Opportunity Analysis and Forecast, By Type, 2016-2032
- 5.3.3. Standardized Chrysin Extract
- 5.3.4. Non-standardized Chrysin Extract
- 5.4. Western Europe Chrysin Extract Market Analysis, Opportunity and Forecast, By Application, 2016-2032
- 5.4.1. Western Europe Chrysin Extract Market Analysis by Application: Introduction
- 5.4.2. Market Size Absolute $ Opportunity Analysis and Forecast, By Application, 2016-2032
- 5.4.3. Anti-inflammatory Supplements
- 5.4.4. Antioxidant Formulations
- 5.4.5. Cancer Therapy Adjuvants
- 5.4.6. Skincare Products
- 5.5. Western Europe Chrysin Extract Market Analysis, Opportunity and Forecast, By End Users, 2016-2032
- 5.5.1. Western Europe Chrysin Extract Market Analysis by End Users: Introduction
- 5.5.2. Market Size Absolute $ Opportunity Analysis and Forecast, By End Users, 2016-2032
- 5.5.3. Pharmaceutical Companies
- 5.5.4. Nutraceutical Companies
- 5.5.5. Cosmetic Companies
- 5.5.6. Research Institutes
- 5.6. Western Europe Chrysin Extract Market Analysis, Opportunity and Forecast, By Country , 2016-2032
- 5.6.1. Western Europe Chrysin Extract Market Analysis by Country : Introduction
- 5.6.2. Market Size Absolute $ Opportunity Analysis and Forecast, Country , 2016-2032
- 5.6.2.1. Germany
- 5.6.2.2. France
- 5.6.2.3. The UK
- 5.6.2.4. Spain
- 5.6.2.5. Italy
- 5.6.2.6. Portugal
- 5.6.2.7. Ireland
- 5.6.2.8. Austria
- 5.6.2.9. Switzerland
- 5.6.2.10. Benelux
- 5.6.2.11. Nordic
- 5.6.2.12. Rest of Western Europe
- 6. Eastern Europe Chrysin Extract Market Analysis, Opportunity and Forecast, 2016-2032
- 6.1. Eastern Europe Chrysin Extract Market Analysis, 2016-2021
- 6.2. Eastern Europe Chrysin Extract Market Opportunity and Forecast, 2023-2032
- 6.3. Eastern Europe Chrysin Extract Market Analysis, Opportunity and Forecast, By Type, 2016-2032
- 6.3.1. Eastern Europe Chrysin Extract Market Analysis by Type: Introduction
- 6.3.2. Market Size Absolute $ Opportunity Analysis and Forecast, By Type, 2016-2032
- 6.3.3. Standardized Chrysin Extract
- 6.3.4. Non-standardized Chrysin Extract
- 6.4. Eastern Europe Chrysin Extract Market Analysis, Opportunity and Forecast, By Application, 2016-2032
- 6.4.1. Eastern Europe Chrysin Extract Market Analysis by Application: Introduction
- 6.4.2. Market Size Absolute $ Opportunity Analysis and Forecast, By Application, 2016-2032
- 6.4.3. Anti-inflammatory Supplements
- 6.4.4. Antioxidant Formulations
- 6.4.5. Cancer Therapy Adjuvants
- 6.4.6. Skincare Products
- 6.5. Eastern Europe Chrysin Extract Market Analysis, Opportunity and Forecast, By End Users, 2016-2032
- 6.5.1. Eastern Europe Chrysin Extract Market Analysis by End Users: Introduction
- 6.5.2. Market Size Absolute $ Opportunity Analysis and Forecast, By End Users, 2016-2032
- 6.5.3. Pharmaceutical Companies
- 6.5.4. Nutraceutical Companies
- 6.5.5. Cosmetic Companies
- 6.5.6. Research Institutes
- 6.6. Eastern Europe Chrysin Extract Market Analysis, Opportunity and Forecast, By Country , 2016-2032
- 6.6.1. Eastern Europe Chrysin Extract Market Analysis by Country : Introduction
- 6.6.2. Market Size Absolute $ Opportunity Analysis and Forecast, Country , 2016-2032
- 6.6.2.1. Russia
- 6.6.2.2. Poland
- 6.6.2.3. The Czech Republic
- 6.6.2.4. Greece
- 6.6.2.5. Rest of Eastern Europe
- 7. APAC Chrysin Extract Market Analysis, Opportunity and Forecast, 2016-2032
- 7.1. APAC Chrysin Extract Market Analysis, 2016-2021
- 7.2. APAC Chrysin Extract Market Opportunity and Forecast, 2023-2032
- 7.3. APAC Chrysin Extract Market Analysis, Opportunity and Forecast, By Type, 2016-2032
- 7.3.1. APAC Chrysin Extract Market Analysis by Type: Introduction
- 7.3.2. Market Size Absolute $ Opportunity Analysis and Forecast, By Type, 2016-2032
- 7.3.3. Standardized Chrysin Extract
- 7.3.4. Non-standardized Chrysin Extract
- 7.4. APAC Chrysin Extract Market Analysis, Opportunity and Forecast, By Application, 2016-2032
- 7.4.1. APAC Chrysin Extract Market Analysis by Application: Introduction
- 7.4.2. Market Size Absolute $ Opportunity Analysis and Forecast, By Application, 2016-2032
- 7.4.3. Anti-inflammatory Supplements
- 7.4.4. Antioxidant Formulations
- 7.4.5. Cancer Therapy Adjuvants
- 7.4.6. Skincare Products
- 7.5. APAC Chrysin Extract Market Analysis, Opportunity and Forecast, By End Users, 2016-2032
- 7.5.1. APAC Chrysin Extract Market Analysis by End Users: Introduction
- 7.5.2. Market Size Absolute $ Opportunity Analysis and Forecast, By End Users, 2016-2032
- 7.5.3. Pharmaceutical Companies
- 7.5.4. Nutraceutical Companies
- 7.5.5. Cosmetic Companies
- 7.5.6. Research Institutes
- 7.6. APAC Chrysin Extract Market Analysis, Opportunity and Forecast, By Country , 2016-2032
- 7.6.1. APAC Chrysin Extract Market Analysis by Country : Introduction
- 7.6.2. Market Size Absolute $ Opportunity Analysis and Forecast, Country , 2016-2032
- 7.6.2.1. China
- 7.6.2.2. Japan
- 7.6.2.3. South Korea
- 7.6.2.4. India
- 7.6.2.5. Australia & New Zeland
- 7.6.2.6. Indonesia
- 7.6.2.7. Malaysia
- 7.6.2.8. Philippines
- 7.6.2.9. Singapore
- 7.6.2.10. Thailand
- 7.6.2.11. Vietnam
- 7.6.2.12. Rest of APAC
- 8. Latin America Chrysin Extract Market Analysis, Opportunity and Forecast, 2016-2032
- 8.1. Latin America Chrysin Extract Market Analysis, 2016-2021
- 8.2. Latin America Chrysin Extract Market Opportunity and Forecast, 2023-2032
- 8.3. Latin America Chrysin Extract Market Analysis, Opportunity and Forecast, By Type, 2016-2032
- 8.3.1. Latin America Chrysin Extract Market Analysis by Type: Introduction
- 8.3.2. Market Size Absolute $ Opportunity Analysis and Forecast, By Type, 2016-2032
- 8.3.3. Standardized Chrysin Extract
- 8.3.4. Non-standardized Chrysin Extract
- 8.4. Latin America Chrysin Extract Market Analysis, Opportunity and Forecast, By Application, 2016-2032
- 8.4.1. Latin America Chrysin Extract Market Analysis by Application: Introduction
- 8.4.2. Market Size Absolute $ Opportunity Analysis and Forecast, By Application, 2016-2032
- 8.4.3. Anti-inflammatory Supplements
- 8.4.4. Antioxidant Formulations
- 8.4.5. Cancer Therapy Adjuvants
- 8.4.6. Skincare Products
- 8.5. Latin America Chrysin Extract Market Analysis, Opportunity and Forecast, By End Users, 2016-2032
- 8.5.1. Latin America Chrysin Extract Market Analysis by End Users: Introduction
- 8.5.2. Market Size Absolute $ Opportunity Analysis and Forecast, By End Users, 2016-2032
- 8.5.3. Pharmaceutical Companies
- 8.5.4. Nutraceutical Companies
- 8.5.5. Cosmetic Companies
- 8.5.6. Research Institutes
- 8.6. Latin America Chrysin Extract Market Analysis, Opportunity and Forecast, By Country , 2016-2032
- 8.6.1. Latin America Chrysin Extract Market Analysis by Country : Introduction
- 8.6.2. Market Size Absolute $ Opportunity Analysis and Forecast, Country , 2016-2032
- 8.6.2.1. Brazil
- 8.6.2.2. Colombia
- 8.6.2.3. Chile
- 8.6.2.4. Argentina
- 8.6.2.5. Costa Rica
- 8.6.2.6. Rest of Latin America
- 9. Middle East & Africa Chrysin Extract Market Analysis, Opportunity and Forecast, 2016-2032
- 9.1. Middle East & Africa Chrysin Extract Market Analysis, 2016-2021
- 9.2. Middle East & Africa Chrysin Extract Market Opportunity and Forecast, 2023-2032
- 9.3. Middle East & Africa Chrysin Extract Market Analysis, Opportunity and Forecast, By Type, 2016-2032
- 9.3.1. Middle East & Africa Chrysin Extract Market Analysis by Type: Introduction
- 9.3.2. Market Size Absolute $ Opportunity Analysis and Forecast, By Type, 2016-2032
- 9.3.3. Standardized Chrysin Extract
- 9.3.4. Non-standardized Chrysin Extract
- 9.4. Middle East & Africa Chrysin Extract Market Analysis, Opportunity and Forecast, By Application, 2016-2032
- 9.4.1. Middle East & Africa Chrysin Extract Market Analysis by Application: Introduction
- 9.4.2. Market Size Absolute $ Opportunity Analysis and Forecast, By Application, 2016-2032
- 9.4.3. Anti-inflammatory Supplements
- 9.4.4. Antioxidant Formulations
- 9.4.5. Cancer Therapy Adjuvants
- 9.4.6. Skincare Products
- 9.5. Middle East & Africa Chrysin Extract Market Analysis, Opportunity and Forecast, By End Users, 2016-2032
- 9.5.1. Middle East & Africa Chrysin Extract Market Analysis by End Users: Introduction
- 9.5.2. Market Size Absolute $ Opportunity Analysis and Forecast, By End Users, 2016-2032
- 9.5.3. Pharmaceutical Companies
- 9.5.4. Nutraceutical Companies
- 9.5.5. Cosmetic Companies
- 9.5.6. Research Institutes
- 9.6. Middle East & Africa Chrysin Extract Market Analysis, Opportunity and Forecast, By Country , 2016-2032
- 9.6.1. Middle East & Africa Chrysin Extract Market Analysis by Country : Introduction
- 9.6.2. Market Size Absolute $ Opportunity Analysis and Forecast, Country , 2016-2032
- 9.6.2.1. Algeria
- 9.6.2.2. Egypt
- 9.6.2.3. Israel
- 9.6.2.4. Kuwait
- 9.6.2.5. Nigeria
- 9.6.2.6. Saudi Arabia
- 9.6.2.7. South Africa
- 9.6.2.8. Turkey
- 9.6.2.9. The UAE
- 9.6.2.10. Rest of MEA
- 10. Global Chrysin Extract Market Analysis, Opportunity and Forecast, By Region , 2016-2032
- 10.1. Global Chrysin Extract Market Analysis by Region : Introduction
- 10.2. Market Size Absolute $ Opportunity Analysis and Forecast, By Region , 2016-2032
- 10.2.1. North America
- 10.2.2. Western Europe
- 10.2.3. Eastern Europe
- 10.2.4. APAC
- 10.2.5. Latin America
- 10.2.6. Middle East & Africa
- 11. Global Chrysin Extract Market Competitive Landscape, Market Share Analysis, and Company Profiles
- 11.1. Market Share Analysis
- 11.2. Company Profiles
- 11.13.1. Company Overview
- 11.13.2. Financial Highlights
- 11.13.3. Product Portfolio
- 11.13.4. SWOT Analysis
- 11.13.5. Key Strategies and Developments
- 12. Assumptions and Acronyms
- 13. Research Methodology
- 14. Contact
- List of Figures
- Figure 1: Global Chrysin Extract Market Revenue (US$ Mn) Market Share by Type in 2022
- Figure 2: Global Chrysin Extract Market Attractiveness Analysis by Type, 2016-2032
- Figure 3: Global Chrysin Extract Market Revenue (US$ Mn) Market Share by Applicationin 2022
- Figure 4: Global Chrysin Extract Market Attractiveness Analysis by Application, 2016-2032
- Figure 5: Global Chrysin Extract Market Revenue (US$ Mn) Market Share by End Usersin 2022
- Figure 6: Global Chrysin Extract Market Attractiveness Analysis by End Users, 2016-2032
- Figure 7: Global Chrysin Extract Market Revenue (US$ Mn) Market Share by Region in 2022
- Figure 8: Global Chrysin Extract Market Attractiveness Analysis by Region, 2016-2032
- Figure 9: Global Chrysin Extract Market Revenue (US$ Mn) (2016-2032)
- Figure 10: Global Chrysin Extract Market Revenue (US$ Mn) Comparison by Region (2016-2032)
- Figure 11: Global Chrysin Extract Market Revenue (US$ Mn) Comparison by Type (2016-2032)
- Figure 12: Global Chrysin Extract Market Revenue (US$ Mn) Comparison by Application (2016-2032)
- Figure 13: Global Chrysin Extract Market Revenue (US$ Mn) Comparison by End Users (2016-2032)
- Figure 14: Global Chrysin Extract Market Y-o-Y Growth Rate Comparison by Region (2016-2032)
- Figure 15: Global Chrysin Extract Market Y-o-Y Growth Rate Comparison by Type (2016-2032)
- Figure 16: Global Chrysin Extract Market Y-o-Y Growth Rate Comparison by Application (2016-2032)
- Figure 17: Global Chrysin Extract Market Y-o-Y Growth Rate Comparison by End Users (2016-2032)
- Figure 18: Global Chrysin Extract Market Share Comparison by Region (2016-2032)
- Figure 19: Global Chrysin Extract Market Share Comparison by Type (2016-2032)
- Figure 20: Global Chrysin Extract Market Share Comparison by Application (2016-2032)
- Figure 21: Global Chrysin Extract Market Share Comparison by End Users (2016-2032)
- Figure 22: North America Chrysin Extract Market Revenue (US$ Mn) Market Share by Typein 2022
- Figure 23: North America Chrysin Extract Market Attractiveness Analysis by Type, 2016-2032
- Figure 24: North America Chrysin Extract Market Revenue (US$ Mn) Market Share by Applicationin 2022
- Figure 25: North America Chrysin Extract Market Attractiveness Analysis by Application, 2016-2032
- Figure 26: North America Chrysin Extract Market Revenue (US$ Mn) Market Share by End Usersin 2022
- Figure 27: North America Chrysin Extract Market Attractiveness Analysis by End Users, 2016-2032
- Figure 28: North America Chrysin Extract Market Revenue (US$ Mn) Market Share by Country in 2022
- Figure 29: North America Chrysin Extract Market Attractiveness Analysis by Country, 2016-2032
- Figure 30: North America Chrysin Extract Market Revenue (US$ Mn) (2016-2032)
- Figure 31: North America Chrysin Extract Market Revenue (US$ Mn) Comparison by Country (2016-2032)
- Figure 32: North America Chrysin Extract Market Revenue (US$ Mn) Comparison by Type (2016-2032)
- Figure 33: North America Chrysin Extract Market Revenue (US$ Mn) Comparison by Application (2016-2032)
- Figure 34: North America Chrysin Extract Market Revenue (US$ Mn) Comparison by End Users (2016-2032)
- Figure 35: North America Chrysin Extract Market Y-o-Y Growth Rate Comparison by Country (2016-2032)
- Figure 36: North America Chrysin Extract Market Y-o-Y Growth Rate Comparison by Type (2016-2032)
- Figure 37: North America Chrysin Extract Market Y-o-Y Growth Rate Comparison by Application (2016-2032)
- Figure 38: North America Chrysin Extract Market Y-o-Y Growth Rate Comparison by End Users (2016-2032)
- Figure 39: North America Chrysin Extract Market Share Comparison by Country (2016-2032)
- Figure 40: North America Chrysin Extract Market Share Comparison by Type (2016-2032)
- Figure 41: North America Chrysin Extract Market Share Comparison by Application (2016-2032)
- Figure 42: North America Chrysin Extract Market Share Comparison by End Users (2016-2032)
- Figure 43: Western Europe Chrysin Extract Market Revenue (US$ Mn) Market Share by Typein 2022
- Figure 44: Western Europe Chrysin Extract Market Attractiveness Analysis by Type, 2016-2032
- Figure 45: Western Europe Chrysin Extract Market Revenue (US$ Mn) Market Share by Applicationin 2022
- Figure 46: Western Europe Chrysin Extract Market Attractiveness Analysis by Application, 2016-2032
- Figure 47: Western Europe Chrysin Extract Market Revenue (US$ Mn) Market Share by End Usersin 2022
- Figure 48: Western Europe Chrysin Extract Market Attractiveness Analysis by End Users, 2016-2032
- Figure 49: Western Europe Chrysin Extract Market Revenue (US$ Mn) Market Share by Country in 2022
- Figure 50: Western Europe Chrysin Extract Market Attractiveness Analysis by Country, 2016-2032
- Figure 51: Western Europe Chrysin Extract Market Revenue (US$ Mn) (2016-2032)
- Figure 52: Western Europe Chrysin Extract Market Revenue (US$ Mn) Comparison by Country (2016-2032)
- Figure 53: Western Europe Chrysin Extract Market Revenue (US$ Mn) Comparison by Type (2016-2032)
- Figure 54: Western Europe Chrysin Extract Market Revenue (US$ Mn) Comparison by Application (2016-2032)
- Figure 55: Western Europe Chrysin Extract Market Revenue (US$ Mn) Comparison by End Users (2016-2032)
- Figure 56: Western Europe Chrysin Extract Market Y-o-Y Growth Rate Comparison by Country (2016-2032)
- Figure 57: Western Europe Chrysin Extract Market Y-o-Y Growth Rate Comparison by Type (2016-2032)
- Figure 58: Western Europe Chrysin Extract Market Y-o-Y Growth Rate Comparison by Application (2016-2032)
- Figure 59: Western Europe Chrysin Extract Market Y-o-Y Growth Rate Comparison by End Users (2016-2032)
- Figure 60: Western Europe Chrysin Extract Market Share Comparison by Country (2016-2032)
- Figure 61: Western Europe Chrysin Extract Market Share Comparison by Type (2016-2032)
- Figure 62: Western Europe Chrysin Extract Market Share Comparison by Application (2016-2032)
- Figure 63: Western Europe Chrysin Extract Market Share Comparison by End Users (2016-2032)
- Figure 64: Eastern Europe Chrysin Extract Market Revenue (US$ Mn) Market Share by Typein 2022
- Figure 65: Eastern Europe Chrysin Extract Market Attractiveness Analysis by Type, 2016-2032
- Figure 66: Eastern Europe Chrysin Extract Market Revenue (US$ Mn) Market Share by Applicationin 2022
- Figure 67: Eastern Europe Chrysin Extract Market Attractiveness Analysis by Application, 2016-2032
- Figure 68: Eastern Europe Chrysin Extract Market Revenue (US$ Mn) Market Share by End Usersin 2022
- Figure 69: Eastern Europe Chrysin Extract Market Attractiveness Analysis by End Users, 2016-2032
- Figure 70: Eastern Europe Chrysin Extract Market Revenue (US$ Mn) Market Share by Country in 2022
- Figure 71: Eastern Europe Chrysin Extract Market Attractiveness Analysis by Country, 2016-2032
- Figure 72: Eastern Europe Chrysin Extract Market Revenue (US$ Mn) (2016-2032)
- Figure 73: Eastern Europe Chrysin Extract Market Revenue (US$ Mn) Comparison by Country (2016-2032)
- Figure 74: Eastern Europe Chrysin Extract Market Revenue (US$ Mn) Comparison by Type (2016-2032)
- Figure 75: Eastern Europe Chrysin Extract Market Revenue (US$ Mn) Comparison by Application (2016-2032)
- Figure 76: Eastern Europe Chrysin Extract Market Revenue (US$ Mn) Comparison by End Users (2016-2032)
- Figure 77: Eastern Europe Chrysin Extract Market Y-o-Y Growth Rate Comparison by Country (2016-2032)
- Figure 78: Eastern Europe Chrysin Extract Market Y-o-Y Growth Rate Comparison by Type (2016-2032)
- Figure 79: Eastern Europe Chrysin Extract Market Y-o-Y Growth Rate Comparison by Application (2016-2032)
- Figure 80: Eastern Europe Chrysin Extract Market Y-o-Y Growth Rate Comparison by End Users (2016-2032)
- Figure 81: Eastern Europe Chrysin Extract Market Share Comparison by Country (2016-2032)
- Figure 82: Eastern Europe Chrysin Extract Market Share Comparison by Type (2016-2032)
- Figure 83: Eastern Europe Chrysin Extract Market Share Comparison by Application (2016-2032)
- Figure 84: Eastern Europe Chrysin Extract Market Share Comparison by End Users (2016-2032)
- Figure 85: APAC Chrysin Extract Market Revenue (US$ Mn) Market Share by Typein 2022
- Figure 86: APAC Chrysin Extract Market Attractiveness Analysis by Type, 2016-2032
- Figure 87: APAC Chrysin Extract Market Revenue (US$ Mn) Market Share by Applicationin 2022
- Figure 88: APAC Chrysin Extract Market Attractiveness Analysis by Application, 2016-2032
- Figure 89: APAC Chrysin Extract Market Revenue (US$ Mn) Market Share by End Usersin 2022
- Figure 90: APAC Chrysin Extract Market Attractiveness Analysis by End Users, 2016-2032
- Figure 91: APAC Chrysin Extract Market Revenue (US$ Mn) Market Share by Country in 2022
- Figure 92: APAC Chrysin Extract Market Attractiveness Analysis by Country, 2016-2032
- Figure 93: APAC Chrysin Extract Market Revenue (US$ Mn) (2016-2032)
- Figure 94: APAC Chrysin Extract Market Revenue (US$ Mn) Comparison by Country (2016-2032)
- Figure 95: APAC Chrysin Extract Market Revenue (US$ Mn) Comparison by Type (2016-2032)
- Figure 96: APAC Chrysin Extract Market Revenue (US$ Mn) Comparison by Application (2016-2032)
- Figure 97: APAC Chrysin Extract Market Revenue (US$ Mn) Comparison by End Users (2016-2032)
- Figure 98: APAC Chrysin Extract Market Y-o-Y Growth Rate Comparison by Country (2016-2032)
- Figure 99: APAC Chrysin Extract Market Y-o-Y Growth Rate Comparison by Type (2016-2032)
- Figure 100: APAC Chrysin Extract Market Y-o-Y Growth Rate Comparison by Application (2016-2032)
- Figure 101: APAC Chrysin Extract Market Y-o-Y Growth Rate Comparison by End Users (2016-2032)
- Figure 102: APAC Chrysin Extract Market Share Comparison by Country (2016-2032)
- Figure 103: APAC Chrysin Extract Market Share Comparison by Type (2016-2032)
- Figure 104: APAC Chrysin Extract Market Share Comparison by Application (2016-2032)
- Figure 105: APAC Chrysin Extract Market Share Comparison by End Users (2016-2032)
- Figure 106: Latin America Chrysin Extract Market Revenue (US$ Mn) Market Share by Typein 2022
- Figure 107: Latin America Chrysin Extract Market Attractiveness Analysis by Type, 2016-2032
- Figure 108: Latin America Chrysin Extract Market Revenue (US$ Mn) Market Share by Applicationin 2022
- Figure 109: Latin America Chrysin Extract Market Attractiveness Analysis by Application, 2016-2032
- Figure 110: Latin America Chrysin Extract Market Revenue (US$ Mn) Market Share by End Usersin 2022
- Figure 111: Latin America Chrysin Extract Market Attractiveness Analysis by End Users, 2016-2032
- Figure 112: Latin America Chrysin Extract Market Revenue (US$ Mn) Market Share by Country in 2022
- Figure 113: Latin America Chrysin Extract Market Attractiveness Analysis by Country, 2016-2032
- Figure 114: Latin America Chrysin Extract Market Revenue (US$ Mn) (2016-2032)
- Figure 115: Latin America Chrysin Extract Market Revenue (US$ Mn) Comparison by Country (2016-2032)
- Figure 116: Latin America Chrysin Extract Market Revenue (US$ Mn) Comparison by Type (2016-2032)
- Figure 117: Latin America Chrysin Extract Market Revenue (US$ Mn) Comparison by Application (2016-2032)
- Figure 118: Latin America Chrysin Extract Market Revenue (US$ Mn) Comparison by End Users (2016-2032)
- Figure 119: Latin America Chrysin Extract Market Y-o-Y Growth Rate Comparison by Country (2016-2032)
- Figure 120: Latin America Chrysin Extract Market Y-o-Y Growth Rate Comparison by Type (2016-2032)
- Figure 121: Latin America Chrysin Extract Market Y-o-Y Growth Rate Comparison by Application (2016-2032)
- Figure 122: Latin America Chrysin Extract Market Y-o-Y Growth Rate Comparison by End Users (2016-2032)
- Figure 123: Latin America Chrysin Extract Market Share Comparison by Country (2016-2032)
- Figure 124: Latin America Chrysin Extract Market Share Comparison by Type (2016-2032)
- Figure 125: Latin America Chrysin Extract Market Share Comparison by Application (2016-2032)
- Figure 126: Latin America Chrysin Extract Market Share Comparison by End Users (2016-2032)
- Figure 127: Middle East & Africa Chrysin Extract Market Revenue (US$ Mn) Market Share by Typein 2022
- Figure 128: Middle East & Africa Chrysin Extract Market Attractiveness Analysis by Type, 2016-2032
- Figure 129: Middle East & Africa Chrysin Extract Market Revenue (US$ Mn) Market Share by Applicationin 2022
- Figure 130: Middle East & Africa Chrysin Extract Market Attractiveness Analysis by Application, 2016-2032
- Figure 131: Middle East & Africa Chrysin Extract Market Revenue (US$ Mn) Market Share by End Usersin 2022
- Figure 132: Middle East & Africa Chrysin Extract Market Attractiveness Analysis by End Users, 2016-2032
- Figure 133: Middle East & Africa Chrysin Extract Market Revenue (US$ Mn) Market Share by Country in 2022
- Figure 134: Middle East & Africa Chrysin Extract Market Attractiveness Analysis by Country, 2016-2032
- Figure 135: Middle East & Africa Chrysin Extract Market Revenue (US$ Mn) (2016-2032)
- Figure 136: Middle East & Africa Chrysin Extract Market Revenue (US$ Mn) Comparison by Country (2016-2032)
- Figure 137: Middle East & Africa Chrysin Extract Market Revenue (US$ Mn) Comparison by Type (2016-2032)
- Figure 138: Middle East & Africa Chrysin Extract Market Revenue (US$ Mn) Comparison by Application (2016-2032)
- Figure 139: Middle East & Africa Chrysin Extract Market Revenue (US$ Mn) Comparison by End Users (2016-2032)
- Figure 140: Middle East & Africa Chrysin Extract Market Y-o-Y Growth Rate Comparison by Country (2016-2032)
- Figure 141: Middle East & Africa Chrysin Extract Market Y-o-Y Growth Rate Comparison by Type (2016-2032)
- Figure 142: Middle East & Africa Chrysin Extract Market Y-o-Y Growth Rate Comparison by Application (2016-2032)
- Figure 143: Middle East & Africa Chrysin Extract Market Y-o-Y Growth Rate Comparison by End Users (2016-2032)
- Figure 144: Middle East & Africa Chrysin Extract Market Share Comparison by Country (2016-2032)
- Figure 145: Middle East & Africa Chrysin Extract Market Share Comparison by Type (2016-2032)
- Figure 146: Middle East & Africa Chrysin Extract Market Share Comparison by Application (2016-2032)
- Figure 147: Middle East & Africa Chrysin Extract Market Share Comparison by End Users (2016-2032)
- List of Tables
- Table 1: Global Chrysin Extract Market Comparison by Type (2016-2032)
- Table 2: Global Chrysin Extract Market Comparison by Application (2016-2032)
- Table 3: Global Chrysin Extract Market Comparison by End Users (2016-2032)
- Table 4: Global Chrysin Extract Market Revenue (US$ Mn) Comparison by Region (2016-2032)
- Table 5: Global Chrysin Extract Market Revenue (US$ Mn) (2016-2032)
- Table 6: Global Chrysin Extract Market Revenue (US$ Mn) Comparison by Region (2016-2032)
- Table 7: Global Chrysin Extract Market Revenue (US$ Mn) Comparison by Type (2016-2032)
- Table 8: Global Chrysin Extract Market Revenue (US$ Mn) Comparison by Application (2016-2032)
- Table 9: Global Chrysin Extract Market Revenue (US$ Mn) Comparison by End Users (2016-2032)
- Table 10: Global Chrysin Extract Market Y-o-Y Growth Rate Comparison by Region (2016-2032)
- Table 11: Global Chrysin Extract Market Y-o-Y Growth Rate Comparison by Type (2016-2032)
- Table 12: Global Chrysin Extract Market Y-o-Y Growth Rate Comparison by Application (2016-2032)
- Table 13: Global Chrysin Extract Market Y-o-Y Growth Rate Comparison by End Users (2016-2032)
- Table 14: Global Chrysin Extract Market Share Comparison by Region (2016-2032)
- Table 15: Global Chrysin Extract Market Share Comparison by Type (2016-2032)
- Table 16: Global Chrysin Extract Market Share Comparison by Application (2016-2032)
- Table 17: Global Chrysin Extract Market Share Comparison by End Users (2016-2032)
- Table 18: North America Chrysin Extract Market Comparison by Application (2016-2032)
- Table 19: North America Chrysin Extract Market Comparison by End Users (2016-2032)
- Table 20: North America Chrysin Extract Market Revenue (US$ Mn) Comparison by Country (2016-2032)
- Table 21: North America Chrysin Extract Market Revenue (US$ Mn) (2016-2032)
- Table 22: North America Chrysin Extract Market Revenue (US$ Mn) Comparison by Country (2016-2032)
- Table 23: North America Chrysin Extract Market Revenue (US$ Mn) Comparison by Type (2016-2032)
- Table 24: North America Chrysin Extract Market Revenue (US$ Mn) Comparison by Application (2016-2032)
- Table 25: North America Chrysin Extract Market Revenue (US$ Mn) Comparison by End Users (2016-2032)
- Table 26: North America Chrysin Extract Market Y-o-Y Growth Rate Comparison by Country (2016-2032)
- Table 27: North America Chrysin Extract Market Y-o-Y Growth Rate Comparison by Type (2016-2032)
- Table 28: North America Chrysin Extract Market Y-o-Y Growth Rate Comparison by Application (2016-2032)
- Table 29: North America Chrysin Extract Market Y-o-Y Growth Rate Comparison by End Users (2016-2032)
- Table 30: North America Chrysin Extract Market Share Comparison by Country (2016-2032)
- Table 31: North America Chrysin Extract Market Share Comparison by Type (2016-2032)
- Table 32: North America Chrysin Extract Market Share Comparison by Application (2016-2032)
- Table 33: North America Chrysin Extract Market Share Comparison by End Users (2016-2032)
- Table 34: Western Europe Chrysin Extract Market Comparison by Type (2016-2032)
- Table 35: Western Europe Chrysin Extract Market Comparison by Application (2016-2032)
- Table 36: Western Europe Chrysin Extract Market Comparison by End Users (2016-2032)
- Table 37: Western Europe Chrysin Extract Market Revenue (US$ Mn) Comparison by Country (2016-2032)
- Table 38: Western Europe Chrysin Extract Market Revenue (US$ Mn) (2016-2032)
- Table 39: Western Europe Chrysin Extract Market Revenue (US$ Mn) Comparison by Country (2016-2032)
- Table 40: Western Europe Chrysin Extract Market Revenue (US$ Mn) Comparison by Type (2016-2032)
- Table 41: Western Europe Chrysin Extract Market Revenue (US$ Mn) Comparison by Application (2016-2032)
- Table 42: Western Europe Chrysin Extract Market Revenue (US$ Mn) Comparison by End Users (2016-2032)
- Table 43: Western Europe Chrysin Extract Market Y-o-Y Growth Rate Comparison by Country (2016-2032)
- Table 44: Western Europe Chrysin Extract Market Y-o-Y Growth Rate Comparison by Type (2016-2032)
- Table 45: Western Europe Chrysin Extract Market Y-o-Y Growth Rate Comparison by Application (2016-2032)
- Table 46: Western Europe Chrysin Extract Market Y-o-Y Growth Rate Comparison by End Users (2016-2032)
- Table 47: Western Europe Chrysin Extract Market Share Comparison by Country (2016-2032)
- Table 48: Western Europe Chrysin Extract Market Share Comparison by Type (2016-2032)
- Table 49: Western Europe Chrysin Extract Market Share Comparison by Application (2016-2032)
- Table 50: Western Europe Chrysin Extract Market Share Comparison by End Users (2016-2032)
- Table 51: Eastern Europe Chrysin Extract Market Comparison by Type (2016-2032)
- Table 52: Eastern Europe Chrysin Extract Market Comparison by Application (2016-2032)
- Table 53: Eastern Europe Chrysin Extract Market Comparison by End Users (2016-2032)
- Table 54: Eastern Europe Chrysin Extract Market Revenue (US$ Mn) Comparison by Country (2016-2032)
- Table 55: Eastern Europe Chrysin Extract Market Revenue (US$ Mn) (2016-2032)
- Table 56: Eastern Europe Chrysin Extract Market Revenue (US$ Mn) Comparison by Country (2016-2032)
- Table 57: Eastern Europe Chrysin Extract Market Revenue (US$ Mn) Comparison by Type (2016-2032)
- Table 58: Eastern Europe Chrysin Extract Market Revenue (US$ Mn) Comparison by Application (2016-2032)
- Table 59: Eastern Europe Chrysin Extract Market Revenue (US$ Mn) Comparison by End Users (2016-2032)
- Table 60: Eastern Europe Chrysin Extract Market Y-o-Y Growth Rate Comparison by Country (2016-2032)
- Table 61: Eastern Europe Chrysin Extract Market Y-o-Y Growth Rate Comparison by Type (2016-2032)
- Table 62: Eastern Europe Chrysin Extract Market Y-o-Y Growth Rate Comparison by Application (2016-2032)
- Table 63: Eastern Europe Chrysin Extract Market Y-o-Y Growth Rate Comparison by End Users (2016-2032)
- Table 64: Eastern Europe Chrysin Extract Market Share Comparison by Country (2016-2032)
- Table 65: Eastern Europe Chrysin Extract Market Share Comparison by Type (2016-2032)
- Table 66: Eastern Europe Chrysin Extract Market Share Comparison by Application (2016-2032)
- Table 67: Eastern Europe Chrysin Extract Market Share Comparison by End Users (2016-2032)
- Table 68: APAC Chrysin Extract Market Comparison by Type (2016-2032)
- Table 69: APAC Chrysin Extract Market Comparison by Application (2016-2032)
- Table 70: APAC Chrysin Extract Market Comparison by End Users (2016-2032)
- Table 71: APAC Chrysin Extract Market Revenue (US$ Mn) Comparison by Country (2016-2032)
- Table 72: APAC Chrysin Extract Market Revenue (US$ Mn) (2016-2032)
- Table 73: APAC Chrysin Extract Market Revenue (US$ Mn) Comparison by Country (2016-2032)
- Table 74: APAC Chrysin Extract Market Revenue (US$ Mn) Comparison by Type (2016-2032)
- Table 75: APAC Chrysin Extract Market Revenue (US$ Mn) Comparison by Application (2016-2032)
- Table 76: APAC Chrysin Extract Market Revenue (US$ Mn) Comparison by End Users (2016-2032)
- Table 77: APAC Chrysin Extract Market Y-o-Y Growth Rate Comparison by Country (2016-2032)
- Table 78: APAC Chrysin Extract Market Y-o-Y Growth Rate Comparison by Type (2016-2032)
- Table 79: APAC Chrysin Extract Market Y-o-Y Growth Rate Comparison by Application (2016-2032)
- Table 80: APAC Chrysin Extract Market Y-o-Y Growth Rate Comparison by End Users (2016-2032)
- Table 81: APAC Chrysin Extract Market Share Comparison by Country (2016-2032)
- Table 82: APAC Chrysin Extract Market Share Comparison by Type (2016-2032)
- Table 83: APAC Chrysin Extract Market Share Comparison by Application (2016-2032)
- Table 84: APAC Chrysin Extract Market Share Comparison by End Users (2016-2032)
- Table 85: Latin America Chrysin Extract Market Comparison by Type (2016-2032)
- Table 86: Latin America Chrysin Extract Market Comparison by Application (2016-2032)
- Table 87: Latin America Chrysin Extract Market Comparison by End Users (2016-2032)
- Table 88: Latin America Chrysin Extract Market Revenue (US$ Mn) Comparison by Country (2016-2032)
- Table 89: Latin America Chrysin Extract Market Revenue (US$ Mn) (2016-2032)
- Table 90: Latin America Chrysin Extract Market Revenue (US$ Mn) Comparison by Country (2016-2032)
- Table 91: Latin America Chrysin Extract Market Revenue (US$ Mn) Comparison by Type (2016-2032)
- Table 92: Latin America Chrysin Extract Market Revenue (US$ Mn) Comparison by Application (2016-2032)
- Table 93: Latin America Chrysin Extract Market Revenue (US$ Mn) Comparison by End Users (2016-2032)
- Table 94: Latin America Chrysin Extract Market Y-o-Y Growth Rate Comparison by Country (2016-2032)
- Table 95: Latin America Chrysin Extract Market Y-o-Y Growth Rate Comparison by Type (2016-2032)
- Table 96: Latin America Chrysin Extract Market Y-o-Y Growth Rate Comparison by Application (2016-2032)
- Table 97: Latin America Chrysin Extract Market Y-o-Y Growth Rate Comparison by End Users (2016-2032)
- Table 98: Latin America Chrysin Extract Market Share Comparison by Country (2016-2032)
- Table 99: Latin America Chrysin Extract Market Share Comparison by Type (2016-2032)
- Table 100: Latin America Chrysin Extract Market Share Comparison by Application (2016-2032)
- Table 101: Latin America Chrysin Extract Market Share Comparison by End Users (2016-2032)
- Table 102: Middle East & Africa Chrysin Extract Market Comparison by Type (2016-2032)
- Table 103: Middle East & Africa Chrysin Extract Market Comparison by Application (2016-2032)
- Table 104: Middle East & Africa Chrysin Extract Market Comparison by End Users (2016-2032)
- Table 105: Middle East & Africa Chrysin Extract Market Revenue (US$ Mn) Comparison by Country (2016-2032)
- Table 106: Middle East & Africa Chrysin Extract Market Revenue (US$ Mn) (2016-2032)
- Table 107: Middle East & Africa Chrysin Extract Market Revenue (US$ Mn) Comparison by Country (2016-2032)
- Table 108: Middle East & Africa Chrysin Extract Market Revenue (US$ Mn) Comparison by Type (2016-2032)
- Table 109: Middle East & Africa Chrysin Extract Market Revenue (US$ Mn) Comparison by Application (2016-2032)
- Table 110: Middle East & Africa Chrysin Extract Market Revenue (US$ Mn) Comparison by End Users (2016-2032)
- Table 111: Middle East & Africa Chrysin Extract Market Y-o-Y Growth Rate Comparison by Country (2016-2032)
- Table 112: Middle East & Africa Chrysin Extract Market Y-o-Y Growth Rate Comparison by Type (2016-2032)
- Table 113: Middle East & Africa Chrysin Extract Market Y-o-Y Growth Rate Comparison by Application (2016-2032)
- Table 114: Middle East & Africa Chrysin Extract Market Y-o-Y Growth Rate Comparison by End Users (2016-2032)
- Table 115: Middle East & Africa Chrysin Extract Market Share Comparison by Country (2016-2032)
- Table 116: Middle East & Africa Chrysin Extract Market Share Comparison by Type (2016-2032)
- Table 117: Middle East & Africa Chrysin Extract Market Share Comparison by Application (2016-2032)
- Table 118: Middle East & Africa Chrysin Extract Market Share Comparison by End Users (2016-2032)
- 1. Executive Summary
-
- Xi'an Lyphar Biotech Co., Ltd.
- Shaanxi Yuantai Biological Technology Co., Ltd.
- Shanghai Soyoung Biotechnology Inc.
- Xi'an Saina Biological Technology Co., Ltd.
- Shaanxi Fuheng (FH) Biotechnology Co., Ltd.
- Changsha Herbway Biotech Co., Ltd.
- Hunan Nutrmax Inc.
- Hangzhou Greensky Biological Tech Co., Ltd.
- Chengdu PRF Medication Research Co., Ltd.
- Xi'an Natural Field Bio-Technique Co., Ltd.
Our Clients


View Our Licence Options
