
Global Chloroquine Market By Type(Capsules, Injectables, Tablets), By Application(Malaria, Arthrophlogosis, Others), By Region And Companies - Industry Segment Outlook, Market Assessment, Competition Scenario, Trends, And Forecast 2024-2033
-
45493
-
May 2024
-
300
-


-
This report was compiled by Trishita Deb Trishita Deb is an experienced market research and consulting professional with over 7 years of expertise across healthcare, consumer goods, and materials, contributing to over 400 healthcare-related reports. Correspondence Team Lead- Healthcare Linkedin | Detailed Market research Methodology Our methodology involves a mix of primary research, including interviews with leading mental health experts, and secondary research from reputable medical journals and databases. View Detailed Methodology Page
-
Quick Navigation
Report Overview
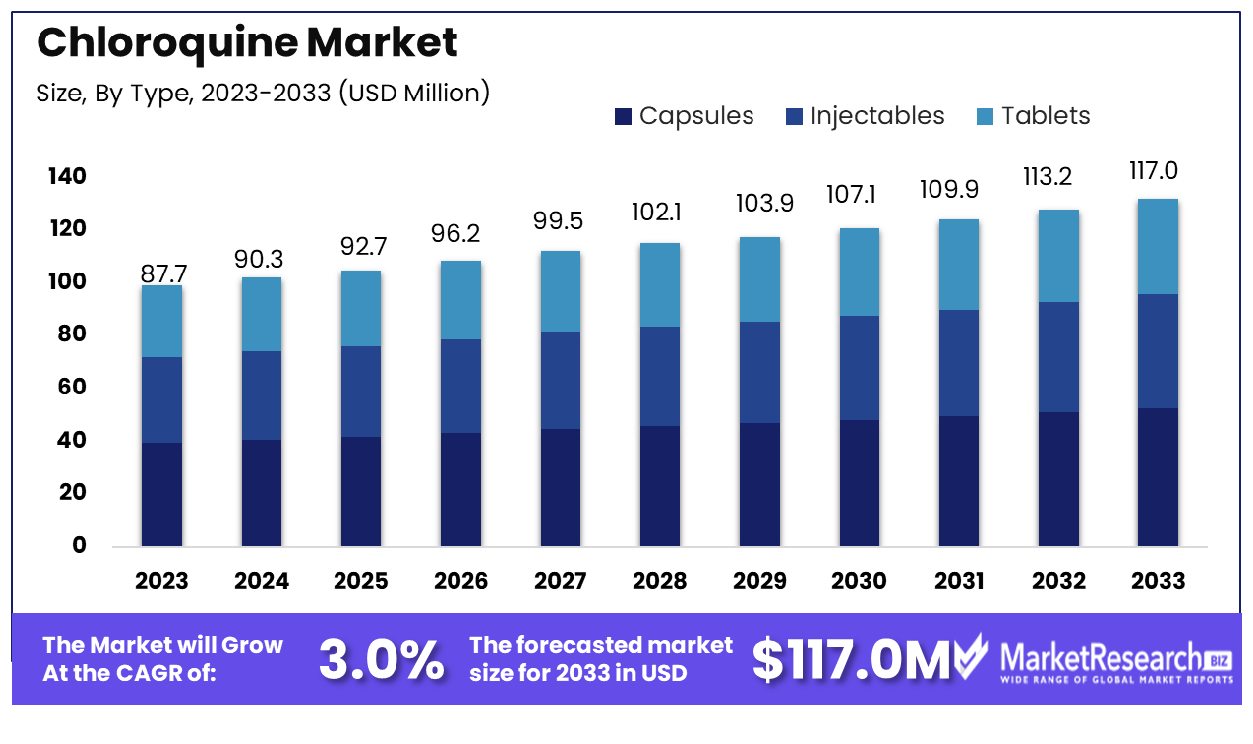
The Global Chloroquine Market was valued at USD 87.7 Million in 2023. It is expected to reach USD 117.0 Million by 2033, with a CAGR of 3.0% during the forecast period from 2024 to 2033.
The Chloroquine Market encompasses the global landscape of pharmaceuticals, focusing on the production, distribution, and consumption of chloroquine-based medications. As a trusted antimalarial agent, chloroquine has garnered significant attention for its potential to treat various autoimmune disorders, including rheumatoid arthritis and lupus erythematosus.
This market segment delves into the intricate dynamics of pharmaceutical manufacturing, regulatory frameworks, and emerging research surrounding chloroquine's efficacy and safety profiles. In an era marked by heightened demand for innovative therapeutic solutions, understanding the Chloroquine Market is pivotal for executives seeking to navigate evolving healthcare landscapes and capitalize on emerging treatment paradigms.
The chloroquine market presents a dynamic landscape shaped by evolving trends and scientific advancements. Recent studies shed light on crucial aspects influencing market dynamics, providing insights essential for stakeholders to navigate effectively.
A study published in the Malaria Journal in 2023 delved into molecular surveillance of chloroquine resistance in Plasmodium vivax isolates in Yunnan Province, China. Remarkably, findings revealed a noteworthy decline in the mutation detection rate for chloroquine resistance, plummeting from 9.8% in 2020 to 1.1% in 2021 and 1.3% in 2022. This decline signifies a positive trend, potentially indicating advancements in combating resistance, thereby enhancing the efficacy of chloroquine-based interventions.
Furthermore, insights from the Centers for Disease Control and Prevention (CDC) underscore the market's response to external factors. A report from 2020 unveiled a surge in hydroxychloroquine and chloroquine prescriptions in the United States, with dispensed prescriptions soaring from 819,906 in 2019 to 1,312,859 in 2020, largely attributed to the COVID-19 pandemic. This surge highlights the market's adaptability to external crises, with chloroquine emerging as a focal point in public health strategies.
While specific statistics for 2022 and 2023 remain elusive, the trajectory of chloroquine usage and resistance unveils promising developments. Notably, China witnessed a decline in chloroquine resistance in recent years, while the US experienced a surge in prescriptions amidst the pandemic.
Key Takeaways
- Market Growth: The Global Chloroquine Market was valued at USD 87.7 Million in 2023. It is expected to reach USD 117.0 Million by 2033, with a CAGR of 3.0% during the forecast period from 2024 to 2033.
- By Type: In the Chloroquine market, capsules hold a dominant share at 40%.
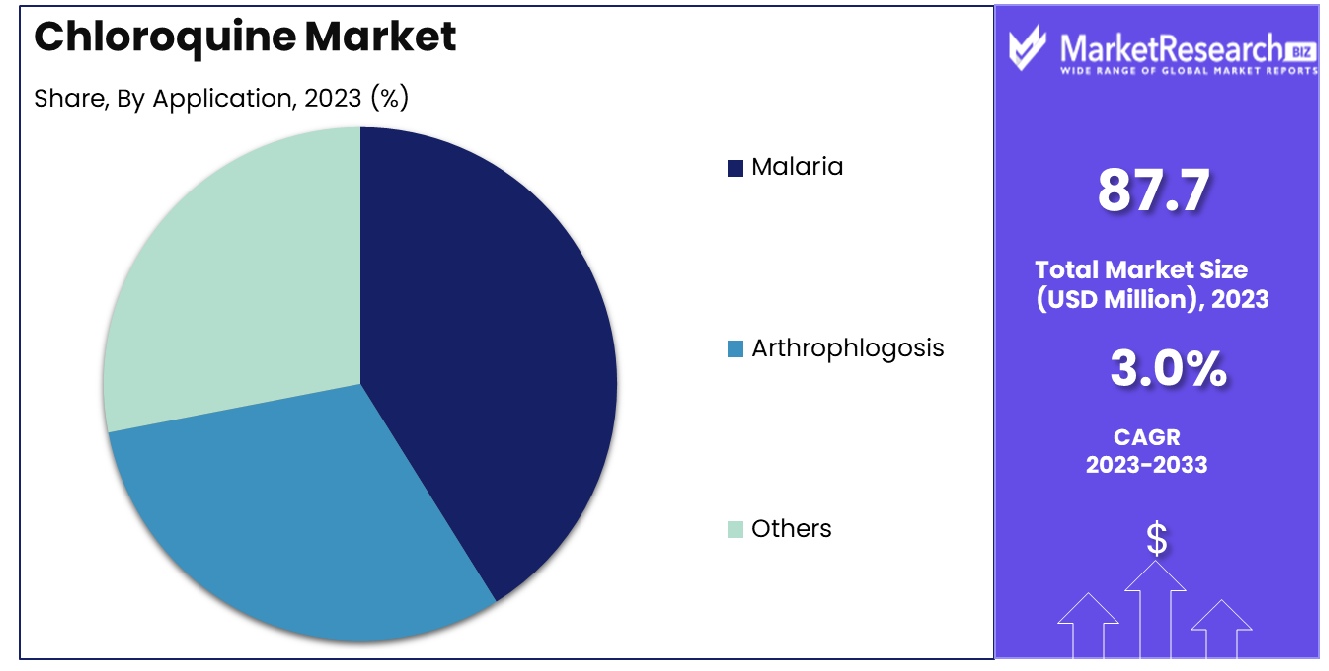
- By Application: Malaria treatment accounts for a commanding 70% share in applications.
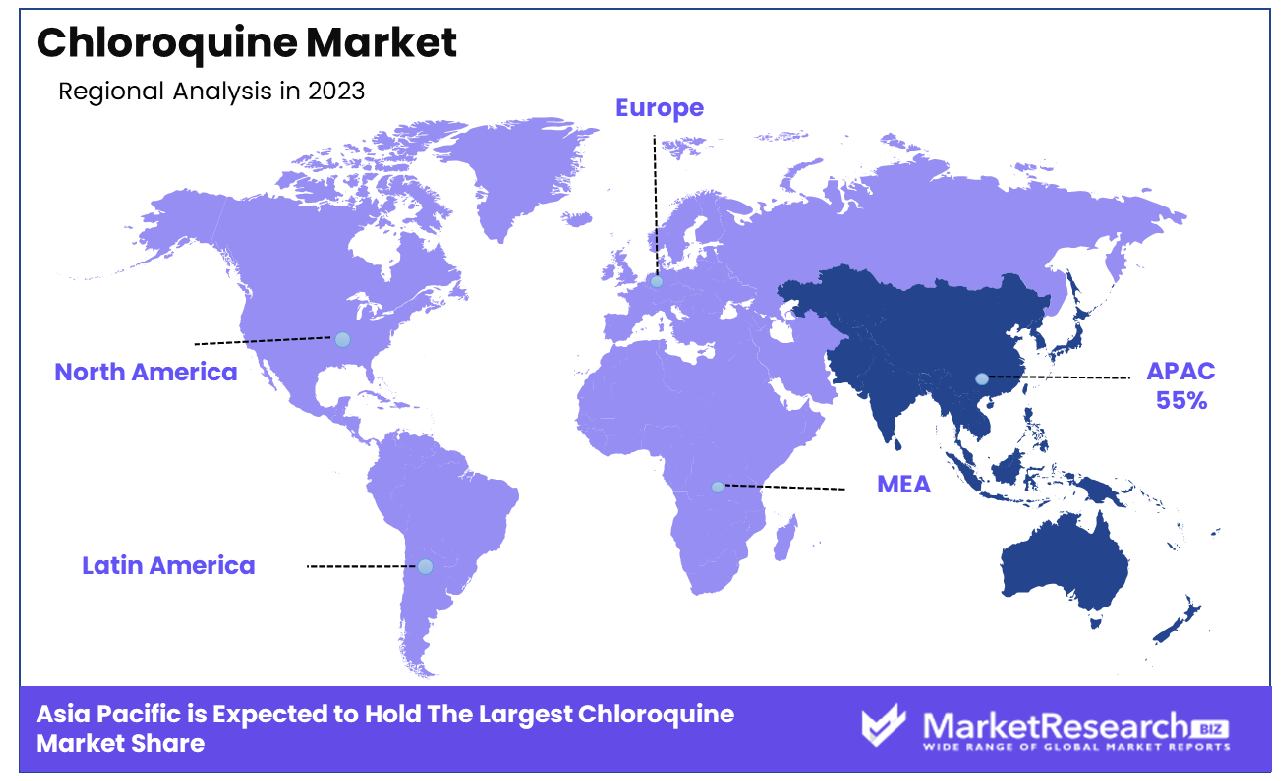
- Regional Dominance: In the Asia Pacific region, the Chloroquine Market captures a significant 55% market share.
- Growth Opportunity: The global Chloroquine Market in 2023 sees growth opportunities driven by ongoing clinical trials exploring diverse medical indications and increased demand for prophylactic use in travel medicine.
Driving factors
External Opportunities and Challenges: Expanding Applications and Regulatory Hurdles
External opportunities and challenges significantly influence the Chloroquine market dynamics. While expanding applications, particularly in the treatment of autoimmune diseases like rheumatoid arthritis and lupus, offer avenues for growth, stringent regulatory hurdles present notable challenges. Despite being historically known for its anti-malarial properties, Chloroquine's potential in treating autoimmune conditions has garnered attention. According to recent clinical trials and studies, Chloroquine demonstrates efficacy in managing symptoms and slowing disease progression in autoimmune disorders, thus widening its market scope.
However, navigating regulatory frameworks poses a substantial challenge. Regulatory agencies impose strict guidelines and safety standards due to Chloroquine's potential side effects, including retinal toxicity. Meeting these regulatory requirements demands significant investments in research and development to ensure product safety and efficacy. Thus, while expanding applications presents growth opportunities, addressing regulatory challenges is imperative for market penetration and sustained growth.
Intrinsic Factors: Growing Demand and Technological Advancements
Intrinsic factors, including drivers and restraints, play a pivotal role in shaping the Chloroquine market landscape. Growing demand for Chloroquine, driven by the rising incidence of malaria and autoimmune diseases, fuels market expansion. Malaria, a significant global health concern, continues to drive demand for Chloroquine-based treatments, particularly in regions with high disease prevalence. Additionally, technological advancements in drug formulation and delivery enhance Chloroquine's efficacy and safety profile, further bolstering market growth.
However, intrinsic restraints such as side effects and drug resistance pose challenges. Despite its effectiveness, Chloroquine is associated with adverse effects, including gastrointestinal discomfort and retinal toxicity, limiting its long-term use. Moreover, emerging drug-resistant malaria strains threaten Chloroquine's efficacy, necessitating continuous research and development efforts to counter resistance and maintain market relevance.
Extrinsic Factors: Market Expansion and Competitive Landscape
Extrinsic factors, encompassing opportunities and challenges external to the Chloroquine market, shape its growth trajectory. Market expansion driven by increasing healthcare expenditure and initiatives to combat malaria contributes to Chloroquine market growth. Moreover, strategic collaborations and partnerships facilitate market penetration and product development, fostering growth opportunities. However, intense competition from alternative anti-malarial drugs and generics poses challenges.
The availability of cheaper generic alternatives and the emergence of novel anti-malarial therapies intensify competitive pressures, compelling Chloroquine manufacturers to differentiate their products through innovation and strategic positioning. Additionally, geopolitical factors and regulatory changes in key markets influence market dynamics, necessitating adaptive strategies to mitigate risks and capitalize on emerging opportunities. Thus, while extrinsic opportunities drive market expansion, navigating competitive pressures and regulatory complexities remains crucial for sustained growth in the Chloroquine market.
Restraining Factors
Emergence of Drug-Resistant Strains: Diminishing Efficacy and Market Relevance
The emergence of drug-resistant malaria strains poses a significant restraining factor for the Chloroquine market. Despite its historical efficacy against malaria, the rise of resistant strains undermines Chloroquine's effectiveness, limiting its utility and market demand. According to recent studies, the prevalence of drug-resistant malaria strains, particularly Plasmodium falciparum, has increased globally, rendering Chloroquine less effective as a first-line treatment option.
This diminishing efficacy not only reduces patient confidence in Chloroquine but also prompts healthcare providers to seek alternative treatments, thereby dampening market growth prospects. Addressing the challenge of drug resistance requires substantial investments in research and development to develop new formulations or combination therapies that circumvent resistance mechanisms. Additionally, concerted efforts to enhance surveillance and containment of drug-resistant malaria strains are essential to mitigate their impact on Chloroquine's market relevance.
Availability of Alternative Treatments: Competition and Market Share Erosion
The availability of alternative anti-malarial treatments presents a formidable restraining factor for the Chloroquine market. With the advent of newer and more effective anti-malarial drugs discovery, Chloroquine faces intense competition, leading to erosion of its market share. Artemisinin-based combination therapies (ACTs) have emerged as the preferred treatment for uncomplicated malaria due to their higher efficacy and lower risk of resistance development.
Consequently, Chloroquine's position as a first-line treatment for malaria has been supplanted by ACTs in many regions, impacting its market demand and revenue potential. Moreover, the availability of generic alternatives further exacerbates the competitive landscape, driving down prices and squeezing profit margins for Chloroquine manufacturers.
To counter the challenge posed by alternative treatments, Chloroquine manufacturers must focus on differentiation strategies, such as targeted marketing campaigns highlighting Chloroquine's unique benefits or formulations that offer advantages over competitors. Additionally, exploring new indications beyond malaria, such as autoimmune diseases, could diversify Chloroquine's market presence and mitigate the impact of alternative treatments on its growth trajectory.
By Type Analysis
In the Chloroquine market, capsules hold the dominant share at 40%, reflecting their preferred formulation choice.
In 2023, Capsules held a dominant market position in the By Type segment of the Chloroquine Market, capturing more than a 40% share. The widespread adoption of capsules can be attributed to their ease of administration, convenient dosing, and enhanced patient compliance. Capsules offer precise dosage delivery and are preferred by healthcare professionals for their controlled-release formulations, ensuring optimal therapeutic efficacy. Moreover, the availability of capsules in various strengths allows for tailored treatment regimens, further driving their demand in the market.
Following Capsules, Injectables emerged as the second-largest segment in the Chloroquine Market. Despite accounting for a smaller share compared to capsules, injectables witnessed steady growth fueled by their rapid onset of action and higher bioavailability. Injectable formulations of chloroquine are often preferred in emergency situations or when oral administration is not feasible, thus catering to specific patient needs and contributing to the overall market expansion.
Meanwhile, Tablets constituted a significant portion of the Chloroquine Market, albeit slightly trailing behind capsules and injectables. Tablets remain a popular choice due to their familiarity among patients and healthcare providers, coupled with easy storage and distribution logistics. Additionally, advancements in tablet formulations, such as extended-release technologies, have further bolstered their market presence by offering prolonged drug release and improved patient adherence.
Looking ahead, the Chloroquine Market is poised for continued growth, driven by rising incidences of malaria and other parasitic infections, coupled with ongoing research initiatives aimed at exploring the therapeutic potential of chloroquine in treating various autoimmune diseases. As pharmaceutical companies invest in novel formulations and regulatory bodies support expanded indications, the market landscape for chloroquine is anticipated to evolve, presenting lucrative opportunities for stakeholders across the value chain.
By Application Analysis
Malaria treatment commands a significant 70% share in Chloroquine applications, emphasizing its primary therapeutic use.
In 2023, Malaria held a dominant market position in the By Application segment of the Chloroquine Market, capturing more than a 70% share. The substantial market share attributed to malaria underscores the critical role of chloroquine as a first-line treatment for this mosquito-borne infectious disease. With malaria endemic in several regions across the globe, particularly in tropical and subtropical areas, the demand for effective antimalarial drugs remains high. Chloroquine's established efficacy, affordability, and widespread availability contribute to its prominence in the treatment and prevention of malaria, making it a cornerstone in global malaria control efforts.
Arthrophlogosis emerged as the second-largest segment in the Chloroquine Market by application. Although constituting a smaller share compared to malaria, arthrophlogosis represents a niche therapeutic area where chloroquine demonstrates notable efficacy in managing symptoms associated with inflammatory joint conditions. The anti-inflammatory properties of chloroquine make it a valuable adjunct therapy for conditions like rheumatoid arthritis and systemic lupus erythematosus, wherein it helps alleviate pain, reduce inflammation, and improve joint function.
Furthermore, the "Others" category encompassed a variety of applications where chloroquine finds utility beyond malaria and arthrophlogosis. These include off-label uses in autoimmune disorders, dermatological conditions, and certain viral infections. While comprising a relatively smaller portion of the market, the diverse applications highlight chloroquine's versatility and the ongoing exploration of its therapeutic potential across various medical domains.
As the global burden of malaria persists and research continues to uncover new indications for chloroquine, the Chloroquine Market is poised for sustained growth, driven by advancements in treatment protocols, expanded access initiatives, and ongoing clinical investigations into the drug's multifaceted pharmacological properties.
Key Market Segments
By Type
- Capsules
- Injectables
- Tablets
By Application
- Malaria
- Arthrophlogosis
- Others
Growth Opportunity
Ongoing Clinical Trials in Various Indications
The global Chloroquine Market presents promising growth opportunities in 2023, largely fueled by ongoing clinical trials exploring its efficacy in various indications. As Chloroquine garners attention for its potential beyond its traditional use in malaria treatment, pharmaceutical companies are investing significantly in research and development to assess its effectiveness in combating other diseases.
Clinical trials are underway to evaluate Chloroquine's efficacy in treating autoimmune disorders like rheumatoid arthritis and lupus erythematosus, as well as viral infections such as COVID-19. These trials not only expand Chloroquine's potential therapeutic applications but also position it as a versatile pharmaceutical asset in the healthcare industry. As results from these trials emerge, they are likely to drive increased demand for Chloroquine across diverse medical sectors, thereby stimulating market growth.
Prophylactic Use in Travel Medicine
Another significant growth driver for the global Chloroquine Market in 2023 is its prophylactic use in travel medicine. With the resurgence of international travel post-pandemic, the demand for Chloroquine as a prophylactic treatment for malaria is expected to escalate. Travelers, particularly those visiting malaria-endemic regions, increasingly rely on Chloroquine as a preventive measure against contracting the disease.
This surge in demand for travel-related prophylaxis is anticipated to bolster Chloroquine sales and revenue, contributing to the overall expansion of the market. Moreover, advancements in travel medicine education and awareness campaigns emphasizing the importance of malaria prophylaxis are likely to further drive the adoption of Chloroquine among travelers. Consequently, the convergence of these factors positions the Chloroquine Market for substantial growth in 2023, particularly within the travel medicine sector.
Latest Trends
Continued Off-label Use in Certain Regions
The global Chloroquine Market in 2023 reflects intriguing trends, notably the continued off-label use in certain regions. Despite regulatory limitations and evolving medical guidelines, Chloroquine continues to be employed off-label for various medical conditions in select geographic areas. This trend is often observed in regions where access to alternative treatments is limited or where healthcare practitioners perceive Chloroquine as a cost-effective therapeutic option.
However, this practice raises concerns regarding patient safety and the potential for misuse, highlighting the importance of regulatory oversight and ongoing medical education initiatives. As such, stakeholders in the Chloroquine Market must remain vigilant in monitoring and addressing the implications of off-label use to ensure appropriate patient care and regulatory compliance.
Surveillance of Adverse Effects and Safety Profile
Another prominent trend shaping the global Chloroquine Market in 2023 is the heightened surveillance of adverse effects and safety profiles associated with Chloroquine usage. As Chloroquine continues to be utilized in diverse medical contexts, including prophylaxis, treatment, and off-label applications, there is a pressing need to comprehensively evaluate its safety profile and potential adverse effects.
Healthcare authorities, pharmaceutical companies, and research institutions are increasingly investing resources in pharmacovigilance efforts to monitor and mitigate the risks associated with Chloroquine usage. This includes robust post-market surveillance programs, real-world data analysis, and collaboration with healthcare providers to identify and address adverse events promptly. By prioritizing the safety and well-being of patients, stakeholders can instill confidence in Chloroquine's therapeutic utility while minimizing potential harm, thus sustaining its role in clinical practice and market viability.
Regional Analysis
In the Asia Pacific region, Chloroquine Market holds a dominant share of 55%.
North America remains a significant market for Chloroquine, characterized by robust healthcare infrastructure and high awareness of malaria prevention. The region's market growth is propelled by steady demand from travelers visiting malaria-endemic regions and patients with autoimmune disorders. According to recent market data, North America accounts for approximately 20% of the global Chloroquine Market.
Europe similarly demonstrates a notable presence in the Chloroquine Market, driven by a sizable patient population requiring treatment for autoimmune diseases such as rheumatoid arthritis and lupus erythematosus. The region's emphasis on pharmacovigilance and stringent regulatory frameworks ensures the safe and responsible use of Chloroquine. Europe contributes around 18% to the global Chloroquine Market.
Asia Pacific emerges as the dominating region in the Chloroquine Market, commanding a substantial market share of 55%. The region's prominence is attributed to several factors, including the high prevalence of malaria in tropical countries, increasing investments in healthcare infrastructure, and rising awareness of Chloroquine's prophylactic benefits. With a vast population and growing healthcare expenditure, Asia Pacific presents lucrative growth opportunities for Chloroquine manufacturers and suppliers.
The Middle East & Africa witness steady demand for Chloroquine due to the prevalence of malaria and other infectious diseases in the region. Despite challenges related to access to healthcare and regulatory frameworks, the market continues to expand, contributing around 7% to the global Chloroquine Market.
Latin America showcases a moderate presence in the Chloroquine Market, driven primarily by demand from travelers and patients with autoimmune disorders. The region's diverse healthcare landscape and varying disease prevalence contribute to a nuanced market dynamic. Latin America accounts for approximately 2% of the global Chloroquine Market.
Key Regions and Countries
North America
- The US
- Canada
- Rest of North America
Europe
- Germany
- France
- The UK
- Spain
- Netherlands
- Russia
- Italy
- Rest of Europe
Asia-Pacific
- China
- Japan
- Singapore
- Thailand
- South Korea
- Vietnam
- India
- New Zealand
- Rest of Asia Pacific
Latin America
- Mexico
- Brazil
- Rest of Latin America
Middle East & Africa
- Saudi Arabia
- South Africa
- UAE
- Rest of Middle East & Africa
Key Players Analysis
In the landscape of the global Chloroquine Market in 2023, several key players significantly influence market dynamics and shape industry trends. Among these key companies, each brings unique strengths and strategies to the forefront, contributing to the overall growth and competitiveness of the market.
Abcam Plc stands out as a prominent player, leveraging its expertise in biotechnology to advance research and development efforts in Chloroquine-based therapeutics. The company's commitment to innovation and collaboration fosters the exploration of novel applications for Chloroquine across various medical indications.
ADVANZ PHARMA Corp. plays a crucial role in ensuring the accessibility and availability of Chloroquine formulations, particularly in regions with high disease burden. Through its global distribution network and commitment to quality assurance, ADVANZ PHARMA Corp. facilitates the reliable supply of Chloroquine products to healthcare providers and patients worldwide.
Bayer AG brings extensive experience and resources to the Chloroquine Market, driving advancements in pharmaceutical manufacturing and distribution. The company's investment in research and development aims to enhance Chloroquine's efficacy and safety profile, aligning with evolving medical needs and regulatory standards.
Sanofi, a leading pharmaceutical powerhouse, contributes significantly to Chloroquine Market dynamics through its diverse portfolio of therapeutic offerings. With a focus on addressing global health challenges, Sanofi plays a pivotal role in expanding access to Chloroquine-based treatments and supporting disease prevention efforts.
Teva Pharmaceutical Industries Ltd. is a key player in the Chloroquine Market, known for its commitment to affordability and accessibility. By manufacturing high-quality generic Chloroquine formulations, Teva Pharmaceutical Industries Ltd. serves as a vital contributor to global healthcare initiatives aimed at combating malaria and other infectious diseases.
Market Key Players
- Abcam Plc
- ADVANZ PHARMA Corp.
- Bayer AG
- Cadila Healthcare Ltd.
- Ipca Laboratories Ltd.
- Mylan NV
- Novartis AG
- Sanofi
- Sun Pharmaceutical Industries Ltd.
- Teva Pharmaceutical Industries Ltd.
Recent Development
- In April 2024, NYU Langone Health researchers found mitophagy causes venetoclax resistance in leukemia cells. Chloroquine inhibition restores drug efficacy. Clinical trials for chloroquine-venetoclax combo planned for acute myeloid leukemia
- In May 2023, A second gene, AAT1, was implicated in malaria parasite resistance to chloroquine. A study led by the Texas Biomedical Research Institute shows the increased complexity of drug resistance.
Report Scope
Report Features Description Market Value (2023) USD 87.7 Million Forecast Revenue (2033) USD 117.0 Million CAGR (2024-2032) 3.0% Base Year for Estimation 2023 Historic Period 2016-2023 Forecast Period 2024-2033 Report Coverage Revenue Forecast, Market Dynamics, COVID-19 Impact, Competitive Landscape, Recent Developments Segments Covered By Type(Capsules, Injectables, Tablets), By Application(Malaria, Arthrophlogosis, Others) Regional Analysis North America - The US, Canada, Rest of North America, Europe - Germany, France, The UK, Spain, Italy, Russia, Netherlands, Rest of Europe, Asia-Pacific - China, Japan, South Korea, India, New Zealand, Singapore, Thailand, Vietnam, Rest of Asia Pacific, Latin America - Brazil, Mexico, Rest of Latin America, Middle East & Africa - South Africa, Saudi Arabia, UAE, Rest of Middle East & Africa Competitive Landscape Abcam Plc, ADVANZ PHARMA Corp., Bayer AG, Cadila Healthcare Ltd., Ipca Laboratories Ltd., Mylan NV, Novartis AG, Sanofi, Sun Pharmaceutical Industries Ltd., Teva Pharmaceutical Industries Ltd. Customization Scope Customization for segments, region/country-level will be provided. Moreover, additional customization can be done based on the requirements. Purchase Options We have three licenses to opt for Single User License, Multi-User License (Up to 5 Users), Corporate Use License (Unlimited User and Printable PDF) -
- 1. Executive Summary
- 1.1. Definition
- 1.2. Taxonomy
- 1.3. Research Scope
- 1.4. Key Analysis
- 1.5. Key Findings by Major Segments
- 1.6. Top strategies by Major Players
- 2. Global Chloroquine Market Overview
- 2.1. Chloroquine Market Dynamics
- 2.1.1. Drivers
- 2.1.2. Opportunities
- 2.1.3. Restraints
- 2.1.4. Challenges
- 2.2. Macro-economic Factors
- 2.3. Regulatory Framework
- 2.4. Market Investment Feasibility Index
- 2.5. PEST Analysis
- 2.6. PORTER’S Five Force Analysis
- 2.7. Drivers & Restraints Impact Analysis
- 2.8. Industry Chain Analysis
- 2.9. Cost Structure Analysis
- 2.10. Marketing Strategy
- 2.11. Russia-Ukraine War Impact Analysis
- 2.12. Opportunity Map Analysis
- 2.13. Market Competition Scenario Analysis
- 2.14. Product Life Cycle Analysis
- 2.15. Opportunity Orbits
- 2.16. Manufacturer Intensity Map
- 2.17. Major Companies sales by Value & Volume
- 2.1. Chloroquine Market Dynamics
- 3. Global Chloroquine Market Analysis, Opportunity and Forecast, 2016-2032
- 3.1. Global Chloroquine Market Analysis, 2016-2021
- 3.2. Global Chloroquine Market Opportunity and Forecast, 2023-2032
- 3.3. Global Chloroquine Market Analysis, Opportunity and Forecast, By By Type, 2016-2032
- 3.3.1. Global Chloroquine Market Analysis by By Type: Introduction
- 3.3.2. Market Size Absolute $ Opportunity Analysis and Forecast, By By Type, 2016-2032
- 3.3.3. Capsules
- 3.3.4. Injectables
- 3.3.5. Tablets
- 3.4. Global Chloroquine Market Analysis, Opportunity and Forecast, By By Application, 2016-2032
- 3.4.1. Global Chloroquine Market Analysis by By Application: Introduction
- 3.4.2. Market Size Absolute $ Opportunity Analysis and Forecast, By By Application, 2016-2032
- 3.4.3. Malaria
- 3.4.4. Arthrophlogosis
- 3.4.5. Others
- 4. North America Chloroquine Market Analysis, Opportunity and Forecast, 2016-2032
- 4.1. North America Chloroquine Market Analysis, 2016-2021
- 4.2. North America Chloroquine Market Opportunity and Forecast, 2023-2032
- 4.3. North America Chloroquine Market Analysis, Opportunity and Forecast, By By Type, 2016-2032
- 4.3.1. North America Chloroquine Market Analysis by By Type: Introduction
- 4.3.2. Market Size Absolute $ Opportunity Analysis and Forecast, By By Type, 2016-2032
- 4.3.3. Capsules
- 4.3.4. Injectables
- 4.3.5. Tablets
- 4.4. North America Chloroquine Market Analysis, Opportunity and Forecast, By By Application, 2016-2032
- 4.4.1. North America Chloroquine Market Analysis by By Application: Introduction
- 4.4.2. Market Size Absolute $ Opportunity Analysis and Forecast, By By Application, 2016-2032
- 4.4.3. Malaria
- 4.4.4. Arthrophlogosis
- 4.4.5. Others
- 4.5. North America Chloroquine Market Analysis, Opportunity and Forecast, By Country , 2016-2032
- 4.5.1. North America Chloroquine Market Analysis by Country : Introduction
- 4.5.2. Market Size Absolute $ Opportunity Analysis and Forecast, Country , 2016-2032
- 4.5.2.1. The US
- 4.5.2.2. Canada
- 4.5.2.3. Mexico
- 5. Western Europe Chloroquine Market Analysis, Opportunity and Forecast, 2016-2032
- 5.1. Western Europe Chloroquine Market Analysis, 2016-2021
- 5.2. Western Europe Chloroquine Market Opportunity and Forecast, 2023-2032
- 5.3. Western Europe Chloroquine Market Analysis, Opportunity and Forecast, By By Type, 2016-2032
- 5.3.1. Western Europe Chloroquine Market Analysis by By Type: Introduction
- 5.3.2. Market Size Absolute $ Opportunity Analysis and Forecast, By By Type, 2016-2032
- 5.3.3. Capsules
- 5.3.4. Injectables
- 5.3.5. Tablets
- 5.4. Western Europe Chloroquine Market Analysis, Opportunity and Forecast, By By Application, 2016-2032
- 5.4.1. Western Europe Chloroquine Market Analysis by By Application: Introduction
- 5.4.2. Market Size Absolute $ Opportunity Analysis and Forecast, By By Application, 2016-2032
- 5.4.3. Malaria
- 5.4.4. Arthrophlogosis
- 5.4.5. Others
- 5.5. Western Europe Chloroquine Market Analysis, Opportunity and Forecast, By Country , 2016-2032
- 5.5.1. Western Europe Chloroquine Market Analysis by Country : Introduction
- 5.5.2. Market Size Absolute $ Opportunity Analysis and Forecast, Country , 2016-2032
- 5.5.2.1. Germany
- 5.5.2.2. France
- 5.5.2.3. The UK
- 5.5.2.4. Spain
- 5.5.2.5. Italy
- 5.5.2.6. Portugal
- 5.5.2.7. Ireland
- 5.5.2.8. Austria
- 5.5.2.9. Switzerland
- 5.5.2.10. Benelux
- 5.5.2.11. Nordic
- 5.5.2.12. Rest of Western Europe
- 6. Eastern Europe Chloroquine Market Analysis, Opportunity and Forecast, 2016-2032
- 6.1. Eastern Europe Chloroquine Market Analysis, 2016-2021
- 6.2. Eastern Europe Chloroquine Market Opportunity and Forecast, 2023-2032
- 6.3. Eastern Europe Chloroquine Market Analysis, Opportunity and Forecast, By By Type, 2016-2032
- 6.3.1. Eastern Europe Chloroquine Market Analysis by By Type: Introduction
- 6.3.2. Market Size Absolute $ Opportunity Analysis and Forecast, By By Type, 2016-2032
- 6.3.3. Capsules
- 6.3.4. Injectables
- 6.3.5. Tablets
- 6.4. Eastern Europe Chloroquine Market Analysis, Opportunity and Forecast, By By Application, 2016-2032
- 6.4.1. Eastern Europe Chloroquine Market Analysis by By Application: Introduction
- 6.4.2. Market Size Absolute $ Opportunity Analysis and Forecast, By By Application, 2016-2032
- 6.4.3. Malaria
- 6.4.4. Arthrophlogosis
- 6.4.5. Others
- 6.5. Eastern Europe Chloroquine Market Analysis, Opportunity and Forecast, By Country , 2016-2032
- 6.5.1. Eastern Europe Chloroquine Market Analysis by Country : Introduction
- 6.5.2. Market Size Absolute $ Opportunity Analysis and Forecast, Country , 2016-2032
- 6.5.2.1. Russia
- 6.5.2.2. Poland
- 6.5.2.3. The Czech Republic
- 6.5.2.4. Greece
- 6.5.2.5. Rest of Eastern Europe
- 7. APAC Chloroquine Market Analysis, Opportunity and Forecast, 2016-2032
- 7.1. APAC Chloroquine Market Analysis, 2016-2021
- 7.2. APAC Chloroquine Market Opportunity and Forecast, 2023-2032
- 7.3. APAC Chloroquine Market Analysis, Opportunity and Forecast, By By Type, 2016-2032
- 7.3.1. APAC Chloroquine Market Analysis by By Type: Introduction
- 7.3.2. Market Size Absolute $ Opportunity Analysis and Forecast, By By Type, 2016-2032
- 7.3.3. Capsules
- 7.3.4. Injectables
- 7.3.5. Tablets
- 7.4. APAC Chloroquine Market Analysis, Opportunity and Forecast, By By Application, 2016-2032
- 7.4.1. APAC Chloroquine Market Analysis by By Application: Introduction
- 7.4.2. Market Size Absolute $ Opportunity Analysis and Forecast, By By Application, 2016-2032
- 7.4.3. Malaria
- 7.4.4. Arthrophlogosis
- 7.4.5. Others
- 7.5. APAC Chloroquine Market Analysis, Opportunity and Forecast, By Country , 2016-2032
- 7.5.1. APAC Chloroquine Market Analysis by Country : Introduction
- 7.5.2. Market Size Absolute $ Opportunity Analysis and Forecast, Country , 2016-2032
- 7.5.2.1. China
- 7.5.2.2. Japan
- 7.5.2.3. South Korea
- 7.5.2.4. India
- 7.5.2.5. Australia & New Zeland
- 7.5.2.6. Indonesia
- 7.5.2.7. Malaysia
- 7.5.2.8. Philippines
- 7.5.2.9. Singapore
- 7.5.2.10. Thailand
- 7.5.2.11. Vietnam
- 7.5.2.12. Rest of APAC
- 8. Latin America Chloroquine Market Analysis, Opportunity and Forecast, 2016-2032
- 8.1. Latin America Chloroquine Market Analysis, 2016-2021
- 8.2. Latin America Chloroquine Market Opportunity and Forecast, 2023-2032
- 8.3. Latin America Chloroquine Market Analysis, Opportunity and Forecast, By By Type, 2016-2032
- 8.3.1. Latin America Chloroquine Market Analysis by By Type: Introduction
- 8.3.2. Market Size Absolute $ Opportunity Analysis and Forecast, By By Type, 2016-2032
- 8.3.3. Capsules
- 8.3.4. Injectables
- 8.3.5. Tablets
- 8.4. Latin America Chloroquine Market Analysis, Opportunity and Forecast, By By Application, 2016-2032
- 8.4.1. Latin America Chloroquine Market Analysis by By Application: Introduction
- 8.4.2. Market Size Absolute $ Opportunity Analysis and Forecast, By By Application, 2016-2032
- 8.4.3. Malaria
- 8.4.4. Arthrophlogosis
- 8.4.5. Others
- 8.5. Latin America Chloroquine Market Analysis, Opportunity and Forecast, By Country , 2016-2032
- 8.5.1. Latin America Chloroquine Market Analysis by Country : Introduction
- 8.5.2. Market Size Absolute $ Opportunity Analysis and Forecast, Country , 2016-2032
- 8.5.2.1. Brazil
- 8.5.2.2. Colombia
- 8.5.2.3. Chile
- 8.5.2.4. Argentina
- 8.5.2.5. Costa Rica
- 8.5.2.6. Rest of Latin America
- 9. Middle East & Africa Chloroquine Market Analysis, Opportunity and Forecast, 2016-2032
- 9.1. Middle East & Africa Chloroquine Market Analysis, 2016-2021
- 9.2. Middle East & Africa Chloroquine Market Opportunity and Forecast, 2023-2032
- 9.3. Middle East & Africa Chloroquine Market Analysis, Opportunity and Forecast, By By Type, 2016-2032
- 9.3.1. Middle East & Africa Chloroquine Market Analysis by By Type: Introduction
- 9.3.2. Market Size Absolute $ Opportunity Analysis and Forecast, By By Type, 2016-2032
- 9.3.3. Capsules
- 9.3.4. Injectables
- 9.3.5. Tablets
- 9.4. Middle East & Africa Chloroquine Market Analysis, Opportunity and Forecast, By By Application, 2016-2032
- 9.4.1. Middle East & Africa Chloroquine Market Analysis by By Application: Introduction
- 9.4.2. Market Size Absolute $ Opportunity Analysis and Forecast, By By Application, 2016-2032
- 9.4.3. Malaria
- 9.4.4. Arthrophlogosis
- 9.4.5. Others
- 9.5. Middle East & Africa Chloroquine Market Analysis, Opportunity and Forecast, By Country , 2016-2032
- 9.5.1. Middle East & Africa Chloroquine Market Analysis by Country : Introduction
- 9.5.2. Market Size Absolute $ Opportunity Analysis and Forecast, Country , 2016-2032
- 9.5.2.1. Algeria
- 9.5.2.2. Egypt
- 9.5.2.3. Israel
- 9.5.2.4. Kuwait
- 9.5.2.5. Nigeria
- 9.5.2.6. Saudi Arabia
- 9.5.2.7. South Africa
- 9.5.2.8. Turkey
- 9.5.2.9. The UAE
- 9.5.2.10. Rest of MEA
- 10. Global Chloroquine Market Analysis, Opportunity and Forecast, By Region , 2016-2032
- 10.1. Global Chloroquine Market Analysis by Region : Introduction
- 10.2. Market Size Absolute $ Opportunity Analysis and Forecast, By Region , 2016-2032
- 10.2.1. North America
- 10.2.2. Western Europe
- 10.2.3. Eastern Europe
- 10.2.4. APAC
- 10.2.5. Latin America
- 10.2.6. Middle East & Africa
- 11. Global Chloroquine Market Competitive Landscape, Market Share Analysis, and Company Profiles
- 11.1. Market Share Analysis
- 11.2. Company Profiles
- 11.3. Abcam Plc
- 11.3.1. Company Overview
- 11.3.2. Financial Highlights
- 11.3.3. Product Portfolio
- 11.3.4. SWOT Analysis
- 11.3.5. Key Strategies and Developments
- 11.4. ADVANZ PHARMA Corp.
- 11.4.1. Company Overview
- 11.4.2. Financial Highlights
- 11.4.3. Product Portfolio
- 11.4.4. SWOT Analysis
- 11.4.5. Key Strategies and Developments
- 11.5. Bayer AG
- 11.5.1. Company Overview
- 11.5.2. Financial Highlights
- 11.5.3. Product Portfolio
- 11.5.4. SWOT Analysis
- 11.5.5. Key Strategies and Developments
- 11.6. Cadila Healthcare Ltd.
- 11.6.1. Company Overview
- 11.6.2. Financial Highlights
- 11.6.3. Product Portfolio
- 11.6.4. SWOT Analysis
- 11.6.5. Key Strategies and Developments
- 11.7. Ipca Laboratories Ltd.
- 11.7.1. Company Overview
- 11.7.2. Financial Highlights
- 11.7.3. Product Portfolio
- 11.7.4. SWOT Analysis
- 11.7.5. Key Strategies and Developments
- 11.8. Mylan NV
- 11.8.1. Company Overview
- 11.8.2. Financial Highlights
- 11.8.3. Product Portfolio
- 11.8.4. SWOT Analysis
- 11.8.5. Key Strategies and Developments
- 11.9. Novartis AG
- 11.9.1. Company Overview
- 11.9.2. Financial Highlights
- 11.9.3. Product Portfolio
- 11.9.4. SWOT Analysis
- 11.9.5. Key Strategies and Developments
- 11.10. Sanofi
- 11.10.1. Company Overview
- 11.10.2. Financial Highlights
- 11.10.3. Product Portfolio
- 11.10.4. SWOT Analysis
- 11.10.5. Key Strategies and Developments
- 11.11. Sun Pharmaceutical Industries Ltd.
- 11.11.1. Company Overview
- 11.11.2. Financial Highlights
- 11.11.3. Product Portfolio
- 11.11.4. SWOT Analysis
- 11.11.5. Key Strategies and Developments
- 11.12. Teva Pharmaceutical Industries Ltd.
- 11.12.1. Company Overview
- 11.12.2. Financial Highlights
- 11.12.3. Product Portfolio
- 11.12.4. SWOT Analysis
- 11.12.5. Key Strategies and Developments
- 11.13.1. Company Overview
- 11.13.2. Financial Highlights
- 11.13.3. Product Portfolio
- 11.13.4. SWOT Analysis
- 11.13.5. Key Strategies and Developments
- 12. Assumptions and Acronyms
- 13. Research Methodology
- 14. Contact
"
- List of Figures
- "
- Figure 1: Global Chloroquine Market Revenue (US$ Mn) Market Share by By Type in 2022
- Figure 2: Global Chloroquine Market Market Attractiveness Analysis by By Type, 2016-2032
- Figure 3: Global Chloroquine Market Revenue (US$ Mn) Market Share by By Applicationin 2022
- Figure 4: Global Chloroquine Market Market Attractiveness Analysis by By Application, 2016-2032
- Figure 5: Global Chloroquine Market Revenue (US$ Mn) Market Share by Region in 2022
- Figure 6: Global Chloroquine Market Market Attractiveness Analysis by Region, 2016-2032
- Figure 7: Global Chloroquine Market Market Revenue (US$ Mn) (2016-2032)
- Figure 8: Global Chloroquine Market Market Revenue (US$ Mn) Comparison by Region (2016-2032)
- Figure 9: Global Chloroquine Market Market Revenue (US$ Mn) Comparison by By Type (2016-2032)
- Figure 10: Global Chloroquine Market Market Revenue (US$ Mn) Comparison by By Application (2016-2032)
- Figure 11: Global Chloroquine Market Market Y-o-Y Growth Rate Comparison by Region (2016-2032)
- Figure 12: Global Chloroquine Market Market Y-o-Y Growth Rate Comparison by By Type (2016-2032)
- Figure 13: Global Chloroquine Market Market Y-o-Y Growth Rate Comparison by By Application (2016-2032)
- Figure 14: Global Chloroquine Market Market Share Comparison by Region (2016-2032)
- Figure 15: Global Chloroquine Market Market Share Comparison by By Type (2016-2032)
- Figure 16: Global Chloroquine Market Market Share Comparison by By Application (2016-2032)
- Figure 17: North America Chloroquine Market Revenue (US$ Mn) Market Share by By Typein 2022
- Figure 18: North America Chloroquine Market Market Attractiveness Analysis by By Type, 2016-2032
- Figure 19: North America Chloroquine Market Revenue (US$ Mn) Market Share by By Applicationin 2022
- Figure 20: North America Chloroquine Market Market Attractiveness Analysis by By Application, 2016-2032
- Figure 21: North America Chloroquine Market Revenue (US$ Mn) Market Share by Country in 2022
- Figure 22: North America Chloroquine Market Market Attractiveness Analysis by Country, 2016-2032
- Figure 23: North America Chloroquine Market Market Revenue (US$ Mn) (2016-2032)
- Figure 24: North America Chloroquine Market Market Revenue (US$ Mn) Comparison by Country (2016-2032)
- Figure 25: North America Chloroquine Market Market Revenue (US$ Mn) Comparison by By Type (2016-2032)
- Figure 26: North America Chloroquine Market Market Revenue (US$ Mn) Comparison by By Application (2016-2032)
- Figure 27: North America Chloroquine Market Market Y-o-Y Growth Rate Comparison by Country (2016-2032)
- Figure 28: North America Chloroquine Market Market Y-o-Y Growth Rate Comparison by By Type (2016-2032)
- Figure 29: North America Chloroquine Market Market Y-o-Y Growth Rate Comparison by By Application (2016-2032)
- Figure 30: North America Chloroquine Market Market Share Comparison by Country (2016-2032)
- Figure 31: North America Chloroquine Market Market Share Comparison by By Type (2016-2032)
- Figure 32: North America Chloroquine Market Market Share Comparison by By Application (2016-2032)
- Figure 33: Western Europe Chloroquine Market Revenue (US$ Mn) Market Share by By Typein 2022
- Figure 34: Western Europe Chloroquine Market Market Attractiveness Analysis by By Type, 2016-2032
- Figure 35: Western Europe Chloroquine Market Revenue (US$ Mn) Market Share by By Applicationin 2022
- Figure 36: Western Europe Chloroquine Market Market Attractiveness Analysis by By Application, 2016-2032
- Figure 37: Western Europe Chloroquine Market Revenue (US$ Mn) Market Share by Country in 2022
- Figure 38: Western Europe Chloroquine Market Market Attractiveness Analysis by Country, 2016-2032
- Figure 39: Western Europe Chloroquine Market Market Revenue (US$ Mn) (2016-2032)
- Figure 40: Western Europe Chloroquine Market Market Revenue (US$ Mn) Comparison by Country (2016-2032)
- Figure 41: Western Europe Chloroquine Market Market Revenue (US$ Mn) Comparison by By Type (2016-2032)
- Figure 42: Western Europe Chloroquine Market Market Revenue (US$ Mn) Comparison by By Application (2016-2032)
- Figure 43: Western Europe Chloroquine Market Market Y-o-Y Growth Rate Comparison by Country (2016-2032)
- Figure 44: Western Europe Chloroquine Market Market Y-o-Y Growth Rate Comparison by By Type (2016-2032)
- Figure 45: Western Europe Chloroquine Market Market Y-o-Y Growth Rate Comparison by By Application (2016-2032)
- Figure 46: Western Europe Chloroquine Market Market Share Comparison by Country (2016-2032)
- Figure 47: Western Europe Chloroquine Market Market Share Comparison by By Type (2016-2032)
- Figure 48: Western Europe Chloroquine Market Market Share Comparison by By Application (2016-2032)
- Figure 49: Eastern Europe Chloroquine Market Revenue (US$ Mn) Market Share by By Typein 2022
- Figure 50: Eastern Europe Chloroquine Market Market Attractiveness Analysis by By Type, 2016-2032
- Figure 51: Eastern Europe Chloroquine Market Revenue (US$ Mn) Market Share by By Applicationin 2022
- Figure 52: Eastern Europe Chloroquine Market Market Attractiveness Analysis by By Application, 2016-2032
- Figure 53: Eastern Europe Chloroquine Market Revenue (US$ Mn) Market Share by Country in 2022
- Figure 54: Eastern Europe Chloroquine Market Market Attractiveness Analysis by Country, 2016-2032
- Figure 55: Eastern Europe Chloroquine Market Market Revenue (US$ Mn) (2016-2032)
- Figure 56: Eastern Europe Chloroquine Market Market Revenue (US$ Mn) Comparison by Country (2016-2032)
- Figure 57: Eastern Europe Chloroquine Market Market Revenue (US$ Mn) Comparison by By Type (2016-2032)
- Figure 58: Eastern Europe Chloroquine Market Market Revenue (US$ Mn) Comparison by By Application (2016-2032)
- Figure 59: Eastern Europe Chloroquine Market Market Y-o-Y Growth Rate Comparison by Country (2016-2032)
- Figure 60: Eastern Europe Chloroquine Market Market Y-o-Y Growth Rate Comparison by By Type (2016-2032)
- Figure 61: Eastern Europe Chloroquine Market Market Y-o-Y Growth Rate Comparison by By Application (2016-2032)
- Figure 62: Eastern Europe Chloroquine Market Market Share Comparison by Country (2016-2032)
- Figure 63: Eastern Europe Chloroquine Market Market Share Comparison by By Type (2016-2032)
- Figure 64: Eastern Europe Chloroquine Market Market Share Comparison by By Application (2016-2032)
- Figure 65: APAC Chloroquine Market Revenue (US$ Mn) Market Share by By Typein 2022
- Figure 66: APAC Chloroquine Market Market Attractiveness Analysis by By Type, 2016-2032
- Figure 67: APAC Chloroquine Market Revenue (US$ Mn) Market Share by By Applicationin 2022
- Figure 68: APAC Chloroquine Market Market Attractiveness Analysis by By Application, 2016-2032
- Figure 69: APAC Chloroquine Market Revenue (US$ Mn) Market Share by Country in 2022
- Figure 70: APAC Chloroquine Market Market Attractiveness Analysis by Country, 2016-2032
- Figure 71: APAC Chloroquine Market Market Revenue (US$ Mn) (2016-2032)
- Figure 72: APAC Chloroquine Market Market Revenue (US$ Mn) Comparison by Country (2016-2032)
- Figure 73: APAC Chloroquine Market Market Revenue (US$ Mn) Comparison by By Type (2016-2032)
- Figure 74: APAC Chloroquine Market Market Revenue (US$ Mn) Comparison by By Application (2016-2032)
- Figure 75: APAC Chloroquine Market Market Y-o-Y Growth Rate Comparison by Country (2016-2032)
- Figure 76: APAC Chloroquine Market Market Y-o-Y Growth Rate Comparison by By Type (2016-2032)
- Figure 77: APAC Chloroquine Market Market Y-o-Y Growth Rate Comparison by By Application (2016-2032)
- Figure 78: APAC Chloroquine Market Market Share Comparison by Country (2016-2032)
- Figure 79: APAC Chloroquine Market Market Share Comparison by By Type (2016-2032)
- Figure 80: APAC Chloroquine Market Market Share Comparison by By Application (2016-2032)
- Figure 81: Latin America Chloroquine Market Revenue (US$ Mn) Market Share by By Typein 2022
- Figure 82: Latin America Chloroquine Market Market Attractiveness Analysis by By Type, 2016-2032
- Figure 83: Latin America Chloroquine Market Revenue (US$ Mn) Market Share by By Applicationin 2022
- Figure 84: Latin America Chloroquine Market Market Attractiveness Analysis by By Application, 2016-2032
- Figure 85: Latin America Chloroquine Market Revenue (US$ Mn) Market Share by Country in 2022
- Figure 86: Latin America Chloroquine Market Market Attractiveness Analysis by Country, 2016-2032
- Figure 87: Latin America Chloroquine Market Market Revenue (US$ Mn) (2016-2032)
- Figure 88: Latin America Chloroquine Market Market Revenue (US$ Mn) Comparison by Country (2016-2032)
- Figure 89: Latin America Chloroquine Market Market Revenue (US$ Mn) Comparison by By Type (2016-2032)
- Figure 90: Latin America Chloroquine Market Market Revenue (US$ Mn) Comparison by By Application (2016-2032)
- Figure 91: Latin America Chloroquine Market Market Y-o-Y Growth Rate Comparison by Country (2016-2032)
- Figure 92: Latin America Chloroquine Market Market Y-o-Y Growth Rate Comparison by By Type (2016-2032)
- Figure 93: Latin America Chloroquine Market Market Y-o-Y Growth Rate Comparison by By Application (2016-2032)
- Figure 94: Latin America Chloroquine Market Market Share Comparison by Country (2016-2032)
- Figure 95: Latin America Chloroquine Market Market Share Comparison by By Type (2016-2032)
- Figure 96: Latin America Chloroquine Market Market Share Comparison by By Application (2016-2032)
- Figure 97: Middle East & Africa Chloroquine Market Revenue (US$ Mn) Market Share by By Typein 2022
- Figure 98: Middle East & Africa Chloroquine Market Market Attractiveness Analysis by By Type, 2016-2032
- Figure 99: Middle East & Africa Chloroquine Market Revenue (US$ Mn) Market Share by By Applicationin 2022
- Figure 100: Middle East & Africa Chloroquine Market Market Attractiveness Analysis by By Application, 2016-2032
- Figure 101: Middle East & Africa Chloroquine Market Revenue (US$ Mn) Market Share by Country in 2022
- Figure 102: Middle East & Africa Chloroquine Market Market Attractiveness Analysis by Country, 2016-2032
- Figure 103: Middle East & Africa Chloroquine Market Market Revenue (US$ Mn) (2016-2032)
- Figure 104: Middle East & Africa Chloroquine Market Market Revenue (US$ Mn) Comparison by Country (2016-2032)
- Figure 105: Middle East & Africa Chloroquine Market Market Revenue (US$ Mn) Comparison by By Type (2016-2032)
- Figure 106: Middle East & Africa Chloroquine Market Market Revenue (US$ Mn) Comparison by By Application (2016-2032)
- Figure 107: Middle East & Africa Chloroquine Market Market Y-o-Y Growth Rate Comparison by Country (2016-2032)
- Figure 108: Middle East & Africa Chloroquine Market Market Y-o-Y Growth Rate Comparison by By Type (2016-2032)
- Figure 109: Middle East & Africa Chloroquine Market Market Y-o-Y Growth Rate Comparison by By Application (2016-2032)
- Figure 110: Middle East & Africa Chloroquine Market Market Share Comparison by Country (2016-2032)
- Figure 111: Middle East & Africa Chloroquine Market Market Share Comparison by By Type (2016-2032)
- Figure 112: Middle East & Africa Chloroquine Market Market Share Comparison by By Application (2016-2032)
"
- List of Tables
- "
- Table 1: Global Chloroquine Market Market Comparison by By Type (2016-2032)
- Table 2: Global Chloroquine Market Market Comparison by By Application (2016-2032)
- Table 3: Global Chloroquine Market Revenue (US$ Mn) Comparison by Region (2016-2032)
- Table 4: Global Chloroquine Market Market Revenue (US$ Mn) (2016-2032)
- Table 5: Global Chloroquine Market Market Revenue (US$ Mn) Comparison by Region (2016-2032)
- Table 6: Global Chloroquine Market Market Revenue (US$ Mn) Comparison by By Type (2016-2032)
- Table 7: Global Chloroquine Market Market Revenue (US$ Mn) Comparison by By Application (2016-2032)
- Table 8: Global Chloroquine Market Market Y-o-Y Growth Rate Comparison by Region (2016-2032)
- Table 9: Global Chloroquine Market Market Y-o-Y Growth Rate Comparison by By Type (2016-2032)
- Table 10: Global Chloroquine Market Market Y-o-Y Growth Rate Comparison by By Application (2016-2032)
- Table 11: Global Chloroquine Market Market Share Comparison by Region (2016-2032)
- Table 12: Global Chloroquine Market Market Share Comparison by By Type (2016-2032)
- Table 13: Global Chloroquine Market Market Share Comparison by By Application (2016-2032)
- Table 14: North America Chloroquine Market Market Comparison by By Application (2016-2032)
- Table 15: North America Chloroquine Market Revenue (US$ Mn) Comparison by Country (2016-2032)
- Table 16: North America Chloroquine Market Market Revenue (US$ Mn) (2016-2032)
- Table 17: North America Chloroquine Market Market Revenue (US$ Mn) Comparison by Country (2016-2032)
- Table 18: North America Chloroquine Market Market Revenue (US$ Mn) Comparison by By Type (2016-2032)
- Table 19: North America Chloroquine Market Market Revenue (US$ Mn) Comparison by By Application (2016-2032)
- Table 20: North America Chloroquine Market Market Y-o-Y Growth Rate Comparison by Country (2016-2032)
- Table 21: North America Chloroquine Market Market Y-o-Y Growth Rate Comparison by By Type (2016-2032)
- Table 22: North America Chloroquine Market Market Y-o-Y Growth Rate Comparison by By Application (2016-2032)
- Table 23: North America Chloroquine Market Market Share Comparison by Country (2016-2032)
- Table 24: North America Chloroquine Market Market Share Comparison by By Type (2016-2032)
- Table 25: North America Chloroquine Market Market Share Comparison by By Application (2016-2032)
- Table 26: Western Europe Chloroquine Market Market Comparison by By Type (2016-2032)
- Table 27: Western Europe Chloroquine Market Market Comparison by By Application (2016-2032)
- Table 28: Western Europe Chloroquine Market Revenue (US$ Mn) Comparison by Country (2016-2032)
- Table 29: Western Europe Chloroquine Market Market Revenue (US$ Mn) (2016-2032)
- Table 30: Western Europe Chloroquine Market Market Revenue (US$ Mn) Comparison by Country (2016-2032)
- Table 31: Western Europe Chloroquine Market Market Revenue (US$ Mn) Comparison by By Type (2016-2032)
- Table 32: Western Europe Chloroquine Market Market Revenue (US$ Mn) Comparison by By Application (2016-2032)
- Table 33: Western Europe Chloroquine Market Market Y-o-Y Growth Rate Comparison by Country (2016-2032)
- Table 34: Western Europe Chloroquine Market Market Y-o-Y Growth Rate Comparison by By Type (2016-2032)
- Table 35: Western Europe Chloroquine Market Market Y-o-Y Growth Rate Comparison by By Application (2016-2032)
- Table 36: Western Europe Chloroquine Market Market Share Comparison by Country (2016-2032)
- Table 37: Western Europe Chloroquine Market Market Share Comparison by By Type (2016-2032)
- Table 38: Western Europe Chloroquine Market Market Share Comparison by By Application (2016-2032)
- Table 39: Eastern Europe Chloroquine Market Market Comparison by By Type (2016-2032)
- Table 40: Eastern Europe Chloroquine Market Market Comparison by By Application (2016-2032)
- Table 41: Eastern Europe Chloroquine Market Revenue (US$ Mn) Comparison by Country (2016-2032)
- Table 42: Eastern Europe Chloroquine Market Market Revenue (US$ Mn) (2016-2032)
- Table 43: Eastern Europe Chloroquine Market Market Revenue (US$ Mn) Comparison by Country (2016-2032)
- Table 44: Eastern Europe Chloroquine Market Market Revenue (US$ Mn) Comparison by By Type (2016-2032)
- Table 45: Eastern Europe Chloroquine Market Market Revenue (US$ Mn) Comparison by By Application (2016-2032)
- Table 46: Eastern Europe Chloroquine Market Market Y-o-Y Growth Rate Comparison by Country (2016-2032)
- Table 47: Eastern Europe Chloroquine Market Market Y-o-Y Growth Rate Comparison by By Type (2016-2032)
- Table 48: Eastern Europe Chloroquine Market Market Y-o-Y Growth Rate Comparison by By Application (2016-2032)
- Table 49: Eastern Europe Chloroquine Market Market Share Comparison by Country (2016-2032)
- Table 50: Eastern Europe Chloroquine Market Market Share Comparison by By Type (2016-2032)
- Table 51: Eastern Europe Chloroquine Market Market Share Comparison by By Application (2016-2032)
- Table 52: APAC Chloroquine Market Market Comparison by By Type (2016-2032)
- Table 53: APAC Chloroquine Market Market Comparison by By Application (2016-2032)
- Table 54: APAC Chloroquine Market Revenue (US$ Mn) Comparison by Country (2016-2032)
- Table 55: APAC Chloroquine Market Market Revenue (US$ Mn) (2016-2032)
- Table 56: APAC Chloroquine Market Market Revenue (US$ Mn) Comparison by Country (2016-2032)
- Table 57: APAC Chloroquine Market Market Revenue (US$ Mn) Comparison by By Type (2016-2032)
- Table 58: APAC Chloroquine Market Market Revenue (US$ Mn) Comparison by By Application (2016-2032)
- Table 59: APAC Chloroquine Market Market Y-o-Y Growth Rate Comparison by Country (2016-2032)
- Table 60: APAC Chloroquine Market Market Y-o-Y Growth Rate Comparison by By Type (2016-2032)
- Table 61: APAC Chloroquine Market Market Y-o-Y Growth Rate Comparison by By Application (2016-2032)
- Table 62: APAC Chloroquine Market Market Share Comparison by Country (2016-2032)
- Table 63: APAC Chloroquine Market Market Share Comparison by By Type (2016-2032)
- Table 64: APAC Chloroquine Market Market Share Comparison by By Application (2016-2032)
- Table 65: Latin America Chloroquine Market Market Comparison by By Type (2016-2032)
- Table 66: Latin America Chloroquine Market Market Comparison by By Application (2016-2032)
- Table 67: Latin America Chloroquine Market Revenue (US$ Mn) Comparison by Country (2016-2032)
- Table 68: Latin America Chloroquine Market Market Revenue (US$ Mn) (2016-2032)
- Table 69: Latin America Chloroquine Market Market Revenue (US$ Mn) Comparison by Country (2016-2032)
- Table 70: Latin America Chloroquine Market Market Revenue (US$ Mn) Comparison by By Type (2016-2032)
- Table 71: Latin America Chloroquine Market Market Revenue (US$ Mn) Comparison by By Application (2016-2032)
- Table 72: Latin America Chloroquine Market Market Y-o-Y Growth Rate Comparison by Country (2016-2032)
- Table 73: Latin America Chloroquine Market Market Y-o-Y Growth Rate Comparison by By Type (2016-2032)
- Table 74: Latin America Chloroquine Market Market Y-o-Y Growth Rate Comparison by By Application (2016-2032)
- Table 75: Latin America Chloroquine Market Market Share Comparison by Country (2016-2032)
- Table 76: Latin America Chloroquine Market Market Share Comparison by By Type (2016-2032)
- Table 77: Latin America Chloroquine Market Market Share Comparison by By Application (2016-2032)
- Table 78: Middle East & Africa Chloroquine Market Market Comparison by By Type (2016-2032)
- Table 79: Middle East & Africa Chloroquine Market Market Comparison by By Application (2016-2032)
- Table 80: Middle East & Africa Chloroquine Market Revenue (US$ Mn) Comparison by Country (2016-2032)
- Table 81: Middle East & Africa Chloroquine Market Market Revenue (US$ Mn) (2016-2032)
- Table 82: Middle East & Africa Chloroquine Market Market Revenue (US$ Mn) Comparison by Country (2016-2032)
- Table 83: Middle East & Africa Chloroquine Market Market Revenue (US$ Mn) Comparison by By Type (2016-2032)
- Table 84: Middle East & Africa Chloroquine Market Market Revenue (US$ Mn) Comparison by By Application (2016-2032)
- Table 85: Middle East & Africa Chloroquine Market Market Y-o-Y Growth Rate Comparison by Country (2016-2032)
- Table 86: Middle East & Africa Chloroquine Market Market Y-o-Y Growth Rate Comparison by By Type (2016-2032)
- Table 87: Middle East & Africa Chloroquine Market Market Y-o-Y Growth Rate Comparison by By Application (2016-2032)
- Table 88: Middle East & Africa Chloroquine Market Market Share Comparison by Country (2016-2032)
- Table 89: Middle East & Africa Chloroquine Market Market Share Comparison by By Type (2016-2032)
- Table 90: Middle East & Africa Chloroquine Market Market Share Comparison by By Application (2016-2032)
- 1. Executive Summary
-
- Abcam Plc
- ADVANZ PHARMA Corp.
- Bayer AG
- Cadila Healthcare Ltd.
- Ipca Laboratories Ltd.
- Mylan NV
- Novartis AG
- Sanofi
- Sun Pharmaceutical Industries Ltd.
- Teva Pharmaceutical Industries Ltd.
Our Clients


View Our Licence Options
