
Carotenoids Market By Type (Astaxanthin, Beta-carotene, Lutein, Lycopene, Others), By Application (Feed, Food, Supplements), By Method of Production (Chemical synthesis and Extraction from botanical material), By Formulation Type, By Region And Companies - Industry Segment Outlook, Market Assessment, Competition Scenario, Trends, And Forecast 2023-2032
-
7510
-
May 2023
-
173
-


-
This report was compiled by Shreyas Rokade Shreyas Rokade is a seasoned Research Analyst with CMFE, bringing extensive expertise in market research and consulting, with a strong background in Chemical Engineering. Correspondence Team Lead-CMFE Linkedin | Detailed Market research Methodology Our methodology involves a mix of primary research, including interviews with leading mental health experts, and secondary research from reputable medical journals and databases. View Detailed Methodology Page
-
Quick Navigation
Report Overview
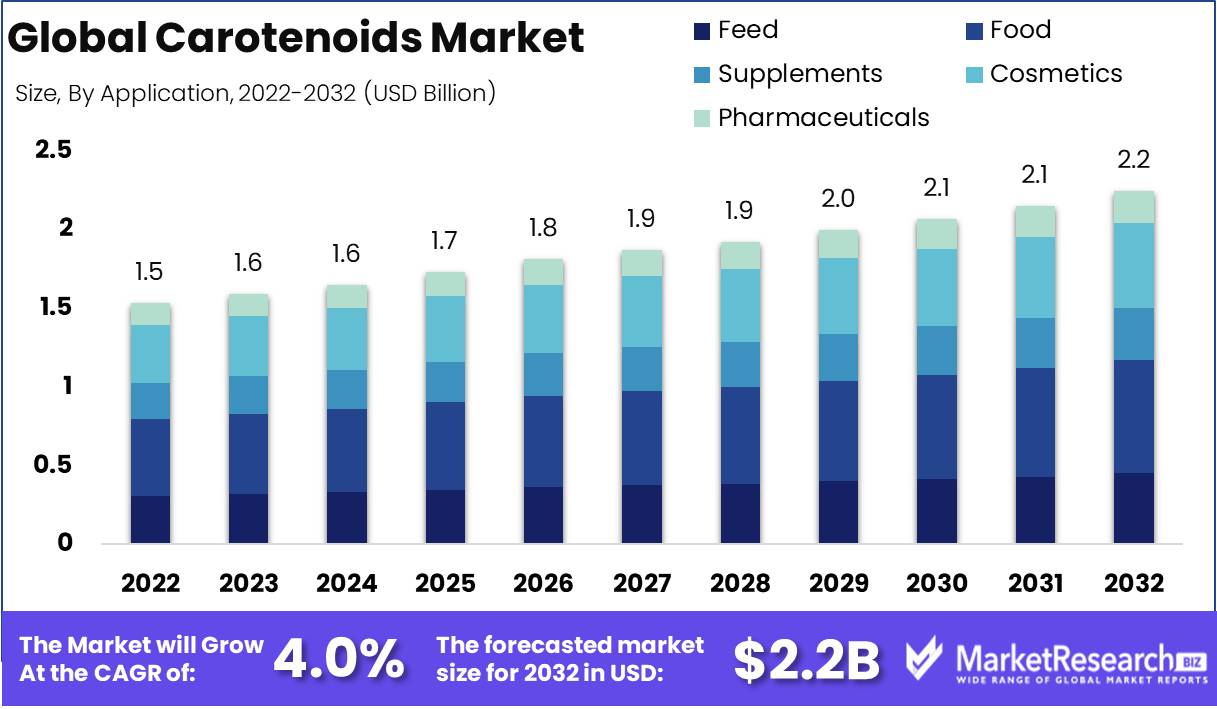
Carotenoids Market size is expected to be worth around USD 2.2 Bn by 2032 from USD 1.5 Bn in 2022, growing at a CAGR of 4.0% during the forecast period from 2023 to 2032.
The Carotenoids Market is a rapidly expanding industry that offers numerous advantages to both consumers and businesses. This overview of the report seeks to provide a comprehensive comprehension of the market, its significance and benefits, notable innovations, major investments, growth and applications, as well as ethical concerns and responsible practices.
The Carotenoids Market is a flourishing industry that generates a variety of natural pigments found in carrots, tomatoes, and pumpkins, among others. Due to their numerous health benefits and natural coloring properties, carotenoids are increasingly utilized in food and beverages, dietary supplements, pharmaceuticals, and cosmetics.
Carotenoids are an essential part of a healthy and well-balanced diet, as they provide essential nutrients and antioxidants that contribute to the promotion of overall health. They are also extensively used as natural colorants in the food industry, where their applications range from color enhancement to UV protection. Due to their anti-inflammatory and anti-oxidant properties, carotenoids are also utilized in the cosmetic and pharmaceutical industries. This has led to the creation of numerous carotenoids-based products, including supplements, cosmetics, and ocular health products.
In recent years, the Carotenoids Market has witnessed numerous noteworthy innovations, with new products and applications continuously arising. The development of microencapsulation technology, which facilitates the controlled release of carotenoids in the body, is a significant innovation. The use of fermentation to generate carotenoids, the development of water-soluble carotenoids, and the use of algae as a source of carotenoids are also noteworthy innovations.
Several ethical concerns have been raised about the Carotenoids Market, primarily regarding the use of natural resources and animal experimentation. To address these concerns, Carotenoids Market participants have prioritized transparency, explicability, and accountability. In addition, there is a growing trend toward responsible procurement, with companies working to procure carotenoids from sustainable sources.
Driving factors
A Nutritional Renaissance
The carotenoids market, fuelled by a variety of growth factors, is exploding and captivating multiple industries. Due to their commendable nutritional value and health-enhancing properties, natural colorants and antioxidants are gaining in popularity as the years progress. Carotenoids, which are revered as a rich source of antioxidants, are increasingly recognized as indispensable constituents in the ever-changing food and beverage industry. Concurrently, the surge of health-conscious consumers drives the demand for supplements and nutraceuticals, paving the way for protection against the onslaught of chronic diseases.
Past the Plate
Carotenoids are extending their influence into feed additives, a territory that is expanding in tandem with the rising demand for livestock and poultry products. Their awe-inspiring characteristics reveal a multitude of benefits, including boosting the immune response and improving the quality of flesh in our beloved animal companions. Carotenoids' allure transcends further, permeating the mysterious topography of the cosmetic and personal care industries. Here, their radiant presence spawns a new generation of skincare miracles with the ability to reduce inflammation and defy time's relentless march.
A Kaleidoscope of Potential
The vibrant tints of carotenoids emerge as natural colorants in the production of biofuels, sparking a revolution in the pursuit of a greener future. At the same time, the pharmaceutical industry marvels at the extraordinary properties of carotenoids, utilizing their antimicrobial, anticancer, and anti-inflammatory prowess to combat the ever-present threat of disease.
Innovative Carotenoid Extraction
In the chronicles of innovation, a symphony of development orchestrates advancements in the extraction and purification of carotenoids, making it a commercially viable and sustainable endeavor. These ground-breaking advances illuminate the path to limitless expansion in the thriving carotenoids market.
Carotenoids on the Cusp of Alteration
The carotenoids market teeters on the precipice of change as it navigates the complex corridors of regulation. Regulatory bodies, exemplified by the esteemed U.S. Food and Drug Administration (FDA), ponder the establishment of maximal limits for select carotenoids in dietary supplements, prompted by residual toxicity concerns. Once implemented, this momentous decision has the potential to reshape the supplement industry's demand for carotenoids.
Nano-Guardians
Emerging technologies such as nanotechnology, which are at the forefront of scientific progress, hold the tantalizing promise of enhancing the potency of carotenoids. This extraordinary domain holds the key to deciphering their solubility and bioavailability, unlocking a treasure trove of inventive applications that have the potential to revolutionize the world of carotenoids.
Face to Face With Innovation
In the midst of the enthralling crescendo of progress, potential disruptors stand large, casting a specter of uncertainty over the carotenoids market's competitive landscape. The emergence of synthetic colorants and the growing acceptance of plant-based alternatives threaten the very essence of natural colorants, initiating a paradigm shift that may jeopardize carotenoids' reign.
Restraining Factors
Basic materials and price fluctuations
The limited availability of raw materials is one of the most significant market restraints for carotenoids. Carotenoids are obtained from carrots, tomatoes, spinach, and kale, among other fruits and vegetables. These basic materials are required in significant quantities for the production of carotenoids. Nonetheless, these basic materials are in short supply, and their prices fluctuate.
Stringent Regulations and Labeling Requirements
Carotenoids Market is governed by stringent regulations and labeling requirements imposed by numerous government agencies. The purpose of these regulations is to ensure the safety and purity of the products. However, compliance with these regulations can be costly and time-consuming.
Insufficient consumer knowledge
Insufficient consumer understanding of the health advantages of carotenoids is another factor restraining the carotenoids market. Carotenoids reduce the risk of cancer, cardiovascular disease, and eye disease, among other health benefits. Nonetheless, numerous consumers are unaware of these advantages.
Man-Made Dyes and Antioxidants
Carotenoids Market is contested by synthetic colorants and antioxidants. The production of synthetic colorants and antioxidants is less expensive and simpler than that of natural carotenoids. In addition, synthetic products can be mass-produced, making them more attractive to manufacturers.
Absence of standardization and quality control
Lack of standardization and quality control is another factor restraining Carotenoids Market. Manufacturers frequently use various extraction and purification techniques, resulting in variations in product quality and composition.
Type Analysis
The carotenoids market can be segmented into various types based on the source of carotenoids. Beta-carotene, a type of carotenoid, is the most dominant segment in the market. Beta-carotene is extensively used as a dietary supplement, food coloring agent, and as a precursor of vitamin A. The segment is expected to grow rapidly in the future due to the increasing use of beta-carotene in various industries such as food, cosmetics, and pharmaceuticals.
Consumers are increasingly aware of the health benefits of beta-carotene, which has led to an increase in its consumption. The segment has gained popularity as a natural supplement, with the potential to provide significant benefits such as improving vision, preventing cancer, and reducing the risk of heart disease. Beta-carotene is also known to have anti-inflammatory properties and can prevent certain chronic diseases. The beta-carotene segment is anticipated to register the fastest growth rate due to its increasing demand in various industries. The segment's popularity can be attributed to its diverse applications, such as its use as a health supplement, food coloring, and a beauty ingredient.
Application Analysis
The food segment dominates the carotenoids market. Carotenoids are used in food products to add color, flavor, and nutritional value to them. The segment is expected to witness significant growth in the years to come due to increasing demand from food manufacturers for natural and healthy additives.
Consumers are increasingly aware of the importance of natural additives in food products. This has led to a rise in demand for food products containing natural additives, such as carotenoids. Carotenoids are increasingly being used in various food products, particularly in bakery and confectionery products, to enhance their aesthetic appeal and nutritional value. The food segment of the carotenoids market is expected to witness significant growth over the upcoming years, owing to a rise in demand for natural and healthy additives.
Formulation Type Analysis
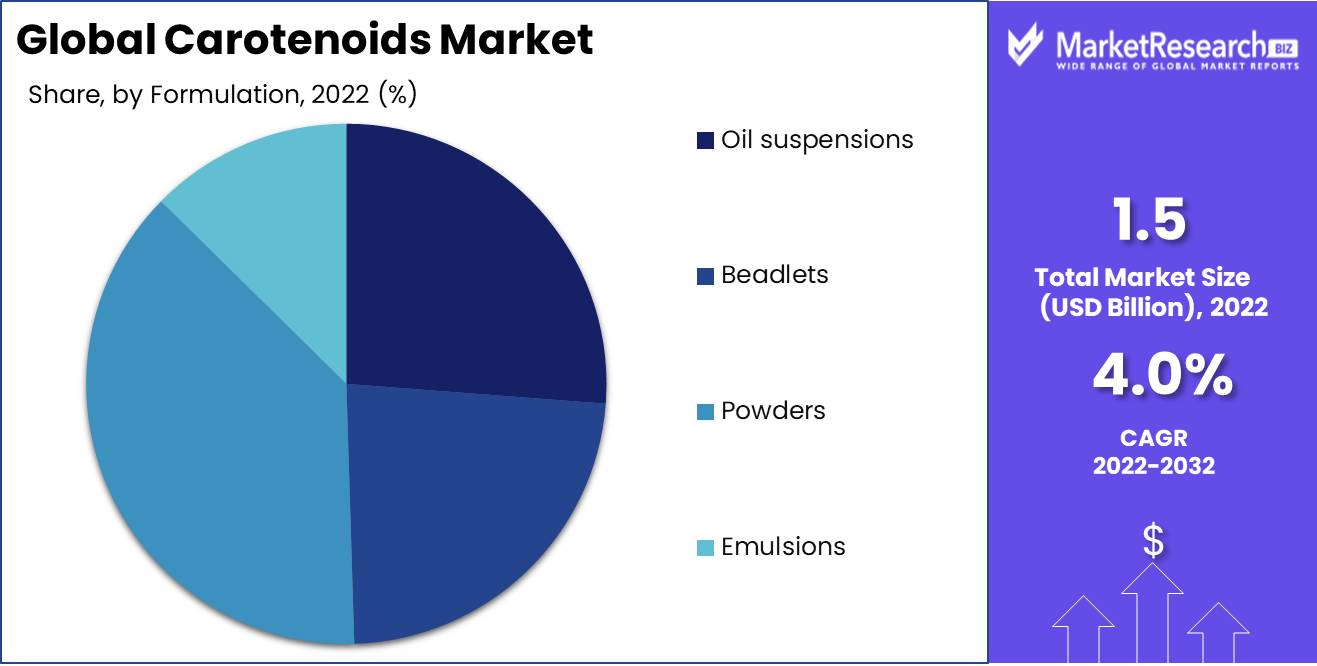
The powders segment dominates the carotenoids market, particularly the food and beverage industry. This is due to the ease of use of powdered carotenoids and their ability to be easily blended with food products without altering their texture or taste. Powdered carotenoids are used extensively as natural food colorants and nutritional supplements.
Powdered carotenoids are perceived positively by consumers, as they are natural and can enhance the nutritional value of food products. Consumers are increasingly demanding natural and healthy food products, which has led to a rise in the adoption of powdered carotenoids in various food products such as baked goods, dairy products, and confectionery. The powdered segment of the carotenoids market is anticipated to register significant growth over the upcoming years, owing to the growing demand for natural and healthy food products.
Key Market Segments
By Type
- Astaxanthin
- Beta-carotene
- Lutein
- Lycopene
- Canthaxanthin
- Zeaxanthin
- Others (annatto, capsanthin, fucoxanthin, and trans-β-apo-8'-carotenal)
By Application
- Feed
- Food
- Supplements
- Cosmetics
- Pharmaceuticals
By Method of Production
- Chemical synthesis
- Extraction from botanical material
- Fermentation
- Algae route
By Formulation Type
- Oil suspensions
- Beadlets
- Powders
- Emulsions
Growth Opportunity
Surviving New Frontiers
A combination of variables propels the carotenoids market's amazing expansion. The desire for natural and organic food and beverages is high, and carotenoids are in high demand thanks to the growing appeal of new markets in Asia-Pacific and Latin America. As people seek consolation in the deep advantages of carotenoids, the landscape of preventative healthcare and wellness is shifting, adding fuel to the fire. Carotenoids take center stage in the age-defying and inflammation-fighting world of cosmetics and personal care, adding a whole new dimension to the industry. Innovating carotenoids with improved health benefits requires persistent research and development.
Enthralling Rise
Asia-Pacific and Latin America lead the carotenoids market in growth. These areas love carotenoids, driven by a desire for natural and organic goods. Asia-Pacific consumers' constant concern on health drives carotenoids' skyrocketing demand. Carotenoids are popular throughout Latin America.
Organic Foods
Natural and organic foods are a welcome alternative to artificial and synthetic food items. Carotenoids are abundant in fruits and vegetables. Carotenoids brighten our plates as the need for natural colorants in the food business rises.
Preventative Healthcare
Carotenoids represent a new dawn in preventative medicine. These extraordinary chemicals provide promise as chronic illnesses rise worldwide. Lycopene, lutein, and zeaxanthin work together to fight cancer, cataracts, and cardiovascular illnesses. The demand for carotenoids is driven by a commitment to health, enabling people to create a better future.
Secret Weapon
Carotenoids assume their due position in cosmetics and personal care. These bright molecules revolutionize beauty with their unmatched anti-aging and anti-inflammatory capabilities. Beta-carotene and lycopene shield our skin from UV radiation and time. Carotenoids provide hair strength and vibrancy.
Innovative Frontier
The carotenoids market leads innovation as the globe celebrates research and development. Scientists explore the limitless potential of astaxanthin, lycopene, and their famous partners. They want to understand cancer prevention, cardiovascular fortifying, and neurodegenerative disease prevention. Every carotenoids advance opens the door to a future with unparalleled health advantages.
Growth Kaleidoscope
The carotenoids market is a vast tapestry of growing threads. Emerging markets, natural and organic food items, preventative healthcare, cosmetics and personal care, and research and development all point to a market primed for expansion. Carotenoids shine as rays of hope, illuminating the way to a better, healthier future as chronic illnesses cast their dismal shadows.
Latest Trends
Plant-Based Carotenoids Surpassing
The increasing demand for plant-based carotenoids is a crucial trend in the carotenoids market. Naturally more bioavailable than synthetic carotenoids, plant-based carotenoids offer a variety of health benefits. Additionally, they are more sustainable and environmentally beneficial because they do not require animal products.
Microorganisms for Carotenoids Production
Another trend on Carotenoids Market is the increasing use of microorganisms for carotenoids production. Microorganisms such as bacteria, yeast, and fungi are used to produce carotenoids in a cost-effective and environmentally friendly manner. This production method has numerous advantages, including controlled production, low production costs, and a smaller environmental footprint.
sustainable production practices
As environmental concerns continue to rise, Carotenoids Market is also witnessing a rise in the adoption of sustainable production methods and the utilization of renewable energy. Organic farming, biodynamic farming, and aquaponics are sustainable production methods that reduce the use of pesticides and other detrimental substances. In addition, production facilities are powered by renewable energy sources such as solar, wind, and hydroelectric power, reducing reliance on fossil fuels.
Functional Foods and Beverages
Functional foods and beverages are those that have health benefits in addition to their nutritional value. Due to their numerous health benefits, including antioxidant and anti-inflammatory properties, carotenoids are increasingly used in functional foods and beverages. Carotenoids are being introduced to a variety of products, such as energy bars, sports beverages, and supplements.
Extraction and Purification Technologies
In addition, the development of novel extraction and purification technologies for carotenoids drives Carotenoids Market. These techniques are utilized to extract carotenoids from natural sources including fruits, vegetables, and microorganisms. They are also used to purify carotenoids, thereby increasing their bioavailability and efficacy.
Regional Analysis
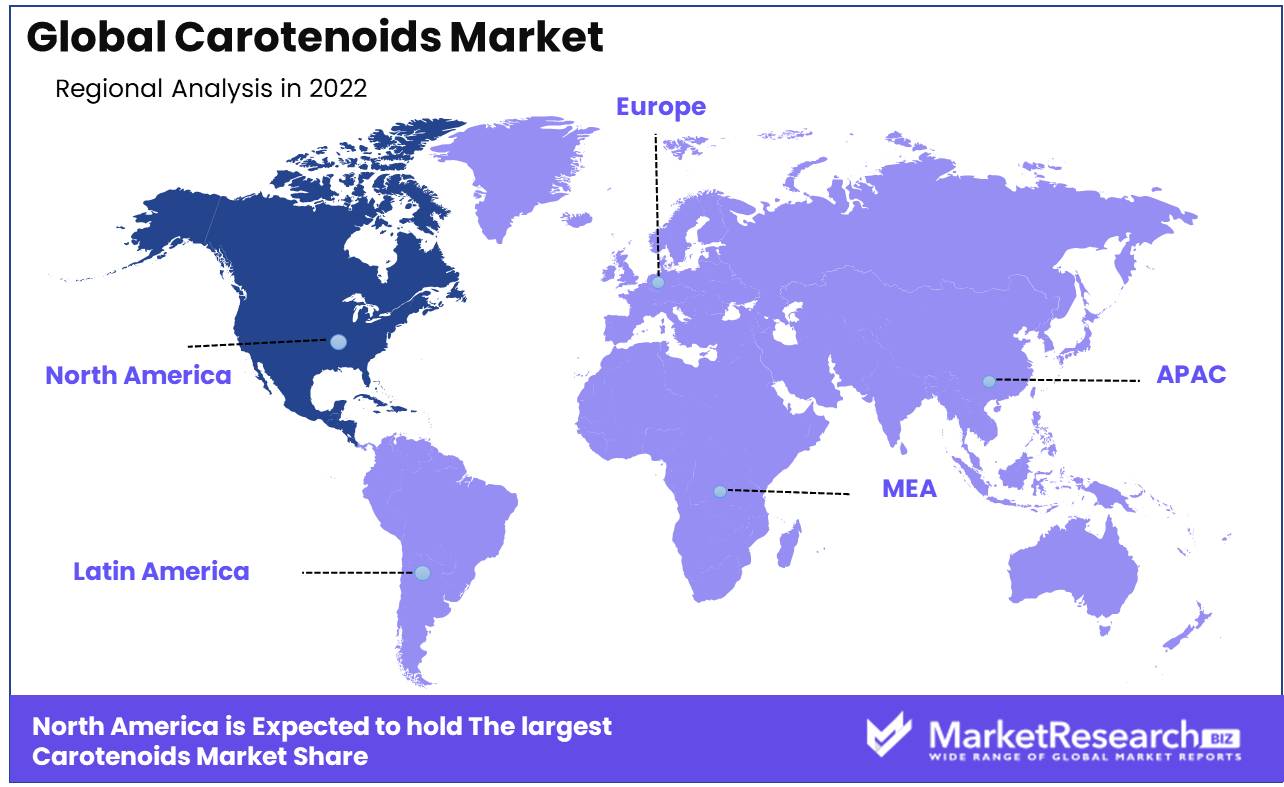
Carotenoids have numerous health advantages, including protection against cancer, cardiovascular disease, and age-related macular degeneration, according to research. On the North American market, the demand for carotenoids has increased due to these advantages. More than 35 percent of the global demand for carotenoids is satisfied by the North American market. In North America, Carotenoids Market has been driven by an increase in the demand for natural food colorants and supplements, as well as a rise in health consciousness. The market is anticipated to expand at a 4.8% CAGR during the forecast period.
Northern America The most common application of carotenoids is as a natural dietary coloring. They are utilized to impart vibrant color to culinary products without the use of synthetic compounds. In North America, carotenoids are commonly found in beverages, dairy products, and baked foods. Carotenoids not only give food color, but they also have health advantages. They are antioxidants that provide protection against free radicals, which can damage cells and contribute to chronic diseases.
Key Regions and Countries
North America
- US
- Canada
- Mexico
Western Europe
- Germany
- France
- The UK
- Spain
- Italy
- Portugal
- Ireland
- Austria
- Switzerland
- Benelux
- Nordic
- Rest of Western Europe
Eastern Europe
- Russia
- Poland
- The Czech Republic
- Greece
- Rest of Eastern Europe
APAC
- China
- Japan
- South Korea
- India
- Australia & New Zealand
- Indonesia
- Malaysia
- Philippines
- Singapore
- Thailand
- Vietnam
- Rest of APAC
Latin America
- Brazil
- Colombia
- Chile
- Argentina
- Costa Rica
- Rest of Latin America
Middle East & Africa
- Algeria
- Egypt
- Israel
- Kuwait
- Nigeria
- Saudi Arabia
- South Africa
- Turkey
- United Arab Emirates
- Rest of MEA
Key Players Analysis
As an expert content writer, I have analyzed the global Carotenoids Market and identified the industry's main participants. Carotenoids are organic pigments found in plants, algae, and some microbes that give fruits, vegetables, and blossoms their vibrant colors. They are used in the food, feed, and cosmetics industries and have vital health benefits.
DSM, BASF, Chr. Hansen, Kemin Industries, FMC Corporation, Dohler, Allied Biochemicals, Excelvite, and Kalsec Inc. are some of the leading companies in the carotenoids market. Due to their extensive product portfolios, research and development efforts, and strategic alliances with manufacturers and distributors worldwide, these companies have a strong presence on the global carotenoids market.
DSM, a Dutch multinational corporation, is a market leader in carotenoids, offering a vast array of products for food, feed, and personal care applications. The business has a significant presence in Europe, North America, and Asia-Pacific. Similarly, the German chemical company BASF offers a wide variety of carotenoid products for the food, feed, and cosmetics industries that are renowned for their superior quality and performance.
Chr. Hansen, a Danish bioscience company, and Kemin Industries, an American producer of natural ingredients, are also market leaders in the carotenoids industry. These businesses are well-known for their innovative products, sustainable business practices, and dedication to enhancing the health and well-being of consumers worldwide.
Top Key Players in Carotenoids Market
- BASF SE
- Royal DSM N.V.
- Hansen A/S
- FMC Corporation
- Cyanotech Corporation
- Kemin Industries Inc.
- D. Williamson & Co., Inc.
- Döhler Group
- Allied Biotech Corporation
Recent Development
In November 2021, Recent advancements are expected to shake up the Carotenoids Market. DSM released CaroCare® Organic. DSM's organic carotenoid is likely to create ripples in the industry.
In August 2021, Not to be outdone, BASF announced the acquisition of Isobionics, a Dutch biotech business that makes natural tastes and perfumes. BASF will obtain access to Isobionics' technology and product range, strengthening its carotenoids market position.
In April 2021, Lycored, a leader in carotenoid-based natural colorants, unveiled Lumenato, a plant-based food color line. This revolutionary product range meets the rising need for natural and plant-based food coloring.
In January 2021, Kemin Industries launched AstaZine® Natural Astaxanthin products. This novel astaxanthin line from Haematococcus pluvialis microalgae will change how customers see supplements and functional meals.
Report Scope:
Report Features Description Market Value (2022) USD 1.5 Bn Forecast Revenue (2032) USD 2.2 Bn CAGR (2023-2032) 4% Base Year for Estimation 2022 Historic Period 2016-2022 Forecast Period 2023-2032 Report Coverage Revenue Forecast, Market Dynamics, COVID-19 Impact, Competitive Landscape, Recent Developments Segments Covered By Type (Astaxanthin, Beta-carotene, Lutein, Lycopene, Canthaxanthin, Zeaxanthin, Others (annatto, capsanthin, fucoxanthin, and trans-β-apo-8'-carotenal))
By Application (Feed, Food, Supplements, Cosmetics, Pharmaceuticals)
By Method of Production (Chemical synthesis, Extraction from botanical material, Fermentation, Algae route)
By Formulation Type (Oil suspensions, Beadlets, Powders, Emulsions)Regional Analysis North America – The US, Canada, & Mexico; Western Europe – Germany, France, The UK, Spain, Italy, Portugal, Ireland, Austria, Switzerland, Benelux, Nordic, & Rest of Western Europe; Eastern Europe – Russia, Poland, The Czech Republic, Greece, & Rest of Eastern Europe; APAC – China, Japan, South Korea, India, Australia & New Zealand, Indonesia, Malaysia, Philippines, Singapore, Thailand, Vietnam, & Rest of APAC; Latin America – Brazil, Colombia, Chile, Argentina, Costa Rica, & Rest of Latin America; Middle East & Africa – Algeria, Egypt, Israel, Kuwait, Nigeria, Saudi Arabia, South Africa, Turkey, United Arab Emirates, & Rest of MEA Competitive Landscape BASF SE, Royal DSM N.V., Hansen A/S, FMC Corporation, Cyanotech Corporation, Kemin Industries Inc., D. Williamson & Co., Inc., Döhler Group, Allied Biotech Corporation Customization Scope Customization for segments, region/country-level will be provided. Moreover, additional customization can be done based on the requirements. Purchase Options We have three licenses to opt for: Single User License, Multi-User License (Up to 5 Users), Corporate Use License (Unlimited User and Printable PDF) -
- 1. Executive Summary
- 1.1. Definition
- 1.2. Taxonomy
- 1.3. Research Scope
- 1.4. Key Analysis
- 1.5. Key Findings by Major Segments
- 1.6. Top strategies by Major Players
- 2. Global Carotenoids Market Overview
- 2.1. Carotenoids Market Dynamics
- 2.1.1. Drivers
- 2.1.2. Opportunities
- 2.1.3. Restraints
- 2.1.4. Challenges
- 2.2. Macro-economic Factors
- 2.3. Regulatory Framework
- 2.4. Market Investment Feasibility Index
- 2.5. PEST Analysis
- 2.6. PORTER’S Five Force Analysis
- 2.7. Drivers & Restraints Impact Analysis
- 2.8. Industry Chain Analysis
- 2.9. Cost Structure Analysis
- 2.10. Marketing Strategy
- 2.11. Russia-Ukraine War Impact Analysis
- 2.12. Opportunity Map Analysis
- 2.13. Market Competition Scenario Analysis
- 2.14. Product Life Cycle Analysis
- 2.15. Opportunity Orbits
- 2.16. Manufacturer Intensity Map
- 2.17. Major Companies sales by Value & Volume
- 2.1. Carotenoids Market Dynamics
- 3. Global Carotenoids Market Analysis, Opportunity and Forecast, 2016-2032
- 3.1. Global Carotenoids Market Analysis, 2016-2021
- 3.2. Global Carotenoids Market Opportunity and Forecast, 2023-2032
- 3.3. Global Carotenoids Market Analysis, Opportunity and Forecast, By By Type, 2016-2032
- 3.3.1. Global Carotenoids Market Analysis by By Type: Introduction
- 3.3.2. Market Size Absolute $ Opportunity Analysis and Forecast, By By Type, 2016-2032
- 3.3.3. Astaxanthin
- 3.3.4. Beta-carotene
- 3.3.5. Lutein
- 3.3.6. Lycopene
- 3.3.7. Canthaxanthin
- 3.3.8. Zeaxanthin
- 3.3.9. Others (annatto, capsanthin, fucoxanthin, and trans-β-apo-8'-carotenal)
- 3.4. Global Carotenoids Market Analysis, Opportunity and Forecast, By By Application, 2016-2032
- 3.4.1. Global Carotenoids Market Analysis by By Application: Introduction
- 3.4.2. Market Size Absolute $ Opportunity Analysis and Forecast, By By Application, 2016-2032
- 3.4.3. Feed
- 3.4.4. Food
- 3.4.5. Supplements
- 3.4.6. Cosmetics
- 3.4.7. Pharmaceuticals
- 3.5. Global Carotenoids Market Analysis, Opportunity and Forecast, By By Method of Production, 2016-2032
- 3.5.1. Global Carotenoids Market Analysis by By Method of Production: Introduction
- 3.5.2. Market Size Absolute $ Opportunity Analysis and Forecast, By By Method of Production, 2016-2032
- 3.5.3. Chemical synthesis
- 3.5.4. Extraction from botanical material
- 3.5.5. Fermentation
- 3.5.6. Algae route
- 3.6. Global Carotenoids Market Analysis, Opportunity and Forecast, By By Formulation Type, 2016-2032
- 3.6.1. Global Carotenoids Market Analysis by By Formulation Type: Introduction
- 3.6.2. Market Size Absolute $ Opportunity Analysis and Forecast, By By Formulation Type, 2016-2032
- 3.6.3. Oil suspensions
- 3.6.4. Beadlets
- 3.6.5. Powders
- 3.6.6. Emulsions
- 4. North America Carotenoids Market Analysis, Opportunity and Forecast, 2016-2032
- 4.1. North America Carotenoids Market Analysis, 2016-2021
- 4.2. North America Carotenoids Market Opportunity and Forecast, 2023-2032
- 4.3. North America Carotenoids Market Analysis, Opportunity and Forecast, By By Type, 2016-2032
- 4.3.1. North America Carotenoids Market Analysis by By Type: Introduction
- 4.3.2. Market Size Absolute $ Opportunity Analysis and Forecast, By By Type, 2016-2032
- 4.3.3. Astaxanthin
- 4.3.4. Beta-carotene
- 4.3.5. Lutein
- 4.3.6. Lycopene
- 4.3.7. Canthaxanthin
- 4.3.8. Zeaxanthin
- 4.3.9. Others (annatto, capsanthin, fucoxanthin, and trans-β-apo-8'-carotenal)
- 4.4. North America Carotenoids Market Analysis, Opportunity and Forecast, By By Application, 2016-2032
- 4.4.1. North America Carotenoids Market Analysis by By Application: Introduction
- 4.4.2. Market Size Absolute $ Opportunity Analysis and Forecast, By By Application, 2016-2032
- 4.4.3. Feed
- 4.4.4. Food
- 4.4.5. Supplements
- 4.4.6. Cosmetics
- 4.4.7. Pharmaceuticals
- 4.5. North America Carotenoids Market Analysis, Opportunity and Forecast, By By Method of Production, 2016-2032
- 4.5.1. North America Carotenoids Market Analysis by By Method of Production: Introduction
- 4.5.2. Market Size Absolute $ Opportunity Analysis and Forecast, By By Method of Production, 2016-2032
- 4.5.3. Chemical synthesis
- 4.5.4. Extraction from botanical material
- 4.5.5. Fermentation
- 4.5.6. Algae route
- 4.6. North America Carotenoids Market Analysis, Opportunity and Forecast, By By Formulation Type, 2016-2032
- 4.6.1. North America Carotenoids Market Analysis by By Formulation Type: Introduction
- 4.6.2. Market Size Absolute $ Opportunity Analysis and Forecast, By By Formulation Type, 2016-2032
- 4.6.3. Oil suspensions
- 4.6.4. Beadlets
- 4.6.5. Powders
- 4.6.6. Emulsions
- 4.7. North America Carotenoids Market Analysis, Opportunity and Forecast, By Country , 2016-2032
- 4.7.1. North America Carotenoids Market Analysis by Country : Introduction
- 4.7.2. Market Size Absolute $ Opportunity Analysis and Forecast, Country , 2016-2032
- 4.7.2.1. The US
- 4.7.2.2. Canada
- 4.7.2.3. Mexico
- 5. Western Europe Carotenoids Market Analysis, Opportunity and Forecast, 2016-2032
- 5.1. Western Europe Carotenoids Market Analysis, 2016-2021
- 5.2. Western Europe Carotenoids Market Opportunity and Forecast, 2023-2032
- 5.3. Western Europe Carotenoids Market Analysis, Opportunity and Forecast, By By Type, 2016-2032
- 5.3.1. Western Europe Carotenoids Market Analysis by By Type: Introduction
- 5.3.2. Market Size Absolute $ Opportunity Analysis and Forecast, By By Type, 2016-2032
- 5.3.3. Astaxanthin
- 5.3.4. Beta-carotene
- 5.3.5. Lutein
- 5.3.6. Lycopene
- 5.3.7. Canthaxanthin
- 5.3.8. Zeaxanthin
- 5.3.9. Others (annatto, capsanthin, fucoxanthin, and trans-β-apo-8'-carotenal)
- 5.4. Western Europe Carotenoids Market Analysis, Opportunity and Forecast, By By Application, 2016-2032
- 5.4.1. Western Europe Carotenoids Market Analysis by By Application: Introduction
- 5.4.2. Market Size Absolute $ Opportunity Analysis and Forecast, By By Application, 2016-2032
- 5.4.3. Feed
- 5.4.4. Food
- 5.4.5. Supplements
- 5.4.6. Cosmetics
- 5.4.7. Pharmaceuticals
- 5.5. Western Europe Carotenoids Market Analysis, Opportunity and Forecast, By By Method of Production, 2016-2032
- 5.5.1. Western Europe Carotenoids Market Analysis by By Method of Production: Introduction
- 5.5.2. Market Size Absolute $ Opportunity Analysis and Forecast, By By Method of Production, 2016-2032
- 5.5.3. Chemical synthesis
- 5.5.4. Extraction from botanical material
- 5.5.5. Fermentation
- 5.5.6. Algae route
- 5.6. Western Europe Carotenoids Market Analysis, Opportunity and Forecast, By By Formulation Type, 2016-2032
- 5.6.1. Western Europe Carotenoids Market Analysis by By Formulation Type: Introduction
- 5.6.2. Market Size Absolute $ Opportunity Analysis and Forecast, By By Formulation Type, 2016-2032
- 5.6.3. Oil suspensions
- 5.6.4. Beadlets
- 5.6.5. Powders
- 5.6.6. Emulsions
- 5.7. Western Europe Carotenoids Market Analysis, Opportunity and Forecast, By Country , 2016-2032
- 5.7.1. Western Europe Carotenoids Market Analysis by Country : Introduction
- 5.7.2. Market Size Absolute $ Opportunity Analysis and Forecast, Country , 2016-2032
- 5.7.2.1. Germany
- 5.7.2.2. France
- 5.7.2.3. The UK
- 5.7.2.4. Spain
- 5.7.2.5. Italy
- 5.7.2.6. Portugal
- 5.7.2.7. Ireland
- 5.7.2.8. Austria
- 5.7.2.9. Switzerland
- 5.7.2.10. Benelux
- 5.7.2.11. Nordic
- 5.7.2.12. Rest of Western Europe
- 6. Eastern Europe Carotenoids Market Analysis, Opportunity and Forecast, 2016-2032
- 6.1. Eastern Europe Carotenoids Market Analysis, 2016-2021
- 6.2. Eastern Europe Carotenoids Market Opportunity and Forecast, 2023-2032
- 6.3. Eastern Europe Carotenoids Market Analysis, Opportunity and Forecast, By By Type, 2016-2032
- 6.3.1. Eastern Europe Carotenoids Market Analysis by By Type: Introduction
- 6.3.2. Market Size Absolute $ Opportunity Analysis and Forecast, By By Type, 2016-2032
- 6.3.3. Astaxanthin
- 6.3.4. Beta-carotene
- 6.3.5. Lutein
- 6.3.6. Lycopene
- 6.3.7. Canthaxanthin
- 6.3.8. Zeaxanthin
- 6.3.9. Others (annatto, capsanthin, fucoxanthin, and trans-β-apo-8'-carotenal)
- 6.4. Eastern Europe Carotenoids Market Analysis, Opportunity and Forecast, By By Application, 2016-2032
- 6.4.1. Eastern Europe Carotenoids Market Analysis by By Application: Introduction
- 6.4.2. Market Size Absolute $ Opportunity Analysis and Forecast, By By Application, 2016-2032
- 6.4.3. Feed
- 6.4.4. Food
- 6.4.5. Supplements
- 6.4.6. Cosmetics
- 6.4.7. Pharmaceuticals
- 6.5. Eastern Europe Carotenoids Market Analysis, Opportunity and Forecast, By By Method of Production, 2016-2032
- 6.5.1. Eastern Europe Carotenoids Market Analysis by By Method of Production: Introduction
- 6.5.2. Market Size Absolute $ Opportunity Analysis and Forecast, By By Method of Production, 2016-2032
- 6.5.3. Chemical synthesis
- 6.5.4. Extraction from botanical material
- 6.5.5. Fermentation
- 6.5.6. Algae route
- 6.6. Eastern Europe Carotenoids Market Analysis, Opportunity and Forecast, By By Formulation Type, 2016-2032
- 6.6.1. Eastern Europe Carotenoids Market Analysis by By Formulation Type: Introduction
- 6.6.2. Market Size Absolute $ Opportunity Analysis and Forecast, By By Formulation Type, 2016-2032
- 6.6.3. Oil suspensions
- 6.6.4. Beadlets
- 6.6.5. Powders
- 6.6.6. Emulsions
- 6.7. Eastern Europe Carotenoids Market Analysis, Opportunity and Forecast, By Country , 2016-2032
- 6.7.1. Eastern Europe Carotenoids Market Analysis by Country : Introduction
- 6.7.2. Market Size Absolute $ Opportunity Analysis and Forecast, Country , 2016-2032
- 6.7.2.1. Russia
- 6.7.2.2. Poland
- 6.7.2.3. The Czech Republic
- 6.7.2.4. Greece
- 6.7.2.5. Rest of Eastern Europe
- 7. APAC Carotenoids Market Analysis, Opportunity and Forecast, 2016-2032
- 7.1. APAC Carotenoids Market Analysis, 2016-2021
- 7.2. APAC Carotenoids Market Opportunity and Forecast, 2023-2032
- 7.3. APAC Carotenoids Market Analysis, Opportunity and Forecast, By By Type, 2016-2032
- 7.3.1. APAC Carotenoids Market Analysis by By Type: Introduction
- 7.3.2. Market Size Absolute $ Opportunity Analysis and Forecast, By By Type, 2016-2032
- 7.3.3. Astaxanthin
- 7.3.4. Beta-carotene
- 7.3.5. Lutein
- 7.3.6. Lycopene
- 7.3.7. Canthaxanthin
- 7.3.8. Zeaxanthin
- 7.3.9. Others (annatto, capsanthin, fucoxanthin, and trans-β-apo-8'-carotenal)
- 7.4. APAC Carotenoids Market Analysis, Opportunity and Forecast, By By Application, 2016-2032
- 7.4.1. APAC Carotenoids Market Analysis by By Application: Introduction
- 7.4.2. Market Size Absolute $ Opportunity Analysis and Forecast, By By Application, 2016-2032
- 7.4.3. Feed
- 7.4.4. Food
- 7.4.5. Supplements
- 7.4.6. Cosmetics
- 7.4.7. Pharmaceuticals
- 7.5. APAC Carotenoids Market Analysis, Opportunity and Forecast, By By Method of Production, 2016-2032
- 7.5.1. APAC Carotenoids Market Analysis by By Method of Production: Introduction
- 7.5.2. Market Size Absolute $ Opportunity Analysis and Forecast, By By Method of Production, 2016-2032
- 7.5.3. Chemical synthesis
- 7.5.4. Extraction from botanical material
- 7.5.5. Fermentation
- 7.5.6. Algae route
- 7.6. APAC Carotenoids Market Analysis, Opportunity and Forecast, By By Formulation Type, 2016-2032
- 7.6.1. APAC Carotenoids Market Analysis by By Formulation Type: Introduction
- 7.6.2. Market Size Absolute $ Opportunity Analysis and Forecast, By By Formulation Type, 2016-2032
- 7.6.3. Oil suspensions
- 7.6.4. Beadlets
- 7.6.5. Powders
- 7.6.6. Emulsions
- 7.7. APAC Carotenoids Market Analysis, Opportunity and Forecast, By Country , 2016-2032
- 7.7.1. APAC Carotenoids Market Analysis by Country : Introduction
- 7.7.2. Market Size Absolute $ Opportunity Analysis and Forecast, Country , 2016-2032
- 7.7.2.1. China
- 7.7.2.2. Japan
- 7.7.2.3. South Korea
- 7.7.2.4. India
- 7.7.2.5. Australia & New Zeland
- 7.7.2.6. Indonesia
- 7.7.2.7. Malaysia
- 7.7.2.8. Philippines
- 7.7.2.9. Singapore
- 7.7.2.10. Thailand
- 7.7.2.11. Vietnam
- 7.7.2.12. Rest of APAC
- 8. Latin America Carotenoids Market Analysis, Opportunity and Forecast, 2016-2032
- 8.1. Latin America Carotenoids Market Analysis, 2016-2021
- 8.2. Latin America Carotenoids Market Opportunity and Forecast, 2023-2032
- 8.3. Latin America Carotenoids Market Analysis, Opportunity and Forecast, By By Type, 2016-2032
- 8.3.1. Latin America Carotenoids Market Analysis by By Type: Introduction
- 8.3.2. Market Size Absolute $ Opportunity Analysis and Forecast, By By Type, 2016-2032
- 8.3.3. Astaxanthin
- 8.3.4. Beta-carotene
- 8.3.5. Lutein
- 8.3.6. Lycopene
- 8.3.7. Canthaxanthin
- 8.3.8. Zeaxanthin
- 8.3.9. Others (annatto, capsanthin, fucoxanthin, and trans-β-apo-8'-carotenal)
- 8.4. Latin America Carotenoids Market Analysis, Opportunity and Forecast, By By Application, 2016-2032
- 8.4.1. Latin America Carotenoids Market Analysis by By Application: Introduction
- 8.4.2. Market Size Absolute $ Opportunity Analysis and Forecast, By By Application, 2016-2032
- 8.4.3. Feed
- 8.4.4. Food
- 8.4.5. Supplements
- 8.4.6. Cosmetics
- 8.4.7. Pharmaceuticals
- 8.5. Latin America Carotenoids Market Analysis, Opportunity and Forecast, By By Method of Production, 2016-2032
- 8.5.1. Latin America Carotenoids Market Analysis by By Method of Production: Introduction
- 8.5.2. Market Size Absolute $ Opportunity Analysis and Forecast, By By Method of Production, 2016-2032
- 8.5.3. Chemical synthesis
- 8.5.4. Extraction from botanical material
- 8.5.5. Fermentation
- 8.5.6. Algae route
- 8.6. Latin America Carotenoids Market Analysis, Opportunity and Forecast, By By Formulation Type, 2016-2032
- 8.6.1. Latin America Carotenoids Market Analysis by By Formulation Type: Introduction
- 8.6.2. Market Size Absolute $ Opportunity Analysis and Forecast, By By Formulation Type, 2016-2032
- 8.6.3. Oil suspensions
- 8.6.4. Beadlets
- 8.6.5. Powders
- 8.6.6. Emulsions
- 8.7. Latin America Carotenoids Market Analysis, Opportunity and Forecast, By Country , 2016-2032
- 8.7.1. Latin America Carotenoids Market Analysis by Country : Introduction
- 8.7.2. Market Size Absolute $ Opportunity Analysis and Forecast, Country , 2016-2032
- 8.7.2.1. Brazil
- 8.7.2.2. Colombia
- 8.7.2.3. Chile
- 8.7.2.4. Argentina
- 8.7.2.5. Costa Rica
- 8.7.2.6. Rest of Latin America
- 9. Middle East & Africa Carotenoids Market Analysis, Opportunity and Forecast, 2016-2032
- 9.1. Middle East & Africa Carotenoids Market Analysis, 2016-2021
- 9.2. Middle East & Africa Carotenoids Market Opportunity and Forecast, 2023-2032
- 9.3. Middle East & Africa Carotenoids Market Analysis, Opportunity and Forecast, By By Type, 2016-2032
- 9.3.1. Middle East & Africa Carotenoids Market Analysis by By Type: Introduction
- 9.3.2. Market Size Absolute $ Opportunity Analysis and Forecast, By By Type, 2016-2032
- 9.3.3. Astaxanthin
- 9.3.4. Beta-carotene
- 9.3.5. Lutein
- 9.3.6. Lycopene
- 9.3.7. Canthaxanthin
- 9.3.8. Zeaxanthin
- 9.3.9. Others (annatto, capsanthin, fucoxanthin, and trans-β-apo-8'-carotenal)
- 9.4. Middle East & Africa Carotenoids Market Analysis, Opportunity and Forecast, By By Application, 2016-2032
- 9.4.1. Middle East & Africa Carotenoids Market Analysis by By Application: Introduction
- 9.4.2. Market Size Absolute $ Opportunity Analysis and Forecast, By By Application, 2016-2032
- 9.4.3. Feed
- 9.4.4. Food
- 9.4.5. Supplements
- 9.4.6. Cosmetics
- 9.4.7. Pharmaceuticals
- 9.5. Middle East & Africa Carotenoids Market Analysis, Opportunity and Forecast, By By Method of Production, 2016-2032
- 9.5.1. Middle East & Africa Carotenoids Market Analysis by By Method of Production: Introduction
- 9.5.2. Market Size Absolute $ Opportunity Analysis and Forecast, By By Method of Production, 2016-2032
- 9.5.3. Chemical synthesis
- 9.5.4. Extraction from botanical material
- 9.5.5. Fermentation
- 9.5.6. Algae route
- 9.6. Middle East & Africa Carotenoids Market Analysis, Opportunity and Forecast, By By Formulation Type, 2016-2032
- 9.6.1. Middle East & Africa Carotenoids Market Analysis by By Formulation Type: Introduction
- 9.6.2. Market Size Absolute $ Opportunity Analysis and Forecast, By By Formulation Type, 2016-2032
- 9.6.3. Oil suspensions
- 9.6.4. Beadlets
- 9.6.5. Powders
- 9.6.6. Emulsions
- 9.7. Middle East & Africa Carotenoids Market Analysis, Opportunity and Forecast, By Country , 2016-2032
- 9.7.1. Middle East & Africa Carotenoids Market Analysis by Country : Introduction
- 9.7.2. Market Size Absolute $ Opportunity Analysis and Forecast, Country , 2016-2032
- 9.7.2.1. Algeria
- 9.7.2.2. Egypt
- 9.7.2.3. Israel
- 9.7.2.4. Kuwait
- 9.7.2.5. Nigeria
- 9.7.2.6. Saudi Arabia
- 9.7.2.7. South Africa
- 9.7.2.8. Turkey
- 9.7.2.9. The UAE
- 9.7.2.10. Rest of MEA
- 10. Global Carotenoids Market Analysis, Opportunity and Forecast, By Region , 2016-2032
- 10.1. Global Carotenoids Market Analysis by Region : Introduction
- 10.2. Market Size Absolute $ Opportunity Analysis and Forecast, By Region , 2016-2032
- 10.2.1. North America
- 10.2.2. Western Europe
- 10.2.3. Eastern Europe
- 10.2.4. APAC
- 10.2.5. Latin America
- 10.2.6. Middle East & Africa
- 11. Global Carotenoids Market Competitive Landscape, Market Share Analysis, and Company Profiles
- 11.1. Market Share Analysis
- 11.2. Company Profiles
- 11.3. BASF SE
- 11.3.1. Company Overview
- 11.3.2. Financial Highlights
- 11.3.3. Product Portfolio
- 11.3.4. SWOT Analysis
- 11.3.5. Key Strategies and Developments
- 11.4. Royal DSM N.V.
- 11.4.1. Company Overview
- 11.4.2. Financial Highlights
- 11.4.3. Product Portfolio
- 11.4.4. SWOT Analysis
- 11.4.5. Key Strategies and Developments
- 11.5. Hansen A/S
- 11.5.1. Company Overview
- 11.5.2. Financial Highlights
- 11.5.3. Product Portfolio
- 11.5.4. SWOT Analysis
- 11.5.5. Key Strategies and Developments
- 11.6. FMC Corporation
- 11.6.1. Company Overview
- 11.6.2. Financial Highlights
- 11.6.3. Product Portfolio
- 11.6.4. SWOT Analysis
- 11.6.5. Key Strategies and Developments
- 11.7. Cyanotech Corporation
- 11.7.1. Company Overview
- 11.7.2. Financial Highlights
- 11.7.3. Product Portfolio
- 11.7.4. SWOT Analysis
- 11.7.5. Key Strategies and Developments
- 11.8. Kemin Industries Inc.
- 11.8.1. Company Overview
- 11.8.2. Financial Highlights
- 11.8.3. Product Portfolio
- 11.8.4. SWOT Analysis
- 11.8.5. Key Strategies and Developments
- 11.9. D. Williamson & Co., Inc.
- 11.9.1. Company Overview
- 11.9.2. Financial Highlights
- 11.9.3. Product Portfolio
- 11.9.4. SWOT Analysis
- 11.9.5. Key Strategies and Developments
- 11.10. Döhler Group
- 11.10.1. Company Overview
- 11.10.2. Financial Highlights
- 11.10.3. Product Portfolio
- 11.10.4. SWOT Analysis
- 11.10.5. Key Strategies and Developments
- 11.11. Allied Biotech Corporation
- 11.11.1. Company Overview
- 11.11.2. Financial Highlights
- 11.11.3. Product Portfolio
- 11.11.4. SWOT Analysis
- 11.11.5. Key Strategies and Developments
- 12. Assumptions and Acronyms
- 13. Research Methodology
- 14. Contact
- List of Figures
- Figure 1: Global Carotenoids Market Revenue (US$ Mn) Market Share by By Type in 2022
- Figure 2: Global Carotenoids Market Attractiveness Analysis by By Type, 2016-2032
- Figure 3: Global Carotenoids Market Revenue (US$ Mn) Market Share by By Applicationin 2022
- Figure 4: Global Carotenoids Market Attractiveness Analysis by By Application, 2016-2032
- Figure 5: Global Carotenoids Market Revenue (US$ Mn) Market Share by By Method of Productionin 2022
- Figure 6: Global Carotenoids Market Attractiveness Analysis by By Method of Production, 2016-2032
- Figure 7: Global Carotenoids Market Revenue (US$ Mn) Market Share by By Formulation Typein 2022
- Figure 8: Global Carotenoids Market Attractiveness Analysis by By Formulation Type, 2016-2032
- Figure 9: Global Carotenoids Market Revenue (US$ Mn) Market Share by Region in 2022
- Figure 10: Global Carotenoids Market Attractiveness Analysis by Region, 2016-2032
- Figure 11: Global Carotenoids Market Revenue (US$ Mn) (2016-2032)
- Figure 12: Global Carotenoids Market Revenue (US$ Mn) Comparison by Region (2016-2032)
- Figure 13: Global Carotenoids Market Revenue (US$ Mn) Comparison by By Type (2016-2032)
- Figure 14: Global Carotenoids Market Revenue (US$ Mn) Comparison by By Application (2016-2032)
- Figure 15: Global Carotenoids Market Revenue (US$ Mn) Comparison by By Method of Production (2016-2032)
- Figure 16: Global Carotenoids Market Revenue (US$ Mn) Comparison by By Formulation Type (2016-2032)
- Figure 17: Global Carotenoids Market Y-o-Y Growth Rate Comparison by Region (2016-2032)
- Figure 18: Global Carotenoids Market Y-o-Y Growth Rate Comparison by By Type (2016-2032)
- Figure 19: Global Carotenoids Market Y-o-Y Growth Rate Comparison by By Application (2016-2032)
- Figure 20: Global Carotenoids Market Y-o-Y Growth Rate Comparison by By Method of Production (2016-2032)
- Figure 21: Global Carotenoids Market Y-o-Y Growth Rate Comparison by By Formulation Type (2016-2032)
- Figure 22: Global Carotenoids Market Share Comparison by Region (2016-2032)
- Figure 23: Global Carotenoids Market Share Comparison by By Type (2016-2032)
- Figure 24: Global Carotenoids Market Share Comparison by By Application (2016-2032)
- Figure 25: Global Carotenoids Market Share Comparison by By Method of Production (2016-2032)
- Figure 26: Global Carotenoids Market Share Comparison by By Formulation Type (2016-2032)
- Figure 27: North America Carotenoids Market Revenue (US$ Mn) Market Share by By Typein 2022
- Figure 28: North America Carotenoids Market Attractiveness Analysis by By Type, 2016-2032
- Figure 29: North America Carotenoids Market Revenue (US$ Mn) Market Share by By Applicationin 2022
- Figure 30: North America Carotenoids Market Attractiveness Analysis by By Application, 2016-2032
- Figure 31: North America Carotenoids Market Revenue (US$ Mn) Market Share by By Method of Productionin 2022
- Figure 32: North America Carotenoids Market Attractiveness Analysis by By Method of Production, 2016-2032
- Figure 33: North America Carotenoids Market Revenue (US$ Mn) Market Share by By Formulation Typein 2022
- Figure 34: North America Carotenoids Market Attractiveness Analysis by By Formulation Type, 2016-2032
- Figure 35: North America Carotenoids Market Revenue (US$ Mn) Market Share by Country in 2022
- Figure 36: North America Carotenoids Market Attractiveness Analysis by Country, 2016-2032
- Figure 37: North America Carotenoids Market Revenue (US$ Mn) (2016-2032)
- Figure 38: North America Carotenoids Market Revenue (US$ Mn) Comparison by Country (2016-2032)
- Figure 39: North America Carotenoids Market Revenue (US$ Mn) Comparison by By Type (2016-2032)
- Figure 40: North America Carotenoids Market Revenue (US$ Mn) Comparison by By Application (2016-2032)
- Figure 41: North America Carotenoids Market Revenue (US$ Mn) Comparison by By Method of Production (2016-2032)
- Figure 42: North America Carotenoids Market Revenue (US$ Mn) Comparison by By Formulation Type (2016-2032)
- Figure 43: North America Carotenoids Market Y-o-Y Growth Rate Comparison by Country (2016-2032)
- Figure 44: North America Carotenoids Market Y-o-Y Growth Rate Comparison by By Type (2016-2032)
- Figure 45: North America Carotenoids Market Y-o-Y Growth Rate Comparison by By Application (2016-2032)
- Figure 46: North America Carotenoids Market Y-o-Y Growth Rate Comparison by By Method of Production (2016-2032)
- Figure 47: North America Carotenoids Market Y-o-Y Growth Rate Comparison by By Formulation Type (2016-2032)
- Figure 48: North America Carotenoids Market Share Comparison by Country (2016-2032)
- Figure 49: North America Carotenoids Market Share Comparison by By Type (2016-2032)
- Figure 50: North America Carotenoids Market Share Comparison by By Application (2016-2032)
- Figure 51: North America Carotenoids Market Share Comparison by By Method of Production (2016-2032)
- Figure 52: North America Carotenoids Market Share Comparison by By Formulation Type (2016-2032)
- Figure 53: Western Europe Carotenoids Market Revenue (US$ Mn) Market Share by By Typein 2022
- Figure 54: Western Europe Carotenoids Market Attractiveness Analysis by By Type, 2016-2032
- Figure 55: Western Europe Carotenoids Market Revenue (US$ Mn) Market Share by By Applicationin 2022
- Figure 56: Western Europe Carotenoids Market Attractiveness Analysis by By Application, 2016-2032
- Figure 57: Western Europe Carotenoids Market Revenue (US$ Mn) Market Share by By Method of Productionin 2022
- Figure 58: Western Europe Carotenoids Market Attractiveness Analysis by By Method of Production, 2016-2032
- Figure 59: Western Europe Carotenoids Market Revenue (US$ Mn) Market Share by By Formulation Typein 2022
- Figure 60: Western Europe Carotenoids Market Attractiveness Analysis by By Formulation Type, 2016-2032
- Figure 61: Western Europe Carotenoids Market Revenue (US$ Mn) Market Share by Country in 2022
- Figure 62: Western Europe Carotenoids Market Attractiveness Analysis by Country, 2016-2032
- Figure 63: Western Europe Carotenoids Market Revenue (US$ Mn) (2016-2032)
- Figure 64: Western Europe Carotenoids Market Revenue (US$ Mn) Comparison by Country (2016-2032)
- Figure 65: Western Europe Carotenoids Market Revenue (US$ Mn) Comparison by By Type (2016-2032)
- Figure 66: Western Europe Carotenoids Market Revenue (US$ Mn) Comparison by By Application (2016-2032)
- Figure 67: Western Europe Carotenoids Market Revenue (US$ Mn) Comparison by By Method of Production (2016-2032)
- Figure 68: Western Europe Carotenoids Market Revenue (US$ Mn) Comparison by By Formulation Type (2016-2032)
- Figure 69: Western Europe Carotenoids Market Y-o-Y Growth Rate Comparison by Country (2016-2032)
- Figure 70: Western Europe Carotenoids Market Y-o-Y Growth Rate Comparison by By Type (2016-2032)
- Figure 71: Western Europe Carotenoids Market Y-o-Y Growth Rate Comparison by By Application (2016-2032)
- Figure 72: Western Europe Carotenoids Market Y-o-Y Growth Rate Comparison by By Method of Production (2016-2032)
- Figure 73: Western Europe Carotenoids Market Y-o-Y Growth Rate Comparison by By Formulation Type (2016-2032)
- Figure 74: Western Europe Carotenoids Market Share Comparison by Country (2016-2032)
- Figure 75: Western Europe Carotenoids Market Share Comparison by By Type (2016-2032)
- Figure 76: Western Europe Carotenoids Market Share Comparison by By Application (2016-2032)
- Figure 77: Western Europe Carotenoids Market Share Comparison by By Method of Production (2016-2032)
- Figure 78: Western Europe Carotenoids Market Share Comparison by By Formulation Type (2016-2032)
- Figure 79: Eastern Europe Carotenoids Market Revenue (US$ Mn) Market Share by By Typein 2022
- Figure 80: Eastern Europe Carotenoids Market Attractiveness Analysis by By Type, 2016-2032
- Figure 81: Eastern Europe Carotenoids Market Revenue (US$ Mn) Market Share by By Applicationin 2022
- Figure 82: Eastern Europe Carotenoids Market Attractiveness Analysis by By Application, 2016-2032
- Figure 83: Eastern Europe Carotenoids Market Revenue (US$ Mn) Market Share by By Method of Productionin 2022
- Figure 84: Eastern Europe Carotenoids Market Attractiveness Analysis by By Method of Production, 2016-2032
- Figure 85: Eastern Europe Carotenoids Market Revenue (US$ Mn) Market Share by By Formulation Typein 2022
- Figure 86: Eastern Europe Carotenoids Market Attractiveness Analysis by By Formulation Type, 2016-2032
- Figure 87: Eastern Europe Carotenoids Market Revenue (US$ Mn) Market Share by Country in 2022
- Figure 88: Eastern Europe Carotenoids Market Attractiveness Analysis by Country, 2016-2032
- Figure 89: Eastern Europe Carotenoids Market Revenue (US$ Mn) (2016-2032)
- Figure 90: Eastern Europe Carotenoids Market Revenue (US$ Mn) Comparison by Country (2016-2032)
- Figure 91: Eastern Europe Carotenoids Market Revenue (US$ Mn) Comparison by By Type (2016-2032)
- Figure 92: Eastern Europe Carotenoids Market Revenue (US$ Mn) Comparison by By Application (2016-2032)
- Figure 93: Eastern Europe Carotenoids Market Revenue (US$ Mn) Comparison by By Method of Production (2016-2032)
- Figure 94: Eastern Europe Carotenoids Market Revenue (US$ Mn) Comparison by By Formulation Type (2016-2032)
- Figure 95: Eastern Europe Carotenoids Market Y-o-Y Growth Rate Comparison by Country (2016-2032)
- Figure 96: Eastern Europe Carotenoids Market Y-o-Y Growth Rate Comparison by By Type (2016-2032)
- Figure 97: Eastern Europe Carotenoids Market Y-o-Y Growth Rate Comparison by By Application (2016-2032)
- Figure 98: Eastern Europe Carotenoids Market Y-o-Y Growth Rate Comparison by By Method of Production (2016-2032)
- Figure 99: Eastern Europe Carotenoids Market Y-o-Y Growth Rate Comparison by By Formulation Type (2016-2032)
- Figure 100: Eastern Europe Carotenoids Market Share Comparison by Country (2016-2032)
- Figure 101: Eastern Europe Carotenoids Market Share Comparison by By Type (2016-2032)
- Figure 102: Eastern Europe Carotenoids Market Share Comparison by By Application (2016-2032)
- Figure 103: Eastern Europe Carotenoids Market Share Comparison by By Method of Production (2016-2032)
- Figure 104: Eastern Europe Carotenoids Market Share Comparison by By Formulation Type (2016-2032)
- Figure 105: APAC Carotenoids Market Revenue (US$ Mn) Market Share by By Typein 2022
- Figure 106: APAC Carotenoids Market Attractiveness Analysis by By Type, 2016-2032
- Figure 107: APAC Carotenoids Market Revenue (US$ Mn) Market Share by By Applicationin 2022
- Figure 108: APAC Carotenoids Market Attractiveness Analysis by By Application, 2016-2032
- Figure 109: APAC Carotenoids Market Revenue (US$ Mn) Market Share by By Method of Productionin 2022
- Figure 110: APAC Carotenoids Market Attractiveness Analysis by By Method of Production, 2016-2032
- Figure 111: APAC Carotenoids Market Revenue (US$ Mn) Market Share by By Formulation Typein 2022
- Figure 112: APAC Carotenoids Market Attractiveness Analysis by By Formulation Type, 2016-2032
- Figure 113: APAC Carotenoids Market Revenue (US$ Mn) Market Share by Country in 2022
- Figure 114: APAC Carotenoids Market Attractiveness Analysis by Country, 2016-2032
- Figure 115: APAC Carotenoids Market Revenue (US$ Mn) (2016-2032)
- Figure 116: APAC Carotenoids Market Revenue (US$ Mn) Comparison by Country (2016-2032)
- Figure 117: APAC Carotenoids Market Revenue (US$ Mn) Comparison by By Type (2016-2032)
- Figure 118: APAC Carotenoids Market Revenue (US$ Mn) Comparison by By Application (2016-2032)
- Figure 119: APAC Carotenoids Market Revenue (US$ Mn) Comparison by By Method of Production (2016-2032)
- Figure 120: APAC Carotenoids Market Revenue (US$ Mn) Comparison by By Formulation Type (2016-2032)
- Figure 121: APAC Carotenoids Market Y-o-Y Growth Rate Comparison by Country (2016-2032)
- Figure 122: APAC Carotenoids Market Y-o-Y Growth Rate Comparison by By Type (2016-2032)
- Figure 123: APAC Carotenoids Market Y-o-Y Growth Rate Comparison by By Application (2016-2032)
- Figure 124: APAC Carotenoids Market Y-o-Y Growth Rate Comparison by By Method of Production (2016-2032)
- Figure 125: APAC Carotenoids Market Y-o-Y Growth Rate Comparison by By Formulation Type (2016-2032)
- Figure 126: APAC Carotenoids Market Share Comparison by Country (2016-2032)
- Figure 127: APAC Carotenoids Market Share Comparison by By Type (2016-2032)
- Figure 128: APAC Carotenoids Market Share Comparison by By Application (2016-2032)
- Figure 129: APAC Carotenoids Market Share Comparison by By Method of Production (2016-2032)
- Figure 130: APAC Carotenoids Market Share Comparison by By Formulation Type (2016-2032)
- Figure 131: Latin America Carotenoids Market Revenue (US$ Mn) Market Share by By Typein 2022
- Figure 132: Latin America Carotenoids Market Attractiveness Analysis by By Type, 2016-2032
- Figure 133: Latin America Carotenoids Market Revenue (US$ Mn) Market Share by By Applicationin 2022
- Figure 134: Latin America Carotenoids Market Attractiveness Analysis by By Application, 2016-2032
- Figure 135: Latin America Carotenoids Market Revenue (US$ Mn) Market Share by By Method of Productionin 2022
- Figure 136: Latin America Carotenoids Market Attractiveness Analysis by By Method of Production, 2016-2032
- Figure 137: Latin America Carotenoids Market Revenue (US$ Mn) Market Share by By Formulation Typein 2022
- Figure 138: Latin America Carotenoids Market Attractiveness Analysis by By Formulation Type, 2016-2032
- Figure 139: Latin America Carotenoids Market Revenue (US$ Mn) Market Share by Country in 2022
- Figure 140: Latin America Carotenoids Market Attractiveness Analysis by Country, 2016-2032
- Figure 141: Latin America Carotenoids Market Revenue (US$ Mn) (2016-2032)
- Figure 142: Latin America Carotenoids Market Revenue (US$ Mn) Comparison by Country (2016-2032)
- Figure 143: Latin America Carotenoids Market Revenue (US$ Mn) Comparison by By Type (2016-2032)
- Figure 144: Latin America Carotenoids Market Revenue (US$ Mn) Comparison by By Application (2016-2032)
- Figure 145: Latin America Carotenoids Market Revenue (US$ Mn) Comparison by By Method of Production (2016-2032)
- Figure 146: Latin America Carotenoids Market Revenue (US$ Mn) Comparison by By Formulation Type (2016-2032)
- Figure 147: Latin America Carotenoids Market Y-o-Y Growth Rate Comparison by Country (2016-2032)
- Figure 148: Latin America Carotenoids Market Y-o-Y Growth Rate Comparison by By Type (2016-2032)
- Figure 149: Latin America Carotenoids Market Y-o-Y Growth Rate Comparison by By Application (2016-2032)
- Figure 150: Latin America Carotenoids Market Y-o-Y Growth Rate Comparison by By Method of Production (2016-2032)
- Figure 151: Latin America Carotenoids Market Y-o-Y Growth Rate Comparison by By Formulation Type (2016-2032)
- Figure 152: Latin America Carotenoids Market Share Comparison by Country (2016-2032)
- Figure 153: Latin America Carotenoids Market Share Comparison by By Type (2016-2032)
- Figure 154: Latin America Carotenoids Market Share Comparison by By Application (2016-2032)
- Figure 155: Latin America Carotenoids Market Share Comparison by By Method of Production (2016-2032)
- Figure 156: Latin America Carotenoids Market Share Comparison by By Formulation Type (2016-2032)
- Figure 157: Middle East & Africa Carotenoids Market Revenue (US$ Mn) Market Share by By Typein 2022
- Figure 158: Middle East & Africa Carotenoids Market Attractiveness Analysis by By Type, 2016-2032
- Figure 159: Middle East & Africa Carotenoids Market Revenue (US$ Mn) Market Share by By Applicationin 2022
- Figure 160: Middle East & Africa Carotenoids Market Attractiveness Analysis by By Application, 2016-2032
- Figure 161: Middle East & Africa Carotenoids Market Revenue (US$ Mn) Market Share by By Method of Productionin 2022
- Figure 162: Middle East & Africa Carotenoids Market Attractiveness Analysis by By Method of Production, 2016-2032
- Figure 163: Middle East & Africa Carotenoids Market Revenue (US$ Mn) Market Share by By Formulation Typein 2022
- Figure 164: Middle East & Africa Carotenoids Market Attractiveness Analysis by By Formulation Type, 2016-2032
- Figure 165: Middle East & Africa Carotenoids Market Revenue (US$ Mn) Market Share by Country in 2022
- Figure 166: Middle East & Africa Carotenoids Market Attractiveness Analysis by Country, 2016-2032
- Figure 167: Middle East & Africa Carotenoids Market Revenue (US$ Mn) (2016-2032)
- Figure 168: Middle East & Africa Carotenoids Market Revenue (US$ Mn) Comparison by Country (2016-2032)
- Figure 169: Middle East & Africa Carotenoids Market Revenue (US$ Mn) Comparison by By Type (2016-2032)
- Figure 170: Middle East & Africa Carotenoids Market Revenue (US$ Mn) Comparison by By Application (2016-2032)
- Figure 171: Middle East & Africa Carotenoids Market Revenue (US$ Mn) Comparison by By Method of Production (2016-2032)
- Figure 172: Middle East & Africa Carotenoids Market Revenue (US$ Mn) Comparison by By Formulation Type (2016-2032)
- Figure 173: Middle East & Africa Carotenoids Market Y-o-Y Growth Rate Comparison by Country (2016-2032)
- Figure 174: Middle East & Africa Carotenoids Market Y-o-Y Growth Rate Comparison by By Type (2016-2032)
- Figure 175: Middle East & Africa Carotenoids Market Y-o-Y Growth Rate Comparison by By Application (2016-2032)
- Figure 176: Middle East & Africa Carotenoids Market Y-o-Y Growth Rate Comparison by By Method of Production (2016-2032)
- Figure 177: Middle East & Africa Carotenoids Market Y-o-Y Growth Rate Comparison by By Formulation Type (2016-2032)
- Figure 178: Middle East & Africa Carotenoids Market Share Comparison by Country (2016-2032)
- Figure 179: Middle East & Africa Carotenoids Market Share Comparison by By Type (2016-2032)
- Figure 180: Middle East & Africa Carotenoids Market Share Comparison by By Application (2016-2032)
- Figure 181: Middle East & Africa Carotenoids Market Share Comparison by By Method of Production (2016-2032)
- Figure 182: Middle East & Africa Carotenoids Market Share Comparison by By Formulation Type (2016-2032)
- List of Tables
- Table 1: Global Carotenoids Market Comparison by By Type (2016-2032)
- Table 2: Global Carotenoids Market Comparison by By Application (2016-2032)
- Table 3: Global Carotenoids Market Comparison by By Method of Production (2016-2032)
- Table 4: Global Carotenoids Market Comparison by By Formulation Type (2016-2032)
- Table 5: Global Carotenoids Market Revenue (US$ Mn) Comparison by Region (2016-2032)
- Table 6: Global Carotenoids Market Revenue (US$ Mn) (2016-2032)
- Table 7: Global Carotenoids Market Revenue (US$ Mn) Comparison by Region (2016-2032)
- Table 8: Global Carotenoids Market Revenue (US$ Mn) Comparison by By Type (2016-2032)
- Table 9: Global Carotenoids Market Revenue (US$ Mn) Comparison by By Application (2016-2032)
- Table 10: Global Carotenoids Market Revenue (US$ Mn) Comparison by By Method of Production (2016-2032)
- Table 11: Global Carotenoids Market Revenue (US$ Mn) Comparison by By Formulation Type (2016-2032)
- Table 12: Global Carotenoids Market Y-o-Y Growth Rate Comparison by Region (2016-2032)
- Table 13: Global Carotenoids Market Y-o-Y Growth Rate Comparison by By Type (2016-2032)
- Table 14: Global Carotenoids Market Y-o-Y Growth Rate Comparison by By Application (2016-2032)
- Table 15: Global Carotenoids Market Y-o-Y Growth Rate Comparison by By Method of Production (2016-2032)
- Table 16: Global Carotenoids Market Y-o-Y Growth Rate Comparison by By Formulation Type (2016-2032)
- Table 17: Global Carotenoids Market Share Comparison by Region (2016-2032)
- Table 18: Global Carotenoids Market Share Comparison by By Type (2016-2032)
- Table 19: Global Carotenoids Market Share Comparison by By Application (2016-2032)
- Table 20: Global Carotenoids Market Share Comparison by By Method of Production (2016-2032)
- Table 21: Global Carotenoids Market Share Comparison by By Formulation Type (2016-2032)
- Table 22: North America Carotenoids Market Comparison by By Application (2016-2032)
- Table 23: North America Carotenoids Market Comparison by By Method of Production (2016-2032)
- Table 24: North America Carotenoids Market Comparison by By Formulation Type (2016-2032)
- Table 25: North America Carotenoids Market Revenue (US$ Mn) Comparison by Country (2016-2032)
- Table 26: North America Carotenoids Market Revenue (US$ Mn) (2016-2032)
- Table 27: North America Carotenoids Market Revenue (US$ Mn) Comparison by Country (2016-2032)
- Table 28: North America Carotenoids Market Revenue (US$ Mn) Comparison by By Type (2016-2032)
- Table 29: North America Carotenoids Market Revenue (US$ Mn) Comparison by By Application (2016-2032)
- Table 30: North America Carotenoids Market Revenue (US$ Mn) Comparison by By Method of Production (2016-2032)
- Table 31: North America Carotenoids Market Revenue (US$ Mn) Comparison by By Formulation Type (2016-2032)
- Table 32: North America Carotenoids Market Y-o-Y Growth Rate Comparison by Country (2016-2032)
- Table 33: North America Carotenoids Market Y-o-Y Growth Rate Comparison by By Type (2016-2032)
- Table 34: North America Carotenoids Market Y-o-Y Growth Rate Comparison by By Application (2016-2032)
- Table 35: North America Carotenoids Market Y-o-Y Growth Rate Comparison by By Method of Production (2016-2032)
- Table 36: North America Carotenoids Market Y-o-Y Growth Rate Comparison by By Formulation Type (2016-2032)
- Table 37: North America Carotenoids Market Share Comparison by Country (2016-2032)
- Table 38: North America Carotenoids Market Share Comparison by By Type (2016-2032)
- Table 39: North America Carotenoids Market Share Comparison by By Application (2016-2032)
- Table 40: North America Carotenoids Market Share Comparison by By Method of Production (2016-2032)
- Table 41: North America Carotenoids Market Share Comparison by By Formulation Type (2016-2032)
- Table 42: Western Europe Carotenoids Market Comparison by By Type (2016-2032)
- Table 43: Western Europe Carotenoids Market Comparison by By Application (2016-2032)
- Table 44: Western Europe Carotenoids Market Comparison by By Method of Production (2016-2032)
- Table 45: Western Europe Carotenoids Market Comparison by By Formulation Type (2016-2032)
- Table 46: Western Europe Carotenoids Market Revenue (US$ Mn) Comparison by Country (2016-2032)
- Table 47: Western Europe Carotenoids Market Revenue (US$ Mn) (2016-2032)
- Table 48: Western Europe Carotenoids Market Revenue (US$ Mn) Comparison by Country (2016-2032)
- Table 49: Western Europe Carotenoids Market Revenue (US$ Mn) Comparison by By Type (2016-2032)
- Table 50: Western Europe Carotenoids Market Revenue (US$ Mn) Comparison by By Application (2016-2032)
- Table 51: Western Europe Carotenoids Market Revenue (US$ Mn) Comparison by By Method of Production (2016-2032)
- Table 52: Western Europe Carotenoids Market Revenue (US$ Mn) Comparison by By Formulation Type (2016-2032)
- Table 53: Western Europe Carotenoids Market Y-o-Y Growth Rate Comparison by Country (2016-2032)
- Table 54: Western Europe Carotenoids Market Y-o-Y Growth Rate Comparison by By Type (2016-2032)
- Table 55: Western Europe Carotenoids Market Y-o-Y Growth Rate Comparison by By Application (2016-2032)
- Table 56: Western Europe Carotenoids Market Y-o-Y Growth Rate Comparison by By Method of Production (2016-2032)
- Table 57: Western Europe Carotenoids Market Y-o-Y Growth Rate Comparison by By Formulation Type (2016-2032)
- Table 58: Western Europe Carotenoids Market Share Comparison by Country (2016-2032)
- Table 59: Western Europe Carotenoids Market Share Comparison by By Type (2016-2032)
- Table 60: Western Europe Carotenoids Market Share Comparison by By Application (2016-2032)
- Table 61: Western Europe Carotenoids Market Share Comparison by By Method of Production (2016-2032)
- Table 62: Western Europe Carotenoids Market Share Comparison by By Formulation Type (2016-2032)
- Table 63: Eastern Europe Carotenoids Market Comparison by By Type (2016-2032)
- Table 64: Eastern Europe Carotenoids Market Comparison by By Application (2016-2032)
- Table 65: Eastern Europe Carotenoids Market Comparison by By Method of Production (2016-2032)
- Table 66: Eastern Europe Carotenoids Market Comparison by By Formulation Type (2016-2032)
- Table 67: Eastern Europe Carotenoids Market Revenue (US$ Mn) Comparison by Country (2016-2032)
- Table 68: Eastern Europe Carotenoids Market Revenue (US$ Mn) (2016-2032)
- Table 69: Eastern Europe Carotenoids Market Revenue (US$ Mn) Comparison by Country (2016-2032)
- Table 70: Eastern Europe Carotenoids Market Revenue (US$ Mn) Comparison by By Type (2016-2032)
- Table 71: Eastern Europe Carotenoids Market Revenue (US$ Mn) Comparison by By Application (2016-2032)
- Table 72: Eastern Europe Carotenoids Market Revenue (US$ Mn) Comparison by By Method of Production (2016-2032)
- Table 73: Eastern Europe Carotenoids Market Revenue (US$ Mn) Comparison by By Formulation Type (2016-2032)
- Table 74: Eastern Europe Carotenoids Market Y-o-Y Growth Rate Comparison by Country (2016-2032)
- Table 75: Eastern Europe Carotenoids Market Y-o-Y Growth Rate Comparison by By Type (2016-2032)
- Table 76: Eastern Europe Carotenoids Market Y-o-Y Growth Rate Comparison by By Application (2016-2032)
- Table 77: Eastern Europe Carotenoids Market Y-o-Y Growth Rate Comparison by By Method of Production (2016-2032)
- Table 78: Eastern Europe Carotenoids Market Y-o-Y Growth Rate Comparison by By Formulation Type (2016-2032)
- Table 79: Eastern Europe Carotenoids Market Share Comparison by Country (2016-2032)
- Table 80: Eastern Europe Carotenoids Market Share Comparison by By Type (2016-2032)
- Table 81: Eastern Europe Carotenoids Market Share Comparison by By Application (2016-2032)
- Table 82: Eastern Europe Carotenoids Market Share Comparison by By Method of Production (2016-2032)
- Table 83: Eastern Europe Carotenoids Market Share Comparison by By Formulation Type (2016-2032)
- Table 84: APAC Carotenoids Market Comparison by By Type (2016-2032)
- Table 85: APAC Carotenoids Market Comparison by By Application (2016-2032)
- Table 86: APAC Carotenoids Market Comparison by By Method of Production (2016-2032)
- Table 87: APAC Carotenoids Market Comparison by By Formulation Type (2016-2032)
- Table 88: APAC Carotenoids Market Revenue (US$ Mn) Comparison by Country (2016-2032)
- Table 89: APAC Carotenoids Market Revenue (US$ Mn) (2016-2032)
- Table 90: APAC Carotenoids Market Revenue (US$ Mn) Comparison by Country (2016-2032)
- Table 91: APAC Carotenoids Market Revenue (US$ Mn) Comparison by By Type (2016-2032)
- Table 92: APAC Carotenoids Market Revenue (US$ Mn) Comparison by By Application (2016-2032)
- Table 93: APAC Carotenoids Market Revenue (US$ Mn) Comparison by By Method of Production (2016-2032)
- Table 94: APAC Carotenoids Market Revenue (US$ Mn) Comparison by By Formulation Type (2016-2032)
- Table 95: APAC Carotenoids Market Y-o-Y Growth Rate Comparison by Country (2016-2032)
- Table 96: APAC Carotenoids Market Y-o-Y Growth Rate Comparison by By Type (2016-2032)
- Table 97: APAC Carotenoids Market Y-o-Y Growth Rate Comparison by By Application (2016-2032)
- Table 98: APAC Carotenoids Market Y-o-Y Growth Rate Comparison by By Method of Production (2016-2032)
- Table 99: APAC Carotenoids Market Y-o-Y Growth Rate Comparison by By Formulation Type (2016-2032)
- Table 100: APAC Carotenoids Market Share Comparison by Country (2016-2032)
- Table 101: APAC Carotenoids Market Share Comparison by By Type (2016-2032)
- Table 102: APAC Carotenoids Market Share Comparison by By Application (2016-2032)
- Table 103: APAC Carotenoids Market Share Comparison by By Method of Production (2016-2032)
- Table 104: APAC Carotenoids Market Share Comparison by By Formulation Type (2016-2032)
- Table 105: Latin America Carotenoids Market Comparison by By Type (2016-2032)
- Table 106: Latin America Carotenoids Market Comparison by By Application (2016-2032)
- Table 107: Latin America Carotenoids Market Comparison by By Method of Production (2016-2032)
- Table 108: Latin America Carotenoids Market Comparison by By Formulation Type (2016-2032)
- Table 109: Latin America Carotenoids Market Revenue (US$ Mn) Comparison by Country (2016-2032)
- Table 110: Latin America Carotenoids Market Revenue (US$ Mn) (2016-2032)
- Table 111: Latin America Carotenoids Market Revenue (US$ Mn) Comparison by Country (2016-2032)
- Table 112: Latin America Carotenoids Market Revenue (US$ Mn) Comparison by By Type (2016-2032)
- Table 113: Latin America Carotenoids Market Revenue (US$ Mn) Comparison by By Application (2016-2032)
- Table 114: Latin America Carotenoids Market Revenue (US$ Mn) Comparison by By Method of Production (2016-2032)
- Table 115: Latin America Carotenoids Market Revenue (US$ Mn) Comparison by By Formulation Type (2016-2032)
- Table 116: Latin America Carotenoids Market Y-o-Y Growth Rate Comparison by Country (2016-2032)
- Table 117: Latin America Carotenoids Market Y-o-Y Growth Rate Comparison by By Type (2016-2032)
- Table 118: Latin America Carotenoids Market Y-o-Y Growth Rate Comparison by By Application (2016-2032)
- Table 119: Latin America Carotenoids Market Y-o-Y Growth Rate Comparison by By Method of Production (2016-2032)
- Table 120: Latin America Carotenoids Market Y-o-Y Growth Rate Comparison by By Formulation Type (2016-2032)
- Table 121: Latin America Carotenoids Market Share Comparison by Country (2016-2032)
- Table 122: Latin America Carotenoids Market Share Comparison by By Type (2016-2032)
- Table 123: Latin America Carotenoids Market Share Comparison by By Application (2016-2032)
- Table 124: Latin America Carotenoids Market Share Comparison by By Method of Production (2016-2032)
- Table 125: Latin America Carotenoids Market Share Comparison by By Formulation Type (2016-2032)
- Table 126: Middle East & Africa Carotenoids Market Comparison by By Type (2016-2032)
- Table 127: Middle East & Africa Carotenoids Market Comparison by By Application (2016-2032)
- Table 128: Middle East & Africa Carotenoids Market Comparison by By Method of Production (2016-2032)
- Table 129: Middle East & Africa Carotenoids Market Comparison by By Formulation Type (2016-2032)
- Table 130: Middle East & Africa Carotenoids Market Revenue (US$ Mn) Comparison by Country (2016-2032)
- Table 131: Middle East & Africa Carotenoids Market Revenue (US$ Mn) (2016-2032)
- Table 132: Middle East & Africa Carotenoids Market Revenue (US$ Mn) Comparison by Country (2016-2032)
- Table 133: Middle East & Africa Carotenoids Market Revenue (US$ Mn) Comparison by By Type (2016-2032)
- Table 134: Middle East & Africa Carotenoids Market Revenue (US$ Mn) Comparison by By Application (2016-2032)
- Table 135: Middle East & Africa Carotenoids Market Revenue (US$ Mn) Comparison by By Method of Production (2016-2032)
- Table 136: Middle East & Africa Carotenoids Market Revenue (US$ Mn) Comparison by By Formulation Type (2016-2032)
- Table 137: Middle East & Africa Carotenoids Market Y-o-Y Growth Rate Comparison by Country (2016-2032)
- Table 138: Middle East & Africa Carotenoids Market Y-o-Y Growth Rate Comparison by By Type (2016-2032)
- Table 139: Middle East & Africa Carotenoids Market Y-o-Y Growth Rate Comparison by By Application (2016-2032)
- Table 140: Middle East & Africa Carotenoids Market Y-o-Y Growth Rate Comparison by By Method of Production (2016-2032)
- Table 141: Middle East & Africa Carotenoids Market Y-o-Y Growth Rate Comparison by By Formulation Type (2016-2032)
- Table 142: Middle East & Africa Carotenoids Market Share Comparison by Country (2016-2032)
- Table 143: Middle East & Africa Carotenoids Market Share Comparison by By Type (2016-2032)
- Table 144: Middle East & Africa Carotenoids Market Share Comparison by By Application (2016-2032)
- Table 145: Middle East & Africa Carotenoids Market Share Comparison by By Method of Production (2016-2032)
- Table 146: Middle East & Africa Carotenoids Market Share Comparison by By Formulation Type (2016-2032)
- 1. Executive Summary
-
- BASF SE
- Royal DSM N.V.
- Hansen A/S
- FMC Corporation
- Cyanotech Corporation
- Kemin Industries Inc.
- D. Williamson & Co., Inc.
- Döhler Group
- Allied Biotech Corporation
Our Clients


View Our Licence Options
