
Carborundum Market Report By Type (Green Silicon Carbide, Black Silicon Carbide, Others), By Application (Abrasive Cutting & Grinding, Refractory Material Production, Ceramics Manufacturing, Metallurgy), By End-Use Industries, By Region and Companies - Industry Segment Outlook, Market Assessment, Competition Scenario, Trends and Forecast 2024-2033
-
6286
-
Feb 2024
-
164
-


-
This report was compiled by Shreyas Rokade Shreyas Rokade is a seasoned Research Analyst with CMFE, bringing extensive expertise in market research and consulting, with a strong background in Chemical Engineering. Correspondence Team Lead-CMFE Linkedin | Detailed Market research Methodology Our methodology involves a mix of primary research, including interviews with leading mental health experts, and secondary research from reputable medical journals and databases. View Detailed Methodology Page
-
Quick Navigation
Report Overview
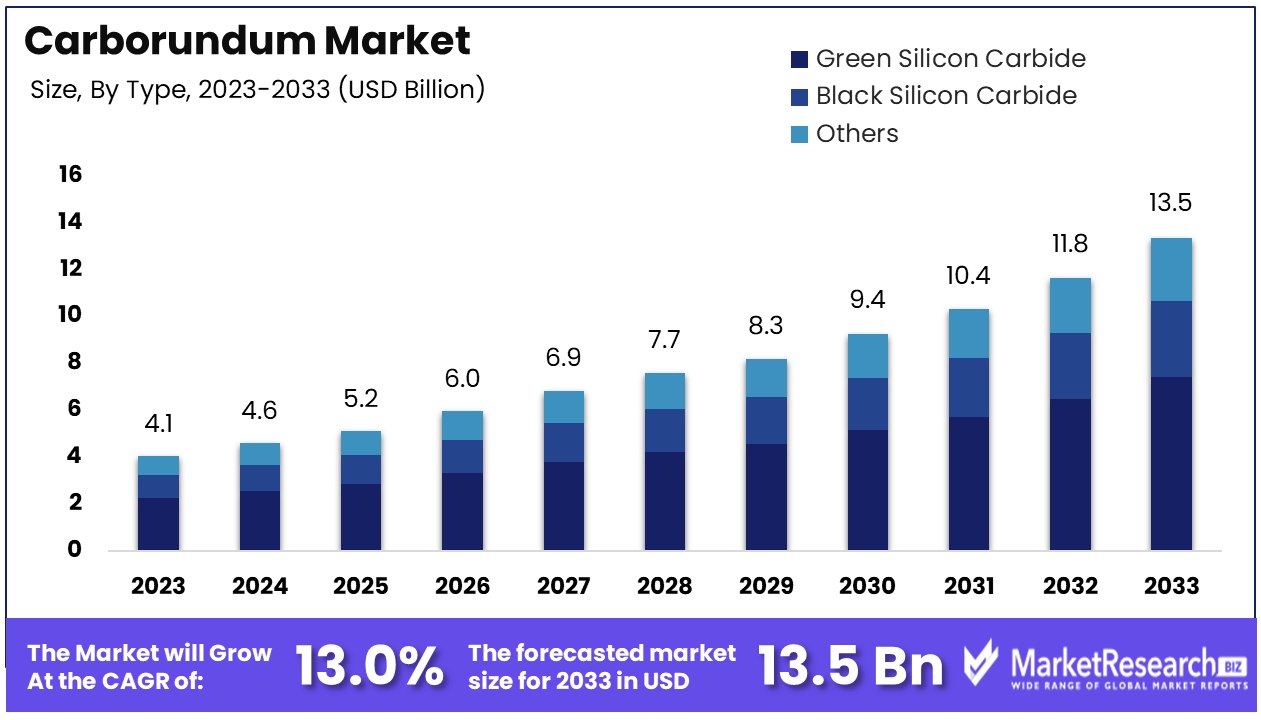
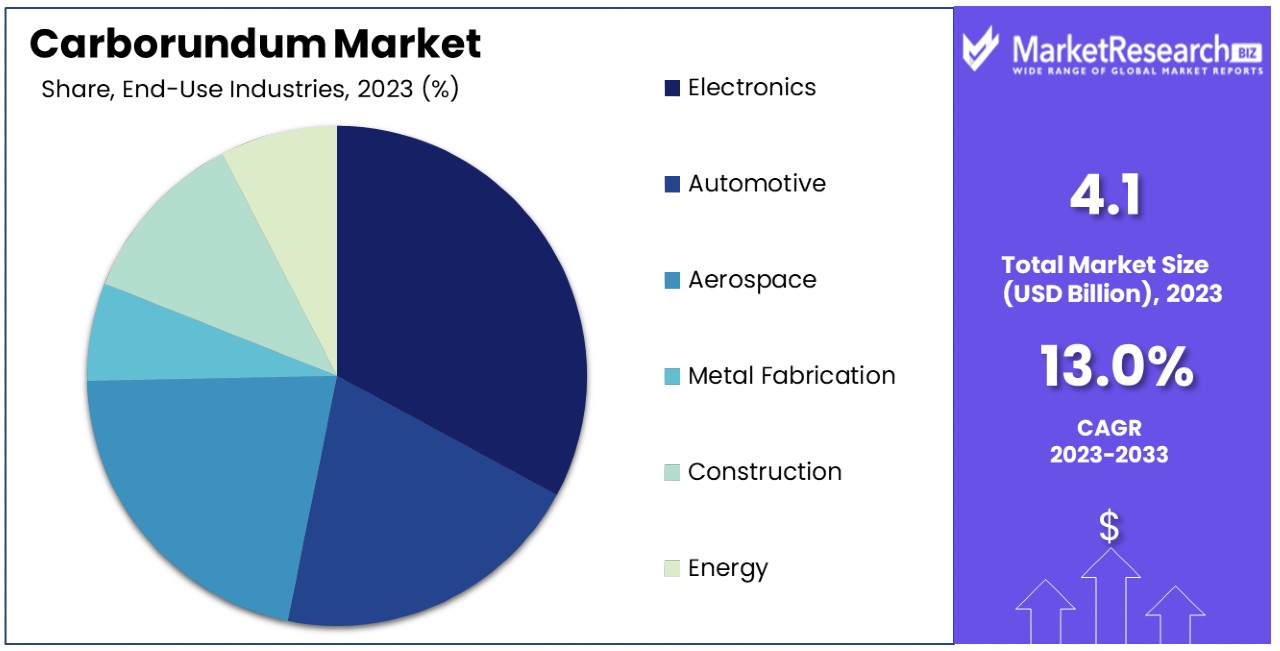
The Global Carborundum Market size is expected to be worth around USD 13.5 Billion by 2033, from USD 4.1 Billion in 2023, growing at a CAGR of 13.00% during the forecast period from 2024 to 2033.
The Carborundum Market refers to the global industry focused on the production, distribution, and application of silicon carbide (SiC), also known as Carborundum. Silicon carbide is recognized for its exceptional hardness, thermal conductivity, and resistance to chemical reactions, making it ideal for various industrial applications.
These include abrasive materials, cutting tools, electronic devices, and high-temperature semiconductors. The market's growth is driven by increasing demand in the automotive, electronics, and aerospace industries, where efficiency and durability are paramount.
In the rapidly evolving Carborundum Market, silicon carbide stands out for its critical role in manufacturing and technology sectors. Known for its exceptional hardness and thermal properties, carborundum's versatility is underscored by its capacity to produce 500,000 three-inch silicon wafers from just one pound of material. This efficiency is paramount in the semiconductor industry, where the demand for high-quality chips continues to surge.
The market's sustainability aspects are highlighted by the significant portion of demand met through recycled carborundum, accounting for approximately 15% of global consumption. This not only demonstrates the industry's commitment to environmental sustainability but also indicates a robust secondary market, enhancing supply chain resilience.
Furthermore, the steel industry, particularly in China, which accounts for 54% of the world's crude steel production with approximately 1.9 billion metric tons produced in 2022, is a major consumer of carborundum.
Used as an auxiliary material in steel manufacturing, carborundum's demand is intricately linked to the steel industry's dynamics. The material's importance in abrasive and cutting applications further solidifies its place in industrial processes, contributing to the market's growth.
Strategic investments in carborundum production and recycling can leverage global industrial demands, particularly in semiconductor and steel manufacturing, underscoring the material's broad applicability and essential role in modern industry.
Key Takeaways
- Market Growth: The Global Carborundum Market is set to grow significantly, reaching USD 13.5 Billion by 2033, with a strong CAGR of 13.00% from 2024 to 2033.
- By Type: Green Silicon Carbide leads the market due to its purity and superior properties, especially in electronics and ceramics.
- By Application: Carborundum is widely used in Abrasive Cutting & Grinding, Refractory Material Production, Ceramics Manufacturing, and Metallurgy.
- By End-user: Electronics drives demand, but Automotive, Aerospace, Metal Fabrication, Construction, and Energy sectors also heavily rely on carborundum.
- Regional Influence: The Asia Pacific region holds a significant market share due to its industrial base, technology investments, and industrialization.
- Major Players: Saint-Gobain, 3M, and others are key players shaping the market with innovative products and strategies.
Driving Factors
Semiconductor Industry Demand Fuels Growth
Carborundum, a compound of silicon carbide, has significantly impacted the electronics industry due to its high thermal conductivity. Increasing demand from the semiconductor industry significantly propels the Carborundum Market forward. Carborundum's pivotal role in producing semiconductor wafers, crucial for chips and electronics, aligns with the surge in semiconductor sales, which experienced a 12.5% increase in 2023.
This upswing is not just a testament to the semiconductor industry's robust expansion but also underscores carborundum's critical contribution to technological advancements. As electronics and chip manufacturers continue to innovate, the demand for high-quality semiconductor wafers made from carborundum escalates, ensuring a sustained growth trajectory for the market.
Renewable Energy Expansion Spurs Market Growth
Growth of renewable energy serves as a cornerstone for the expansion of the Carborundum Market. Utilized in the production of solar panels, carborundum benefits directly from the global shift towards renewable energy sources.
With a 22% increase in solar power capacity in 2022, the demand for carborundum intensifies, highlighting its essential role in enabling sustainable energy solutions. This trend not only emphasizes the growing importance of renewable energy but also positions carborundum as a key raw material in the green revolution, supporting market growth through environmental sustainability initiatives.
LED Lighting Adoption Brightens Market Prospects
Rising adoption of LED lighting casts a luminous path for the Carborundum Market. As LED lights continue to outshine traditional lighting options, the material's usage in LED manufacturing becomes increasingly significant.
Forecasted to grow at 13.78% per year through 2028, the LED lighting market's expansion directly influences carborundum demand. This growth reflects broader trends in energy efficiency and sustainability, with LED lighting standing at the intersection of environmental benefits and technological progress. Consequently, the rise of LED lighting not only illuminates the path for carborundum's market growth but also aligns with global shifts towards more sustainable living standards.
Metal Fabrication Demand Sharpens Market Edge
Demand from metal fabrication underscores the Carborundum Market's robustness. Essential for grinding and cutting metal, carborundum's significance grows with the industrialization and expansion of metal fabrication, particularly in Asia.
This increasing product demand mirrors the broader industrial growth and infrastructure development, where carborundum's attributes are indispensable. As industries strive for efficiency and precision, the reliance on carborundum for metal processing highlights its integral role in the manufacturing sector. The market for silicon carbide has witnessed exponential growth, particularly in the Asia Pacific region, fueled by its diverse applications.
Restraining Factors
High Energy Consumption Restrains Market Growth
The production of carborundum is markedly energy-intensive, leading to elevated manufacturing costs. For context, the energy requirement for producing crude steel, a key application area for carborundum, stands at 14-15 GJ per tonne. This high energy consumption not only increases the operational expenses for carborundum manufacturers but also impacts the overall cost-effectiveness of carborundum-based products.
As a result, the market's growth is constrained by the financial and energy efficiency challenges posed by its production process. This factor significantly influences the competitive positioning of carborundum in the materials market, potentially limiting its adoption in favor of less energy-demanding alternatives.
Environmental Regulations Limit Market Expansion
Carborundum production is associated with considerable CO2 emissions, placing it under scrutiny amidst global efforts to reduce industrial carbon footprints. The imposition of tighter environmental regulations, particularly concerning carbon emissions, presents a substantial challenge to the Carborundum Market. These regulations can restrict output in certain regions, compelling manufacturers to invest in costly emission reduction technologies or face penalties.
Such environmental constraints not only increase operational costs but also affect the scalability of carborundum production facilities. As industries and governments intensify their focus on environmental sustainability, the Carborundum Market faces potential growth limitations due to its environmental impact.
Type Analysis
In the Carborundum Market, Green Silicon Carbide emerges as the dominant sub-segment, owing to its superior purity and physical properties which make it ideal for high-end applications in electronics and ceramics. Compared to Black Silicon Carbide and other types, Green Silicon Carbide boasts higher hardness, thermal conductivity, and chemical resistance, factors that drive its preference for precision applications.
Black Silicon Carbide, while still significant, is primarily utilized in abrasive and refractory applications due to its lower purity level but excellent thermal conductivity and toughness. The Others product category includes various forms of silicon carbide with specialized applications, contributing to the market's diversity.
The dominance of Green Silicon Carbide is attributed to the growing demand in sectors requiring materials that can withstand extreme conditions, such as semiconductor manufacturing and photovoltaic cell production. However, the overall growth in the Carborundum Market is supported by all types, with each finding its niche in different range of applications, from abrasive materials to refractory linings.
Application Analysis
Among the applications, Abrasive Cutting & Grinding stands out as the primary use-case for carborundum, underlining the material's exceptional hardness and thermal resistance properties. This segment leverages carborundum's durability and efficiency in cutting tools, grinding wheels, and other abrasive products. Meanwhile, Refractory Material Production benefits from carborundum's thermal stability, making it a preferred material for high-temperature furnaces and kilns.
In Ceramics Manufacturing, carborundum is valued for its ability to enhance the toughness and heat resistance of ceramic products. Metallurgy also utilizes carborundum, particularly in processes requiring high-temperature resistance and durability.
The abrasive segment's prominence is linked to the broad spectrum of industries it serves, from electric vehicles manufacturing to construction, underscoring carborundum's versatility and essential role in industrial processes. The adoption of Carborundum in power modules has accelerated advancements in electric vehicle technology. The growth of silicon carbide as a material for refractory applications has revolutionized the manufacturing processes in various industries. The collective contribution of these applications fuels the market's expansion, highlighting the diverse utility of carborundum across multiple domains.
End-Use Industries Analysis
The Electronics industry is the leading end-use sector for the Carborundum Market, driven by the material's critical role in semiconductor devices, LEDs, and other electronic components. This dominance is facilitated by carborundum's excellent electrical conductivity, thermal resistance, and ability to form highly durable semiconductor wafers.
Automotive, Aerospace, Metal Fabrication, Construction, and Energy sectors also significantly contribute to the demand for carborundum, utilizing it in various capacities such as abrasive materials, refractory linings, and components requiring high durability and thermal resistance.
The Automotive industry, for example, uses carborundum in brake systems and engine components, while Aerospace applications include structural materials for spacecraft. Each of these end-use industries depends on carborundum's unique properties to enhance product performance and durability, reinforcing the material's importance across a wide range of industrial applications. The Electronics sector, however, remains the market's powerhouse, with its rapid technological advancements and increasing demand for electronic devices ensuring sustained growth for carborundum.
Key Market Segments
By Type
- Green Silicon Carbide
- Black Silicon Carbide
- Others
By Application
- Abrasive Cutting & Grinding
- Refractory Material Production
- Ceramics Manufacturing
- Metallurgy
By End-Use Industries
- Electronics
- Automotive
- Aerospace
- Metal Fabrication
- Construction
- Energy
Growth Opportunities
Rising Adoption in Auto Industry Offers Growth Opportunity
The increasing use of Carborundum in the automotive industry, particularly for brake pads, clutch facings, and auto gaskets, capitalizes on its superior heat and wear resistance. This trend aligns with the global auto production's upward trajectory in terms of revenue, expected to rise by 7% in 2022.
As automotive manufacturers continually seek materials that enhance vehicle performance and safety, Carborundum's unique properties make it an attractive choice. This adoption not only opens new avenues for growth within the Carborundum Market but also reinforces its significance in developing advanced automotive components.
Demand in Industrial Manufacturing Drives Market Expansion
Carborundum's contribution to industrial manufacturing, by offering high precision and finish for components like seals, pumps, and bearings, signals a significant growth avenue. The manufacturing sector's expansion, especially in Asia and Africa, underscores an increasing reliance on materials that can ensure durability, efficiency, and performance.
This demand is not only a testament to Carborundum's intrinsic qualities but also highlights its adaptability across various manufacturing processes. The material's ability to meet the rigorous requirements of industrial components fosters its adoption, paving the way for further penetration into new markets and applications. Thus, Carborundum's role in industrial manufacturing emerges as a pivotal factor, promising sustained growth and broader market opportunities.
Trending Factors
Innovations in Manufacturing Process Are Trending Factors
Key players in the Carborundum Market are steering towards innovations such as additive manufacturing, which enables the production of more customizable and precise carborundum products. This shift is largely driven by the growing demand for component miniaturization across various industries, including electronics and aerospace.
Additive manufacturing allows for the creation of complex shapes and sizes that traditional methods cannot achieve, offering significant advantages in design flexibility and material efficiency. These advancements not only cater to the specific needs of end-users but also open up new applications for carborundum, enhancing its appeal and utility. As a result, the move towards innovative manufacturing processes is recognized as a trending factor, and is expected to grow rapidly in the forecast period.
Shift to Higher Purity Levels Are Trending Factors
The demand for ultra-pure carborundum, with purity levels exceeding 99%, is gaining momentum, especially in high-tech applications such as electronics and optics. This necessity is pushing industry players to invest in advanced refining capabilities, like plasma treatment, to meet the stringent purity requirements.
High-purity carborundum is crucial for applications where material performance can significantly impact the overall efficiency and reliability of the end product, such as semiconductor devices and laser mirrors. The focus on achieving higher purity levels represents a significant trend within the Carborundum Market, as it reflects the industry's commitment to quality and innovation. This trend not only meets the immediate needs of sophisticated applications but also positions carborundum as a material of choice for future technological advancements, driving its market growth and relevance.
Regional Analysis
Asia Pacific Dominates with 40.5% Market Share
The Asia Pacific (APAC) region commands a significant 40.5% share of the global Carborundum Market, establishing its dominance due to several key factors. The region's extensive industrial base, particularly in electronics, automotive, and manufacturing, drives substantial demand for Carborundum.
Additionally, APAC benefits from robust investments in technology and infrastructure, coupled with a high rate of industrialization in countries like China, Japan, and South Korea. These nations are at the forefront of semiconductor production and renewable energy projects, both of which extensively utilize Carborundum.
Market dynamics in APAC are influenced by its expansive manufacturing capabilities and growing focus on high-tech industries. The region's commitment to advancing its industrial sectors, including the shift towards renewable energy applications and electronics, positions it as a critical market for Carborundum suppliers.
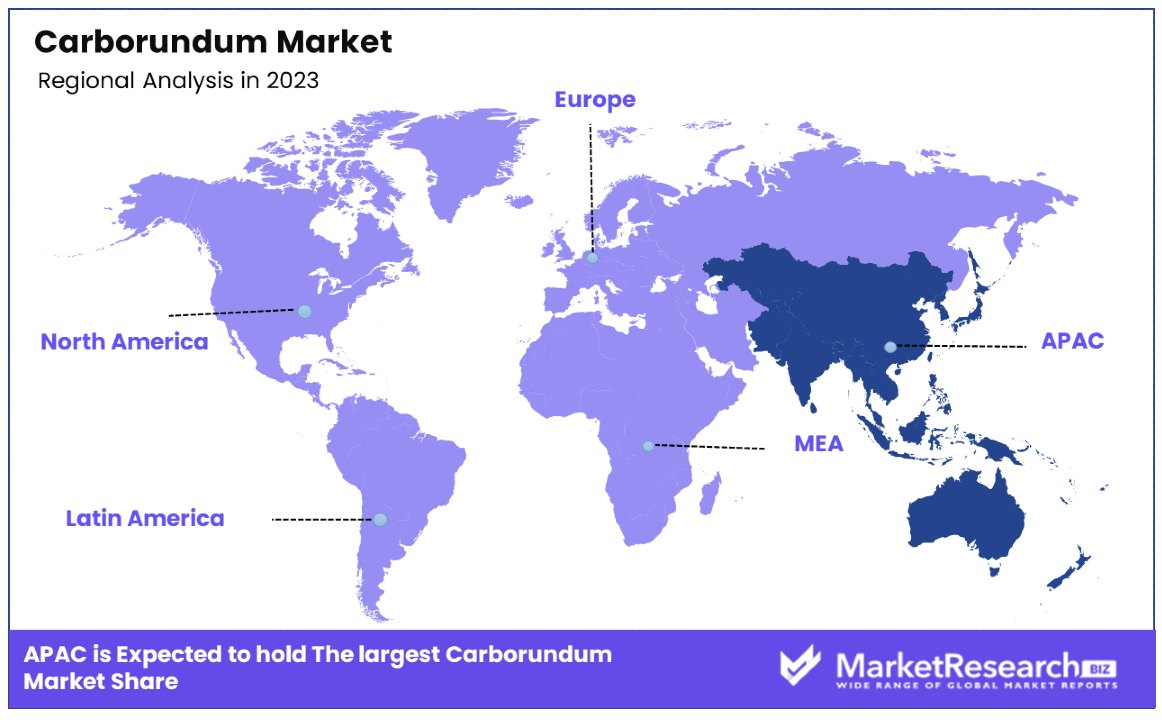
- North America: With a focus on technological innovation and a robust automotive industry, North America holds a significant market share. Advanced manufacturing and research in electronics and renewable energy contribute to its demand for Carborundum.
- Europe: Europe's emphasis on sustainable industrial practices and the growth of its automotive and aerospace sectors support its Carborundum market. The region's stringent environmental regulations also drive the demand for high-quality and eco-friendly materials.
- Middle East & Africa: Although smaller in market share, the increasing industrialization and investment in infrastructure projects across this region present a growing opportunity for Carborundum.
- Latin America: With gradual industrial growth and an expanding focus on manufacturing and energy, Latin America represents an emerging market with potential for increased Carborundum demand.
Key Regions and Countries
- North America
- The US
- Canada
- Mexico
- Western Europe
- Germany
- France
- The UK
- Spain
- Italy
- Portugal
- Ireland
- Austria
- Switzerland
- Benelux
- Nordic
- Rest of Western Europe
- Eastern Europe
- Russia
- Poland
- The Czech Republic
- Greece
- Rest of Eastern Europe
- APAC
- China
- Japan
- South Korea
- India
- Australia & New Zealand
- Indonesia
- Malaysia
- Philippines
- Singapore
- Thailand
- Vietnam
- Rest of APAC
- Latin America
- Brazil
- Colombia
- Chile
- Argentina
- Costa Rica
- Rest of Latin America
- Middle East & Africa
- Algeria
- Egypt
- Israel
- Kuwait
- Nigeria
- Saudi Arabia
- South Africa
- Turkey
- United Arab Emirates
- Rest of MEA
Key Players Analysis
In the Carborundum Market, major players such as Saint-Gobain, 3M, Ningxia Tianjing, and Lanzhou Heqiao play pivotal roles in shaping market dynamics through their strategic positioning and innovative product offerings. These major players, along with others like Tianzhu Yutong and Pacific Rundum, have established a strong presence across various regions, including the US, China, Europe, and South Korea. They are expected to maintain the dominance in the forecast period.
Their impact on the market is significant, with efforts focused on enhancing production capabilities, improving product quality, and expanding their application portfolio. Companies like ESD-SIC and ESK-SIC in Europe, along with Navarro in Spain and Snam Abrasives in India, contribute to the market's diversity with specialized carborundum products tailored to meet the demands of industries ranging from electronics to automotive and aerospace.
The strategic positioning of these companies, emphasizing innovation, sustainability, and global reach, underpins their influence in the Carborundum Market. Furthermore, the participation of firms like Washington Mills, Elsid S.A, Sublime, and Elmet in the US and Poland highlights the global nature of the market and the competitive landscape these key players navigate. Their collective efforts in research and development, along with strategic global partnerships, underscore the market's growth potential and the critical role these companies play in meeting the evolving needs of end-use industries.
Market Key Players
- Saint-Gobain
- 3M
- Carborundum Universal Limited
- Ningxia Tianjing
- Lanzhou Heqiao
- Tianzhu Yutong
- ESD-SIC
- ESK-SIC
- Navarro
- Pacific Rundum
- Washington Mills
- Elsid S.A
- Sublime
- Elmet
- Snam Abrasives
- Gaddis Engineered Materials
- Cree Inc.
- AGSCO Corporation
- Norstel AB
- Vitesco Technologies
Recent Developments
- On February 2024, the U.S. Department of Energy announced a conditional $544 million loan to SK Siltron CSS LLC, a Michigan semiconductor manufacturing plant, to expand its production capabilities.
- On February 2024, Denso and Mitsubishi Electric announced a significant investment of $1 billion in Coherent's silicon carbide division. Each company will contribute $500 million in exchange for a 12.5% non-controlling stake in Coherent's subsidiary.
- On July 2023, Renesas Electronics Corporation and Wolfspeed, Inc. signed a 10-year silicon carbide wafer supply agreement. Renesas made a $2 billion deposit to secure a 10-year supply commitment of silicon carbide bare and epitaxial wafers from Wolfspeed.
Report Scope
Report Features Description Market Value (2023) USD 4.1 Billion Forecast Revenue (2033) USD 13.5 Billion CAGR (2024-2033) 13.00% Base Year for Estimation 2023 Historic Period 2018-2023 Forecast Period 2024-2033 Report Coverage Revenue Forecast, Market Dynamics, Competitive Landscape, Recent Developments Segments Covered By Type (Green Silicon Carbide, Black Silicon Carbide, Others), By Application (Abrasive Cutting & Grinding, Refractory Material Production, Ceramics Manufacturing, Metallurgy), By End-Use Industries (Electronics, Automotive, Aerospace, Metal Fabrication, Construction, Energy) Regional Analysis North America - The US, Canada, & Mexico; Western Europe - Germany, France, The UK, Spain, Italy, Portugal, Ireland, Austria, Switzerland, Benelux, Nordic, & Rest of Western Europe; Eastern Europe - Russia, Poland, The Czech Republic, Greece, & Rest of Eastern Europe; APAC - China, Japan, South Korea, India, Australia & New Zealand, Indonesia, Malaysia, Philippines, Singapore, Thailand, Vietnam, & Rest of APAC; Latin America - Brazil, Colombia, Chile, Argentina, Costa Rica, & Rest of Latin America; Middle East & Africa - Algeria, Egypt, Israel, Kuwait, Nigeria, Saudi Arabia, South Africa, Turkey, United Arab Emirates, & Rest of MEA Competitive Landscape Saint-Gobain, 3M, Ningxia Tianjing, Lanzhou Heqiao, Tianzhu Yutong, ESD-SIC, ESK-SIC, Navarro, Pacific Rundum, Washington Mills, Elsid S.A, Sublime, Elmet, Snam Abrasives, Saint-Gobain Ceramic Materials Customization Scope Customization for segments, region/country-level will be provided. Moreover, additional customization can be done based on the requirements. Purchase Options We have three licenses to opt for: Single User License, Multi-User License (Up to 5 Users), Corporate Use License (Unlimited User and Printable PDF) -
- 1. Executive Summary
- 1.1. Definition
- 1.2. Taxonomy
- 1.3. Research Scope
- 1.4. Key Analysis
- 1.5. Key Findings by Major Segments
- 1.6. Top strategies by Major Players
- 2. Global Carborundum Market Overview
- 2.1. Carborundum Market Dynamics
- 2.1.1. Drivers
- 2.1.2. Opportunities
- 2.1.3. Restraints
- 2.1.4. Challenges
- 2.2. Macro-economic Factors
- 2.3. Regulatory Framework
- 2.4. Market Investment Feasibility Index
- 2.5. PEST Analysis
- 2.6. PORTER’S Five Force Analysis
- 2.7. Drivers & Restraints Impact Analysis
- 2.8. Industry Chain Analysis
- 2.9. Cost Structure Analysis
- 2.10. Marketing Strategy
- 2.11. Russia-Ukraine War Impact Analysis
- 2.12. Opportunity Map Analysis
- 2.13. Market Competition Scenario Analysis
- 2.14. Product Life Cycle Analysis
- 2.15. Opportunity Orbits
- 2.16. Manufacturer Intensity Map
- 2.17. Major Companies sales by Value & Volume
- 2.1. Carborundum Market Dynamics
- 3. Global Carborundum Market Analysis, Opportunity and Forecast, 2016-2032
- 3.1. Global Carborundum Market Analysis, 2016-2021
- 3.2. Global Carborundum Market Opportunity and Forecast, 2023-2032
- 3.3. Global Carborundum Market Analysis, Opportunity and Forecast, By Type, 2016-2032
- 3.3.1. Global Carborundum Market Analysis by Type: Introduction
- 3.3.2. Market Size Absolute $ Opportunity Analysis and Forecast, By Type, 2016-2032
- 3.3.3. Green Silicon Carbide
- 3.3.4. Black Silicon Carbide
- 3.3.5. Others
- 3.4. Global Carborundum Market Analysis, Opportunity and Forecast, By Application, 2016-2032
- 3.4.1. Global Carborundum Market Analysis by Application: Introduction
- 3.4.2. Market Size Absolute $ Opportunity Analysis and Forecast, By Application, 2016-2032
- 3.4.3. Abrasive Cutting & Grinding
- 3.4.4. Refractory Material Production
- 3.4.5. Ceramics Manufacturing
- 3.4.6. Metallurgy
- 3.5. Global Carborundum Market Analysis, Opportunity and Forecast, By End-Use Industries, 2016-2032
- 3.5.1. Global Carborundum Market Analysis by End-Use Industries: Introduction
- 3.5.2. Market Size Absolute $ Opportunity Analysis and Forecast, By End-Use Industries, 2016-2032
- 3.5.3. Electronics
- 3.5.4. Automotive
- 3.5.5. Aerospace
- 3.5.6. Metal Fabrication
- 3.5.7. Construction
- 3.5.8. Energy
- 4. North America Carborundum Market Analysis, Opportunity and Forecast, 2016-2032
- 4.1. North America Carborundum Market Analysis, 2016-2021
- 4.2. North America Carborundum Market Opportunity and Forecast, 2023-2032
- 4.3. North America Carborundum Market Analysis, Opportunity and Forecast, By Type, 2016-2032
- 4.3.1. North America Carborundum Market Analysis by Type: Introduction
- 4.3.2. Market Size Absolute $ Opportunity Analysis and Forecast, By Type, 2016-2032
- 4.3.3. Green Silicon Carbide
- 4.3.4. Black Silicon Carbide
- 4.3.5. Others
- 4.4. North America Carborundum Market Analysis, Opportunity and Forecast, By Application, 2016-2032
- 4.4.1. North America Carborundum Market Analysis by Application: Introduction
- 4.4.2. Market Size Absolute $ Opportunity Analysis and Forecast, By Application, 2016-2032
- 4.4.3. Abrasive Cutting & Grinding
- 4.4.4. Refractory Material Production
- 4.4.5. Ceramics Manufacturing
- 4.4.6. Metallurgy
- 4.5. North America Carborundum Market Analysis, Opportunity and Forecast, By End-Use Industries, 2016-2032
- 4.5.1. North America Carborundum Market Analysis by End-Use Industries: Introduction
- 4.5.2. Market Size Absolute $ Opportunity Analysis and Forecast, By End-Use Industries, 2016-2032
- 4.5.3. Electronics
- 4.5.4. Automotive
- 4.5.5. Aerospace
- 4.5.6. Metal Fabrication
- 4.5.7. Construction
- 4.5.8. Energy
- 4.6. North America Carborundum Market Analysis, Opportunity and Forecast, By Country , 2016-2032
- 4.6.1. North America Carborundum Market Analysis by Country : Introduction
- 4.6.2. Market Size Absolute $ Opportunity Analysis and Forecast, Country , 2016-2032
- 4.6.2.1. The US
- 4.6.2.2. Canada
- 4.6.2.3. Mexico
- 5. Western Europe Carborundum Market Analysis, Opportunity and Forecast, 2016-2032
- 5.1. Western Europe Carborundum Market Analysis, 2016-2021
- 5.2. Western Europe Carborundum Market Opportunity and Forecast, 2023-2032
- 5.3. Western Europe Carborundum Market Analysis, Opportunity and Forecast, By Type, 2016-2032
- 5.3.1. Western Europe Carborundum Market Analysis by Type: Introduction
- 5.3.2. Market Size Absolute $ Opportunity Analysis and Forecast, By Type, 2016-2032
- 5.3.3. Green Silicon Carbide
- 5.3.4. Black Silicon Carbide
- 5.3.5. Others
- 5.4. Western Europe Carborundum Market Analysis, Opportunity and Forecast, By Application, 2016-2032
- 5.4.1. Western Europe Carborundum Market Analysis by Application: Introduction
- 5.4.2. Market Size Absolute $ Opportunity Analysis and Forecast, By Application, 2016-2032
- 5.4.3. Abrasive Cutting & Grinding
- 5.4.4. Refractory Material Production
- 5.4.5. Ceramics Manufacturing
- 5.4.6. Metallurgy
- 5.5. Western Europe Carborundum Market Analysis, Opportunity and Forecast, By End-Use Industries, 2016-2032
- 5.5.1. Western Europe Carborundum Market Analysis by End-Use Industries: Introduction
- 5.5.2. Market Size Absolute $ Opportunity Analysis and Forecast, By End-Use Industries, 2016-2032
- 5.5.3. Electronics
- 5.5.4. Automotive
- 5.5.5. Aerospace
- 5.5.6. Metal Fabrication
- 5.5.7. Construction
- 5.5.8. Energy
- 5.6. Western Europe Carborundum Market Analysis, Opportunity and Forecast, By Country , 2016-2032
- 5.6.1. Western Europe Carborundum Market Analysis by Country : Introduction
- 5.6.2. Market Size Absolute $ Opportunity Analysis and Forecast, Country , 2016-2032
- 5.6.2.1. Germany
- 5.6.2.2. France
- 5.6.2.3. The UK
- 5.6.2.4. Spain
- 5.6.2.5. Italy
- 5.6.2.6. Portugal
- 5.6.2.7. Ireland
- 5.6.2.8. Austria
- 5.6.2.9. Switzerland
- 5.6.2.10. Benelux
- 5.6.2.11. Nordic
- 5.6.2.12. Rest of Western Europe
- 6. Eastern Europe Carborundum Market Analysis, Opportunity and Forecast, 2016-2032
- 6.1. Eastern Europe Carborundum Market Analysis, 2016-2021
- 6.2. Eastern Europe Carborundum Market Opportunity and Forecast, 2023-2032
- 6.3. Eastern Europe Carborundum Market Analysis, Opportunity and Forecast, By Type, 2016-2032
- 6.3.1. Eastern Europe Carborundum Market Analysis by Type: Introduction
- 6.3.2. Market Size Absolute $ Opportunity Analysis and Forecast, By Type, 2016-2032
- 6.3.3. Green Silicon Carbide
- 6.3.4. Black Silicon Carbide
- 6.3.5. Others
- 6.4. Eastern Europe Carborundum Market Analysis, Opportunity and Forecast, By Application, 2016-2032
- 6.4.1. Eastern Europe Carborundum Market Analysis by Application: Introduction
- 6.4.2. Market Size Absolute $ Opportunity Analysis and Forecast, By Application, 2016-2032
- 6.4.3. Abrasive Cutting & Grinding
- 6.4.4. Refractory Material Production
- 6.4.5. Ceramics Manufacturing
- 6.4.6. Metallurgy
- 6.5. Eastern Europe Carborundum Market Analysis, Opportunity and Forecast, By End-Use Industries, 2016-2032
- 6.5.1. Eastern Europe Carborundum Market Analysis by End-Use Industries: Introduction
- 6.5.2. Market Size Absolute $ Opportunity Analysis and Forecast, By End-Use Industries, 2016-2032
- 6.5.3. Electronics
- 6.5.4. Automotive
- 6.5.5. Aerospace
- 6.5.6. Metal Fabrication
- 6.5.7. Construction
- 6.5.8. Energy
- 6.6. Eastern Europe Carborundum Market Analysis, Opportunity and Forecast, By Country , 2016-2032
- 6.6.1. Eastern Europe Carborundum Market Analysis by Country : Introduction
- 6.6.2. Market Size Absolute $ Opportunity Analysis and Forecast, Country , 2016-2032
- 6.6.2.1. Russia
- 6.6.2.2. Poland
- 6.6.2.3. The Czech Republic
- 6.6.2.4. Greece
- 6.6.2.5. Rest of Eastern Europe
- 7. APAC Carborundum Market Analysis, Opportunity and Forecast, 2016-2032
- 7.1. APAC Carborundum Market Analysis, 2016-2021
- 7.2. APAC Carborundum Market Opportunity and Forecast, 2023-2032
- 7.3. APAC Carborundum Market Analysis, Opportunity and Forecast, By Type, 2016-2032
- 7.3.1. APAC Carborundum Market Analysis by Type: Introduction
- 7.3.2. Market Size Absolute $ Opportunity Analysis and Forecast, By Type, 2016-2032
- 7.3.3. Green Silicon Carbide
- 7.3.4. Black Silicon Carbide
- 7.3.5. Others
- 7.4. APAC Carborundum Market Analysis, Opportunity and Forecast, By Application, 2016-2032
- 7.4.1. APAC Carborundum Market Analysis by Application: Introduction
- 7.4.2. Market Size Absolute $ Opportunity Analysis and Forecast, By Application, 2016-2032
- 7.4.3. Abrasive Cutting & Grinding
- 7.4.4. Refractory Material Production
- 7.4.5. Ceramics Manufacturing
- 7.4.6. Metallurgy
- 7.5. APAC Carborundum Market Analysis, Opportunity and Forecast, By End-Use Industries, 2016-2032
- 7.5.1. APAC Carborundum Market Analysis by End-Use Industries: Introduction
- 7.5.2. Market Size Absolute $ Opportunity Analysis and Forecast, By End-Use Industries, 2016-2032
- 7.5.3. Electronics
- 7.5.4. Automotive
- 7.5.5. Aerospace
- 7.5.6. Metal Fabrication
- 7.5.7. Construction
- 7.5.8. Energy
- 7.6. APAC Carborundum Market Analysis, Opportunity and Forecast, By Country , 2016-2032
- 7.6.1. APAC Carborundum Market Analysis by Country : Introduction
- 7.6.2. Market Size Absolute $ Opportunity Analysis and Forecast, Country , 2016-2032
- 7.6.2.1. China
- 7.6.2.2. Japan
- 7.6.2.3. South Korea
- 7.6.2.4. India
- 7.6.2.5. Australia & New Zeland
- 7.6.2.6. Indonesia
- 7.6.2.7. Malaysia
- 7.6.2.8. Philippines
- 7.6.2.9. Singapore
- 7.6.2.10. Thailand
- 7.6.2.11. Vietnam
- 7.6.2.12. Rest of APAC
- 8. Latin America Carborundum Market Analysis, Opportunity and Forecast, 2016-2032
- 8.1. Latin America Carborundum Market Analysis, 2016-2021
- 8.2. Latin America Carborundum Market Opportunity and Forecast, 2023-2032
- 8.3. Latin America Carborundum Market Analysis, Opportunity and Forecast, By Type, 2016-2032
- 8.3.1. Latin America Carborundum Market Analysis by Type: Introduction
- 8.3.2. Market Size Absolute $ Opportunity Analysis and Forecast, By Type, 2016-2032
- 8.3.3. Green Silicon Carbide
- 8.3.4. Black Silicon Carbide
- 8.3.5. Others
- 8.4. Latin America Carborundum Market Analysis, Opportunity and Forecast, By Application, 2016-2032
- 8.4.1. Latin America Carborundum Market Analysis by Application: Introduction
- 8.4.2. Market Size Absolute $ Opportunity Analysis and Forecast, By Application, 2016-2032
- 8.4.3. Abrasive Cutting & Grinding
- 8.4.4. Refractory Material Production
- 8.4.5. Ceramics Manufacturing
- 8.4.6. Metallurgy
- 8.5. Latin America Carborundum Market Analysis, Opportunity and Forecast, By End-Use Industries, 2016-2032
- 8.5.1. Latin America Carborundum Market Analysis by End-Use Industries: Introduction
- 8.5.2. Market Size Absolute $ Opportunity Analysis and Forecast, By End-Use Industries, 2016-2032
- 8.5.3. Electronics
- 8.5.4. Automotive
- 8.5.5. Aerospace
- 8.5.6. Metal Fabrication
- 8.5.7. Construction
- 8.5.8. Energy
- 8.6. Latin America Carborundum Market Analysis, Opportunity and Forecast, By Country , 2016-2032
- 8.6.1. Latin America Carborundum Market Analysis by Country : Introduction
- 8.6.2. Market Size Absolute $ Opportunity Analysis and Forecast, Country , 2016-2032
- 8.6.2.1. Brazil
- 8.6.2.2. Colombia
- 8.6.2.3. Chile
- 8.6.2.4. Argentina
- 8.6.2.5. Costa Rica
- 8.6.2.6. Rest of Latin America
- 9. Middle East & Africa Carborundum Market Analysis, Opportunity and Forecast, 2016-2032
- 9.1. Middle East & Africa Carborundum Market Analysis, 2016-2021
- 9.2. Middle East & Africa Carborundum Market Opportunity and Forecast, 2023-2032
- 9.3. Middle East & Africa Carborundum Market Analysis, Opportunity and Forecast, By Type, 2016-2032
- 9.3.1. Middle East & Africa Carborundum Market Analysis by Type: Introduction
- 9.3.2. Market Size Absolute $ Opportunity Analysis and Forecast, By Type, 2016-2032
- 9.3.3. Green Silicon Carbide
- 9.3.4. Black Silicon Carbide
- 9.3.5. Others
- 9.4. Middle East & Africa Carborundum Market Analysis, Opportunity and Forecast, By Application, 2016-2032
- 9.4.1. Middle East & Africa Carborundum Market Analysis by Application: Introduction
- 9.4.2. Market Size Absolute $ Opportunity Analysis and Forecast, By Application, 2016-2032
- 9.4.3. Abrasive Cutting & Grinding
- 9.4.4. Refractory Material Production
- 9.4.5. Ceramics Manufacturing
- 9.4.6. Metallurgy
- 9.5. Middle East & Africa Carborundum Market Analysis, Opportunity and Forecast, By End-Use Industries, 2016-2032
- 9.5.1. Middle East & Africa Carborundum Market Analysis by End-Use Industries: Introduction
- 9.5.2. Market Size Absolute $ Opportunity Analysis and Forecast, By End-Use Industries, 2016-2032
- 9.5.3. Electronics
- 9.5.4. Automotive
- 9.5.5. Aerospace
- 9.5.6. Metal Fabrication
- 9.5.7. Construction
- 9.5.8. Energy
- 9.6. Middle East & Africa Carborundum Market Analysis, Opportunity and Forecast, By Country , 2016-2032
- 9.6.1. Middle East & Africa Carborundum Market Analysis by Country : Introduction
- 9.6.2. Market Size Absolute $ Opportunity Analysis and Forecast, Country , 2016-2032
- 9.6.2.1. Algeria
- 9.6.2.2. Egypt
- 9.6.2.3. Israel
- 9.6.2.4. Kuwait
- 9.6.2.5. Nigeria
- 9.6.2.6. Saudi Arabia
- 9.6.2.7. South Africa
- 9.6.2.8. Turkey
- 9.6.2.9. The UAE
- 9.6.2.10. Rest of MEA
- 10. Global Carborundum Market Analysis, Opportunity and Forecast, By Region , 2016-2032
- 10.1. Global Carborundum Market Analysis by Region : Introduction
- 10.2. Market Size Absolute $ Opportunity Analysis and Forecast, By Region , 2016-2032
- 10.2.1. North America
- 10.2.2. Western Europe
- 10.2.3. Eastern Europe
- 10.2.4. APAC
- 10.2.5. Latin America
- 10.2.6. Middle East & Africa
- 11. Global Carborundum Market Competitive Landscape, Market Share Analysis, and Company Profiles
- 11.1. Market Share Analysis
- 11.2. Company Profiles
- 11.3. Saint-Gobain
- 11.3.1. Company Overview
- 11.3.2. Financial Highlights
- 11.3.3. Product Portfolio
- 11.3.4. SWOT Analysis
- 11.3.5. Key Strategies and Developments
- 11.4. 3M
- 11.4.1. Company Overview
- 11.4.2. Financial Highlights
- 11.4.3. Product Portfolio
- 11.4.4. SWOT Analysis
- 11.4.5. Key Strategies and Developments
- 11.5. Ningxia Tianjing
- 11.5.1. Company Overview
- 11.5.2. Financial Highlights
- 11.5.3. Product Portfolio
- 11.5.4. SWOT Analysis
- 11.5.5. Key Strategies and Developments
- 11.6. Lanzhou Heqiao
- 11.6.1. Company Overview
- 11.6.2. Financial Highlights
- 11.6.3. Product Portfolio
- 11.6.4. SWOT Analysis
- 11.6.5. Key Strategies and Developments
- 11.7. Tianzhu Yutong
- 11.7.1. Company Overview
- 11.7.2. Financial Highlights
- 11.7.3. Product Portfolio
- 11.7.4. SWOT Analysis
- 11.7.5. Key Strategies and Developments
- 11.8. ESD-SIC
- 11.8.1. Company Overview
- 11.8.2. Financial Highlights
- 11.8.3. Product Portfolio
- 11.8.4. SWOT Analysis
- 11.8.5. Key Strategies and Developments
- 11.9. ESK-SIC
- 11.9.1. Company Overview
- 11.9.2. Financial Highlights
- 11.9.3. Product Portfolio
- 11.9.4. SWOT Analysis
- 11.9.5. Key Strategies and Developments
- 11.10. Navarro
- 11.10.1. Company Overview
- 11.10.2. Financial Highlights
- 11.10.3. Product Portfolio
- 11.10.4. SWOT Analysis
- 11.10.5. Key Strategies and Developments
- 11.11. Pacific Rundum
- 11.11.1. Company Overview
- 11.11.2. Financial Highlights
- 11.11.3. Product Portfolio
- 11.11.4. SWOT Analysis
- 11.11.5. Key Strategies and Developments
- 11.12. Washington Mills
- 11.12.1. Company Overview
- 11.12.2. Financial Highlights
- 11.12.3. Product Portfolio
- 11.12.4. SWOT Analysis
- 11.12.5. Key Strategies and Developments
- 11.13.1. Company Overview
- 11.13.2. Financial Highlights
- 11.13.3. Product Portfolio
- 11.13.4. SWOT Analysis
- 11.13.5. Key Strategies and Developments
- 11.14. Elsid S.A
- 11.14.1. Company Overview
- 11.14.2. Financial Highlights
- 11.14.3. Product Portfolio
- 11.14.4. SWOT Analysis
- 11.14.5. Key Strategies and Developments
- 11.15. Elmet
- 11.15.1. Company Overview
- 11.15.2. Financial Highlights
- 11.15.3. Product Portfolio
- 11.15.4. SWOT Analysis
- 11.15.5. Key Strategies and Developments
- 11.16. Snam Abrasives
- 11.16.1. Company Overview
- 11.16.2. Financial Highlights
- 11.16.3. Product Portfolio
- 11.16.4. SWOT Analysis
- 11.16.5. Key Strategies and Developments
- 12. Assumptions and Acronyms
- 13. Research Methodology
- 14. Contact
- List of Figures
- Figure 1: Global Carborundum Market Revenue (US$ Mn) Market Share by Type in 2022
- Figure 2: Global Carborundum Market Attractiveness Analysis by Type, 2016-2033
- Figure 3: Global Carborundum Market Revenue (US$ Mn) Market Share by Applicationin 2022
- Figure 4: Global Carborundum Market Attractiveness Analysis by Application, 2016-2033
- Figure 5: Global Carborundum Market Revenue (US$ Mn) Market Share by End-Use Industriesin 2022
- Figure 6: Global Carborundum Market Attractiveness Analysis by End-Use Industries, 2016-2033
- Figure 7: Global Carborundum Market Revenue (US$ Mn) Market Share by Region in 2022
- Figure 8: Global Carborundum Market Attractiveness Analysis by Region, 2016-2033
- Figure 9: Global Carborundum Market Revenue (US$ Mn) (2016-2033)
- Figure 10: Global Carborundum Market Revenue (US$ Mn) Comparison by Region (2016-2033)
- Figure 11: Global Carborundum Market Revenue (US$ Mn) Comparison by Type (2016-2033)
- Figure 12: Global Carborundum Market Revenue (US$ Mn) Comparison by Application (2016-2033)
- Figure 13: Global Carborundum Market Revenue (US$ Mn) Comparison by End-Use Industries (2016-2033)
- Figure 14: Global Carborundum Market Y-o-Y Growth Rate Comparison by Region (2016-2033)
- Figure 15: Global Carborundum Market Y-o-Y Growth Rate Comparison by Type (2016-2033)
- Figure 16: Global Carborundum Market Y-o-Y Growth Rate Comparison by Application (2016-2033)
- Figure 17: Global Carborundum Market Y-o-Y Growth Rate Comparison by End-Use Industries (2016-2033)
- Figure 18: Global Carborundum Market Share Comparison by Region (2016-2033)
- Figure 19: Global Carborundum Market Share Comparison by Type (2016-2033)
- Figure 20: Global Carborundum Market Share Comparison by Application (2016-2033)
- Figure 21: Global Carborundum Market Share Comparison by End-Use Industries (2016-2033)
- Figure 22: North America Carborundum Market Revenue (US$ Mn) Market Share by Typein 2022
- Figure 23: North America Carborundum Market Attractiveness Analysis by Type, 2016-2033
- Figure 24: North America Carborundum Market Revenue (US$ Mn) Market Share by Applicationin 2022
- Figure 25: North America Carborundum Market Attractiveness Analysis by Application, 2016-2033
- Figure 26: North America Carborundum Market Revenue (US$ Mn) Market Share by End-Use Industriesin 2022
- Figure 27: North America Carborundum Market Attractiveness Analysis by End-Use Industries, 2016-2033
- Figure 28: North America Carborundum Market Revenue (US$ Mn) Market Share by Country in 2022
- Figure 29: North America Carborundum Market Attractiveness Analysis by Country, 2016-2033
- Figure 30: North America Carborundum Market Revenue (US$ Mn) (2016-2033)
- Figure 31: North America Carborundum Market Revenue (US$ Mn) Comparison by Country (2016-2033)
- Figure 32: North America Carborundum Market Revenue (US$ Mn) Comparison by Type (2016-2033)
- Figure 33: North America Carborundum Market Revenue (US$ Mn) Comparison by Application (2016-2033)
- Figure 34: North America Carborundum Market Revenue (US$ Mn) Comparison by End-Use Industries (2016-2033)
- Figure 35: North America Carborundum Market Y-o-Y Growth Rate Comparison by Country (2016-2033)
- Figure 36: North America Carborundum Market Y-o-Y Growth Rate Comparison by Type (2016-2033)
- Figure 37: North America Carborundum Market Y-o-Y Growth Rate Comparison by Application (2016-2033)
- Figure 38: North America Carborundum Market Y-o-Y Growth Rate Comparison by End-Use Industries (2016-2033)
- Figure 39: North America Carborundum Market Share Comparison by Country (2016-2033)
- Figure 40: North America Carborundum Market Share Comparison by Type (2016-2033)
- Figure 41: North America Carborundum Market Share Comparison by Application (2016-2033)
- Figure 42: North America Carborundum Market Share Comparison by End-Use Industries (2016-2033)
- Figure 43: Western Europe Carborundum Market Revenue (US$ Mn) Market Share by Typein 2022
- Figure 44: Western Europe Carborundum Market Attractiveness Analysis by Type, 2016-2033
- Figure 45: Western Europe Carborundum Market Revenue (US$ Mn) Market Share by Applicationin 2022
- Figure 46: Western Europe Carborundum Market Attractiveness Analysis by Application, 2016-2033
- Figure 47: Western Europe Carborundum Market Revenue (US$ Mn) Market Share by End-Use Industriesin 2022
- Figure 48: Western Europe Carborundum Market Attractiveness Analysis by End-Use Industries, 2016-2033
- Figure 49: Western Europe Carborundum Market Revenue (US$ Mn) Market Share by Country in 2022
- Figure 50: Western Europe Carborundum Market Attractiveness Analysis by Country, 2016-2033
- Figure 51: Western Europe Carborundum Market Revenue (US$ Mn) (2016-2033)
- Figure 52: Western Europe Carborundum Market Revenue (US$ Mn) Comparison by Country (2016-2033)
- Figure 53: Western Europe Carborundum Market Revenue (US$ Mn) Comparison by Type (2016-2033)
- Figure 54: Western Europe Carborundum Market Revenue (US$ Mn) Comparison by Application (2016-2033)
- Figure 55: Western Europe Carborundum Market Revenue (US$ Mn) Comparison by End-Use Industries (2016-2033)
- Figure 56: Western Europe Carborundum Market Y-o-Y Growth Rate Comparison by Country (2016-2033)
- Figure 57: Western Europe Carborundum Market Y-o-Y Growth Rate Comparison by Type (2016-2033)
- Figure 58: Western Europe Carborundum Market Y-o-Y Growth Rate Comparison by Application (2016-2033)
- Figure 59: Western Europe Carborundum Market Y-o-Y Growth Rate Comparison by End-Use Industries (2016-2033)
- Figure 60: Western Europe Carborundum Market Share Comparison by Country (2016-2033)
- Figure 61: Western Europe Carborundum Market Share Comparison by Type (2016-2033)
- Figure 62: Western Europe Carborundum Market Share Comparison by Application (2016-2033)
- Figure 63: Western Europe Carborundum Market Share Comparison by End-Use Industries (2016-2033)
- Figure 64: Eastern Europe Carborundum Market Revenue (US$ Mn) Market Share by Typein 2022
- Figure 65: Eastern Europe Carborundum Market Attractiveness Analysis by Type, 2016-2033
- Figure 66: Eastern Europe Carborundum Market Revenue (US$ Mn) Market Share by Applicationin 2022
- Figure 67: Eastern Europe Carborundum Market Attractiveness Analysis by Application, 2016-2033
- Figure 68: Eastern Europe Carborundum Market Revenue (US$ Mn) Market Share by End-Use Industriesin 2022
- Figure 69: Eastern Europe Carborundum Market Attractiveness Analysis by End-Use Industries, 2016-2033
- Figure 70: Eastern Europe Carborundum Market Revenue (US$ Mn) Market Share by Country in 2022
- Figure 71: Eastern Europe Carborundum Market Attractiveness Analysis by Country, 2016-2033
- Figure 72: Eastern Europe Carborundum Market Revenue (US$ Mn) (2016-2033)
- Figure 73: Eastern Europe Carborundum Market Revenue (US$ Mn) Comparison by Country (2016-2033)
- Figure 74: Eastern Europe Carborundum Market Revenue (US$ Mn) Comparison by Type (2016-2033)
- Figure 75: Eastern Europe Carborundum Market Revenue (US$ Mn) Comparison by Application (2016-2033)
- Figure 76: Eastern Europe Carborundum Market Revenue (US$ Mn) Comparison by End-Use Industries (2016-2033)
- Figure 77: Eastern Europe Carborundum Market Y-o-Y Growth Rate Comparison by Country (2016-2033)
- Figure 78: Eastern Europe Carborundum Market Y-o-Y Growth Rate Comparison by Type (2016-2033)
- Figure 79: Eastern Europe Carborundum Market Y-o-Y Growth Rate Comparison by Application (2016-2033)
- Figure 80: Eastern Europe Carborundum Market Y-o-Y Growth Rate Comparison by End-Use Industries (2016-2033)
- Figure 81: Eastern Europe Carborundum Market Share Comparison by Country (2016-2033)
- Figure 82: Eastern Europe Carborundum Market Share Comparison by Type (2016-2033)
- Figure 83: Eastern Europe Carborundum Market Share Comparison by Application (2016-2033)
- Figure 84: Eastern Europe Carborundum Market Share Comparison by End-Use Industries (2016-2033)
- Figure 85: APAC Carborundum Market Revenue (US$ Mn) Market Share by Typein 2022
- Figure 86: APAC Carborundum Market Attractiveness Analysis by Type, 2016-2033
- Figure 87: APAC Carborundum Market Revenue (US$ Mn) Market Share by Applicationin 2022
- Figure 88: APAC Carborundum Market Attractiveness Analysis by Application, 2016-2033
- Figure 89: APAC Carborundum Market Revenue (US$ Mn) Market Share by End-Use Industriesin 2022
- Figure 90: APAC Carborundum Market Attractiveness Analysis by End-Use Industries, 2016-2033
- Figure 91: APAC Carborundum Market Revenue (US$ Mn) Market Share by Country in 2022
- Figure 92: APAC Carborundum Market Attractiveness Analysis by Country, 2016-2033
- Figure 93: APAC Carborundum Market Revenue (US$ Mn) (2016-2033)
- Figure 94: APAC Carborundum Market Revenue (US$ Mn) Comparison by Country (2016-2033)
- Figure 95: APAC Carborundum Market Revenue (US$ Mn) Comparison by Type (2016-2033)
- Figure 96: APAC Carborundum Market Revenue (US$ Mn) Comparison by Application (2016-2033)
- Figure 97: APAC Carborundum Market Revenue (US$ Mn) Comparison by End-Use Industries (2016-2033)
- Figure 98: APAC Carborundum Market Y-o-Y Growth Rate Comparison by Country (2016-2033)
- Figure 99: APAC Carborundum Market Y-o-Y Growth Rate Comparison by Type (2016-2033)
- Figure 100: APAC Carborundum Market Y-o-Y Growth Rate Comparison by Application (2016-2033)
- Figure 101: APAC Carborundum Market Y-o-Y Growth Rate Comparison by End-Use Industries (2016-2033)
- Figure 102: APAC Carborundum Market Share Comparison by Country (2016-2033)
- Figure 103: APAC Carborundum Market Share Comparison by Type (2016-2033)
- Figure 104: APAC Carborundum Market Share Comparison by Application (2016-2033)
- Figure 105: APAC Carborundum Market Share Comparison by End-Use Industries (2016-2033)
- Figure 106: Latin America Carborundum Market Revenue (US$ Mn) Market Share by Typein 2022
- Figure 107: Latin America Carborundum Market Attractiveness Analysis by Type, 2016-2033
- Figure 108: Latin America Carborundum Market Revenue (US$ Mn) Market Share by Applicationin 2022
- Figure 109: Latin America Carborundum Market Attractiveness Analysis by Application, 2016-2033
- Figure 110: Latin America Carborundum Market Revenue (US$ Mn) Market Share by End-Use Industriesin 2022
- Figure 111: Latin America Carborundum Market Attractiveness Analysis by End-Use Industries, 2016-2033
- Figure 112: Latin America Carborundum Market Revenue (US$ Mn) Market Share by Country in 2022
- Figure 113: Latin America Carborundum Market Attractiveness Analysis by Country, 2016-2033
- Figure 114: Latin America Carborundum Market Revenue (US$ Mn) (2016-2033)
- Figure 115: Latin America Carborundum Market Revenue (US$ Mn) Comparison by Country (2016-2033)
- Figure 116: Latin America Carborundum Market Revenue (US$ Mn) Comparison by Type (2016-2033)
- Figure 117: Latin America Carborundum Market Revenue (US$ Mn) Comparison by Application (2016-2033)
- Figure 118: Latin America Carborundum Market Revenue (US$ Mn) Comparison by End-Use Industries (2016-2033)
- Figure 119: Latin America Carborundum Market Y-o-Y Growth Rate Comparison by Country (2016-2033)
- Figure 120: Latin America Carborundum Market Y-o-Y Growth Rate Comparison by Type (2016-2033)
- Figure 121: Latin America Carborundum Market Y-o-Y Growth Rate Comparison by Application (2016-2033)
- Figure 122: Latin America Carborundum Market Y-o-Y Growth Rate Comparison by End-Use Industries (2016-2033)
- Figure 123: Latin America Carborundum Market Share Comparison by Country (2016-2033)
- Figure 124: Latin America Carborundum Market Share Comparison by Type (2016-2033)
- Figure 125: Latin America Carborundum Market Share Comparison by Application (2016-2033)
- Figure 126: Latin America Carborundum Market Share Comparison by End-Use Industries (2016-2033)
- Figure 127: Middle East & Africa Carborundum Market Revenue (US$ Mn) Market Share by Typein 2022
- Figure 128: Middle East & Africa Carborundum Market Attractiveness Analysis by Type, 2016-2033
- Figure 129: Middle East & Africa Carborundum Market Revenue (US$ Mn) Market Share by Applicationin 2022
- Figure 130: Middle East & Africa Carborundum Market Attractiveness Analysis by Application, 2016-2033
- Figure 131: Middle East & Africa Carborundum Market Revenue (US$ Mn) Market Share by End-Use Industriesin 2022
- Figure 132: Middle East & Africa Carborundum Market Attractiveness Analysis by End-Use Industries, 2016-2033
- Figure 133: Middle East & Africa Carborundum Market Revenue (US$ Mn) Market Share by Country in 2022
- Figure 134: Middle East & Africa Carborundum Market Attractiveness Analysis by Country, 2016-2033
- Figure 135: Middle East & Africa Carborundum Market Revenue (US$ Mn) (2016-2033)
- Figure 136: Middle East & Africa Carborundum Market Revenue (US$ Mn) Comparison by Country (2016-2033)
- Figure 137: Middle East & Africa Carborundum Market Revenue (US$ Mn) Comparison by Type (2016-2033)
- Figure 138: Middle East & Africa Carborundum Market Revenue (US$ Mn) Comparison by Application (2016-2033)
- Figure 139: Middle East & Africa Carborundum Market Revenue (US$ Mn) Comparison by End-Use Industries (2016-2033)
- Figure 140: Middle East & Africa Carborundum Market Y-o-Y Growth Rate Comparison by Country (2016-2033)
- Figure 141: Middle East & Africa Carborundum Market Y-o-Y Growth Rate Comparison by Type (2016-2033)
- Figure 142: Middle East & Africa Carborundum Market Y-o-Y Growth Rate Comparison by Application (2016-2033)
- Figure 143: Middle East & Africa Carborundum Market Y-o-Y Growth Rate Comparison by End-Use Industries (2016-2033)
- Figure 144: Middle East & Africa Carborundum Market Share Comparison by Country (2016-2033)
- Figure 145: Middle East & Africa Carborundum Market Share Comparison by Type (2016-2033)
- Figure 146: Middle East & Africa Carborundum Market Share Comparison by Application (2016-2033)
- Figure 147: Middle East & Africa Carborundum Market Share Comparison by End-Use Industries (2016-2033)
- List of Tables
- Table 1: Global Carborundum Market Comparison by Type (2016-2033)
- Table 2: Global Carborundum Market Comparison by Application (2016-2033)
- Table 3: Global Carborundum Market Comparison by End-Use Industries (2016-2033)
- Table 4: Global Carborundum Market Revenue (US$ Mn) Comparison by Region (2016-2033)
- Table 5: Global Carborundum Market Revenue (US$ Mn) (2016-2033)
- Table 6: Global Carborundum Market Revenue (US$ Mn) Comparison by Region (2016-2033)
- Table 7: Global Carborundum Market Revenue (US$ Mn) Comparison by Type (2016-2033)
- Table 8: Global Carborundum Market Revenue (US$ Mn) Comparison by Application (2016-2033)
- Table 9: Global Carborundum Market Revenue (US$ Mn) Comparison by End-Use Industries (2016-2033)
- Table 10: Global Carborundum Market Y-o-Y Growth Rate Comparison by Region (2016-2033)
- Table 11: Global Carborundum Market Y-o-Y Growth Rate Comparison by Type (2016-2033)
- Table 12: Global Carborundum Market Y-o-Y Growth Rate Comparison by Application (2016-2033)
- Table 13: Global Carborundum Market Y-o-Y Growth Rate Comparison by End-Use Industries (2016-2033)
- Table 14: Global Carborundum Market Share Comparison by Region (2016-2033)
- Table 15: Global Carborundum Market Share Comparison by Type (2016-2033)
- Table 16: Global Carborundum Market Share Comparison by Application (2016-2033)
- Table 17: Global Carborundum Market Share Comparison by End-Use Industries (2016-2033)
- Table 18: North America Carborundum Market Comparison by Application (2016-2033)
- Table 19: North America Carborundum Market Comparison by End-Use Industries (2016-2033)
- Table 20: North America Carborundum Market Revenue (US$ Mn) Comparison by Country (2016-2033)
- Table 21: North America Carborundum Market Revenue (US$ Mn) (2016-2033)
- Table 22: North America Carborundum Market Revenue (US$ Mn) Comparison by Country (2016-2033)
- Table 23: North America Carborundum Market Revenue (US$ Mn) Comparison by Type (2016-2033)
- Table 24: North America Carborundum Market Revenue (US$ Mn) Comparison by Application (2016-2033)
- Table 25: North America Carborundum Market Revenue (US$ Mn) Comparison by End-Use Industries (2016-2033)
- Table 26: North America Carborundum Market Y-o-Y Growth Rate Comparison by Country (2016-2033)
- Table 27: North America Carborundum Market Y-o-Y Growth Rate Comparison by Type (2016-2033)
- Table 28: North America Carborundum Market Y-o-Y Growth Rate Comparison by Application (2016-2033)
- Table 29: North America Carborundum Market Y-o-Y Growth Rate Comparison by End-Use Industries (2016-2033)
- Table 30: North America Carborundum Market Share Comparison by Country (2016-2033)
- Table 31: North America Carborundum Market Share Comparison by Type (2016-2033)
- Table 32: North America Carborundum Market Share Comparison by Application (2016-2033)
- Table 33: North America Carborundum Market Share Comparison by End-Use Industries (2016-2033)
- Table 34: Western Europe Carborundum Market Comparison by Type (2016-2033)
- Table 35: Western Europe Carborundum Market Comparison by Application (2016-2033)
- Table 36: Western Europe Carborundum Market Comparison by End-Use Industries (2016-2033)
- Table 37: Western Europe Carborundum Market Revenue (US$ Mn) Comparison by Country (2016-2033)
- Table 38: Western Europe Carborundum Market Revenue (US$ Mn) (2016-2033)
- Table 39: Western Europe Carborundum Market Revenue (US$ Mn) Comparison by Country (2016-2033)
- Table 40: Western Europe Carborundum Market Revenue (US$ Mn) Comparison by Type (2016-2033)
- Table 41: Western Europe Carborundum Market Revenue (US$ Mn) Comparison by Application (2016-2033)
- Table 42: Western Europe Carborundum Market Revenue (US$ Mn) Comparison by End-Use Industries (2016-2033)
- Table 43: Western Europe Carborundum Market Y-o-Y Growth Rate Comparison by Country (2016-2033)
- Table 44: Western Europe Carborundum Market Y-o-Y Growth Rate Comparison by Type (2016-2033)
- Table 45: Western Europe Carborundum Market Y-o-Y Growth Rate Comparison by Application (2016-2033)
- Table 46: Western Europe Carborundum Market Y-o-Y Growth Rate Comparison by End-Use Industries (2016-2033)
- Table 47: Western Europe Carborundum Market Share Comparison by Country (2016-2033)
- Table 48: Western Europe Carborundum Market Share Comparison by Type (2016-2033)
- Table 49: Western Europe Carborundum Market Share Comparison by Application (2016-2033)
- Table 50: Western Europe Carborundum Market Share Comparison by End-Use Industries (2016-2033)
- Table 51: Eastern Europe Carborundum Market Comparison by Type (2016-2033)
- Table 52: Eastern Europe Carborundum Market Comparison by Application (2016-2033)
- Table 53: Eastern Europe Carborundum Market Comparison by End-Use Industries (2016-2033)
- Table 54: Eastern Europe Carborundum Market Revenue (US$ Mn) Comparison by Country (2016-2033)
- Table 55: Eastern Europe Carborundum Market Revenue (US$ Mn) (2016-2033)
- Table 56: Eastern Europe Carborundum Market Revenue (US$ Mn) Comparison by Country (2016-2033)
- Table 57: Eastern Europe Carborundum Market Revenue (US$ Mn) Comparison by Type (2016-2033)
- Table 58: Eastern Europe Carborundum Market Revenue (US$ Mn) Comparison by Application (2016-2033)
- Table 59: Eastern Europe Carborundum Market Revenue (US$ Mn) Comparison by End-Use Industries (2016-2033)
- Table 60: Eastern Europe Carborundum Market Y-o-Y Growth Rate Comparison by Country (2016-2033)
- Table 61: Eastern Europe Carborundum Market Y-o-Y Growth Rate Comparison by Type (2016-2033)
- Table 62: Eastern Europe Carborundum Market Y-o-Y Growth Rate Comparison by Application (2016-2033)
- Table 63: Eastern Europe Carborundum Market Y-o-Y Growth Rate Comparison by End-Use Industries (2016-2033)
- Table 64: Eastern Europe Carborundum Market Share Comparison by Country (2016-2033)
- Table 65: Eastern Europe Carborundum Market Share Comparison by Type (2016-2033)
- Table 66: Eastern Europe Carborundum Market Share Comparison by Application (2016-2033)
- Table 67: Eastern Europe Carborundum Market Share Comparison by End-Use Industries (2016-2033)
- Table 68: APAC Carborundum Market Comparison by Type (2016-2033)
- Table 69: APAC Carborundum Market Comparison by Application (2016-2033)
- Table 70: APAC Carborundum Market Comparison by End-Use Industries (2016-2033)
- Table 71: APAC Carborundum Market Revenue (US$ Mn) Comparison by Country (2016-2033)
- Table 72: APAC Carborundum Market Revenue (US$ Mn) (2016-2033)
- Table 73: APAC Carborundum Market Revenue (US$ Mn) Comparison by Country (2016-2033)
- Table 74: APAC Carborundum Market Revenue (US$ Mn) Comparison by Type (2016-2033)
- Table 75: APAC Carborundum Market Revenue (US$ Mn) Comparison by Application (2016-2033)
- Table 76: APAC Carborundum Market Revenue (US$ Mn) Comparison by End-Use Industries (2016-2033)
- Table 77: APAC Carborundum Market Y-o-Y Growth Rate Comparison by Country (2016-2033)
- Table 78: APAC Carborundum Market Y-o-Y Growth Rate Comparison by Type (2016-2033)
- Table 79: APAC Carborundum Market Y-o-Y Growth Rate Comparison by Application (2016-2033)
- Table 80: APAC Carborundum Market Y-o-Y Growth Rate Comparison by End-Use Industries (2016-2033)
- Table 81: APAC Carborundum Market Share Comparison by Country (2016-2033)
- Table 82: APAC Carborundum Market Share Comparison by Type (2016-2033)
- Table 83: APAC Carborundum Market Share Comparison by Application (2016-2033)
- Table 84: APAC Carborundum Market Share Comparison by End-Use Industries (2016-2033)
- Table 85: Latin America Carborundum Market Comparison by Type (2016-2033)
- Table 86: Latin America Carborundum Market Comparison by Application (2016-2033)
- Table 87: Latin America Carborundum Market Comparison by End-Use Industries (2016-2033)
- Table 88: Latin America Carborundum Market Revenue (US$ Mn) Comparison by Country (2016-2033)
- Table 89: Latin America Carborundum Market Revenue (US$ Mn) (2016-2033)
- Table 90: Latin America Carborundum Market Revenue (US$ Mn) Comparison by Country (2016-2033)
- Table 91: Latin America Carborundum Market Revenue (US$ Mn) Comparison by Type (2016-2033)
- Table 92: Latin America Carborundum Market Revenue (US$ Mn) Comparison by Application (2016-2033)
- Table 93: Latin America Carborundum Market Revenue (US$ Mn) Comparison by End-Use Industries (2016-2033)
- Table 94: Latin America Carborundum Market Y-o-Y Growth Rate Comparison by Country (2016-2033)
- Table 95: Latin America Carborundum Market Y-o-Y Growth Rate Comparison by Type (2016-2033)
- Table 96: Latin America Carborundum Market Y-o-Y Growth Rate Comparison by Application (2016-2033)
- Table 97: Latin America Carborundum Market Y-o-Y Growth Rate Comparison by End-Use Industries (2016-2033)
- Table 98: Latin America Carborundum Market Share Comparison by Country (2016-2033)
- Table 99: Latin America Carborundum Market Share Comparison by Type (2016-2033)
- Table 100: Latin America Carborundum Market Share Comparison by Application (2016-2033)
- Table 101: Latin America Carborundum Market Share Comparison by End-Use Industries (2016-2033)
- Table 102: Middle East & Africa Carborundum Market Comparison by Type (2016-2033)
- Table 103: Middle East & Africa Carborundum Market Comparison by Application (2016-2033)
- Table 104: Middle East & Africa Carborundum Market Comparison by End-Use Industries (2016-2033)
- Table 105: Middle East & Africa Carborundum Market Revenue (US$ Mn) Comparison by Country (2016-2033)
- Table 106: Middle East & Africa Carborundum Market Revenue (US$ Mn) (2016-2033)
- Table 107: Middle East & Africa Carborundum Market Revenue (US$ Mn) Comparison by Country (2016-2033)
- Table 108: Middle East & Africa Carborundum Market Revenue (US$ Mn) Comparison by Type (2016-2033)
- Table 109: Middle East & Africa Carborundum Market Revenue (US$ Mn) Comparison by Application (2016-2033)
- Table 110: Middle East & Africa Carborundum Market Revenue (US$ Mn) Comparison by End-Use Industries (2016-2033)
- Table 111: Middle East & Africa Carborundum Market Y-o-Y Growth Rate Comparison by Country (2016-2033)
- Table 112: Middle East & Africa Carborundum Market Y-o-Y Growth Rate Comparison by Type (2016-2033)
- Table 113: Middle East & Africa Carborundum Market Y-o-Y Growth Rate Comparison by Application (2016-2033)
- Table 114: Middle East & Africa Carborundum Market Y-o-Y Growth Rate Comparison by End-Use Industries (2016-2033)
- Table 115: Middle East & Africa Carborundum Market Share Comparison by Country (2016-2033)
- Table 116: Middle East & Africa Carborundum Market Share Comparison by Type (2016-2033)
- Table 117: Middle East & Africa Carborundum Market Share Comparison by Application (2016-2033)
- Table 118: Middle East & Africa Carborundum Market Share Comparison by End-Use Industries (2016-2033)
- 1. Executive Summary
-
- Saint-Gobain
- 3M
- Carborundum Universal Limited
- Ningxia Tianjing
- Lanzhou Heqiao
- Tianzhu Yutong
- ESD-SIC
- ESK-SIC
- Navarro
- Pacific Rundum
- Washington Mills
- Elsid S.A
- Sublime
- Elmet
- Snam Abrasives
- Gaddis Engineered Materials
- Cree Inc.
- AGSCO Corporation
- Norstel AB
- Vitesco Technologies
Our Clients


View Our Licence Options
