
Canned Food Market By Product Type(Canned seafood, Canned vegetables and fruits, Others), By Type(Organic, Conventional), By Distribution Channel(Supermarkets and Hypermarkets, Independent retailers, Others),By Region And Companies - Industry Segment Outlook, Market Assessment, Competition Scenario, Trends, And Forecast 2023-2032
-
2260
-
Nov 2023
-
155
-


-
This report was compiled by Shreyas Rokade Shreyas Rokade is a seasoned Research Analyst with CMFE, bringing extensive expertise in market research and consulting, with a strong background in Chemical Engineering. Correspondence Team Lead-CMFE Linkedin | Detailed Market research Methodology Our methodology involves a mix of primary research, including interviews with leading mental health experts, and secondary research from reputable medical journals and databases. View Detailed Methodology Page
-
Quick Navigation
Report Overview
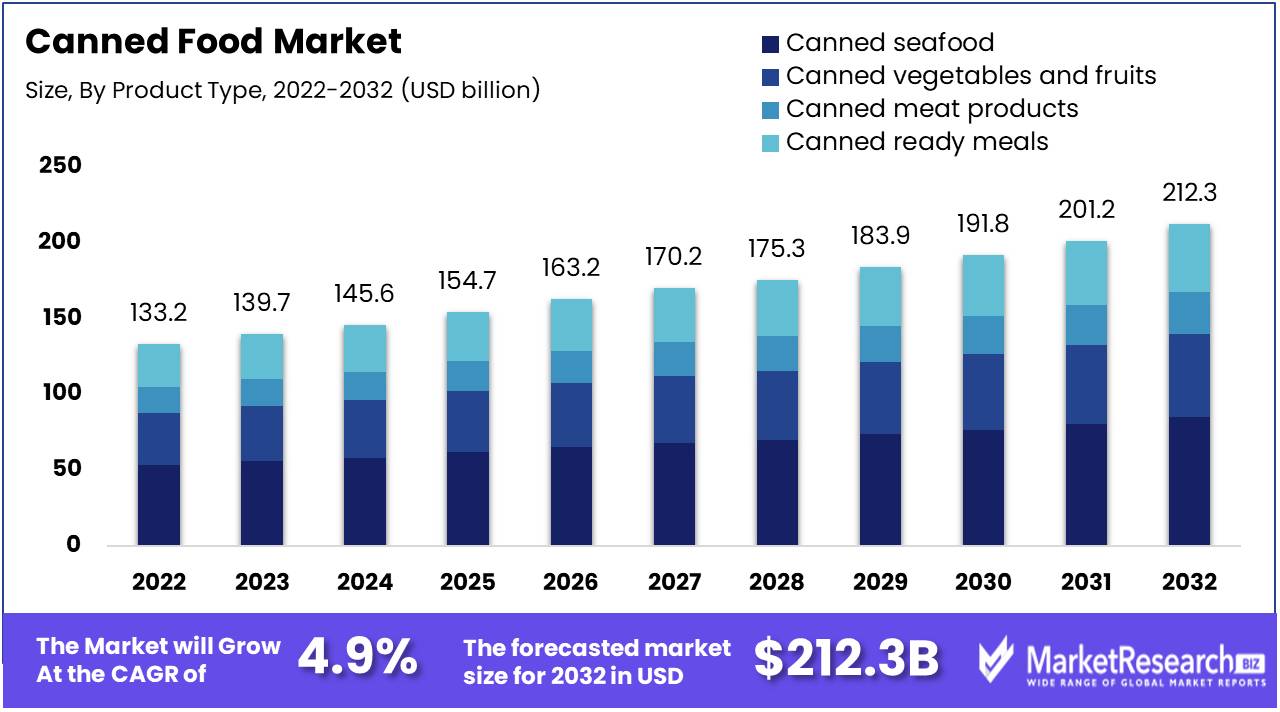
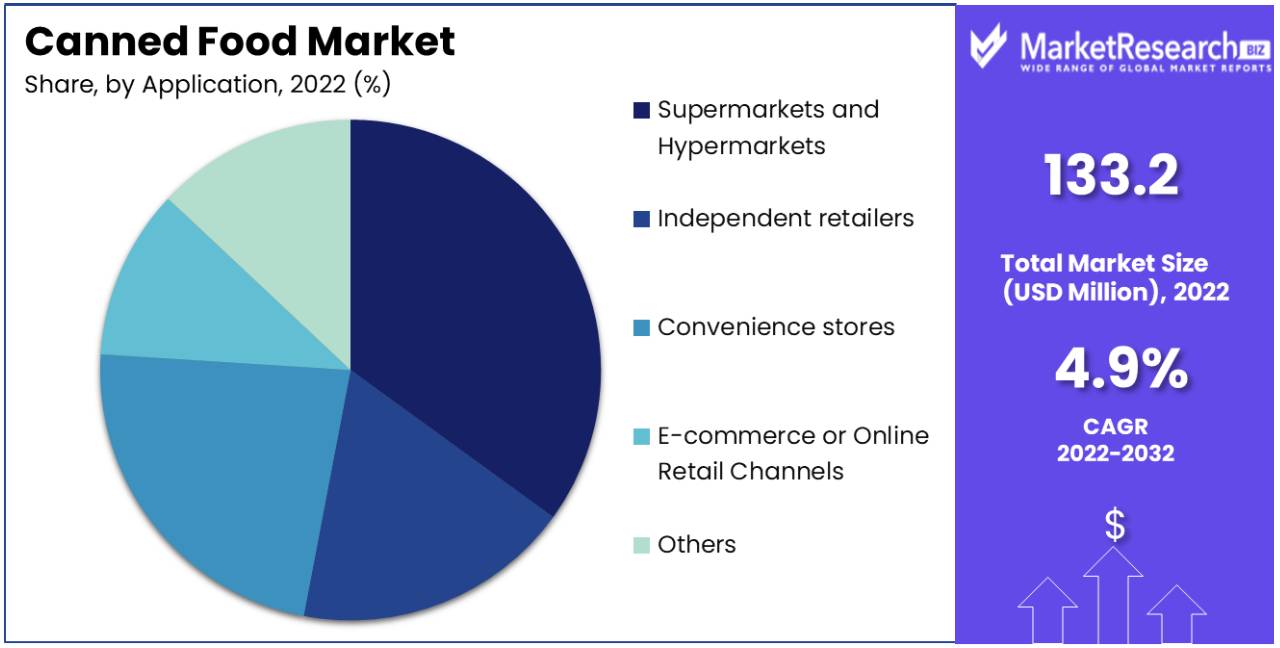
Canned Food Market size is expected to be worth around USD 212.3 Bn by 2032 from USD 133.2 Bn in 2022, growing at a CAGR of 4.9% during the forecast period from 2023 to 2032.
An increase in demand for canned food among customers signifies one of the main key factors that drives the market expansion. The upsurge in the number of working individuals leads to the consumption of ready-to-eat food items. Due to this, canned food has emerged as one of the preferred choices that every working individual opt for.
For example, the majority of the people who work for longer hours do not have time to cook a meal. To avoid the skipping of meals, canned food offers an instant and quick solution. With several options starting from canned vegetables and beans to stews, pre-cooked meats, and soups, a person can get together a healthy and tasty meal in just a few minutes.
Additionally, canned foods are guaranteed to remain fresh and can be eaten for longer periods. This benefit is for those people who avoid visiting grocery shops daily. It allows them to store a necessary supply of foods readily available whenever they require it.
Various brands and manufacturers provide a variety of canned food options to offer different tastes and food preferences.
Whether it is organic and gluten-free choices to international food items, the canned food products ensure the good quality and taste will be healthy and delicious. Furthermore, the packaging and preservation methods have been enhanced over the past few years and that guarantees the nutritional value and flavor of the foods are well-maintained.
Many major factors and key players are initiating different types of promotions and brand awareness campaigns to drive the demand for canned food products and expand the market. Manufacturers do different types of promotions and advertisements to keep the customers updated on the market trends.
Such type of awareness campaigns about the health of canned food products is expected to grow the market. According to foreign agriculture services, China's overall retail sale of consumer goods has observed a market growth of 11%, and this rise in the retail market is projected to expand the growth of the canned food market in the coming years.
Driving factors
Convenience Food Demand Drives Canned Food Market Growth
The increasing demand for convenience foods is a significant driver for the canned food market. Modern lifestyles, characterized by busy schedules and reduced time for cooking, have elevated the appeal of canned foods, which offer a quick and convenient meal option. These products fit seamlessly into the lives of consumers seeking ease of preparation without sacrificing nutritional value.
Canned foods have evolved to meet health-conscious demands, with options that boast organic ingredients, non-GMO certification, and low sodium content. The availability of a diverse range of products, from fruits and vegetables to meats and seafood packaging, provides consumers with a spectrum of convenient choices. This versatility has contributed to the consistent expansion of the market.
The trend towards convenience is anticipated to persist, suggesting a continued upward trajectory for the canned food market. Long-term implications may include further product innovation to enhance health benefits, taste, and convenience, as well as the integration of smart packaging technologies to track freshness and improve shelf life.
Global Recycling Rates Fuel Canned Food Market Growth
Increasing recycling rates globally are positively impacting the growth of the canned food market. As environmental awareness and sustainability become more significant to consumers, the recyclability of canned food packaging becomes a key selling point. Metal cans are among the most recycled packaging types, and advancements in recycling technology have made the process more efficient, reducing the environmental footprint of canned products.
The closed-loop cycle of metal can production, wherein materials can be recycled indefinitely without loss of quality, presents an attractive sustainability narrative to environmentally conscious consumers. This has allowed the canned food market to not only grow but also align itself with the broader movement towards sustainable consumption.
As recycling technologies improve and consumer awareness increases, the canned food market is likely to benefit. This could lead to an increased emphasis on recycled content in packaging and potential regulatory incentives for sustainable packaging solutions.
Rising Number of Food Retail Outlets Expands Canned Food Market
The rising number of food retail outlets globally is another driver fueling the expansion of the canned food market. The spread of supermarkets, hypermarkets, and convenience stores, especially in emerging economies, has made canned foods more accessible to a wider population. These outlets serve as critical points of sale for canned food products, offering variety and convenience to shoppers.
As retailers expand their reach, the visibility of canned food products increases, offering consumers easy access to a range of products. The food retail growth also encourages competition among brands, leading to more competitive pricing, promotional strategies, and shelf-space optimization, all of which can stimulate market growth.
The continued proliferation of food retail outlets is expected to sustain the growth of the canned food market. Over the long term, this could lead to deeper market penetration and the development of private-label products, further expanding consumer choice.
Restraining Factors
Consumers' Growing Desire for Fresh Foods Restrains Canned Food Market Growth
The increasing consumer preference for fresh over processed foods is a significant restraint on the canned food market. The trend towards healthier eating habits has led many consumers to perceive fresh foods as a more nutritious alternative to canned options, which are often believed to contain higher levels of sodium and fewer nutrients. This shift in consumer behavior is impacting the demand for canned foods, as more shoppers opt for fresh produce, particularly with the rise of organic and local food movements. As a result, the market for canned foods faces challenges in retaining and expanding its customer base.
Availability of Alternative Packaging Solutions Restrains Canned Food Market Growth
Innovation in packaging technology has introduced a range of alternative packaging solutions that are restraining the growth of the canned food market. Flexible packaging options, such as pouches and cartons, are becoming increasingly popular due to their convenience, lighter weight, and reduced environmental impact compared to traditional metal cans. These modern packaging solutions also offer improved aesthetics and functionality, which appeal to consumers and retailers alike. As these alternatives become more prevalent, the demand for canned food products is likely to be adversely affected, limiting market growth.
Segmentation Analysis of Canned Foods Market
By Product Type Analysis
Canned seafood leads the product type segment within the canned food market, driven by its long shelf life, convenience, and nutritional value. Consumers' increasing awareness of the health benefits associated with seafood segment consumption, such as omega-3 fatty acids, has bolstered demand. Additionally, the ease of preparation and the variety of seafood available in canned form have contributed to its dominant market position. The canned seafood products segment is a leading segment in the canned food market with a strong annual growth rate.
Canned vegetables and fruits are essential for their year-round availability, particularly for out-of-season or exotic options. Canned meat products fulfill the need for long-lasting, protein-rich food sources. Canned ready meals are gaining popularity for their convenience among time-pressed consumers. These categories collectively cater to a range of dietary preferences and are important for market completeness.
By Type Analysis
The organic segment has taken precedence in the canned food market. This trend aligns with the global shift towards organic products due to their perceived health benefits and lower environmental impact. Organic canned foods are increasingly popular among health-conscious consumers, and their premium positioning often commands a higher price point, which can drive segment profitability.
Conventional canned foods, while not the dominant segment, continue to occupy a substantial market share due to their affordability and extensive variety. They remain popular in price-sensitive markets and regions where organic products are less accessible.
By Distribution Channel Analysis
Supermarkets and hypermarkets are the predominant distribution channels for canned food. They offer a vast assortment of products under one roof, providing convenience for consumers. The ability to compare products directly, along with immediate availability, reinforces their dominant status.
Independent retailers cater to local markets, while convenience stores serve immediate consumer needs. E-commerce platforms and online retail channels are expanding rapidly as they offer the convenience of home delivery and often competitive pricing. Although these channels represent smaller segments, they are growing and adapting to changing consumer shopping behaviors.
The canned food market is multifaceted, with canned seafood holding the largest share due to its nutritional value and convenience. Organic products are the most significant in terms of growth potential, reflecting a broader consumer trend towards health and sustainability. Supermarkets and hypermarkets remain the primary sales channels, but online retail is expected to increase its market share, offering new growth opportunities for the industry.
Key Market Segments
By Product Type
- Canned seafood
- Canned vegetables and fruits
- Canned meat products
- Cannedready meals
By Type
- Organic
- Conventional
By Distribution Channel
- Supermarkets and Hypermarkets
- Independent retailers
- Convenience stores
- E-commerce or Online Retail Channels
- Others
Growth Opportunity
Global Appetite for Prepared Foods Offers Growth Opportunity in Canned Food Market
The growing global demand for prepared foods is a significant driver for the canned food market. As lifestyles become busier, consumers are turning towards convenient food options that require minimal preparation time. This trend is complemented by improvements in canning technology that help preserve the taste and nutritional value of food, making canned goods an increasingly popular choice for quick and easy meal solutions. This shift is reflected in market projections, which foresee continued growth in the convenience food sector.
Healthy Eating Trends Elevate Demand for Nutrient-Rich Canned Foods
The increasing consumer preference for healthy foods is translating into growth for nutrient-rich canned food options. With a focus on wellness, consumers seek convenient foods that do not compromise nutritional value, leading to higher demand for canned products high in proteins, functional fibers, vitamins, and omega-3 fatty acids. The canned food industry can capitalize on this by expanding offerings that cater to health-conscious buyers, potentially growing their market share.
Canned Fish Products Ride the Wave of Health Consciousness for Market Growth
The rising demand for canned fish products among health-conscious individuals presents a significant growth opportunity within the canned food market. Canned fish, a source of high-quality protein and omega-3 fatty acids is increasingly being recognized for its health benefits. This has led to a surge in popularity, with more consumers incorporating canned fish into their diets as a healthy and convenient option. The trend is buoyed by dietary recommendations favoring fish consumption, which supports the market's potential for expansion.
Regional Analysis
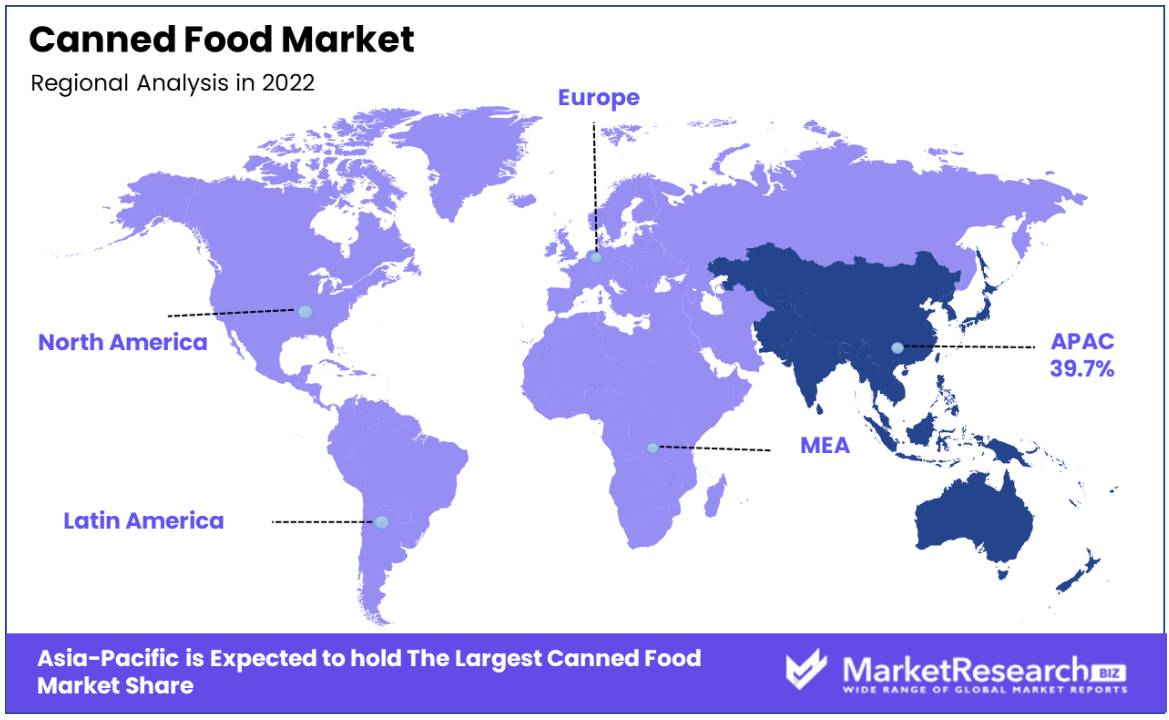
Asia Pacific Dominates with 39.70% Market Share in the Canned Food Market
Asia Pacific region leads the canned food market with a robust 39.70% share, a dominance propelled by its large population base and evolving food consumption patterns. Key factors driving the region's high market share include the rising middle class, the increasing number of working professionals, and a shift towards convenience-oriented lifestyles. The presence of diverse culinary traditions and the adaptation of canned food to these tastes also play a significant role.
The market dynamics are shaped by the region's rapid urbanization, which leads to greater demand for non-perishable food items. Additionally, the expansion of retail infrastructure and growing penetration of supermarkets and hypermarkets facilitate the availability and distribution of canned foods.
Forecast implications suggest that the Asia Pacific will continue to dominate the canned food market as economic development, and consumer purchasing power progresses. The basis of the region's burgeoning population and ongoing urbanization are likely to sustain the demand, while innovations in product offerings could further entrench the market position of canned foods.
North America Regional Analysis
In North America, the canned food market is a significant segment within the overall food industry, supported by consumer preferences for convenience and long shelf-life products. The high standard of living and busy lifestyles contribute to the demand for canned foods as a quick and easy meal solution.
The market benefits from well-established canning technologies and a strong network of distribution channels. Future growth in the region may be driven by key trends in healthy eating, with an increased demand for organic and low-sodium canned food options.
Europe Regional Analysis
Europe's canned food market is mature, with a high demand for canned fruits, vegetables, and fish products. The region's concern for food quality and safety standards ensures a steady demand for premium canned food products.
Sustainability and eco-consciousness are shaping the canned market, with an increased focus on recyclable packaging and the reduction of food waste. The European countries market is expected to maintain a stable growth trajectory, with innovation and sustainability as key drivers.
Key Regions and Countries
North America
- The US
- Canada
- Rest of North America
Europe
- Germany
- France
- The UK
- Spain
- Italy
- Russia
- Netherlands
- Rest of Europe
Asia-Pacific
- China
- Japan
- South Korea
- India
- New Zealand
- Singapore
- Thailand
- Vietnam
- Rest of Asia Pacific
Latin America
- Brazil
- Mexico
- Rest of Latin America
Middle East & Africa
- South Africa
- Saudi Arabia
- UAE
- Rest of Middle East & Africa
Key Players Analysis
The canned food market is marked by the presence of both established giants and specialized players, each contributing to the sector's growth. Bolton Group B.V. and The Kraft Heinz Company are notable for their expansive product lines and global distribution networks, which position them as market leaders in terms of reach and consumer preference. Their strategic positioning is characterized by a broad assortment of brands and a strong focus on quality and convenience.
Conagra Brands, Inc., Del Monte Foods, Inc., and General Mills, Inc. have a significant impact through their innovation in product offerings and packaging, catering to the evolving consumer demand for healthier and more diverse food options. Pinnacle Foods, Inc. and Hormel Foods Corporation are recognized for their targeted marketing and product development strategies, which address niche markets and consumer segments.
Kellogg Co. and Campbell Soup Company have shaped the market narrative around traditional food staples, with Campbell's particularly synonymous with the soup segment. Nestlé S.A. brings to the market a vast portfolio that extends beyond canned goods, influencing cross-category dynamics.
Top Key Players in Canned Food Market
- Bolton Group Srl
- ConAgra Brands Inc
- Del Monte Foods, Inc.
- The Kraft Heinz Company
- H.J. Heinz Company, L.P.
- Pinnacle Foods, Inc.
- Hormel Foods Corporation.
- General Mills, Inc.
- Kellogg Co.
- Campbell Soup Company
- Nestlé S.A.
- JBS USA Holdings, Inc.
- CHB Group
- AYAM
- Danish Crown Amba
- Dole Food Company Inc
Recent Development
- In January 2023, The Thai Union Group initiated an Innovation Challenge to partner with startups developing ocean-derived ingredients and applications.
- In March 2023, Dole Packaged Foods introduced several innovative products at the Natural Products Expo West, held in Anaheim, California. These new items were showcased in the frozen food and snack aisles of supermarkets.
- In 2023, AgriTech North, a company based in Dryden, Ontario, focused on locally-grown food, received CAD 100,000 in federal funding from FedNor to improve its energy efficiency and increase production.
- In 2023, The Cook Government in Western Australia introduced Agrifood and Beverage Vouchers to support food and beverage businesses. These vouchers provide financial assistance of up to $20,000 per business. The primary aim is to help these businesses scale up and create job opportunities across the state.
- In 2022, Small and medium-sized food manufacturers in Europe played a significant role in driving innovation in the canned food industry. These SMEs were responsible for 75% of all new products launched in 2022, demonstrating their ability to adapt quickly to changing market forces.
Report Scope
Report Features Description Market Value (2022) USD 133.2 Bn Forecast Revenue (2032) USD 212.3 Bn CAGR (2023-2032) 4.9% Base Year for Estimation 2022 Historic Period 2016-2022 Forecast Period 2023-2032 Report Coverage Revenue Forecast, Market Dynamics, COVID-19 Impact, Competitive Landscape, Recent Developments Segments Covered By Product Type(Canned seafood, Canned vegetables and fruits, Canned meat products, Cannedready meals), By Type(Organic, Conventional), By Distribution Channel(Supermarkets and Hypermarkets, Independent retailers, Convenience stores, E-commerce or, Online Retail Channels, Others) Regional Analysis North America - The US, Canada, Rest of North America, Europe - Germany, France, The UK, Spain, Italy, Russia, Netherlands, Rest of Europe, Asia-Pacific - China, Japan, South Korea, India, New Zealand, Singapore, Thailand, Vietnam, Rest of Asia Pacific, Latin America - Brazil, Mexico, Rest of Latin America, Middle East & Africa - South Africa, Saudi Arabia, UAE, Rest of Middle East & Africa Competitive Landscape Bolton Group Srl, Conagra Brands, Inc., Del Monte Foods, Inc., H.J. Heinz Company, L.P., Pinnacle Foods, Inc., Hormel Foods Corporation., General Mills, Inc., Kellogg Co., Campbell Soup Company, Nestlé S.A., JBS USA Holdings, Inc., CHB Group, AYAM, Danish Crown Amba, Dole Food Company Inc Customization Scope Customization for segments, region/country-level will be provided. Moreover, additional customization can be done based on the requirements. Purchase Options We have three licenses to opt for: Single User License, Multi-User License (Up to 5 Users), Corporate Use License (Unlimited User and Printable PDF) -
- 1. Executive Summary
- 1.1. Definition
- 1.2. Taxonomy
- 1.3. Research Scope
- 1.4. Key Analysis
- 1.5. Key Findings by Major Segments
- 1.6. Top strategies by Major Players
- 2. Global Canned Food Market Overview
- 2.1. Canned Food Market Dynamics
- 2.1.1. Drivers
- 2.1.2. Opportunities
- 2.1.3. Restraints
- 2.1.4. Challenges
- 2.2. Macro-economic Factors
- 2.3. Regulatory Framework
- 2.4. Market Investment Feasibility Index
- 2.5. PEST Analysis
- 2.6. PORTER’S Five Force Analysis
- 2.7. Drivers & Restraints Impact Analysis
- 2.8. Industry Chain Analysis
- 2.9. Cost Structure Analysis
- 2.10. Marketing Strategy
- 2.11. Russia-Ukraine War Impact Analysis
- 2.12. Opportunity Map Analysis
- 2.13. Market Competition Scenario Analysis
- 2.14. Product Life Cycle Analysis
- 2.15. Opportunity Orbits
- 2.16. Manufacturer Intensity Map
- 2.17. Major Companies sales by Value & Volume
- 2.1. Canned Food Market Dynamics
- 3. Global Canned Food Market Analysis, Opportunity and Forecast, 2016-2032
- 3.1. Global Canned Food Market Analysis, 2016-2021
- 3.2. Global Canned Food Market Opportunity and Forecast, 2023-2032
- 3.3. Global Canned Food Market Analysis, Opportunity and Forecast, By Product Type, 2016-2032
- 3.3.1. Global Canned Food Market Analysis by Product Type: Introduction
- 3.3.2. Market Size Absolute $ Opportunity Analysis and Forecast, By Product Type, 2016-2032
- 3.3.3. Canned seafood
- 3.3.4. Canned vegetables and fruits
- 3.3.5. Canned meat products
- 3.3.6. Canned ready meals
- 3.4. Global Canned Food Market Analysis, Opportunity and Forecast, By Type, 2016-2032
- 3.4.1. Global Canned Food Market Analysis by Type: Introduction
- 3.4.2. Market Size Absolute $ Opportunity Analysis and Forecast, By Type, 2016-2032
- 3.4.3. Organic
- 3.4.4. Conventional
- 3.5. Global Canned Food Market Analysis, Opportunity and Forecast, By Distribution Channel, 2016-2032
- 3.5.1. Global Canned Food Market Analysis by Distribution Channel: Introduction
- 3.5.2. Market Size Absolute $ Opportunity Analysis and Forecast, By Distribution Channel, 2016-2032
- 3.5.3. Supermarkets and Hypermarkets
- 3.5.4. Independent retailers
- 3.5.5. Convenience stores
- 3.5.6. E-commerce or Online Retail Channels
- 3.5.7. Others
- 4. North America Canned Food Market Analysis, Opportunity and Forecast, 2016-2032
- 4.1. North America Canned Food Market Analysis, 2016-2021
- 4.2. North America Canned Food Market Opportunity and Forecast, 2023-2032
- 4.3. North America Canned Food Market Analysis, Opportunity and Forecast, By Product Type, 2016-2032
- 4.3.1. North America Canned Food Market Analysis by Product Type: Introduction
- 4.3.2. Market Size Absolute $ Opportunity Analysis and Forecast, By Product Type, 2016-2032
- 4.3.3. Canned seafood
- 4.3.4. Canned vegetables and fruits
- 4.3.5. Canned meat products
- 4.3.6. Canned ready meals
- 4.4. North America Canned Food Market Analysis, Opportunity and Forecast, By Type, 2016-2032
- 4.4.1. North America Canned Food Market Analysis by Type: Introduction
- 4.4.2. Market Size Absolute $ Opportunity Analysis and Forecast, By Type, 2016-2032
- 4.4.3. Organic
- 4.4.4. Conventional
- 4.5. North America Canned Food Market Analysis, Opportunity and Forecast, By Distribution Channel, 2016-2032
- 4.5.1. North America Canned Food Market Analysis by Distribution Channel: Introduction
- 4.5.2. Market Size Absolute $ Opportunity Analysis and Forecast, By Distribution Channel, 2016-2032
- 4.5.3. Supermarkets and Hypermarkets
- 4.5.4. Independent retailers
- 4.5.5. Convenience stores
- 4.5.6. E-commerce or Online Retail Channels
- 4.5.7. Others
- 4.6. North America Canned Food Market Analysis, Opportunity and Forecast, By Country , 2016-2032
- 4.6.1. North America Canned Food Market Analysis by Country : Introduction
- 4.6.2. Market Size Absolute $ Opportunity Analysis and Forecast, Country , 2016-2032
- 4.6.2.1. The US
- 4.6.2.2. Canada
- 4.6.2.3. Mexico
- 5. Western Europe Canned Food Market Analysis, Opportunity and Forecast, 2016-2032
- 5.1. Western Europe Canned Food Market Analysis, 2016-2021
- 5.2. Western Europe Canned Food Market Opportunity and Forecast, 2023-2032
- 5.3. Western Europe Canned Food Market Analysis, Opportunity and Forecast, By Product Type, 2016-2032
- 5.3.1. Western Europe Canned Food Market Analysis by Product Type: Introduction
- 5.3.2. Market Size Absolute $ Opportunity Analysis and Forecast, By Product Type, 2016-2032
- 5.3.3. Canned seafood
- 5.3.4. Canned vegetables and fruits
- 5.3.5. Canned meat products
- 5.3.6. Canned ready meals
- 5.4. Western Europe Canned Food Market Analysis, Opportunity and Forecast, By Type, 2016-2032
- 5.4.1. Western Europe Canned Food Market Analysis by Type: Introduction
- 5.4.2. Market Size Absolute $ Opportunity Analysis and Forecast, By Type, 2016-2032
- 5.4.3. Organic
- 5.4.4. Conventional
- 5.5. Western Europe Canned Food Market Analysis, Opportunity and Forecast, By Distribution Channel, 2016-2032
- 5.5.1. Western Europe Canned Food Market Analysis by Distribution Channel: Introduction
- 5.5.2. Market Size Absolute $ Opportunity Analysis and Forecast, By Distribution Channel, 2016-2032
- 5.5.3. Supermarkets and Hypermarkets
- 5.5.4. Independent retailers
- 5.5.5. Convenience stores
- 5.5.6. E-commerce or Online Retail Channels
- 5.5.7. Others
- 5.6. Western Europe Canned Food Market Analysis, Opportunity and Forecast, By Country , 2016-2032
- 5.6.1. Western Europe Canned Food Market Analysis by Country : Introduction
- 5.6.2. Market Size Absolute $ Opportunity Analysis and Forecast, Country , 2016-2032
- 5.6.2.1. Germany
- 5.6.2.2. France
- 5.6.2.3. The UK
- 5.6.2.4. Spain
- 5.6.2.5. Italy
- 5.6.2.6. Portugal
- 5.6.2.7. Ireland
- 5.6.2.8. Austria
- 5.6.2.9. Switzerland
- 5.6.2.10. Benelux
- 5.6.2.11. Nordic
- 5.6.2.12. Rest of Western Europe
- 6. Eastern Europe Canned Food Market Analysis, Opportunity and Forecast, 2016-2032
- 6.1. Eastern Europe Canned Food Market Analysis, 2016-2021
- 6.2. Eastern Europe Canned Food Market Opportunity and Forecast, 2023-2032
- 6.3. Eastern Europe Canned Food Market Analysis, Opportunity and Forecast, By Product Type, 2016-2032
- 6.3.1. Eastern Europe Canned Food Market Analysis by Product Type: Introduction
- 6.3.2. Market Size Absolute $ Opportunity Analysis and Forecast, By Product Type, 2016-2032
- 6.3.3. Canned seafood
- 6.3.4. Canned vegetables and fruits
- 6.3.5. Canned meat products
- 6.3.6. Canned ready meals
- 6.4. Eastern Europe Canned Food Market Analysis, Opportunity and Forecast, By Type, 2016-2032
- 6.4.1. Eastern Europe Canned Food Market Analysis by Type: Introduction
- 6.4.2. Market Size Absolute $ Opportunity Analysis and Forecast, By Type, 2016-2032
- 6.4.3. Organic
- 6.4.4. Conventional
- 6.5. Eastern Europe Canned Food Market Analysis, Opportunity and Forecast, By Distribution Channel, 2016-2032
- 6.5.1. Eastern Europe Canned Food Market Analysis by Distribution Channel: Introduction
- 6.5.2. Market Size Absolute $ Opportunity Analysis and Forecast, By Distribution Channel, 2016-2032
- 6.5.3. Supermarkets and Hypermarkets
- 6.5.4. Independent retailers
- 6.5.5. Convenience stores
- 6.5.6. E-commerce or Online Retail Channels
- 6.5.7. Others
- 6.6. Eastern Europe Canned Food Market Analysis, Opportunity and Forecast, By Country , 2016-2032
- 6.6.1. Eastern Europe Canned Food Market Analysis by Country : Introduction
- 6.6.2. Market Size Absolute $ Opportunity Analysis and Forecast, Country , 2016-2032
- 6.6.2.1. Russia
- 6.6.2.2. Poland
- 6.6.2.3. The Czech Republic
- 6.6.2.4. Greece
- 6.6.2.5. Rest of Eastern Europe
- 7. APAC Canned Food Market Analysis, Opportunity and Forecast, 2016-2032
- 7.1. APAC Canned Food Market Analysis, 2016-2021
- 7.2. APAC Canned Food Market Opportunity and Forecast, 2023-2032
- 7.3. APAC Canned Food Market Analysis, Opportunity and Forecast, By Product Type, 2016-2032
- 7.3.1. APAC Canned Food Market Analysis by Product Type: Introduction
- 7.3.2. Market Size Absolute $ Opportunity Analysis and Forecast, By Product Type, 2016-2032
- 7.3.3. Canned seafood
- 7.3.4. Canned vegetables and fruits
- 7.3.5. Canned meat products
- 7.3.6. Canned ready meals
- 7.4. APAC Canned Food Market Analysis, Opportunity and Forecast, By Type, 2016-2032
- 7.4.1. APAC Canned Food Market Analysis by Type: Introduction
- 7.4.2. Market Size Absolute $ Opportunity Analysis and Forecast, By Type, 2016-2032
- 7.4.3. Organic
- 7.4.4. Conventional
- 7.5. APAC Canned Food Market Analysis, Opportunity and Forecast, By Distribution Channel, 2016-2032
- 7.5.1. APAC Canned Food Market Analysis by Distribution Channel: Introduction
- 7.5.2. Market Size Absolute $ Opportunity Analysis and Forecast, By Distribution Channel, 2016-2032
- 7.5.3. Supermarkets and Hypermarkets
- 7.5.4. Independent retailers
- 7.5.5. Convenience stores
- 7.5.6. E-commerce or Online Retail Channels
- 7.5.7. Others
- 7.6. APAC Canned Food Market Analysis, Opportunity and Forecast, By Country , 2016-2032
- 7.6.1. APAC Canned Food Market Analysis by Country : Introduction
- 7.6.2. Market Size Absolute $ Opportunity Analysis and Forecast, Country , 2016-2032
- 7.6.2.1. China
- 7.6.2.2. Japan
- 7.6.2.3. South Korea
- 7.6.2.4. India
- 7.6.2.5. Australia & New Zeland
- 7.6.2.6. Indonesia
- 7.6.2.7. Malaysia
- 7.6.2.8. Philippines
- 7.6.2.9. Singapore
- 7.6.2.10. Thailand
- 7.6.2.11. Vietnam
- 7.6.2.12. Rest of APAC
- 8. Latin America Canned Food Market Analysis, Opportunity and Forecast, 2016-2032
- 8.1. Latin America Canned Food Market Analysis, 2016-2021
- 8.2. Latin America Canned Food Market Opportunity and Forecast, 2023-2032
- 8.3. Latin America Canned Food Market Analysis, Opportunity and Forecast, By Product Type, 2016-2032
- 8.3.1. Latin America Canned Food Market Analysis by Product Type: Introduction
- 8.3.2. Market Size Absolute $ Opportunity Analysis and Forecast, By Product Type, 2016-2032
- 8.3.3. Canned seafood
- 8.3.4. Canned vegetables and fruits
- 8.3.5. Canned meat products
- 8.3.6. Canned ready meals
- 8.4. Latin America Canned Food Market Analysis, Opportunity and Forecast, By Type, 2016-2032
- 8.4.1. Latin America Canned Food Market Analysis by Type: Introduction
- 8.4.2. Market Size Absolute $ Opportunity Analysis and Forecast, By Type, 2016-2032
- 8.4.3. Organic
- 8.4.4. Conventional
- 8.5. Latin America Canned Food Market Analysis, Opportunity and Forecast, By Distribution Channel, 2016-2032
- 8.5.1. Latin America Canned Food Market Analysis by Distribution Channel: Introduction
- 8.5.2. Market Size Absolute $ Opportunity Analysis and Forecast, By Distribution Channel, 2016-2032
- 8.5.3. Supermarkets and Hypermarkets
- 8.5.4. Independent retailers
- 8.5.5. Convenience stores
- 8.5.6. E-commerce or Online Retail Channels
- 8.5.7. Others
- 8.6. Latin America Canned Food Market Analysis, Opportunity and Forecast, By Country , 2016-2032
- 8.6.1. Latin America Canned Food Market Analysis by Country : Introduction
- 8.6.2. Market Size Absolute $ Opportunity Analysis and Forecast, Country , 2016-2032
- 8.6.2.1. Brazil
- 8.6.2.2. Colombia
- 8.6.2.3. Chile
- 8.6.2.4. Argentina
- 8.6.2.5. Costa Rica
- 8.6.2.6. Rest of Latin America
- 9. Middle East & Africa Canned Food Market Analysis, Opportunity and Forecast, 2016-2032
- 9.1. Middle East & Africa Canned Food Market Analysis, 2016-2021
- 9.2. Middle East & Africa Canned Food Market Opportunity and Forecast, 2023-2032
- 9.3. Middle East & Africa Canned Food Market Analysis, Opportunity and Forecast, By Product Type, 2016-2032
- 9.3.1. Middle East & Africa Canned Food Market Analysis by Product Type: Introduction
- 9.3.2. Market Size Absolute $ Opportunity Analysis and Forecast, By Product Type, 2016-2032
- 9.3.3. Canned seafood
- 9.3.4. Canned vegetables and fruits
- 9.3.5. Canned meat products
- 9.3.6. Canned ready meals
- 9.4. Middle East & Africa Canned Food Market Analysis, Opportunity and Forecast, By Type, 2016-2032
- 9.4.1. Middle East & Africa Canned Food Market Analysis by Type: Introduction
- 9.4.2. Market Size Absolute $ Opportunity Analysis and Forecast, By Type, 2016-2032
- 9.4.3. Organic
- 9.4.4. Conventional
- 9.5. Middle East & Africa Canned Food Market Analysis, Opportunity and Forecast, By Distribution Channel, 2016-2032
- 9.5.1. Middle East & Africa Canned Food Market Analysis by Distribution Channel: Introduction
- 9.5.2. Market Size Absolute $ Opportunity Analysis and Forecast, By Distribution Channel, 2016-2032
- 9.5.3. Supermarkets and Hypermarkets
- 9.5.4. Independent retailers
- 9.5.5. Convenience stores
- 9.5.6. E-commerce or Online Retail Channels
- 9.5.7. Others
- 9.6. Middle East & Africa Canned Food Market Analysis, Opportunity and Forecast, By Country , 2016-2032
- 9.6.1. Middle East & Africa Canned Food Market Analysis by Country : Introduction
- 9.6.2. Market Size Absolute $ Opportunity Analysis and Forecast, Country , 2016-2032
- 9.6.2.1. Algeria
- 9.6.2.2. Egypt
- 9.6.2.3. Israel
- 9.6.2.4. Kuwait
- 9.6.2.5. Nigeria
- 9.6.2.6. Saudi Arabia
- 9.6.2.7. South Africa
- 9.6.2.8. Turkey
- 9.6.2.9. The UAE
- 9.6.2.10. Rest of MEA
- 10. Global Canned Food Market Analysis, Opportunity and Forecast, By Region , 2016-2032
- 10.1. Global Canned Food Market Analysis by Region : Introduction
- 10.2. Market Size Absolute $ Opportunity Analysis and Forecast, By Region , 2016-2032
- 10.2.1. North America
- 10.2.2. Western Europe
- 10.2.3. Eastern Europe
- 10.2.4. APAC
- 10.2.5. Latin America
- 10.2.6. Middle East & Africa
- 11. Global Canned Food Market Competitive Landscape, Market Share Analysis, and Company Profiles
- 11.1. Market Share Analysis
- 11.2. Company Profiles
- 11.3. Bolton Group Srl
- 11.3.1. Company Overview
- 11.3.2. Financial Highlights
- 11.3.3. Product Portfolio
- 11.3.4. SWOT Analysis
- 11.3.5. Key Strategies and Developments
- 11.4. ConAgra Brands Inc
- 11.4.1. Company Overview
- 11.4.2. Financial Highlights
- 11.4.3. Product Portfolio
- 11.4.4. SWOT Analysis
- 11.4.5. Key Strategies and Developments
- 11.5. Del Monte Foods, Inc.
- 11.5.1. Company Overview
- 11.5.2. Financial Highlights
- 11.5.3. Product Portfolio
- 11.5.4. SWOT Analysis
- 11.5.5. Key Strategies and Developments
- 11.6. The Kraft Heinz Company
- 11.6.1. Company Overview
- 11.6.2. Financial Highlights
- 11.6.3. Product Portfolio
- 11.6.4. SWOT Analysis
- 11.6.5. Key Strategies and Developments
- 11.7. H.J. Heinz Company, L.P.
- 11.7.1. Company Overview
- 11.7.2. Financial Highlights
- 11.7.3. Product Portfolio
- 11.7.4. SWOT Analysis
- 11.7.5. Key Strategies and Developments
- 11.8. Pinnacle Foods, Inc.
- 11.8.1. Company Overview
- 11.8.2. Financial Highlights
- 11.8.3. Product Portfolio
- 11.8.4. SWOT Analysis
- 11.8.5. Key Strategies and Developments
- 11.9. Hormel Foods Corporation.
- 11.9.1. Company Overview
- 11.9.2. Financial Highlights
- 11.9.3. Product Portfolio
- 11.9.4. SWOT Analysis
- 11.9.5. Key Strategies and Developments
- 11.10. General Mills, Inc.
- 11.10.1. Company Overview
- 11.10.2. Financial Highlights
- 11.10.3. Product Portfolio
- 11.10.4. SWOT Analysis
- 11.10.5. Key Strategies and Developments
- 11.11. Kellogg Co.
- 11.11.1. Company Overview
- 11.11.2. Financial Highlights
- 11.11.3. Product Portfolio
- 11.11.4. SWOT Analysis
- 11.11.5. Key Strategies and Developments
- 11.12. Campbell Soup Company
- 11.12.1. Company Overview
- 11.12.2. Financial Highlights
- 11.12.3. Product Portfolio
- 11.12.4. SWOT Analysis
- 11.12.5. Key Strategies and Developments
- 11.13.1. Company Overview
- 11.13.2. Financial Highlights
- 11.13.3. Product Portfolio
- 11.13.4. SWOT Analysis
- 11.13.5. Key Strategies and Developments
- 11.14. Nestlé S.A.
- 11.14.1. Company Overview
- 11.14.2. Financial Highlights
- 11.14.3. Product Portfolio
- 11.14.4. SWOT Analysis
- 11.14.5. Key Strategies and Developments
- 11.15. CHB Group
- 11.15.1. Company Overview
- 11.15.2. Financial Highlights
- 11.15.3. Product Portfolio
- 11.15.4. SWOT Analysis
- 11.15.5. Key Strategies and Developments
- 11.16. AYAM
- 11.16.1. Company Overview
- 11.16.2. Financial Highlights
- 11.16.3. Product Portfolio
- 11.16.4. SWOT Analysis
- 11.16.5. Key Strategies and Developments
- 11.17. Danish Crown Amba
- 11.17.1. Company Overview
- 11.17.2. Financial Highlights
- 11.17.3. Product Portfolio
- 11.17.4. SWOT Analysis
- 11.17.5. Key Strategies and Developments
- 11.18. Dole Food Company Inc
- 11.18.1. Company Overview
- 11.18.2. Financial Highlights
- 11.18.3. Product Portfolio
- 11.18.4. SWOT Analysis
- 11.18.5. Key Strategies and Developments
- 11.19. Other Key Players
- 11.19.1. Company Overview
- 11.19.2. Financial Highlights
- 11.19.3. Product Portfolio
- 11.19.4. SWOT Analysis
- 11.19.5. Key Strategies and Developments
- 12. Assumptions and Acronyms
- 13. Research Methodology
- 14. Contact
- List of Figures
- Figure 1: Global Canned Food Market Revenue (US$ Mn) Market Share by Product Type in 2022
- Figure 2: Global Canned Food Market Market Attractiveness Analysis by Product Type, 2016-2032
- Figure 3: Global Canned Food Market Revenue (US$ Mn) Market Share by Typein 2022
- Figure 4: Global Canned Food Market Market Attractiveness Analysis by Type, 2016-2032
- Figure 5: Global Canned Food Market Revenue (US$ Mn) Market Share by Distribution Channelin 2022
- Figure 6: Global Canned Food Market Market Attractiveness Analysis by Distribution Channel, 2016-2032
- Figure 7: Global Canned Food Market Revenue (US$ Mn) Market Share by Region in 2022
- Figure 8: Global Canned Food Market Market Attractiveness Analysis by Region, 2016-2032
- Figure 9: Global Canned Food Market Market Revenue (US$ Mn) (2016-2032)
- Figure 10: Global Canned Food Market Market Revenue (US$ Mn) Comparison by Region (2016-2032)
- Figure 11: Global Canned Food Market Market Revenue (US$ Mn) Comparison by Product Type (2016-2032)
- Figure 12: Global Canned Food Market Market Revenue (US$ Mn) Comparison by Type (2016-2032)
- Figure 13: Global Canned Food Market Market Revenue (US$ Mn) Comparison by Distribution Channel (2016-2032)
- Figure 14: Global Canned Food Market Market Y-o-Y Growth Rate Comparison by Region (2016-2032)
- Figure 15: Global Canned Food Market Market Y-o-Y Growth Rate Comparison by Product Type (2016-2032)
- Figure 16: Global Canned Food Market Market Y-o-Y Growth Rate Comparison by Type (2016-2032)
- Figure 17: Global Canned Food Market Market Y-o-Y Growth Rate Comparison by Distribution Channel (2016-2032)
- Figure 18: Global Canned Food Market Market Share Comparison by Region (2016-2032)
- Figure 19: Global Canned Food Market Market Share Comparison by Product Type (2016-2032)
- Figure 20: Global Canned Food Market Market Share Comparison by Type (2016-2032)
- Figure 21: Global Canned Food Market Market Share Comparison by Distribution Channel (2016-2032)
- Figure 22: North America Canned Food Market Revenue (US$ Mn) Market Share by Product Typein 2022
- Figure 23: North America Canned Food Market Market Attractiveness Analysis by Product Type, 2016-2032
- Figure 24: North America Canned Food Market Revenue (US$ Mn) Market Share by Typein 2022
- Figure 25: North America Canned Food Market Market Attractiveness Analysis by Type, 2016-2032
- Figure 26: North America Canned Food Market Revenue (US$ Mn) Market Share by Distribution Channelin 2022
- Figure 27: North America Canned Food Market Market Attractiveness Analysis by Distribution Channel, 2016-2032
- Figure 28: North America Canned Food Market Revenue (US$ Mn) Market Share by Country in 2022
- Figure 29: North America Canned Food Market Market Attractiveness Analysis by Country, 2016-2032
- Figure 30: North America Canned Food Market Market Revenue (US$ Mn) (2016-2032)
- Figure 31: North America Canned Food Market Market Revenue (US$ Mn) Comparison by Country (2016-2032)
- Figure 32: North America Canned Food Market Market Revenue (US$ Mn) Comparison by Product Type (2016-2032)
- Figure 33: North America Canned Food Market Market Revenue (US$ Mn) Comparison by Type (2016-2032)
- Figure 34: North America Canned Food Market Market Revenue (US$ Mn) Comparison by Distribution Channel (2016-2032)
- Figure 35: North America Canned Food Market Market Y-o-Y Growth Rate Comparison by Country (2016-2032)
- Figure 36: North America Canned Food Market Market Y-o-Y Growth Rate Comparison by Product Type (2016-2032)
- Figure 37: North America Canned Food Market Market Y-o-Y Growth Rate Comparison by Type (2016-2032)
- Figure 38: North America Canned Food Market Market Y-o-Y Growth Rate Comparison by Distribution Channel (2016-2032)
- Figure 39: North America Canned Food Market Market Share Comparison by Country (2016-2032)
- Figure 40: North America Canned Food Market Market Share Comparison by Product Type (2016-2032)
- Figure 41: North America Canned Food Market Market Share Comparison by Type (2016-2032)
- Figure 42: North America Canned Food Market Market Share Comparison by Distribution Channel (2016-2032)
- Figure 43: Western Europe Canned Food Market Revenue (US$ Mn) Market Share by Product Typein 2022
- Figure 44: Western Europe Canned Food Market Market Attractiveness Analysis by Product Type, 2016-2032
- Figure 45: Western Europe Canned Food Market Revenue (US$ Mn) Market Share by Typein 2022
- Figure 46: Western Europe Canned Food Market Market Attractiveness Analysis by Type, 2016-2032
- Figure 47: Western Europe Canned Food Market Revenue (US$ Mn) Market Share by Distribution Channelin 2022
- Figure 48: Western Europe Canned Food Market Market Attractiveness Analysis by Distribution Channel, 2016-2032
- Figure 49: Western Europe Canned Food Market Revenue (US$ Mn) Market Share by Country in 2022
- Figure 50: Western Europe Canned Food Market Market Attractiveness Analysis by Country, 2016-2032
- Figure 51: Western Europe Canned Food Market Market Revenue (US$ Mn) (2016-2032)
- Figure 52: Western Europe Canned Food Market Market Revenue (US$ Mn) Comparison by Country (2016-2032)
- Figure 53: Western Europe Canned Food Market Market Revenue (US$ Mn) Comparison by Product Type (2016-2032)
- Figure 54: Western Europe Canned Food Market Market Revenue (US$ Mn) Comparison by Type (2016-2032)
- Figure 55: Western Europe Canned Food Market Market Revenue (US$ Mn) Comparison by Distribution Channel (2016-2032)
- Figure 56: Western Europe Canned Food Market Market Y-o-Y Growth Rate Comparison by Country (2016-2032)
- Figure 57: Western Europe Canned Food Market Market Y-o-Y Growth Rate Comparison by Product Type (2016-2032)
- Figure 58: Western Europe Canned Food Market Market Y-o-Y Growth Rate Comparison by Type (2016-2032)
- Figure 59: Western Europe Canned Food Market Market Y-o-Y Growth Rate Comparison by Distribution Channel (2016-2032)
- Figure 60: Western Europe Canned Food Market Market Share Comparison by Country (2016-2032)
- Figure 61: Western Europe Canned Food Market Market Share Comparison by Product Type (2016-2032)
- Figure 62: Western Europe Canned Food Market Market Share Comparison by Type (2016-2032)
- Figure 63: Western Europe Canned Food Market Market Share Comparison by Distribution Channel (2016-2032)
- Figure 64: Eastern Europe Canned Food Market Revenue (US$ Mn) Market Share by Product Typein 2022
- Figure 65: Eastern Europe Canned Food Market Market Attractiveness Analysis by Product Type, 2016-2032
- Figure 66: Eastern Europe Canned Food Market Revenue (US$ Mn) Market Share by Typein 2022
- Figure 67: Eastern Europe Canned Food Market Market Attractiveness Analysis by Type, 2016-2032
- Figure 68: Eastern Europe Canned Food Market Revenue (US$ Mn) Market Share by Distribution Channelin 2022
- Figure 69: Eastern Europe Canned Food Market Market Attractiveness Analysis by Distribution Channel, 2016-2032
- Figure 70: Eastern Europe Canned Food Market Revenue (US$ Mn) Market Share by Country in 2022
- Figure 71: Eastern Europe Canned Food Market Market Attractiveness Analysis by Country, 2016-2032
- Figure 72: Eastern Europe Canned Food Market Market Revenue (US$ Mn) (2016-2032)
- Figure 73: Eastern Europe Canned Food Market Market Revenue (US$ Mn) Comparison by Country (2016-2032)
- Figure 74: Eastern Europe Canned Food Market Market Revenue (US$ Mn) Comparison by Product Type (2016-2032)
- Figure 75: Eastern Europe Canned Food Market Market Revenue (US$ Mn) Comparison by Type (2016-2032)
- Figure 76: Eastern Europe Canned Food Market Market Revenue (US$ Mn) Comparison by Distribution Channel (2016-2032)
- Figure 77: Eastern Europe Canned Food Market Market Y-o-Y Growth Rate Comparison by Country (2016-2032)
- Figure 78: Eastern Europe Canned Food Market Market Y-o-Y Growth Rate Comparison by Product Type (2016-2032)
- Figure 79: Eastern Europe Canned Food Market Market Y-o-Y Growth Rate Comparison by Type (2016-2032)
- Figure 80: Eastern Europe Canned Food Market Market Y-o-Y Growth Rate Comparison by Distribution Channel (2016-2032)
- Figure 81: Eastern Europe Canned Food Market Market Share Comparison by Country (2016-2032)
- Figure 82: Eastern Europe Canned Food Market Market Share Comparison by Product Type (2016-2032)
- Figure 83: Eastern Europe Canned Food Market Market Share Comparison by Type (2016-2032)
- Figure 84: Eastern Europe Canned Food Market Market Share Comparison by Distribution Channel (2016-2032)
- Figure 85: APAC Canned Food Market Revenue (US$ Mn) Market Share by Product Typein 2022
- Figure 86: APAC Canned Food Market Market Attractiveness Analysis by Product Type, 2016-2032
- Figure 87: APAC Canned Food Market Revenue (US$ Mn) Market Share by Typein 2022
- Figure 88: APAC Canned Food Market Market Attractiveness Analysis by Type, 2016-2032
- Figure 89: APAC Canned Food Market Revenue (US$ Mn) Market Share by Distribution Channelin 2022
- Figure 90: APAC Canned Food Market Market Attractiveness Analysis by Distribution Channel, 2016-2032
- Figure 91: APAC Canned Food Market Revenue (US$ Mn) Market Share by Country in 2022
- Figure 92: APAC Canned Food Market Market Attractiveness Analysis by Country, 2016-2032
- Figure 93: APAC Canned Food Market Market Revenue (US$ Mn) (2016-2032)
- Figure 94: APAC Canned Food Market Market Revenue (US$ Mn) Comparison by Country (2016-2032)
- Figure 95: APAC Canned Food Market Market Revenue (US$ Mn) Comparison by Product Type (2016-2032)
- Figure 96: APAC Canned Food Market Market Revenue (US$ Mn) Comparison by Type (2016-2032)
- Figure 97: APAC Canned Food Market Market Revenue (US$ Mn) Comparison by Distribution Channel (2016-2032)
- Figure 98: APAC Canned Food Market Market Y-o-Y Growth Rate Comparison by Country (2016-2032)
- Figure 99: APAC Canned Food Market Market Y-o-Y Growth Rate Comparison by Product Type (2016-2032)
- Figure 100: APAC Canned Food Market Market Y-o-Y Growth Rate Comparison by Type (2016-2032)
- Figure 101: APAC Canned Food Market Market Y-o-Y Growth Rate Comparison by Distribution Channel (2016-2032)
- Figure 102: APAC Canned Food Market Market Share Comparison by Country (2016-2032)
- Figure 103: APAC Canned Food Market Market Share Comparison by Product Type (2016-2032)
- Figure 104: APAC Canned Food Market Market Share Comparison by Type (2016-2032)
- Figure 105: APAC Canned Food Market Market Share Comparison by Distribution Channel (2016-2032)
- Figure 106: Latin America Canned Food Market Revenue (US$ Mn) Market Share by Product Typein 2022
- Figure 107: Latin America Canned Food Market Market Attractiveness Analysis by Product Type, 2016-2032
- Figure 108: Latin America Canned Food Market Revenue (US$ Mn) Market Share by Typein 2022
- Figure 109: Latin America Canned Food Market Market Attractiveness Analysis by Type, 2016-2032
- Figure 110: Latin America Canned Food Market Revenue (US$ Mn) Market Share by Distribution Channelin 2022
- Figure 111: Latin America Canned Food Market Market Attractiveness Analysis by Distribution Channel, 2016-2032
- Figure 112: Latin America Canned Food Market Revenue (US$ Mn) Market Share by Country in 2022
- Figure 113: Latin America Canned Food Market Market Attractiveness Analysis by Country, 2016-2032
- Figure 114: Latin America Canned Food Market Market Revenue (US$ Mn) (2016-2032)
- Figure 115: Latin America Canned Food Market Market Revenue (US$ Mn) Comparison by Country (2016-2032)
- Figure 116: Latin America Canned Food Market Market Revenue (US$ Mn) Comparison by Product Type (2016-2032)
- Figure 117: Latin America Canned Food Market Market Revenue (US$ Mn) Comparison by Type (2016-2032)
- Figure 118: Latin America Canned Food Market Market Revenue (US$ Mn) Comparison by Distribution Channel (2016-2032)
- Figure 119: Latin America Canned Food Market Market Y-o-Y Growth Rate Comparison by Country (2016-2032)
- Figure 120: Latin America Canned Food Market Market Y-o-Y Growth Rate Comparison by Product Type (2016-2032)
- Figure 121: Latin America Canned Food Market Market Y-o-Y Growth Rate Comparison by Type (2016-2032)
- Figure 122: Latin America Canned Food Market Market Y-o-Y Growth Rate Comparison by Distribution Channel (2016-2032)
- Figure 123: Latin America Canned Food Market Market Share Comparison by Country (2016-2032)
- Figure 124: Latin America Canned Food Market Market Share Comparison by Product Type (2016-2032)
- Figure 125: Latin America Canned Food Market Market Share Comparison by Type (2016-2032)
- Figure 126: Latin America Canned Food Market Market Share Comparison by Distribution Channel (2016-2032)
- Figure 127: Middle East & Africa Canned Food Market Revenue (US$ Mn) Market Share by Product Typein 2022
- Figure 128: Middle East & Africa Canned Food Market Market Attractiveness Analysis by Product Type, 2016-2032
- Figure 129: Middle East & Africa Canned Food Market Revenue (US$ Mn) Market Share by Typein 2022
- Figure 130: Middle East & Africa Canned Food Market Market Attractiveness Analysis by Type, 2016-2032
- Figure 131: Middle East & Africa Canned Food Market Revenue (US$ Mn) Market Share by Distribution Channelin 2022
- Figure 132: Middle East & Africa Canned Food Market Market Attractiveness Analysis by Distribution Channel, 2016-2032
- Figure 133: Middle East & Africa Canned Food Market Revenue (US$ Mn) Market Share by Country in 2022
- Figure 134: Middle East & Africa Canned Food Market Market Attractiveness Analysis by Country, 2016-2032
- Figure 135: Middle East & Africa Canned Food Market Market Revenue (US$ Mn) (2016-2032)
- Figure 136: Middle East & Africa Canned Food Market Market Revenue (US$ Mn) Comparison by Country (2016-2032)
- Figure 137: Middle East & Africa Canned Food Market Market Revenue (US$ Mn) Comparison by Product Type (2016-2032)
- Figure 138: Middle East & Africa Canned Food Market Market Revenue (US$ Mn) Comparison by Type (2016-2032)
- Figure 139: Middle East & Africa Canned Food Market Market Revenue (US$ Mn) Comparison by Distribution Channel (2016-2032)
- Figure 140: Middle East & Africa Canned Food Market Market Y-o-Y Growth Rate Comparison by Country (2016-2032)
- Figure 141: Middle East & Africa Canned Food Market Market Y-o-Y Growth Rate Comparison by Product Type (2016-2032)
- Figure 142: Middle East & Africa Canned Food Market Market Y-o-Y Growth Rate Comparison by Type (2016-2032)
- Figure 143: Middle East & Africa Canned Food Market Market Y-o-Y Growth Rate Comparison by Distribution Channel (2016-2032)
- Figure 144: Middle East & Africa Canned Food Market Market Share Comparison by Country (2016-2032)
- Figure 145: Middle East & Africa Canned Food Market Market Share Comparison by Product Type (2016-2032)
- Figure 146: Middle East & Africa Canned Food Market Market Share Comparison by Type (2016-2032)
- Figure 147: Middle East & Africa Canned Food Market Market Share Comparison by Distribution Channel (2016-2032)
- List of Tables
- Table 1: Global Canned Food Market Market Comparison by Product Type (2016-2032)
- Table 2: Global Canned Food Market Market Comparison by Type (2016-2032)
- Table 3: Global Canned Food Market Market Comparison by Distribution Channel (2016-2032)
- Table 4: Global Canned Food Market Revenue (US$ Mn) Comparison by Region (2016-2032)
- Table 5: Global Canned Food Market Market Revenue (US$ Mn) (2016-2032)
- Table 6: Global Canned Food Market Market Revenue (US$ Mn) Comparison by Region (2016-2032)
- Table 7: Global Canned Food Market Market Revenue (US$ Mn) Comparison by Product Type (2016-2032)
- Table 8: Global Canned Food Market Market Revenue (US$ Mn) Comparison by Type (2016-2032)
- Table 9: Global Canned Food Market Market Revenue (US$ Mn) Comparison by Distribution Channel (2016-2032)
- Table 10: Global Canned Food Market Market Y-o-Y Growth Rate Comparison by Region (2016-2032)
- Table 11: Global Canned Food Market Market Y-o-Y Growth Rate Comparison by Product Type (2016-2032)
- Table 12: Global Canned Food Market Market Y-o-Y Growth Rate Comparison by Type (2016-2032)
- Table 13: Global Canned Food Market Market Y-o-Y Growth Rate Comparison by Distribution Channel (2016-2032)
- Table 14: Global Canned Food Market Market Share Comparison by Region (2016-2032)
- Table 15: Global Canned Food Market Market Share Comparison by Product Type (2016-2032)
- Table 16: Global Canned Food Market Market Share Comparison by Type (2016-2032)
- Table 17: Global Canned Food Market Market Share Comparison by Distribution Channel (2016-2032)
- Table 18: North America Canned Food Market Market Comparison by Type (2016-2032)
- Table 19: North America Canned Food Market Market Comparison by Distribution Channel (2016-2032)
- Table 20: North America Canned Food Market Revenue (US$ Mn) Comparison by Country (2016-2032)
- Table 21: North America Canned Food Market Market Revenue (US$ Mn) (2016-2032)
- Table 22: North America Canned Food Market Market Revenue (US$ Mn) Comparison by Country (2016-2032)
- Table 23: North America Canned Food Market Market Revenue (US$ Mn) Comparison by Product Type (2016-2032)
- Table 24: North America Canned Food Market Market Revenue (US$ Mn) Comparison by Type (2016-2032)
- Table 25: North America Canned Food Market Market Revenue (US$ Mn) Comparison by Distribution Channel (2016-2032)
- Table 26: North America Canned Food Market Market Y-o-Y Growth Rate Comparison by Country (2016-2032)
- Table 27: North America Canned Food Market Market Y-o-Y Growth Rate Comparison by Product Type (2016-2032)
- Table 28: North America Canned Food Market Market Y-o-Y Growth Rate Comparison by Type (2016-2032)
- Table 29: North America Canned Food Market Market Y-o-Y Growth Rate Comparison by Distribution Channel (2016-2032)
- Table 30: North America Canned Food Market Market Share Comparison by Country (2016-2032)
- Table 31: North America Canned Food Market Market Share Comparison by Product Type (2016-2032)
- Table 32: North America Canned Food Market Market Share Comparison by Type (2016-2032)
- Table 33: North America Canned Food Market Market Share Comparison by Distribution Channel (2016-2032)
- Table 34: Western Europe Canned Food Market Market Comparison by Product Type (2016-2032)
- Table 35: Western Europe Canned Food Market Market Comparison by Type (2016-2032)
- Table 36: Western Europe Canned Food Market Market Comparison by Distribution Channel (2016-2032)
- Table 37: Western Europe Canned Food Market Revenue (US$ Mn) Comparison by Country (2016-2032)
- Table 38: Western Europe Canned Food Market Market Revenue (US$ Mn) (2016-2032)
- Table 39: Western Europe Canned Food Market Market Revenue (US$ Mn) Comparison by Country (2016-2032)
- Table 40: Western Europe Canned Food Market Market Revenue (US$ Mn) Comparison by Product Type (2016-2032)
- Table 41: Western Europe Canned Food Market Market Revenue (US$ Mn) Comparison by Type (2016-2032)
- Table 42: Western Europe Canned Food Market Market Revenue (US$ Mn) Comparison by Distribution Channel (2016-2032)
- Table 43: Western Europe Canned Food Market Market Y-o-Y Growth Rate Comparison by Country (2016-2032)
- Table 44: Western Europe Canned Food Market Market Y-o-Y Growth Rate Comparison by Product Type (2016-2032)
- Table 45: Western Europe Canned Food Market Market Y-o-Y Growth Rate Comparison by Type (2016-2032)
- Table 46: Western Europe Canned Food Market Market Y-o-Y Growth Rate Comparison by Distribution Channel (2016-2032)
- Table 47: Western Europe Canned Food Market Market Share Comparison by Country (2016-2032)
- Table 48: Western Europe Canned Food Market Market Share Comparison by Product Type (2016-2032)
- Table 49: Western Europe Canned Food Market Market Share Comparison by Type (2016-2032)
- Table 50: Western Europe Canned Food Market Market Share Comparison by Distribution Channel (2016-2032)
- Table 51: Eastern Europe Canned Food Market Market Comparison by Product Type (2016-2032)
- Table 52: Eastern Europe Canned Food Market Market Comparison by Type (2016-2032)
- Table 53: Eastern Europe Canned Food Market Market Comparison by Distribution Channel (2016-2032)
- Table 54: Eastern Europe Canned Food Market Revenue (US$ Mn) Comparison by Country (2016-2032)
- Table 55: Eastern Europe Canned Food Market Market Revenue (US$ Mn) (2016-2032)
- Table 56: Eastern Europe Canned Food Market Market Revenue (US$ Mn) Comparison by Country (2016-2032)
- Table 57: Eastern Europe Canned Food Market Market Revenue (US$ Mn) Comparison by Product Type (2016-2032)
- Table 58: Eastern Europe Canned Food Market Market Revenue (US$ Mn) Comparison by Type (2016-2032)
- Table 59: Eastern Europe Canned Food Market Market Revenue (US$ Mn) Comparison by Distribution Channel (2016-2032)
- Table 60: Eastern Europe Canned Food Market Market Y-o-Y Growth Rate Comparison by Country (2016-2032)
- Table 61: Eastern Europe Canned Food Market Market Y-o-Y Growth Rate Comparison by Product Type (2016-2032)
- Table 62: Eastern Europe Canned Food Market Market Y-o-Y Growth Rate Comparison by Type (2016-2032)
- Table 63: Eastern Europe Canned Food Market Market Y-o-Y Growth Rate Comparison by Distribution Channel (2016-2032)
- Table 64: Eastern Europe Canned Food Market Market Share Comparison by Country (2016-2032)
- Table 65: Eastern Europe Canned Food Market Market Share Comparison by Product Type (2016-2032)
- Table 66: Eastern Europe Canned Food Market Market Share Comparison by Type (2016-2032)
- Table 67: Eastern Europe Canned Food Market Market Share Comparison by Distribution Channel (2016-2032)
- Table 68: APAC Canned Food Market Market Comparison by Product Type (2016-2032)
- Table 69: APAC Canned Food Market Market Comparison by Type (2016-2032)
- Table 70: APAC Canned Food Market Market Comparison by Distribution Channel (2016-2032)
- Table 71: APAC Canned Food Market Revenue (US$ Mn) Comparison by Country (2016-2032)
- Table 72: APAC Canned Food Market Market Revenue (US$ Mn) (2016-2032)
- Table 73: APAC Canned Food Market Market Revenue (US$ Mn) Comparison by Country (2016-2032)
- Table 74: APAC Canned Food Market Market Revenue (US$ Mn) Comparison by Product Type (2016-2032)
- Table 75: APAC Canned Food Market Market Revenue (US$ Mn) Comparison by Type (2016-2032)
- Table 76: APAC Canned Food Market Market Revenue (US$ Mn) Comparison by Distribution Channel (2016-2032)
- Table 77: APAC Canned Food Market Market Y-o-Y Growth Rate Comparison by Country (2016-2032)
- Table 78: APAC Canned Food Market Market Y-o-Y Growth Rate Comparison by Product Type (2016-2032)
- Table 79: APAC Canned Food Market Market Y-o-Y Growth Rate Comparison by Type (2016-2032)
- Table 80: APAC Canned Food Market Market Y-o-Y Growth Rate Comparison by Distribution Channel (2016-2032)
- Table 81: APAC Canned Food Market Market Share Comparison by Country (2016-2032)
- Table 82: APAC Canned Food Market Market Share Comparison by Product Type (2016-2032)
- Table 83: APAC Canned Food Market Market Share Comparison by Type (2016-2032)
- Table 84: APAC Canned Food Market Market Share Comparison by Distribution Channel (2016-2032)
- Table 85: Latin America Canned Food Market Market Comparison by Product Type (2016-2032)
- Table 86: Latin America Canned Food Market Market Comparison by Type (2016-2032)
- Table 87: Latin America Canned Food Market Market Comparison by Distribution Channel (2016-2032)
- Table 88: Latin America Canned Food Market Revenue (US$ Mn) Comparison by Country (2016-2032)
- Table 89: Latin America Canned Food Market Market Revenue (US$ Mn) (2016-2032)
- Table 90: Latin America Canned Food Market Market Revenue (US$ Mn) Comparison by Country (2016-2032)
- Table 91: Latin America Canned Food Market Market Revenue (US$ Mn) Comparison by Product Type (2016-2032)
- Table 92: Latin America Canned Food Market Market Revenue (US$ Mn) Comparison by Type (2016-2032)
- Table 93: Latin America Canned Food Market Market Revenue (US$ Mn) Comparison by Distribution Channel (2016-2032)
- Table 94: Latin America Canned Food Market Market Y-o-Y Growth Rate Comparison by Country (2016-2032)
- Table 95: Latin America Canned Food Market Market Y-o-Y Growth Rate Comparison by Product Type (2016-2032)
- Table 96: Latin America Canned Food Market Market Y-o-Y Growth Rate Comparison by Type (2016-2032)
- Table 97: Latin America Canned Food Market Market Y-o-Y Growth Rate Comparison by Distribution Channel (2016-2032)
- Table 98: Latin America Canned Food Market Market Share Comparison by Country (2016-2032)
- Table 99: Latin America Canned Food Market Market Share Comparison by Product Type (2016-2032)
- Table 100: Latin America Canned Food Market Market Share Comparison by Type (2016-2032)
- Table 101: Latin America Canned Food Market Market Share Comparison by Distribution Channel (2016-2032)
- Table 102: Middle East & Africa Canned Food Market Market Comparison by Product Type (2016-2032)
- Table 103: Middle East & Africa Canned Food Market Market Comparison by Type (2016-2032)
- Table 104: Middle East & Africa Canned Food Market Market Comparison by Distribution Channel (2016-2032)
- Table 105: Middle East & Africa Canned Food Market Revenue (US$ Mn) Comparison by Country (2016-2032)
- Table 106: Middle East & Africa Canned Food Market Market Revenue (US$ Mn) (2016-2032)
- Table 107: Middle East & Africa Canned Food Market Market Revenue (US$ Mn) Comparison by Country (2016-2032)
- Table 108: Middle East & Africa Canned Food Market Market Revenue (US$ Mn) Comparison by Product Type (2016-2032)
- Table 109: Middle East & Africa Canned Food Market Market Revenue (US$ Mn) Comparison by Type (2016-2032)
- Table 110: Middle East & Africa Canned Food Market Market Revenue (US$ Mn) Comparison by Distribution Channel (2016-2032)
- Table 111: Middle East & Africa Canned Food Market Market Y-o-Y Growth Rate Comparison by Country (2016-2032)
- Table 112: Middle East & Africa Canned Food Market Market Y-o-Y Growth Rate Comparison by Product Type (2016-2032)
- Table 113: Middle East & Africa Canned Food Market Market Y-o-Y Growth Rate Comparison by Type (2016-2032)
- Table 114: Middle East & Africa Canned Food Market Market Y-o-Y Growth Rate Comparison by Distribution Channel (2016-2032)
- Table 115: Middle East & Africa Canned Food Market Market Share Comparison by Country (2016-2032)
- Table 116: Middle East & Africa Canned Food Market Market Share Comparison by Product Type (2016-2032)
- Table 117: Middle East & Africa Canned Food Market Market Share Comparison by Type (2016-2032)
- Table 118: Middle East & Africa Canned Food Market Market Share Comparison by Distribution Channel (2016-2032)
- 1. Executive Summary
-
- Bolton Group Srl
- ConAgra Brands Inc
- Del Monte Foods, Inc.
- The Kraft Heinz Company
- H.J. Heinz Company, L.P.
- Pinnacle Foods, Inc.
- Hormel Foods Corporation.
- General Mills, Inc.
- Kellogg Co.
- Campbell Soup Company
- Nestlé S.A.
- JBS USA Holdings, Inc.
- CHB Group
- AYAM
- Danish Crown AmbA
- Dole Food Company Inc
Our Clients


View Our Licence Options
