Global C3 Glomerulopathy Market By Disease (C3 Glomerulonephritis, Dense Deposit Disease and Other ), By Diagnostic Technologies (Kidney Biopsy, Immunofluorescence Microscopy, and Others), By Treatment (Immunosuppressive Therapy, Anti-complement Therapy, and Other), By Region And Companies - Industry Segment Outlook, Market Assessment, Competition Scenario, Trends, And Forecast 2023-2032
-
37637
-
June 2023
-
179
-


-
This report was compiled by Trishita Deb Trishita Deb is an experienced market research and consulting professional with over 7 years of expertise across healthcare, consumer goods, and materials, contributing to over 400 healthcare-related reports. Correspondence Team Lead- Healthcare Linkedin | Detailed Market research Methodology Our methodology involves a mix of primary research, including interviews with leading mental health experts, and secondary research from reputable medical journals and databases. View Detailed Methodology Page
-
Quick Navigation
Report Overview
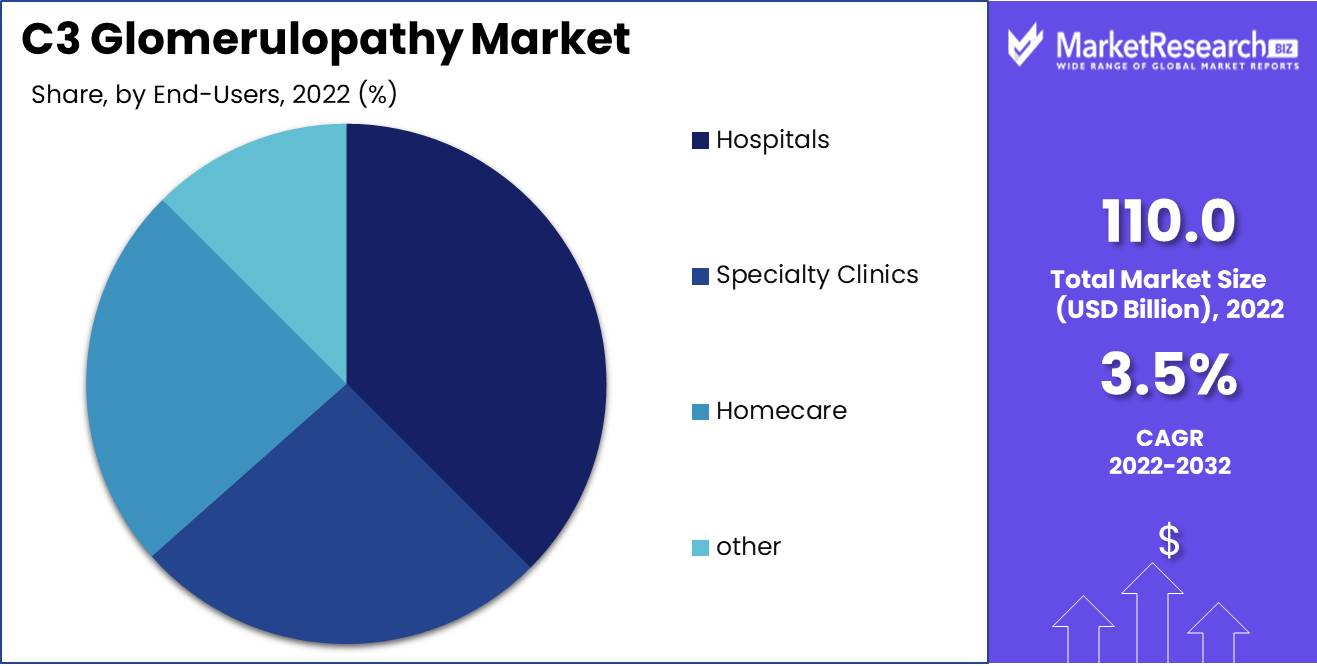
Global C3 Glomerulopathy Market size is expected to be worth around USD 153.8 Mn by 2032 from USD 110.0 Mn in 2022, growing at a CAGR of 3.5% during the forecast period from 2023 to 2032.
The C3 Glomerulopathy Market reverberates as a paradigm of paramount significance within the healthcare industry, owing to its escalating popularity and indispensability. The abnormal accumulation of the rare protein denominated as C3 within the glomeruli of the kidneys is how C3 glomerulopathy, a complex conglomeration of rare renal diseases, manifests itself. Given the perplexing complexity of this ailment, meticulous and prudent management takes on paramount importance, elevating it to the pinnacle of pharmaceutical concern.

The global c3 glomerulopathy market is an indispensable component of the healthcare industry and a clear leader in combating and ameliorating the spectrum of rare renal diseases that plague our society. Recent years have witnessed a precipitous rise in the market's prominence, a logical consequence of the escalating incidence of renal disorders and the growing awareness of the importance of early detection and effective therapeutic intervention.
The overarching objective of the global c3 glomerulopathy market is to foster the development of an arsenal of effective modalities and interventions capable of mitigating and alleviating the plight of individuals battling the labyrinthine complexities of rare renal diseases. In this regard, the market strives unrelentingly to provide patients with unrestricted access to innovative therapeutic avenues, which invariably result in a substantial improvement in their quality of life while simultaneously reducing their susceptibility to the threatening clutch of fatal complications.
In the history of the global c3 glomerulopathy market, a multitude of ground-breaking innovations have left an indelible trace, accelerating its evolution. For example, researchers have pioneered the development of a revolutionary protein, CR1, which possesses an unrivaled propensity to selectively target and eradicate the perplexing entanglements of C3 accumulation in the renal environment. The introduction of this ground-breaking innovation holds great promise, with the potential to transform the therapeutic landscape for rare renal diseases and bestow an unprecedented improvement in patient outcomes.
The unprecedented growth of investments in the global c3 glomerulopathy market attests to its irresistible appeal, with numerous pharmaceutical titans devoting substantial resources to the realm of research and development in the noble pursuit of conceiving novel therapeutic modalities and diagnostic instruments. Concurrently, a variety of healthcare providers and diagnostic laboratories have incorporated C3 glomerulopathy testing into their arsenal of services, a move that aims to bestow upon patients the twin benefits of accurate and timely diagnoses, thereby paving the way for a swift initiation of appropriate interventions.
Despite its burgeoning significance, the global c3 glomerulopathy market elicits a great deal of intrigue and allure across a wide range of industries, including pharmaceuticals, healthcare, and diagnostic laboratories. In the interim, numerous organizations have judiciously incorporated C3 glomerulopathy testing into their comprehensive service offerings, aiming to establish a symbiotic relationship between accurate diagnostics and the ensuing improvement of patient outcomes.
The need to diligently resolve ethical dilemmas and promote responsible practices assumes paramount significance in light of the unabated expansion and constant metamorphosis that underpin the global c3 Glomerulopathy market. Thus, a clear emphasis must be placed on the pillars of transparency, explainability, and accountability, as these services are the foundation upon which patient safety and therapeutic efficacy are painstakingly built.
Driving factors
C3 Glomerulopathy Market Prevalence and Diagnostic Developments on the Rise
In the coming years, the global market for c3 glomerulopathy is anticipated to expand significantly due to factors such as the disease's rising prevalence and diagnostic method advancements. C3 glomerulopathy is a rare kidney condition that affects the glomeruli and small blood vessels within the kidneys. In recent years, there has been a growing understanding of the disease's pathogenesis, which has increased patients' demand for effective treatment options.
Adapting the C3 Glomerulopathy Market to Regulatory Changes
Healthcare professionals can now identify and diagnose C3 glomerulopathy more precisely than ever before due to technological advancements in diagnostic techniques. In addition, advancements in treatment options and emergent therapies show promise in the disease's fight. This type of advancement is vital not only for patients but also for healthcare professionals and researchers who strive to better understand and treat the disease.
Revolutionary Technologies for C3 Glomerulopathy Treatment
Regulatory changes could potentially have an impact on the C3 glomerulopathy market, and the industry's key participants must maintain their adaptability. Globally, healthcare agencies are becoming more stringent, which may impact the accessibility of certain remedies, particularly in developing nations.
Consumer Trends Drive the Expansion of the C3 Glomerulopathy Market
Emerging technologies may also revolutionize the treatment of C3 glomerulopathy. CRISPR-Cas9 gene-editing technology, for instance, has the potential to revolutionize the treatment of genetic disorders such as C3 glomerulopathy. These technologies may not reach the mainstream market for some time, but they have the potential to significantly impact patient care.
C3 Glomerulopathy Market Has a Promising Future
Lastly, emerging consumer behavior trends, such as a greater emphasis on health and wellness, may stimulate growth in the C3 Glomerulopathy market. As consumer awareness of the disease and its impact on patient health increases, the demand for improved treatment options may rise. All of these factors indicate that the future of the C3 glomerulopathy market is bright, and the industry's leaders must continue to innovate in order to remain ahead of the curve.
Restraining Factors
C3 Glomerulopathy Awareness and Diagnosis Difficulties
Global c3 glomerulopathy is an extremely uncommon kidney disease. This disease's diagnosis and treatment are limited by a number of limiting factors. Some of these limiting factors include limited awareness and underdiagnosis of C3 glomerulopathy, challenges in accurate disease classification, variability in disease progression, and limited availability of targeted therapies.
C3 Glomerulopathy Standardizing Disease Classification
The main factors that lead to C3 glomerulopathy's delayed diagnosis and increased morbidity are limited awareness and underdiagnosis. This rare disease is frequently misdiagnosed as other kidney diseases, including membranoproliferative glomerulonephritis, IgA nephropathy, and atypical hemolytic uremic syndrome, leading to delays in appropriate treatment. In addition, this disease lacks distinctive symptoms, making it difficult for physicians to distinguish it from other kidney ailments.
Unpredictable C3 Glomerulopathy Progression Clinical Obstacles
C3 glomerulopathy is a complex, multi-subtype disease. Due to the lack of standardization in diagnostic criteria across various clinics and medical centers, the identification and classification of these subtypes are challenging. various diagnostic criteria can result in various disease classifications, leading to confusion among patients and physicians. To address this issue, there is a need for a standardized diagnostic protocol applicable to all medical facilities.
Limitations of C3 Glomerulopathy Targeted Therapies
It is more challenging for physicians to predict the rate of disease progression in C3 glomerulopathy because the clinical manifestations and progression differ from person to person. The progression of a disease can be unpredictable, leading to inadequate therapeutic management. To overcome this, physicians should be better trained to recognize disease progression and predict it.
Needed Investment for C3 Glomerulopathy Research
Since the disease pathogenesis is not completely understood, targeted therapies are limited for C3 glomerulopathy. Existing medications used to treat this disease have numerous adverse effects. In addition, the majority of these medications do not target the disease's underlying cause, making it challenging to achieve an optimal therapeutic response. There is a need for increased investment in research in order to develop targeted therapies.
Disease Analysis
C3 Gglomerulopathy is an uncommon disease of the kidneys. This disease traps complement-activating protein C3 in renal glomeruli. In the kidneys, this causes damage and inflammation. C3GN, a subtype of C3 Glomerulopathy, involves complement system activation and glomeruli protein deposition. C3GN causes most C3 Glomerulopathy cases and has poor outcomes.
The C3 glomerulopathy market (C3GN) segment dominates the C3 glomerulonephritis market. The report reveals that the rising prevalence of C3 glomerulopathy disease, coupled with rising awareness, is driving C3GN treatment demand. The report highlights that the C3GN segment is anticipated to register the fastest growth rate.
Emerging economies' economic growth is also driving C3 glomerulonephritis (C3GN) Segment adoption. Economic growth improves healthcare access, diagnosis, and outcomes for patients. Rising per capita income in emerging nations has resulted in an increase in healthcare spending, which has led to increased demand for advanced treatment options.
The rise in C3 glomerulopathy, coupled with rising disease awareness, has led to changes in consumer behavior. Patients and caregivers are actively researching the disease and treatment options. They want better outcomes and are willing to pay for advanced treatment options that improve their quality of life.
Treatment Analysis
Supportive care, immunosuppressive therapy, and plasma therapy are C3 glomerulopathy treatment options. Immunosuppressive therapy reduces renal inflammation and immune system activity. The therapy slows disease progression and improves kidney function.
The Immunosuppressive therapy segment dominates the global C3 glomerulopathy market. According to the report, the rising prevalence of C3 glomerulopathy, coupled with the demand for advanced treatment options, is driving the adoption of immunosuppressive therapy. The report highlights that the Immunosuppressive Therapy Segment is anticipated to register the fastest growth rate.
Emerging economies are driving immunosuppressive therapy adoption. Economic growth improves healthcare access, diagnosis, and outcomes for patients. Rising per capita income in emerging nations has resulted in an increase in healthcare spending, which has led to increased demand for advanced treatment options.
Patients and caregivers are actively researching the disease and treatment options. They want better outcomes and are willing to pay for advanced treatment options that improve their quality of life.
End-Users Analysis
Hospitals dominate the global C3 glomerulopathy market. C3 glomerulopathy patients receive diagnosis, treatment, and follow-up at hospitals. The hospitals offer advanced disease management and cutting-edge treatment options.
The Hospital's segment dominates the global C3 glomerulopathy market. The report implies that the rising prevalence of C3 glomerulopathy, coupled with rising healthcare spending, is driving hospital-based treatment demand. The report highlights that the hospital's Segment is anticipated to register the fastest growth rate.
Emerging economies are driving hospital-based treatment adoption. Economic growth improves healthcare access, diagnosis, and outcomes for patients. Rising per capita income in emerging nations has resulted in an increase in healthcare spending, which has led to increased demand for advanced treatment options.
Patients want high-quality healthcare facilities with advanced treatment options. Healthcare providers are aware of this trend and invest in cutting-edge facilities to offer patients the greatest treatment options. Patients with C3 glomerulopathy disease seek hospitals with cutting-edge facilities and skilled healthcare providers for diagnosis and treatment.
Key Market Segments
By Disease
- C3 Glomerulonephritis (C3GN)
- Dense Deposit Disease (DDD)
By Diagnostic Technologies
- Kidney Biopsy
- Immunofluorescence Microscopy
- Serum Complement Testing
- Other Diagnostic Technologies
By Treatment
- Immunosuppressive Therapy
- Anti-complement Therapy
- Other Treatments
By End-Users
- Hospitals
- Specialty Clinics
- Homecare
- other End-Users
Growth Opportunity
C3 Glomerulopathy Market Exponential Growth Prospects
Global C3 glomerulopathy market growth potential is driven by opportunity research and development of novel therapies targeting the complement system, expansion of diagnostic capabilities for C3 glomerulopathy, increased collaboration between healthcare providers and research institutions, and advocacy on behalf of the patient.
Innovative Therapies Drive Market Growth for C3 Glomerulopathy
A number of factors that capitalize on the market's growth potential are expected to drive the global C3 glomerulopathy market's significant growth over the next few years. This expected increase coincides with a rise in the number of patients diagnosed with C3 glomerulopathy, a rare and severe renal disease.
Expanding Diagnostic Capabilities Drive Market Growth for C3 Glomerulopathy
Increasing emphasis on research and development of novel therapies targeting the complement system is a key growth driver for the global c3 glomerulopathy market. Due to the recognition that C3 glomerulopathy is a complement-mediated disease, complement system inhibitors play a crucial role in the treatment of the disease.
Collaboration Drives the Global Market for C3 Glomerulopathy
The expansion of diagnostic capabilities will also play a significant role in the expansion of the global market for c3 glomerulopathy. This expansion is important for helping to identify patients with C3 glomerulopathy, as early diagnosis and treatment can substantially improve patient outcomes. The market is expected to expand as an increasing number of diagnostic tests can help diagnose C3 glomerulopathy and aid clinicians in providing targeted treatment for each patient.
Growth of the C3 Glomerulopathy Market Driven by Patient Empowerment
As healthcare providers and research institutions collaborate more effectively, the global c3 glomerulopathy market is expected to expand rapidly. This increased collaboration will allow for more research to be conducted, leading to innovation and the development of ground-breaking therapies for patients. Collaboration is an important incentive for research and experience-sharing, leading to the development of superior technologies and healing modalities.
Patient Education Drives Market Expansion for C3 Glomerulopathy
Lastly, patient education and advocacy are integral to the global c3 glomerulopathy market's growth potential. Patient education initiatives can raise awareness among patients, caregivers, and clinicians, helping to increase the proportion of patients receiving early diagnosis and treatment. Advocacy initiatives promote access to care and ensure that patients have access to newly developed innovative therapies. Both of these patient-centered initiatives can lead to a positive cascade of results, including accelerated research, heightened awareness, and improved patient outcomes.
Latest Trends
Growing Market Trends for C3 Glomerulopathy
The global market for C3 glomerulopathy is expanding rapidly due to various market trends that are reshaping the industry. These trends include the utilization of complement inhibitors for the treatment of C3 glomerulopathy, the focus on personalized medicine, the adoption of biomarkers for disease monitoring, and the integration of supportive care strategies in the management of the disease.
Complement Inhibitors Drive the Market for C3 Glomerulopathy
C3 glomerulopathy is a kidney disease caused by an abnormality in the complement system - an immune system component that helps battle infections and eliminate damaged cells. The utilization of complement inhibitors for the treatment of C3 glomerulopathy is one of the main market trends that are shaping the global C3 glomerulopathy market.
Personalized Medicine Influences the Market for C3 Glomerulopathy
Complement inhibitors are medications that help regulate the complement system's activity. They function by inhibiting complement system proteins responsible for inflammation and tissue injury. Several complement inhibitors, including monoclonal antibodies, small-molecule inhibitors, and gene therapies, are currently under development for the treatment of C3 glomerulopathy.
Market Adoption of Biomarkers for C3 Glomerulopathy
The focus on personalized medicine approaches is another significant market trend shaping the global C3 glomerulopathy market. Personalized medicine refers to the use of patient-specific information to modify medical treatments to the specific needs of each individual patient. In the case of C3 glomerulopathy, personalized medicine approaches could include the use of biomarkers to identify patients most likely to benefit from complement inhibitor therapy or the use of genetic testing to identify patients with specific genetic mutations associated with C3 glomerulopathy.
The market for C3 Glomerulopathy is Transformed by Supportive Care Strategies
Biomarkers are biological indicators used to determine the presence or severity of a disease. The case of C3 glomerulopathy may include biomarkers of inflammation, kidney function, or complement system activity. Another important trend that is shaping the global C3 glomerulopathy market is the adoption of biomarkers for disease monitoring. By using biomarkers to monitor disease progression and treatment response, clinicians can more effectively manage the disease and make necessary adjustments to treatment.
Enhanced Disease Management Drives Market Growth for C3 Glomerulopathy
The global C3 glomerulopathy market is also being shaped by the integration of supportive care strategies in disease management. Supportive care is the use of non-drug therapies to alleviate symptoms and enhance the quality of life for patients with chronic diseases. In the case of C3 glomerulopathy, supportive care strategies may include dietary modifications, exercise programs, techniques for stress reduction, and counseling services. Clinicians can improve outcomes and improve patient quality of life by incorporating these strategies into overall disease management plans.
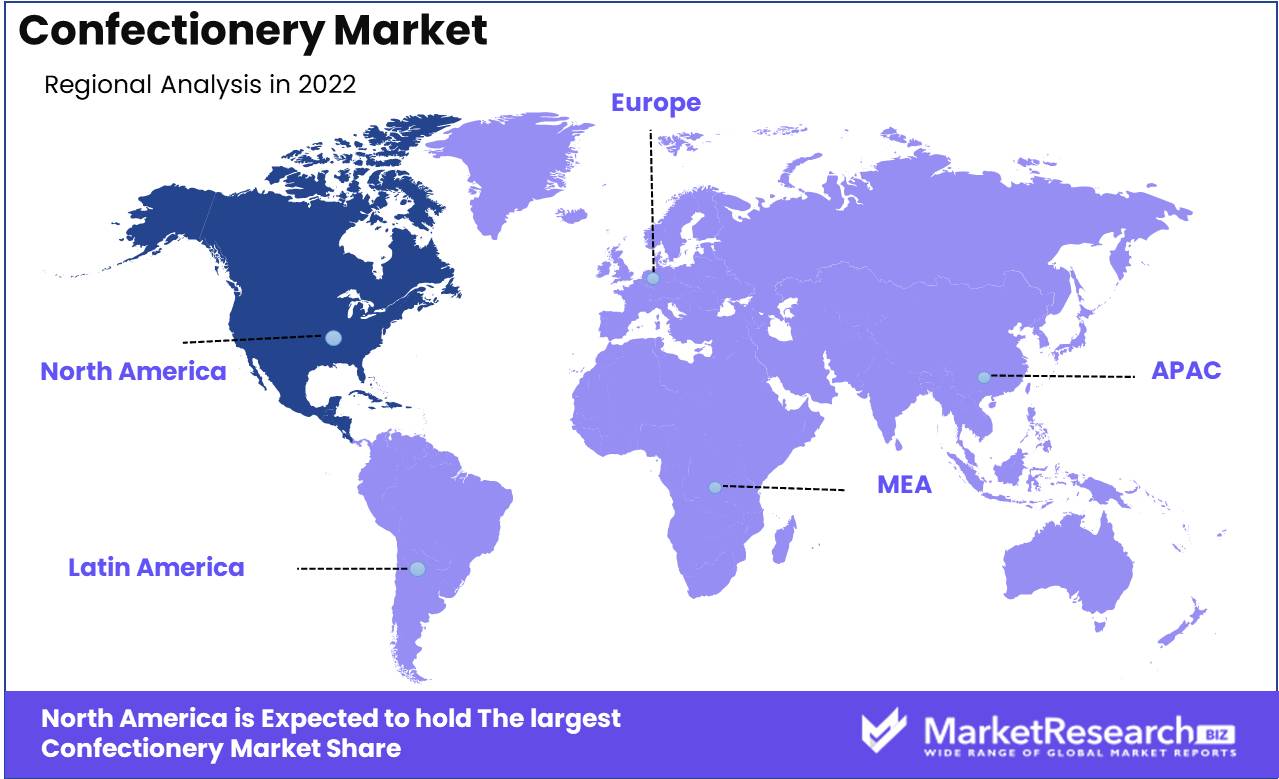
Regional Analysis
Europe's market dominance in C3 glomerulopathy can be attributed to a number of factors. C3 glomerulopathy is a rare immune disease that affects the glomerular basement membrane of the kidney. Immune dysfunction in the body results in the deposition of C3 fragments in the membrane, which induces inflammation, damages the glomeruli, and diminishes kidney function. There is no cure for C3 glomerulopathy, and supportive care and immunosuppressive therapy are the only available treatments.
The prevalence rate is not well documented globally because the disease is rare. The prevalence of C3 glomerulopathy is higher in Europe than in other regions, according to clinical investigations. The disease's high prevalence in Europe is due to genetic and environmental factors that make the population susceptible.
In addition, the Europe C3 glomerulopathy market is anticipated to grow significantly due to the rising prevalence of the disease and the government's efforts to raise public awareness. Additionally, the market is driven by the high rate of diagnosis and treatment, which makes it more profitable than other regions.
First, the region's availability of well-equipped healthcare facilities with a focus on the research and development of novel treatments for rare diseases. Europe's healthcare system is well-established and attracts patients from all over the world. The region is home to some of the finest medical institutions that provide patients with world-class treatment and care.
Second, the region's robust regulatory structure encourages the development and approval of new treatments for rare diseases, such as C3 glomerulopathy. The European Medicines Agency (EMA) is tasked with evaluating and approving novel drugs for the market, ensuring their quality, efficacy, and safety service. The agency's guidelines for drug development and approval are stringent, ensuring that only the most effective treatments reach the market.
Key Regions and Countries
North America
- US
- Canada
- Mexico
Western Europe
- Germany
- France
- The UK
- Spain
- Italy
- Portugal
- Ireland
- Austria
- Switzerland
- Benelux
- Nordic
- Rest of Western Europe
Eastern Europe
- Russia
- Poland
- The Czech Republic
- Greece
- Rest of Eastern Europe
APAC
- China
- Japan
- South Korea
- India
- Australia & New Zealand
- Indonesia
- Malaysia
- Philippines
- Singapore
- Thailand
- Vietnam
- Rest of APAC
Latin America
- Brazil
- Colombia
- Chile
- Argentina
- Costa Rica
- Rest of Latin America
Middle East & Africa
- Algeria
- Egypt
- Israel
- Kuwait
- Nigeria
- Saudi Arabia
- South Africa
- Turkey
- United Arab Emirates
- Rest of MEA
Key Players Analysis
Due to the increasing prevalence of the disease and rising population awareness, the Global C3 glomerulopathy market is expected to expand at a significant rate in the coming years. C3 glomerulopathy is a rare kidney disorder caused by the excessive deposition of C3 protein in the glomeruli of the kidney, resulting in inflammation and tissue damage.
Several key players, such as Alexion Pharmaceuticals, Inc. and Achillion Pharmaceuticals, Inc., operate in the global C3 glomerulopathy market. These companies are making substantial investments in research and development to create innovative therapeutic solutions for the treatment of C3 glomerulopathy.
Soliris (eculizumab), the first FDA-approved treatment for C3 glomerulopathy, was developed by Alexion Pharmaceuticals, Inc., a leading player in the global market. In addition, Achillion Pharmaceuticals, Inc. is a significant player in this market, developing therapies that target the pathway responsible for C3 activation, including ACH-4471 and ACH-5228.
Top Key Players in C3 Glomerulopathy Market
- Alexion Pharmaceuticals
- Novartis AG
- Omeros Corporation
- Achillion Pharmaceuticals
- Ra Pharmaceuticals
- Akari Therapeutics
- Apellis Pharmaceuticals
- ChemoCentryx
- CuraGen Corporation
- Regeneron Pharmaceuticals
- Other Key Players
Recent Development
- In 2019, The treatment of C3 glomerulopathy underwent significant advancements. A number of novel therapies targeting the complement system, such as monoclonal antibodies and small-molecule inhibitors, demonstrated encouraging results in clinical trials.
- In 2020, Researchers made significant progress in identifying C3 glomerulopathy biomarkers. These biomarkers included markers of activation of the complement system, inflammation, and kidney injury.
- In 2021, Genetic testing for C3 glomerulopathy saw significant advancements. Researchers identified specific genetic mutations associated with C3 glomerulopathy and developed genetic assays to identify individuals at risk for the disease or who are already afflicted.
- In 2022, Awareness and advocacy efforts for C3 glomerulopathy increased significantly. Patient organizations, healthcare providers, and research institutions worked together to increase public awareness of the disease, its symptoms, and available treatments.
- In 2023, A multidisciplinary approach to managing C3 glomerulopathy has become increasingly important.
Report Scope:
Report Features Description Market Value (2022) USD 110.0 Mn Forecast Revenue (2032) USD 153.8 Mn CAGR (2023-2032) 3.50% Base Year for Estimation 2022 Historic Period 2016-2022 Forecast Period 2023-2032 Report Coverage Revenue Forecast, Market Dynamics, COVID-19 Impact, Competitive Landscape, Recent Developments Segments Covered By Disease (C3 Glomerulonephritis (C3GN), Dense Deposit Disease (DDD)), By Diagnostic Technologies (Kidney Biopsy, Immunofluorescence Microscopy, Serum Complement Testing,Other Diagnostic Technologies), By Treatment(Immunosuppressive Therapy, Anti-complement Therapy, Other Treatments), By End-Users(Hospitals, Specialty Clinics, Homecare, other End-Users) Regional Analysis North America – The US, Canada, & Mexico; Western Europe – Germany, France, The UK, Spain, Italy, Portugal, Ireland, Austria, Switzerland, Benelux, Nordic, & Rest of Western Europe; Eastern Europe – Russia, Poland, The Czech Republic, Greece, & Rest of Eastern Europe; APAC – China, Japan, South Korea, India, Australia & New Zealand, Indonesia, Malaysia, Philippines, Singapore, Thailand, Vietnam, & Rest of APAC; Latin America – Brazil, Colombia, Chile, Argentina, Costa Rica, & Rest of Latin America; Middle East & Africa – Algeria, Egypt, Israel, Kuwait, Nigeria, Saudi Arabia, South Africa, Turkey, United Arab Emirates, & Rest of MEA Competitive Landscape Alexion Pharmaceuticals, Novartis AG, Omeros Corporation, Achillion Pharmaceuticals, Ra Pharmaceuticals, Akari Therapeutics, Apellis Pharmaceuticals, ChemoCentryx, CuraGen Corporation, Regeneron Pharmaceuticals, Other Key Players Customization Scope Customization for segments, region/country-level will be provided. Moreover, additional customization can be done based on the requirements. Purchase Options We have three licenses to opt for: Single User License, Multi-User License (Up to 5 Users), Corporate Use License (Unlimited User and Printable PDF) -
- 1. Executive Summary
- 1.1. Definition
- 1.2. Taxonomy
- 1.3. Research Scope
- 1.4. Key Analysis
- 1.5. Key Findings by Major Segments
- 1.6. Top strategies by Major Players
- 2. Global C3 Glomerulopathy Market Overview
- 2.1. C3 Glomerulopathy Market Dynamics
- 2.1.1. Drivers
- 2.1.2. Opportunities
- 2.1.3. Restraints
- 2.1.4. Challenges
- 2.2. Macro-economic Factors
- 2.3. Regulatory Framework
- 2.4. Market Investment Feasibility Index
- 2.5. PEST Analysis
- 2.6. PORTER’S Five Force Analysis
- 2.7. Drivers & Restraints Impact Analysis
- 2.8. Industry Chain Analysis
- 2.9. Cost Structure Analysis
- 2.10. Marketing Strategy
- 2.11. Russia-Ukraine War Impact Analysis
- 2.12. Opportunity Map Analysis
- 2.13. Market Competition Scenario Analysis
- 2.14. Product Life Cycle Analysis
- 2.15. Opportunity Orbits
- 2.16. Manufacturer Intensity Map
- 2.17. Major Companies sales by Value & Volume
- 2.1. C3 Glomerulopathy Market Dynamics
- 3. Global C3 Glomerulopathy Market Analysis, Opportunity and Forecast, 2016-2032
- 3.1. Global C3 Glomerulopathy Market Analysis, 2016-2021
- 3.2. Global C3 Glomerulopathy Market Opportunity and Forecast, 2023-2032
- 3.3. Global C3 Glomerulopathy Market Analysis, Opportunity and Forecast, By By Disease, 2016-2032
- 3.3.1. Global C3 Glomerulopathy Market Analysis by By Disease: Introduction
- 3.3.2. Market Size Absolute $ Opportunity Analysis and Forecast, By By Disease, 2016-2032
- 3.3.3. C3 Glomerulonephritis (C3GN)
- 3.3.4. Dense Deposit Disease (DDD)
- 3.4. Global C3 Glomerulopathy Market Analysis, Opportunity and Forecast, By By Diagnostic Technologies, 2016-2032
- 3.4.1. Global C3 Glomerulopathy Market Analysis by By Diagnostic Technologies: Introduction
- 3.4.2. Market Size Absolute $ Opportunity Analysis and Forecast, By By Diagnostic Technologies, 2016-2032
- 3.4.3. Kidney Biopsy
- 3.4.4. Immunofluorescence Microscopy
- 3.4.5. Serum Complement Testing
- 3.4.6. Other Diagnostic Technologies
- 3.5. Global C3 Glomerulopathy Market Analysis, Opportunity and Forecast, By By Treatment, 2016-2032
- 3.5.1. Global C3 Glomerulopathy Market Analysis by By Treatment: Introduction
- 3.5.2. Market Size Absolute $ Opportunity Analysis and Forecast, By By Treatment, 2016-2032
- 3.5.3. Immunosuppressive Therapy
- 3.5.4. Anti-complement Therapy
- 3.5.5. Other Treatments
- 3.6. Global C3 Glomerulopathy Market Analysis, Opportunity and Forecast, By By End-Users, 2016-2032
- 3.6.1. Global C3 Glomerulopathy Market Analysis by By End-Users: Introduction
- 3.6.2. Market Size Absolute $ Opportunity Analysis and Forecast, By By End-Users, 2016-2032
- 3.6.3. Hospitals
- 3.6.4. Specialty Clinics
- 3.6.5. Homecare
- 3.6.6. other End-Users
- 4. North America C3 Glomerulopathy Market Analysis, Opportunity and Forecast, 2016-2032
- 4.1. North America C3 Glomerulopathy Market Analysis, 2016-2021
- 4.2. North America C3 Glomerulopathy Market Opportunity and Forecast, 2023-2032
- 4.3. North America C3 Glomerulopathy Market Analysis, Opportunity and Forecast, By By Disease, 2016-2032
- 4.3.1. North America C3 Glomerulopathy Market Analysis by By Disease: Introduction
- 4.3.2. Market Size Absolute $ Opportunity Analysis and Forecast, By By Disease, 2016-2032
- 4.3.3. C3 Glomerulonephritis (C3GN)
- 4.3.4. Dense Deposit Disease (DDD)
- 4.4. North America C3 Glomerulopathy Market Analysis, Opportunity and Forecast, By By Diagnostic Technologies, 2016-2032
- 4.4.1. North America C3 Glomerulopathy Market Analysis by By Diagnostic Technologies: Introduction
- 4.4.2. Market Size Absolute $ Opportunity Analysis and Forecast, By By Diagnostic Technologies, 2016-2032
- 4.4.3. Kidney Biopsy
- 4.4.4. Immunofluorescence Microscopy
- 4.4.5. Serum Complement Testing
- 4.4.6. Other Diagnostic Technologies
- 4.5. North America C3 Glomerulopathy Market Analysis, Opportunity and Forecast, By By Treatment, 2016-2032
- 4.5.1. North America C3 Glomerulopathy Market Analysis by By Treatment: Introduction
- 4.5.2. Market Size Absolute $ Opportunity Analysis and Forecast, By By Treatment, 2016-2032
- 4.5.3. Immunosuppressive Therapy
- 4.5.4. Anti-complement Therapy
- 4.5.5. Other Treatments
- 4.6. North America C3 Glomerulopathy Market Analysis, Opportunity and Forecast, By By End-Users, 2016-2032
- 4.6.1. North America C3 Glomerulopathy Market Analysis by By End-Users: Introduction
- 4.6.2. Market Size Absolute $ Opportunity Analysis and Forecast, By By End-Users, 2016-2032
- 4.6.3. Hospitals
- 4.6.4. Specialty Clinics
- 4.6.5. Homecare
- 4.6.6. other End-Users
- 4.7. North America C3 Glomerulopathy Market Analysis, Opportunity and Forecast, By Country , 2016-2032
- 4.7.1. North America C3 Glomerulopathy Market Analysis by Country : Introduction
- 4.7.2. Market Size Absolute $ Opportunity Analysis and Forecast, Country , 2016-2032
- 4.7.2.1. The US
- 4.7.2.2. Canada
- 4.7.2.3. Mexico
- 5. Western Europe C3 Glomerulopathy Market Analysis, Opportunity and Forecast, 2016-2032
- 5.1. Western Europe C3 Glomerulopathy Market Analysis, 2016-2021
- 5.2. Western Europe C3 Glomerulopathy Market Opportunity and Forecast, 2023-2032
- 5.3. Western Europe C3 Glomerulopathy Market Analysis, Opportunity and Forecast, By By Disease, 2016-2032
- 5.3.1. Western Europe C3 Glomerulopathy Market Analysis by By Disease: Introduction
- 5.3.2. Market Size Absolute $ Opportunity Analysis and Forecast, By By Disease, 2016-2032
- 5.3.3. C3 Glomerulonephritis (C3GN)
- 5.3.4. Dense Deposit Disease (DDD)
- 5.4. Western Europe C3 Glomerulopathy Market Analysis, Opportunity and Forecast, By By Diagnostic Technologies, 2016-2032
- 5.4.1. Western Europe C3 Glomerulopathy Market Analysis by By Diagnostic Technologies: Introduction
- 5.4.2. Market Size Absolute $ Opportunity Analysis and Forecast, By By Diagnostic Technologies, 2016-2032
- 5.4.3. Kidney Biopsy
- 5.4.4. Immunofluorescence Microscopy
- 5.4.5. Serum Complement Testing
- 5.4.6. Other Diagnostic Technologies
- 5.5. Western Europe C3 Glomerulopathy Market Analysis, Opportunity and Forecast, By By Treatment, 2016-2032
- 5.5.1. Western Europe C3 Glomerulopathy Market Analysis by By Treatment: Introduction
- 5.5.2. Market Size Absolute $ Opportunity Analysis and Forecast, By By Treatment, 2016-2032
- 5.5.3. Immunosuppressive Therapy
- 5.5.4. Anti-complement Therapy
- 5.5.5. Other Treatments
- 5.6. Western Europe C3 Glomerulopathy Market Analysis, Opportunity and Forecast, By By End-Users, 2016-2032
- 5.6.1. Western Europe C3 Glomerulopathy Market Analysis by By End-Users: Introduction
- 5.6.2. Market Size Absolute $ Opportunity Analysis and Forecast, By By End-Users, 2016-2032
- 5.6.3. Hospitals
- 5.6.4. Specialty Clinics
- 5.6.5. Homecare
- 5.6.6. other End-Users
- 5.7. Western Europe C3 Glomerulopathy Market Analysis, Opportunity and Forecast, By Country , 2016-2032
- 5.7.1. Western Europe C3 Glomerulopathy Market Analysis by Country : Introduction
- 5.7.2. Market Size Absolute $ Opportunity Analysis and Forecast, Country , 2016-2032
- 5.7.2.1. Germany
- 5.7.2.2. France
- 5.7.2.3. The UK
- 5.7.2.4. Spain
- 5.7.2.5. Italy
- 5.7.2.6. Portugal
- 5.7.2.7. Ireland
- 5.7.2.8. Austria
- 5.7.2.9. Switzerland
- 5.7.2.10. Benelux
- 5.7.2.11. Nordic
- 5.7.2.12. Rest of Western Europe
- 6. Eastern Europe C3 Glomerulopathy Market Analysis, Opportunity and Forecast, 2016-2032
- 6.1. Eastern Europe C3 Glomerulopathy Market Analysis, 2016-2021
- 6.2. Eastern Europe C3 Glomerulopathy Market Opportunity and Forecast, 2023-2032
- 6.3. Eastern Europe C3 Glomerulopathy Market Analysis, Opportunity and Forecast, By By Disease, 2016-2032
- 6.3.1. Eastern Europe C3 Glomerulopathy Market Analysis by By Disease: Introduction
- 6.3.2. Market Size Absolute $ Opportunity Analysis and Forecast, By By Disease, 2016-2032
- 6.3.3. C3 Glomerulonephritis (C3GN)
- 6.3.4. Dense Deposit Disease (DDD)
- 6.4. Eastern Europe C3 Glomerulopathy Market Analysis, Opportunity and Forecast, By By Diagnostic Technologies, 2016-2032
- 6.4.1. Eastern Europe C3 Glomerulopathy Market Analysis by By Diagnostic Technologies: Introduction
- 6.4.2. Market Size Absolute $ Opportunity Analysis and Forecast, By By Diagnostic Technologies, 2016-2032
- 6.4.3. Kidney Biopsy
- 6.4.4. Immunofluorescence Microscopy
- 6.4.5. Serum Complement Testing
- 6.4.6. Other Diagnostic Technologies
- 6.5. Eastern Europe C3 Glomerulopathy Market Analysis, Opportunity and Forecast, By By Treatment, 2016-2032
- 6.5.1. Eastern Europe C3 Glomerulopathy Market Analysis by By Treatment: Introduction
- 6.5.2. Market Size Absolute $ Opportunity Analysis and Forecast, By By Treatment, 2016-2032
- 6.5.3. Immunosuppressive Therapy
- 6.5.4. Anti-complement Therapy
- 6.5.5. Other Treatments
- 6.6. Eastern Europe C3 Glomerulopathy Market Analysis, Opportunity and Forecast, By By End-Users, 2016-2032
- 6.6.1. Eastern Europe C3 Glomerulopathy Market Analysis by By End-Users: Introduction
- 6.6.2. Market Size Absolute $ Opportunity Analysis and Forecast, By By End-Users, 2016-2032
- 6.6.3. Hospitals
- 6.6.4. Specialty Clinics
- 6.6.5. Homecare
- 6.6.6. other End-Users
- 6.7. Eastern Europe C3 Glomerulopathy Market Analysis, Opportunity and Forecast, By Country , 2016-2032
- 6.7.1. Eastern Europe C3 Glomerulopathy Market Analysis by Country : Introduction
- 6.7.2. Market Size Absolute $ Opportunity Analysis and Forecast, Country , 2016-2032
- 6.7.2.1. Russia
- 6.7.2.2. Poland
- 6.7.2.3. The Czech Republic
- 6.7.2.4. Greece
- 6.7.2.5. Rest of Eastern Europe
- 7. APAC C3 Glomerulopathy Market Analysis, Opportunity and Forecast, 2016-2032
- 7.1. APAC C3 Glomerulopathy Market Analysis, 2016-2021
- 7.2. APAC C3 Glomerulopathy Market Opportunity and Forecast, 2023-2032
- 7.3. APAC C3 Glomerulopathy Market Analysis, Opportunity and Forecast, By By Disease, 2016-2032
- 7.3.1. APAC C3 Glomerulopathy Market Analysis by By Disease: Introduction
- 7.3.2. Market Size Absolute $ Opportunity Analysis and Forecast, By By Disease, 2016-2032
- 7.3.3. C3 Glomerulonephritis (C3GN)
- 7.3.4. Dense Deposit Disease (DDD)
- 7.4. APAC C3 Glomerulopathy Market Analysis, Opportunity and Forecast, By By Diagnostic Technologies, 2016-2032
- 7.4.1. APAC C3 Glomerulopathy Market Analysis by By Diagnostic Technologies: Introduction
- 7.4.2. Market Size Absolute $ Opportunity Analysis and Forecast, By By Diagnostic Technologies, 2016-2032
- 7.4.3. Kidney Biopsy
- 7.4.4. Immunofluorescence Microscopy
- 7.4.5. Serum Complement Testing
- 7.4.6. Other Diagnostic Technologies
- 7.5. APAC C3 Glomerulopathy Market Analysis, Opportunity and Forecast, By By Treatment, 2016-2032
- 7.5.1. APAC C3 Glomerulopathy Market Analysis by By Treatment: Introduction
- 7.5.2. Market Size Absolute $ Opportunity Analysis and Forecast, By By Treatment, 2016-2032
- 7.5.3. Immunosuppressive Therapy
- 7.5.4. Anti-complement Therapy
- 7.5.5. Other Treatments
- 7.6. APAC C3 Glomerulopathy Market Analysis, Opportunity and Forecast, By By End-Users, 2016-2032
- 7.6.1. APAC C3 Glomerulopathy Market Analysis by By End-Users: Introduction
- 7.6.2. Market Size Absolute $ Opportunity Analysis and Forecast, By By End-Users, 2016-2032
- 7.6.3. Hospitals
- 7.6.4. Specialty Clinics
- 7.6.5. Homecare
- 7.6.6. other End-Users
- 7.7. APAC C3 Glomerulopathy Market Analysis, Opportunity and Forecast, By Country , 2016-2032
- 7.7.1. APAC C3 Glomerulopathy Market Analysis by Country : Introduction
- 7.7.2. Market Size Absolute $ Opportunity Analysis and Forecast, Country , 2016-2032
- 7.7.2.1. China
- 7.7.2.2. Japan
- 7.7.2.3. South Korea
- 7.7.2.4. India
- 7.7.2.5. Australia & New Zeland
- 7.7.2.6. Indonesia
- 7.7.2.7. Malaysia
- 7.7.2.8. Philippines
- 7.7.2.9. Singapore
- 7.7.2.10. Thailand
- 7.7.2.11. Vietnam
- 7.7.2.12. Rest of APAC
- 8. Latin America C3 Glomerulopathy Market Analysis, Opportunity and Forecast, 2016-2032
- 8.1. Latin America C3 Glomerulopathy Market Analysis, 2016-2021
- 8.2. Latin America C3 Glomerulopathy Market Opportunity and Forecast, 2023-2032
- 8.3. Latin America C3 Glomerulopathy Market Analysis, Opportunity and Forecast, By By Disease, 2016-2032
- 8.3.1. Latin America C3 Glomerulopathy Market Analysis by By Disease: Introduction
- 8.3.2. Market Size Absolute $ Opportunity Analysis and Forecast, By By Disease, 2016-2032
- 8.3.3. C3 Glomerulonephritis (C3GN)
- 8.3.4. Dense Deposit Disease (DDD)
- 8.4. Latin America C3 Glomerulopathy Market Analysis, Opportunity and Forecast, By By Diagnostic Technologies, 2016-2032
- 8.4.1. Latin America C3 Glomerulopathy Market Analysis by By Diagnostic Technologies: Introduction
- 8.4.2. Market Size Absolute $ Opportunity Analysis and Forecast, By By Diagnostic Technologies, 2016-2032
- 8.4.3. Kidney Biopsy
- 8.4.4. Immunofluorescence Microscopy
- 8.4.5. Serum Complement Testing
- 8.4.6. Other Diagnostic Technologies
- 8.5. Latin America C3 Glomerulopathy Market Analysis, Opportunity and Forecast, By By Treatment, 2016-2032
- 8.5.1. Latin America C3 Glomerulopathy Market Analysis by By Treatment: Introduction
- 8.5.2. Market Size Absolute $ Opportunity Analysis and Forecast, By By Treatment, 2016-2032
- 8.5.3. Immunosuppressive Therapy
- 8.5.4. Anti-complement Therapy
- 8.5.5. Other Treatments
- 8.6. Latin America C3 Glomerulopathy Market Analysis, Opportunity and Forecast, By By End-Users, 2016-2032
- 8.6.1. Latin America C3 Glomerulopathy Market Analysis by By End-Users: Introduction
- 8.6.2. Market Size Absolute $ Opportunity Analysis and Forecast, By By End-Users, 2016-2032
- 8.6.3. Hospitals
- 8.6.4. Specialty Clinics
- 8.6.5. Homecare
- 8.6.6. other End-Users
- 8.7. Latin America C3 Glomerulopathy Market Analysis, Opportunity and Forecast, By Country , 2016-2032
- 8.7.1. Latin America C3 Glomerulopathy Market Analysis by Country : Introduction
- 8.7.2. Market Size Absolute $ Opportunity Analysis and Forecast, Country , 2016-2032
- 8.7.2.1. Brazil
- 8.7.2.2. Colombia
- 8.7.2.3. Chile
- 8.7.2.4. Argentina
- 8.7.2.5. Costa Rica
- 8.7.2.6. Rest of Latin America
- 9. Middle East & Africa C3 Glomerulopathy Market Analysis, Opportunity and Forecast, 2016-2032
- 9.1. Middle East & Africa C3 Glomerulopathy Market Analysis, 2016-2021
- 9.2. Middle East & Africa C3 Glomerulopathy Market Opportunity and Forecast, 2023-2032
- 9.3. Middle East & Africa C3 Glomerulopathy Market Analysis, Opportunity and Forecast, By By Disease, 2016-2032
- 9.3.1. Middle East & Africa C3 Glomerulopathy Market Analysis by By Disease: Introduction
- 9.3.2. Market Size Absolute $ Opportunity Analysis and Forecast, By By Disease, 2016-2032
- 9.3.3. C3 Glomerulonephritis (C3GN)
- 9.3.4. Dense Deposit Disease (DDD)
- 9.4. Middle East & Africa C3 Glomerulopathy Market Analysis, Opportunity and Forecast, By By Diagnostic Technologies, 2016-2032
- 9.4.1. Middle East & Africa C3 Glomerulopathy Market Analysis by By Diagnostic Technologies: Introduction
- 9.4.2. Market Size Absolute $ Opportunity Analysis and Forecast, By By Diagnostic Technologies, 2016-2032
- 9.4.3. Kidney Biopsy
- 9.4.4. Immunofluorescence Microscopy
- 9.4.5. Serum Complement Testing
- 9.4.6. Other Diagnostic Technologies
- 9.5. Middle East & Africa C3 Glomerulopathy Market Analysis, Opportunity and Forecast, By By Treatment, 2016-2032
- 9.5.1. Middle East & Africa C3 Glomerulopathy Market Analysis by By Treatment: Introduction
- 9.5.2. Market Size Absolute $ Opportunity Analysis and Forecast, By By Treatment, 2016-2032
- 9.5.3. Immunosuppressive Therapy
- 9.5.4. Anti-complement Therapy
- 9.5.5. Other Treatments
- 9.6. Middle East & Africa C3 Glomerulopathy Market Analysis, Opportunity and Forecast, By By End-Users, 2016-2032
- 9.6.1. Middle East & Africa C3 Glomerulopathy Market Analysis by By End-Users: Introduction
- 9.6.2. Market Size Absolute $ Opportunity Analysis and Forecast, By By End-Users, 2016-2032
- 9.6.3. Hospitals
- 9.6.4. Specialty Clinics
- 9.6.5. Homecare
- 9.6.6. other End-Users
- 9.7. Middle East & Africa C3 Glomerulopathy Market Analysis, Opportunity and Forecast, By Country , 2016-2032
- 9.7.1. Middle East & Africa C3 Glomerulopathy Market Analysis by Country : Introduction
- 9.7.2. Market Size Absolute $ Opportunity Analysis and Forecast, Country , 2016-2032
- 9.7.2.1. Algeria
- 9.7.2.2. Egypt
- 9.7.2.3. Israel
- 9.7.2.4. Kuwait
- 9.7.2.5. Nigeria
- 9.7.2.6. Saudi Arabia
- 9.7.2.7. South Africa
- 9.7.2.8. Turkey
- 9.7.2.9. The UAE
- 9.7.2.10. Rest of MEA
- 10. Global C3 Glomerulopathy Market Analysis, Opportunity and Forecast, By Region , 2016-2032
- 10.1. Global C3 Glomerulopathy Market Analysis by Region : Introduction
- 10.2. Market Size Absolute $ Opportunity Analysis and Forecast, By Region , 2016-2032
- 10.2.1. North America
- 10.2.2. Western Europe
- 10.2.3. Eastern Europe
- 10.2.4. APAC
- 10.2.5. Latin America
- 10.2.6. Middle East & Africa
- 11. Global C3 Glomerulopathy Market Competitive Landscape, Market Share Analysis, and Company Profiles
- 11.1. Market Share Analysis
- 11.2. Company Profiles
- 11.3. Alexion Pharmaceuticals
- 11.3.1. Company Overview
- 11.3.2. Financial Highlights
- 11.3.3. Product Portfolio
- 11.3.4. SWOT Analysis
- 11.3.5. Key Strategies and Developments
- 11.4. Novartis AG
- 11.4.1. Company Overview
- 11.4.2. Financial Highlights
- 11.4.3. Product Portfolio
- 11.4.4. SWOT Analysis
- 11.4.5. Key Strategies and Developments
- 11.5. Omeros Corporation
- 11.5.1. Company Overview
- 11.5.2. Financial Highlights
- 11.5.3. Product Portfolio
- 11.5.4. SWOT Analysis
- 11.5.5. Key Strategies and Developments
- 11.6. Achillion Pharmaceuticals
- 11.6.1. Company Overview
- 11.6.2. Financial Highlights
- 11.6.3. Product Portfolio
- 11.6.4. SWOT Analysis
- 11.6.5. Key Strategies and Developments
- 11.7. Ra Pharmaceuticals
- 11.7.1. Company Overview
- 11.7.2. Financial Highlights
- 11.7.3. Product Portfolio
- 11.7.4. SWOT Analysis
- 11.7.5. Key Strategies and Developments
- 11.8. Akari Therapeutics
- 11.8.1. Company Overview
- 11.8.2. Financial Highlights
- 11.8.3. Product Portfolio
- 11.8.4. SWOT Analysis
- 11.8.5. Key Strategies and Developments
- 11.9. Apellis Pharmaceuticals
- 11.9.1. Company Overview
- 11.9.2. Financial Highlights
- 11.9.3. Product Portfolio
- 11.9.4. SWOT Analysis
- 11.9.5. Key Strategies and Developments
- 11.10. ChemoCentryx
- 11.10.1. Company Overview
- 11.10.2. Financial Highlights
- 11.10.3. Product Portfolio
- 11.10.4. SWOT Analysis
- 11.10.5. Key Strategies and Developments
- 11.11. CuraGen Corporation
- 11.11.1. Company Overview
- 11.11.2. Financial Highlights
- 11.11.3. Product Portfolio
- 11.11.4. SWOT Analysis
- 11.11.5. Key Strategies and Developments
- 11.12. Regeneron Pharmaceuticals
- 11.12.1. Company Overview
- 11.12.2. Financial Highlights
- 11.12.3. Product Portfolio
- 11.12.4. SWOT Analysis
- 11.12.5. Key Strategies and Developments
- 11.13. Other Key Players
- 11.13.1. Company Overview
- 11.13.2. Financial Highlights
- 11.13.3. Product Portfolio
- 11.13.4. SWOT Analysis
- 11.13.5. Key Strategies and Developments
- 12. Assumptions and Acronyms
- 13. Research Methodology
- 14. Contact
- List of Figures
- Figure 1: Global C3 Glomerulopathy Market Revenue (US$ Mn) Market Share by By Disease in 2022
- Figure 2: Global C3 Glomerulopathy Market Attractiveness Analysis by By Disease, 2016-2032
- Figure 3: Global C3 Glomerulopathy Market Revenue (US$ Mn) Market Share by By Diagnostic Technologiesin 2022
- Figure 4: Global C3 Glomerulopathy Market Attractiveness Analysis by By Diagnostic Technologies, 2016-2032
- Figure 5: Global C3 Glomerulopathy Market Revenue (US$ Mn) Market Share by By Treatmentin 2022
- Figure 6: Global C3 Glomerulopathy Market Attractiveness Analysis by By Treatment, 2016-2032
- Figure 7: Global C3 Glomerulopathy Market Revenue (US$ Mn) Market Share by By End-Usersin 2022
- Figure 8: Global C3 Glomerulopathy Market Attractiveness Analysis by By End-Users, 2016-2032
- Figure 9: Global C3 Glomerulopathy Market Revenue (US$ Mn) Market Share by Region in 2022
- Figure 10: Global C3 Glomerulopathy Market Attractiveness Analysis by Region, 2016-2032
- Figure 11: Global C3 Glomerulopathy Market Revenue (US$ Mn) (2016-2032)
- Figure 12: Global C3 Glomerulopathy Market Revenue (US$ Mn) Comparison by Region (2016-2032)
- Figure 13: Global C3 Glomerulopathy Market Revenue (US$ Mn) Comparison by By Disease (2016-2032)
- Figure 14: Global C3 Glomerulopathy Market Revenue (US$ Mn) Comparison by By Diagnostic Technologies (2016-2032)
- Figure 15: Global C3 Glomerulopathy Market Revenue (US$ Mn) Comparison by By Treatment (2016-2032)
- Figure 16: Global C3 Glomerulopathy Market Revenue (US$ Mn) Comparison by By End-Users (2016-2032)
- Figure 17: Global C3 Glomerulopathy Market Y-o-Y Growth Rate Comparison by Region (2016-2032)
- Figure 18: Global C3 Glomerulopathy Market Y-o-Y Growth Rate Comparison by By Disease (2016-2032)
- Figure 19: Global C3 Glomerulopathy Market Y-o-Y Growth Rate Comparison by By Diagnostic Technologies (2016-2032)
- Figure 20: Global C3 Glomerulopathy Market Y-o-Y Growth Rate Comparison by By Treatment (2016-2032)
- Figure 21: Global C3 Glomerulopathy Market Y-o-Y Growth Rate Comparison by By End-Users (2016-2032)
- Figure 22: Global C3 Glomerulopathy Market Share Comparison by Region (2016-2032)
- Figure 23: Global C3 Glomerulopathy Market Share Comparison by By Disease (2016-2032)
- Figure 24: Global C3 Glomerulopathy Market Share Comparison by By Diagnostic Technologies (2016-2032)
- Figure 25: Global C3 Glomerulopathy Market Share Comparison by By Treatment (2016-2032)
- Figure 26: Global C3 Glomerulopathy Market Share Comparison by By End-Users (2016-2032)
- Figure 27: North America C3 Glomerulopathy Market Revenue (US$ Mn) Market Share by By Diseasein 2022
- Figure 28: North America C3 Glomerulopathy Market Attractiveness Analysis by By Disease, 2016-2032
- Figure 29: North America C3 Glomerulopathy Market Revenue (US$ Mn) Market Share by By Diagnostic Technologiesin 2022
- Figure 30: North America C3 Glomerulopathy Market Attractiveness Analysis by By Diagnostic Technologies, 2016-2032
- Figure 31: North America C3 Glomerulopathy Market Revenue (US$ Mn) Market Share by By Treatmentin 2022
- Figure 32: North America C3 Glomerulopathy Market Attractiveness Analysis by By Treatment, 2016-2032
- Figure 33: North America C3 Glomerulopathy Market Revenue (US$ Mn) Market Share by By End-Usersin 2022
- Figure 34: North America C3 Glomerulopathy Market Attractiveness Analysis by By End-Users, 2016-2032
- Figure 35: North America C3 Glomerulopathy Market Revenue (US$ Mn) Market Share by Country in 2022
- Figure 36: North America C3 Glomerulopathy Market Attractiveness Analysis by Country, 2016-2032
- Figure 37: North America C3 Glomerulopathy Market Revenue (US$ Mn) (2016-2032)
- Figure 38: North America C3 Glomerulopathy Market Revenue (US$ Mn) Comparison by Country (2016-2032)
- Figure 39: North America C3 Glomerulopathy Market Revenue (US$ Mn) Comparison by By Disease (2016-2032)
- Figure 40: North America C3 Glomerulopathy Market Revenue (US$ Mn) Comparison by By Diagnostic Technologies (2016-2032)
- Figure 41: North America C3 Glomerulopathy Market Revenue (US$ Mn) Comparison by By Treatment (2016-2032)
- Figure 42: North America C3 Glomerulopathy Market Revenue (US$ Mn) Comparison by By End-Users (2016-2032)
- Figure 43: North America C3 Glomerulopathy Market Y-o-Y Growth Rate Comparison by Country (2016-2032)
- Figure 44: North America C3 Glomerulopathy Market Y-o-Y Growth Rate Comparison by By Disease (2016-2032)
- Figure 45: North America C3 Glomerulopathy Market Y-o-Y Growth Rate Comparison by By Diagnostic Technologies (2016-2032)
- Figure 46: North America C3 Glomerulopathy Market Y-o-Y Growth Rate Comparison by By Treatment (2016-2032)
- Figure 47: North America C3 Glomerulopathy Market Y-o-Y Growth Rate Comparison by By End-Users (2016-2032)
- Figure 48: North America C3 Glomerulopathy Market Share Comparison by Country (2016-2032)
- Figure 49: North America C3 Glomerulopathy Market Share Comparison by By Disease (2016-2032)
- Figure 50: North America C3 Glomerulopathy Market Share Comparison by By Diagnostic Technologies (2016-2032)
- Figure 51: North America C3 Glomerulopathy Market Share Comparison by By Treatment (2016-2032)
- Figure 52: North America C3 Glomerulopathy Market Share Comparison by By End-Users (2016-2032)
- Figure 53: Western Europe C3 Glomerulopathy Market Revenue (US$ Mn) Market Share by By Diseasein 2022
- Figure 54: Western Europe C3 Glomerulopathy Market Attractiveness Analysis by By Disease, 2016-2032
- Figure 55: Western Europe C3 Glomerulopathy Market Revenue (US$ Mn) Market Share by By Diagnostic Technologiesin 2022
- Figure 56: Western Europe C3 Glomerulopathy Market Attractiveness Analysis by By Diagnostic Technologies, 2016-2032
- Figure 57: Western Europe C3 Glomerulopathy Market Revenue (US$ Mn) Market Share by By Treatmentin 2022
- Figure 58: Western Europe C3 Glomerulopathy Market Attractiveness Analysis by By Treatment, 2016-2032
- Figure 59: Western Europe C3 Glomerulopathy Market Revenue (US$ Mn) Market Share by By End-Usersin 2022
- Figure 60: Western Europe C3 Glomerulopathy Market Attractiveness Analysis by By End-Users, 2016-2032
- Figure 61: Western Europe C3 Glomerulopathy Market Revenue (US$ Mn) Market Share by Country in 2022
- Figure 62: Western Europe C3 Glomerulopathy Market Attractiveness Analysis by Country, 2016-2032
- Figure 63: Western Europe C3 Glomerulopathy Market Revenue (US$ Mn) (2016-2032)
- Figure 64: Western Europe C3 Glomerulopathy Market Revenue (US$ Mn) Comparison by Country (2016-2032)
- Figure 65: Western Europe C3 Glomerulopathy Market Revenue (US$ Mn) Comparison by By Disease (2016-2032)
- Figure 66: Western Europe C3 Glomerulopathy Market Revenue (US$ Mn) Comparison by By Diagnostic Technologies (2016-2032)
- Figure 67: Western Europe C3 Glomerulopathy Market Revenue (US$ Mn) Comparison by By Treatment (2016-2032)
- Figure 68: Western Europe C3 Glomerulopathy Market Revenue (US$ Mn) Comparison by By End-Users (2016-2032)
- Figure 69: Western Europe C3 Glomerulopathy Market Y-o-Y Growth Rate Comparison by Country (2016-2032)
- Figure 70: Western Europe C3 Glomerulopathy Market Y-o-Y Growth Rate Comparison by By Disease (2016-2032)
- Figure 71: Western Europe C3 Glomerulopathy Market Y-o-Y Growth Rate Comparison by By Diagnostic Technologies (2016-2032)
- Figure 72: Western Europe C3 Glomerulopathy Market Y-o-Y Growth Rate Comparison by By Treatment (2016-2032)
- Figure 73: Western Europe C3 Glomerulopathy Market Y-o-Y Growth Rate Comparison by By End-Users (2016-2032)
- Figure 74: Western Europe C3 Glomerulopathy Market Share Comparison by Country (2016-2032)
- Figure 75: Western Europe C3 Glomerulopathy Market Share Comparison by By Disease (2016-2032)
- Figure 76: Western Europe C3 Glomerulopathy Market Share Comparison by By Diagnostic Technologies (2016-2032)
- Figure 77: Western Europe C3 Glomerulopathy Market Share Comparison by By Treatment (2016-2032)
- Figure 78: Western Europe C3 Glomerulopathy Market Share Comparison by By End-Users (2016-2032)
- Figure 79: Eastern Europe C3 Glomerulopathy Market Revenue (US$ Mn) Market Share by By Diseasein 2022
- Figure 80: Eastern Europe C3 Glomerulopathy Market Attractiveness Analysis by By Disease, 2016-2032
- Figure 81: Eastern Europe C3 Glomerulopathy Market Revenue (US$ Mn) Market Share by By Diagnostic Technologiesin 2022
- Figure 82: Eastern Europe C3 Glomerulopathy Market Attractiveness Analysis by By Diagnostic Technologies, 2016-2032
- Figure 83: Eastern Europe C3 Glomerulopathy Market Revenue (US$ Mn) Market Share by By Treatmentin 2022
- Figure 84: Eastern Europe C3 Glomerulopathy Market Attractiveness Analysis by By Treatment, 2016-2032
- Figure 85: Eastern Europe C3 Glomerulopathy Market Revenue (US$ Mn) Market Share by By End-Usersin 2022
- Figure 86: Eastern Europe C3 Glomerulopathy Market Attractiveness Analysis by By End-Users, 2016-2032
- Figure 87: Eastern Europe C3 Glomerulopathy Market Revenue (US$ Mn) Market Share by Country in 2022
- Figure 88: Eastern Europe C3 Glomerulopathy Market Attractiveness Analysis by Country, 2016-2032
- Figure 89: Eastern Europe C3 Glomerulopathy Market Revenue (US$ Mn) (2016-2032)
- Figure 90: Eastern Europe C3 Glomerulopathy Market Revenue (US$ Mn) Comparison by Country (2016-2032)
- Figure 91: Eastern Europe C3 Glomerulopathy Market Revenue (US$ Mn) Comparison by By Disease (2016-2032)
- Figure 92: Eastern Europe C3 Glomerulopathy Market Revenue (US$ Mn) Comparison by By Diagnostic Technologies (2016-2032)
- Figure 93: Eastern Europe C3 Glomerulopathy Market Revenue (US$ Mn) Comparison by By Treatment (2016-2032)
- Figure 94: Eastern Europe C3 Glomerulopathy Market Revenue (US$ Mn) Comparison by By End-Users (2016-2032)
- Figure 95: Eastern Europe C3 Glomerulopathy Market Y-o-Y Growth Rate Comparison by Country (2016-2032)
- Figure 96: Eastern Europe C3 Glomerulopathy Market Y-o-Y Growth Rate Comparison by By Disease (2016-2032)
- Figure 97: Eastern Europe C3 Glomerulopathy Market Y-o-Y Growth Rate Comparison by By Diagnostic Technologies (2016-2032)
- Figure 98: Eastern Europe C3 Glomerulopathy Market Y-o-Y Growth Rate Comparison by By Treatment (2016-2032)
- Figure 99: Eastern Europe C3 Glomerulopathy Market Y-o-Y Growth Rate Comparison by By End-Users (2016-2032)
- Figure 100: Eastern Europe C3 Glomerulopathy Market Share Comparison by Country (2016-2032)
- Figure 101: Eastern Europe C3 Glomerulopathy Market Share Comparison by By Disease (2016-2032)
- Figure 102: Eastern Europe C3 Glomerulopathy Market Share Comparison by By Diagnostic Technologies (2016-2032)
- Figure 103: Eastern Europe C3 Glomerulopathy Market Share Comparison by By Treatment (2016-2032)
- Figure 104: Eastern Europe C3 Glomerulopathy Market Share Comparison by By End-Users (2016-2032)
- Figure 105: APAC C3 Glomerulopathy Market Revenue (US$ Mn) Market Share by By Diseasein 2022
- Figure 106: APAC C3 Glomerulopathy Market Attractiveness Analysis by By Disease, 2016-2032
- Figure 107: APAC C3 Glomerulopathy Market Revenue (US$ Mn) Market Share by By Diagnostic Technologiesin 2022
- Figure 108: APAC C3 Glomerulopathy Market Attractiveness Analysis by By Diagnostic Technologies, 2016-2032
- Figure 109: APAC C3 Glomerulopathy Market Revenue (US$ Mn) Market Share by By Treatmentin 2022
- Figure 110: APAC C3 Glomerulopathy Market Attractiveness Analysis by By Treatment, 2016-2032
- Figure 111: APAC C3 Glomerulopathy Market Revenue (US$ Mn) Market Share by By End-Usersin 2022
- Figure 112: APAC C3 Glomerulopathy Market Attractiveness Analysis by By End-Users, 2016-2032
- Figure 113: APAC C3 Glomerulopathy Market Revenue (US$ Mn) Market Share by Country in 2022
- Figure 114: APAC C3 Glomerulopathy Market Attractiveness Analysis by Country, 2016-2032
- Figure 115: APAC C3 Glomerulopathy Market Revenue (US$ Mn) (2016-2032)
- Figure 116: APAC C3 Glomerulopathy Market Revenue (US$ Mn) Comparison by Country (2016-2032)
- Figure 117: APAC C3 Glomerulopathy Market Revenue (US$ Mn) Comparison by By Disease (2016-2032)
- Figure 118: APAC C3 Glomerulopathy Market Revenue (US$ Mn) Comparison by By Diagnostic Technologies (2016-2032)
- Figure 119: APAC C3 Glomerulopathy Market Revenue (US$ Mn) Comparison by By Treatment (2016-2032)
- Figure 120: APAC C3 Glomerulopathy Market Revenue (US$ Mn) Comparison by By End-Users (2016-2032)
- Figure 121: APAC C3 Glomerulopathy Market Y-o-Y Growth Rate Comparison by Country (2016-2032)
- Figure 122: APAC C3 Glomerulopathy Market Y-o-Y Growth Rate Comparison by By Disease (2016-2032)
- Figure 123: APAC C3 Glomerulopathy Market Y-o-Y Growth Rate Comparison by By Diagnostic Technologies (2016-2032)
- Figure 124: APAC C3 Glomerulopathy Market Y-o-Y Growth Rate Comparison by By Treatment (2016-2032)
- Figure 125: APAC C3 Glomerulopathy Market Y-o-Y Growth Rate Comparison by By End-Users (2016-2032)
- Figure 126: APAC C3 Glomerulopathy Market Share Comparison by Country (2016-2032)
- Figure 127: APAC C3 Glomerulopathy Market Share Comparison by By Disease (2016-2032)
- Figure 128: APAC C3 Glomerulopathy Market Share Comparison by By Diagnostic Technologies (2016-2032)
- Figure 129: APAC C3 Glomerulopathy Market Share Comparison by By Treatment (2016-2032)
- Figure 130: APAC C3 Glomerulopathy Market Share Comparison by By End-Users (2016-2032)
- Figure 131: Latin America C3 Glomerulopathy Market Revenue (US$ Mn) Market Share by By Diseasein 2022
- Figure 132: Latin America C3 Glomerulopathy Market Attractiveness Analysis by By Disease, 2016-2032
- Figure 133: Latin America C3 Glomerulopathy Market Revenue (US$ Mn) Market Share by By Diagnostic Technologiesin 2022
- Figure 134: Latin America C3 Glomerulopathy Market Attractiveness Analysis by By Diagnostic Technologies, 2016-2032
- Figure 135: Latin America C3 Glomerulopathy Market Revenue (US$ Mn) Market Share by By Treatmentin 2022
- Figure 136: Latin America C3 Glomerulopathy Market Attractiveness Analysis by By Treatment, 2016-2032
- Figure 137: Latin America C3 Glomerulopathy Market Revenue (US$ Mn) Market Share by By End-Usersin 2022
- Figure 138: Latin America C3 Glomerulopathy Market Attractiveness Analysis by By End-Users, 2016-2032
- Figure 139: Latin America C3 Glomerulopathy Market Revenue (US$ Mn) Market Share by Country in 2022
- Figure 140: Latin America C3 Glomerulopathy Market Attractiveness Analysis by Country, 2016-2032
- Figure 141: Latin America C3 Glomerulopathy Market Revenue (US$ Mn) (2016-2032)
- Figure 142: Latin America C3 Glomerulopathy Market Revenue (US$ Mn) Comparison by Country (2016-2032)
- Figure 143: Latin America C3 Glomerulopathy Market Revenue (US$ Mn) Comparison by By Disease (2016-2032)
- Figure 144: Latin America C3 Glomerulopathy Market Revenue (US$ Mn) Comparison by By Diagnostic Technologies (2016-2032)
- Figure 145: Latin America C3 Glomerulopathy Market Revenue (US$ Mn) Comparison by By Treatment (2016-2032)
- Figure 146: Latin America C3 Glomerulopathy Market Revenue (US$ Mn) Comparison by By End-Users (2016-2032)
- Figure 147: Latin America C3 Glomerulopathy Market Y-o-Y Growth Rate Comparison by Country (2016-2032)
- Figure 148: Latin America C3 Glomerulopathy Market Y-o-Y Growth Rate Comparison by By Disease (2016-2032)
- Figure 149: Latin America C3 Glomerulopathy Market Y-o-Y Growth Rate Comparison by By Diagnostic Technologies (2016-2032)
- Figure 150: Latin America C3 Glomerulopathy Market Y-o-Y Growth Rate Comparison by By Treatment (2016-2032)
- Figure 151: Latin America C3 Glomerulopathy Market Y-o-Y Growth Rate Comparison by By End-Users (2016-2032)
- Figure 152: Latin America C3 Glomerulopathy Market Share Comparison by Country (2016-2032)
- Figure 153: Latin America C3 Glomerulopathy Market Share Comparison by By Disease (2016-2032)
- Figure 154: Latin America C3 Glomerulopathy Market Share Comparison by By Diagnostic Technologies (2016-2032)
- Figure 155: Latin America C3 Glomerulopathy Market Share Comparison by By Treatment (2016-2032)
- Figure 156: Latin America C3 Glomerulopathy Market Share Comparison by By End-Users (2016-2032)
- Figure 157: Middle East & Africa C3 Glomerulopathy Market Revenue (US$ Mn) Market Share by By Diseasein 2022
- Figure 158: Middle East & Africa C3 Glomerulopathy Market Attractiveness Analysis by By Disease, 2016-2032
- Figure 159: Middle East & Africa C3 Glomerulopathy Market Revenue (US$ Mn) Market Share by By Diagnostic Technologiesin 2022
- Figure 160: Middle East & Africa C3 Glomerulopathy Market Attractiveness Analysis by By Diagnostic Technologies, 2016-2032
- Figure 161: Middle East & Africa C3 Glomerulopathy Market Revenue (US$ Mn) Market Share by By Treatmentin 2022
- Figure 162: Middle East & Africa C3 Glomerulopathy Market Attractiveness Analysis by By Treatment, 2016-2032
- Figure 163: Middle East & Africa C3 Glomerulopathy Market Revenue (US$ Mn) Market Share by By End-Usersin 2022
- Figure 164: Middle East & Africa C3 Glomerulopathy Market Attractiveness Analysis by By End-Users, 2016-2032
- Figure 165: Middle East & Africa C3 Glomerulopathy Market Revenue (US$ Mn) Market Share by Country in 2022
- Figure 166: Middle East & Africa C3 Glomerulopathy Market Attractiveness Analysis by Country, 2016-2032
- Figure 167: Middle East & Africa C3 Glomerulopathy Market Revenue (US$ Mn) (2016-2032)
- Figure 168: Middle East & Africa C3 Glomerulopathy Market Revenue (US$ Mn) Comparison by Country (2016-2032)
- Figure 169: Middle East & Africa C3 Glomerulopathy Market Revenue (US$ Mn) Comparison by By Disease (2016-2032)
- Figure 170: Middle East & Africa C3 Glomerulopathy Market Revenue (US$ Mn) Comparison by By Diagnostic Technologies (2016-2032)
- Figure 171: Middle East & Africa C3 Glomerulopathy Market Revenue (US$ Mn) Comparison by By Treatment (2016-2032)
- Figure 172: Middle East & Africa C3 Glomerulopathy Market Revenue (US$ Mn) Comparison by By End-Users (2016-2032)
- Figure 173: Middle East & Africa C3 Glomerulopathy Market Y-o-Y Growth Rate Comparison by Country (2016-2032)
- Figure 174: Middle East & Africa C3 Glomerulopathy Market Y-o-Y Growth Rate Comparison by By Disease (2016-2032)
- Figure 175: Middle East & Africa C3 Glomerulopathy Market Y-o-Y Growth Rate Comparison by By Diagnostic Technologies (2016-2032)
- Figure 176: Middle East & Africa C3 Glomerulopathy Market Y-o-Y Growth Rate Comparison by By Treatment (2016-2032)
- Figure 177: Middle East & Africa C3 Glomerulopathy Market Y-o-Y Growth Rate Comparison by By End-Users (2016-2032)
- Figure 178: Middle East & Africa C3 Glomerulopathy Market Share Comparison by Country (2016-2032)
- Figure 179: Middle East & Africa C3 Glomerulopathy Market Share Comparison by By Disease (2016-2032)
- Figure 180: Middle East & Africa C3 Glomerulopathy Market Share Comparison by By Diagnostic Technologies (2016-2032)
- Figure 181: Middle East & Africa C3 Glomerulopathy Market Share Comparison by By Treatment (2016-2032)
- Figure 182: Middle East & Africa C3 Glomerulopathy Market Share Comparison by By End-Users (2016-2032)
- List of Tables
- Table 1: Global C3 Glomerulopathy Market Comparison by By Disease (2016-2032)
- Table 2: Global C3 Glomerulopathy Market Comparison by By Diagnostic Technologies (2016-2032)
- Table 3: Global C3 Glomerulopathy Market Comparison by By Treatment (2016-2032)
- Table 4: Global C3 Glomerulopathy Market Comparison by By End-Users (2016-2032)
- Table 5: Global C3 Glomerulopathy Market Revenue (US$ Mn) Comparison by Region (2016-2032)
- Table 6: Global C3 Glomerulopathy Market Revenue (US$ Mn) (2016-2032)
- Table 7: Global C3 Glomerulopathy Market Revenue (US$ Mn) Comparison by Region (2016-2032)
- Table 8: Global C3 Glomerulopathy Market Revenue (US$ Mn) Comparison by By Disease (2016-2032)
- Table 9: Global C3 Glomerulopathy Market Revenue (US$ Mn) Comparison by By Diagnostic Technologies (2016-2032)
- Table 10: Global C3 Glomerulopathy Market Revenue (US$ Mn) Comparison by By Treatment (2016-2032)
- Table 11: Global C3 Glomerulopathy Market Revenue (US$ Mn) Comparison by By End-Users (2016-2032)
- Table 12: Global C3 Glomerulopathy Market Y-o-Y Growth Rate Comparison by Region (2016-2032)
- Table 13: Global C3 Glomerulopathy Market Y-o-Y Growth Rate Comparison by By Disease (2016-2032)
- Table 14: Global C3 Glomerulopathy Market Y-o-Y Growth Rate Comparison by By Diagnostic Technologies (2016-2032)
- Table 15: Global C3 Glomerulopathy Market Y-o-Y Growth Rate Comparison by By Treatment (2016-2032)
- Table 16: Global C3 Glomerulopathy Market Y-o-Y Growth Rate Comparison by By End-Users (2016-2032)
- Table 17: Global C3 Glomerulopathy Market Share Comparison by Region (2016-2032)
- Table 18: Global C3 Glomerulopathy Market Share Comparison by By Disease (2016-2032)
- Table 19: Global C3 Glomerulopathy Market Share Comparison by By Diagnostic Technologies (2016-2032)
- Table 20: Global C3 Glomerulopathy Market Share Comparison by By Treatment (2016-2032)
- Table 21: Global C3 Glomerulopathy Market Share Comparison by By End-Users (2016-2032)
- Table 22: North America C3 Glomerulopathy Market Comparison by By Diagnostic Technologies (2016-2032)
- Table 23: North America C3 Glomerulopathy Market Comparison by By Treatment (2016-2032)
- Table 24: North America C3 Glomerulopathy Market Comparison by By End-Users (2016-2032)
- Table 25: North America C3 Glomerulopathy Market Revenue (US$ Mn) Comparison by Country (2016-2032)
- Table 26: North America C3 Glomerulopathy Market Revenue (US$ Mn) (2016-2032)
- Table 27: North America C3 Glomerulopathy Market Revenue (US$ Mn) Comparison by Country (2016-2032)
- Table 28: North America C3 Glomerulopathy Market Revenue (US$ Mn) Comparison by By Disease (2016-2032)
- Table 29: North America C3 Glomerulopathy Market Revenue (US$ Mn) Comparison by By Diagnostic Technologies (2016-2032)
- Table 30: North America C3 Glomerulopathy Market Revenue (US$ Mn) Comparison by By Treatment (2016-2032)
- Table 31: North America C3 Glomerulopathy Market Revenue (US$ Mn) Comparison by By End-Users (2016-2032)
- Table 32: North America C3 Glomerulopathy Market Y-o-Y Growth Rate Comparison by Country (2016-2032)
- Table 33: North America C3 Glomerulopathy Market Y-o-Y Growth Rate Comparison by By Disease (2016-2032)
- Table 34: North America C3 Glomerulopathy Market Y-o-Y Growth Rate Comparison by By Diagnostic Technologies (2016-2032)
- Table 35: North America C3 Glomerulopathy Market Y-o-Y Growth Rate Comparison by By Treatment (2016-2032)
- Table 36: North America C3 Glomerulopathy Market Y-o-Y Growth Rate Comparison by By End-Users (2016-2032)
- Table 37: North America C3 Glomerulopathy Market Share Comparison by Country (2016-2032)
- Table 38: North America C3 Glomerulopathy Market Share Comparison by By Disease (2016-2032)
- Table 39: North America C3 Glomerulopathy Market Share Comparison by By Diagnostic Technologies (2016-2032)
- Table 40: North America C3 Glomerulopathy Market Share Comparison by By Treatment (2016-2032)
- Table 41: North America C3 Glomerulopathy Market Share Comparison by By End-Users (2016-2032)
- Table 42: Western Europe C3 Glomerulopathy Market Comparison by By Disease (2016-2032)
- Table 43: Western Europe C3 Glomerulopathy Market Comparison by By Diagnostic Technologies (2016-2032)
- Table 44: Western Europe C3 Glomerulopathy Market Comparison by By Treatment (2016-2032)
- Table 45: Western Europe C3 Glomerulopathy Market Comparison by By End-Users (2016-2032)
- Table 46: Western Europe C3 Glomerulopathy Market Revenue (US$ Mn) Comparison by Country (2016-2032)
- Table 47: Western Europe C3 Glomerulopathy Market Revenue (US$ Mn) (2016-2032)
- Table 48: Western Europe C3 Glomerulopathy Market Revenue (US$ Mn) Comparison by Country (2016-2032)
- Table 49: Western Europe C3 Glomerulopathy Market Revenue (US$ Mn) Comparison by By Disease (2016-2032)
- Table 50: Western Europe C3 Glomerulopathy Market Revenue (US$ Mn) Comparison by By Diagnostic Technologies (2016-2032)
- Table 51: Western Europe C3 Glomerulopathy Market Revenue (US$ Mn) Comparison by By Treatment (2016-2032)
- Table 52: Western Europe C3 Glomerulopathy Market Revenue (US$ Mn) Comparison by By End-Users (2016-2032)
- Table 53: Western Europe C3 Glomerulopathy Market Y-o-Y Growth Rate Comparison by Country (2016-2032)
- Table 54: Western Europe C3 Glomerulopathy Market Y-o-Y Growth Rate Comparison by By Disease (2016-2032)
- Table 55: Western Europe C3 Glomerulopathy Market Y-o-Y Growth Rate Comparison by By Diagnostic Technologies (2016-2032)
- Table 56: Western Europe C3 Glomerulopathy Market Y-o-Y Growth Rate Comparison by By Treatment (2016-2032)
- Table 57: Western Europe C3 Glomerulopathy Market Y-o-Y Growth Rate Comparison by By End-Users (2016-2032)
- Table 58: Western Europe C3 Glomerulopathy Market Share Comparison by Country (2016-2032)
- Table 59: Western Europe C3 Glomerulopathy Market Share Comparison by By Disease (2016-2032)
- Table 60: Western Europe C3 Glomerulopathy Market Share Comparison by By Diagnostic Technologies (2016-2032)
- Table 61: Western Europe C3 Glomerulopathy Market Share Comparison by By Treatment (2016-2032)
- Table 62: Western Europe C3 Glomerulopathy Market Share Comparison by By End-Users (2016-2032)
- Table 63: Eastern Europe C3 Glomerulopathy Market Comparison by By Disease (2016-2032)
- Table 64: Eastern Europe C3 Glomerulopathy Market Comparison by By Diagnostic Technologies (2016-2032)
- Table 65: Eastern Europe C3 Glomerulopathy Market Comparison by By Treatment (2016-2032)
- Table 66: Eastern Europe C3 Glomerulopathy Market Comparison by By End-Users (2016-2032)
- Table 67: Eastern Europe C3 Glomerulopathy Market Revenue (US$ Mn) Comparison by Country (2016-2032)
- Table 68: Eastern Europe C3 Glomerulopathy Market Revenue (US$ Mn) (2016-2032)
- Table 69: Eastern Europe C3 Glomerulopathy Market Revenue (US$ Mn) Comparison by Country (2016-2032)
- Table 70: Eastern Europe C3 Glomerulopathy Market Revenue (US$ Mn) Comparison by By Disease (2016-2032)
- Table 71: Eastern Europe C3 Glomerulopathy Market Revenue (US$ Mn) Comparison by By Diagnostic Technologies (2016-2032)
- Table 72: Eastern Europe C3 Glomerulopathy Market Revenue (US$ Mn) Comparison by By Treatment (2016-2032)
- Table 73: Eastern Europe C3 Glomerulopathy Market Revenue (US$ Mn) Comparison by By End-Users (2016-2032)
- Table 74: Eastern Europe C3 Glomerulopathy Market Y-o-Y Growth Rate Comparison by Country (2016-2032)
- Table 75: Eastern Europe C3 Glomerulopathy Market Y-o-Y Growth Rate Comparison by By Disease (2016-2032)
- Table 76: Eastern Europe C3 Glomerulopathy Market Y-o-Y Growth Rate Comparison by By Diagnostic Technologies (2016-2032)
- Table 77: Eastern Europe C3 Glomerulopathy Market Y-o-Y Growth Rate Comparison by By Treatment (2016-2032)
- Table 78: Eastern Europe C3 Glomerulopathy Market Y-o-Y Growth Rate Comparison by By End-Users (2016-2032)
- Table 79: Eastern Europe C3 Glomerulopathy Market Share Comparison by Country (2016-2032)
- Table 80: Eastern Europe C3 Glomerulopathy Market Share Comparison by By Disease (2016-2032)
- Table 81: Eastern Europe C3 Glomerulopathy Market Share Comparison by By Diagnostic Technologies (2016-2032)
- Table 82: Eastern Europe C3 Glomerulopathy Market Share Comparison by By Treatment (2016-2032)
- Table 83: Eastern Europe C3 Glomerulopathy Market Share Comparison by By End-Users (2016-2032)
- Table 84: APAC C3 Glomerulopathy Market Comparison by By Disease (2016-2032)
- Table 85: APAC C3 Glomerulopathy Market Comparison by By Diagnostic Technologies (2016-2032)
- Table 86: APAC C3 Glomerulopathy Market Comparison by By Treatment (2016-2032)
- Table 87: APAC C3 Glomerulopathy Market Comparison by By End-Users (2016-2032)
- Table 88: APAC C3 Glomerulopathy Market Revenue (US$ Mn) Comparison by Country (2016-2032)
- Table 89: APAC C3 Glomerulopathy Market Revenue (US$ Mn) (2016-2032)
- Table 90: APAC C3 Glomerulopathy Market Revenue (US$ Mn) Comparison by Country (2016-2032)
- Table 91: APAC C3 Glomerulopathy Market Revenue (US$ Mn) Comparison by By Disease (2016-2032)
- Table 92: APAC C3 Glomerulopathy Market Revenue (US$ Mn) Comparison by By Diagnostic Technologies (2016-2032)
- Table 93: APAC C3 Glomerulopathy Market Revenue (US$ Mn) Comparison by By Treatment (2016-2032)
- Table 94: APAC C3 Glomerulopathy Market Revenue (US$ Mn) Comparison by By End-Users (2016-2032)
- Table 95: APAC C3 Glomerulopathy Market Y-o-Y Growth Rate Comparison by Country (2016-2032)
- Table 96: APAC C3 Glomerulopathy Market Y-o-Y Growth Rate Comparison by By Disease (2016-2032)
- Table 97: APAC C3 Glomerulopathy Market Y-o-Y Growth Rate Comparison by By Diagnostic Technologies (2016-2032)
- Table 98: APAC C3 Glomerulopathy Market Y-o-Y Growth Rate Comparison by By Treatment (2016-2032)
- Table 99: APAC C3 Glomerulopathy Market Y-o-Y Growth Rate Comparison by By End-Users (2016-2032)
- Table 100: APAC C3 Glomerulopathy Market Share Comparison by Country (2016-2032)
- Table 101: APAC C3 Glomerulopathy Market Share Comparison by By Disease (2016-2032)
- Table 102: APAC C3 Glomerulopathy Market Share Comparison by By Diagnostic Technologies (2016-2032)
- Table 103: APAC C3 Glomerulopathy Market Share Comparison by By Treatment (2016-2032)
- Table 104: APAC C3 Glomerulopathy Market Share Comparison by By End-Users (2016-2032)
- Table 105: Latin America C3 Glomerulopathy Market Comparison by By Disease (2016-2032)
- Table 106: Latin America C3 Glomerulopathy Market Comparison by By Diagnostic Technologies (2016-2032)
- Table 107: Latin America C3 Glomerulopathy Market Comparison by By Treatment (2016-2032)
- Table 108: Latin America C3 Glomerulopathy Market Comparison by By End-Users (2016-2032)
- Table 109: Latin America C3 Glomerulopathy Market Revenue (US$ Mn) Comparison by Country (2016-2032)
- Table 110: Latin America C3 Glomerulopathy Market Revenue (US$ Mn) (2016-2032)
- Table 111: Latin America C3 Glomerulopathy Market Revenue (US$ Mn) Comparison by Country (2016-2032)
- Table 112: Latin America C3 Glomerulopathy Market Revenue (US$ Mn) Comparison by By Disease (2016-2032)
- Table 113: Latin America C3 Glomerulopathy Market Revenue (US$ Mn) Comparison by By Diagnostic Technologies (2016-2032)
- Table 114: Latin America C3 Glomerulopathy Market Revenue (US$ Mn) Comparison by By Treatment (2016-2032)
- Table 115: Latin America C3 Glomerulopathy Market Revenue (US$ Mn) Comparison by By End-Users (2016-2032)
- Table 116: Latin America C3 Glomerulopathy Market Y-o-Y Growth Rate Comparison by Country (2016-2032)
- Table 117: Latin America C3 Glomerulopathy Market Y-o-Y Growth Rate Comparison by By Disease (2016-2032)
- Table 118: Latin America C3 Glomerulopathy Market Y-o-Y Growth Rate Comparison by By Diagnostic Technologies (2016-2032)
- Table 119: Latin America C3 Glomerulopathy Market Y-o-Y Growth Rate Comparison by By Treatment (2016-2032)
- Table 120: Latin America C3 Glomerulopathy Market Y-o-Y Growth Rate Comparison by By End-Users (2016-2032)
- Table 121: Latin America C3 Glomerulopathy Market Share Comparison by Country (2016-2032)
- Table 122: Latin America C3 Glomerulopathy Market Share Comparison by By Disease (2016-2032)
- Table 123: Latin America C3 Glomerulopathy Market Share Comparison by By Diagnostic Technologies (2016-2032)
- Table 124: Latin America C3 Glomerulopathy Market Share Comparison by By Treatment (2016-2032)
- Table 125: Latin America C3 Glomerulopathy Market Share Comparison by By End-Users (2016-2032)
- Table 126: Middle East & Africa C3 Glomerulopathy Market Comparison by By Disease (2016-2032)
- Table 127: Middle East & Africa C3 Glomerulopathy Market Comparison by By Diagnostic Technologies (2016-2032)
- Table 128: Middle East & Africa C3 Glomerulopathy Market Comparison by By Treatment (2016-2032)
- Table 129: Middle East & Africa C3 Glomerulopathy Market Comparison by By End-Users (2016-2032)
- Table 130: Middle East & Africa C3 Glomerulopathy Market Revenue (US$ Mn) Comparison by Country (2016-2032)
- Table 131: Middle East & Africa C3 Glomerulopathy Market Revenue (US$ Mn) (2016-2032)
- Table 132: Middle East & Africa C3 Glomerulopathy Market Revenue (US$ Mn) Comparison by Country (2016-2032)
- Table 133: Middle East & Africa C3 Glomerulopathy Market Revenue (US$ Mn) Comparison by By Disease (2016-2032)
- Table 134: Middle East & Africa C3 Glomerulopathy Market Revenue (US$ Mn) Comparison by By Diagnostic Technologies (2016-2032)
- Table 135: Middle East & Africa C3 Glomerulopathy Market Revenue (US$ Mn) Comparison by By Treatment (2016-2032)
- Table 136: Middle East & Africa C3 Glomerulopathy Market Revenue (US$ Mn) Comparison by By End-Users (2016-2032)
- Table 137: Middle East & Africa C3 Glomerulopathy Market Y-o-Y Growth Rate Comparison by Country (2016-2032)
- Table 138: Middle East & Africa C3 Glomerulopathy Market Y-o-Y Growth Rate Comparison by By Disease (2016-2032)
- Table 139: Middle East & Africa C3 Glomerulopathy Market Y-o-Y Growth Rate Comparison by By Diagnostic Technologies (2016-2032)
- Table 140: Middle East & Africa C3 Glomerulopathy Market Y-o-Y Growth Rate Comparison by By Treatment (2016-2032)
- Table 141: Middle East & Africa C3 Glomerulopathy Market Y-o-Y Growth Rate Comparison by By End-Users (2016-2032)
- Table 142: Middle East & Africa C3 Glomerulopathy Market Share Comparison by Country (2016-2032)
- Table 143: Middle East & Africa C3 Glomerulopathy Market Share Comparison by By Disease (2016-2032)
- Table 144: Middle East & Africa C3 Glomerulopathy Market Share Comparison by By Diagnostic Technologies (2016-2032)
- Table 145: Middle East & Africa C3 Glomerulopathy Market Share Comparison by By Treatment (2016-2032)
- Table 146: Middle East & Africa C3 Glomerulopathy Market Share Comparison by By End-Users (2016-2032)
- 1. Executive Summary
-
- Alexion Pharmaceuticals
- Novartis AG
- Omeros Corporation
- Achillion Pharmaceuticals
- Ra Pharmaceuticals
- Akari Therapeutics
- Apellis Pharmaceuticals
- ChemoCentryx
- CuraGen Corporation
- Regeneron Pharmaceuticals
- Other Key Players
Our Clients


View Our Licence Options
