
Business Intelligence Market By Component(Solution, Services), Deployment Model(Cloud-Based deployment, On-premise deployment, other), By Application(Financial Performance and Strategy Management, Supply Chain Analytic, Others), By Region And Companies - Industry Segment Outlook, Market Assessment, Competition Scenario, Trends, And Forecast 2023-2032
-
24597
-
Jul 2023
-
174
-


-
This report was compiled by Vishwa Gaul Vishwa is an experienced market research and consulting professional with over 8 years of expertise in the ICT industry, contributing to over 700 reports across telecommunications, software, hardware, and digital solutions. Correspondence Team Lead- ICT Linkedin | Detailed Market research Methodology Our methodology involves a mix of primary research, including interviews with leading mental health experts, and secondary research from reputable medical journals and databases. View Detailed Methodology Page
-
Quick Navigation
Report Overview
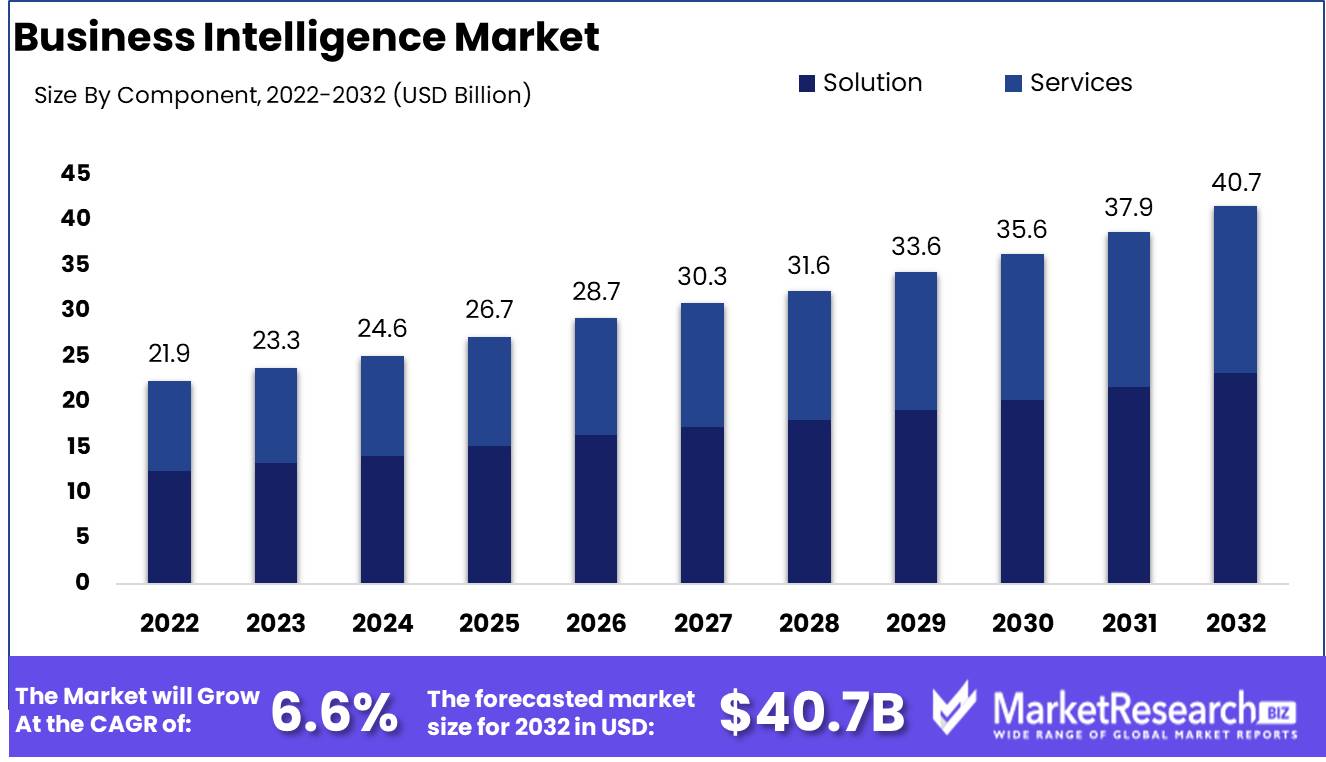
Business Intelligence Market size is expected to be worth around USD 40.7 Bn by 2032 from USD 21.9 Bn in 2022, growing at a CAGR of 6.6% during the forecast period from 2023 to 2032.
Business intelligence is a dynamic discipline that utilizes a variety of technologies, applications, and practices to collect, analyze, and present data for the purpose of making informed decisions. In today's data-driven business environment, where organizations strive to obtain a competitive edge, it plays a crucial role.
By utilizing business intelligence tools, companies can access and analyze the vast amounts of data generated by their operations, suppliers, and consumers in an efficient manner. This enables them to identify relevant trends, opportunities, and issues, resulting in improved decision-making and overall business success.
New technologies and innovations are constantly being introduced into the business intelligence market. Self-service analytics, machine learning, artificial intelligence, augmented analytics, and cloud-based solutions are recent developments. These innovations have considerably enhanced the speed, precision, and accessibility of business intelligence, making it easier for organizations of all sizes to utilize data for decision-making.
The increasing demand for business intelligence solutions has prompted significant market investments. Numerous companies have integrated business intelligence technologies into their products and services. For example, enterprise resource planning (ERP) and customer relationship management (CRM) systems now incorporate analytics functionality.
Driving factors
Increasing demand for decisions based on data
As businesses strive to obtain a market advantage, the demand for data-driven decision-making has increased significantly. Business intelligence (BI) equips organizations with the means to collect, analyze, and visualize data, allowing them to make decisions based on insights. This increasing demand for data-driven decision-making is a key factor driving the BI market.
Increasing complexity and volume of data
As a result of the proliferation of digital technologies and the Internet of Things (IoT), organizations are generating enormous amounts of data from a variety of sources. This data frequently comes in a variety of formats and is extremely complex. Business intelligence solutions enable organizations to effectively manage this vast quantity of data and extract valuable insights from it. The need to manage and derive actionable insights from massive amounts of data is a major force driving the BI market.
Increasing Adoption of Cloud-Based Business Intelligence (BI) Solutions
Cloud computing has revolutionized the access and utilization of technological resources by enterprises. The advantages of cloud-based business intelligence solutions include scalability, adaptability, and cost-effectiveness. As more organizations incorporate cloud technologies, cloud-based BI solutions are gaining popularity. As businesses seek more accessible and efficient methods to deploy and manage analytics infrastructure, this factor is driving the growth of the BI market.
Restraining Factors
Ineffective implementation of BI due to a lack of qualified professionals
The lack of a data center in the United States makes it difficult for the government to control the flow of data. Compiling and collecting data is one thing, but utilizing business intelligence dashboards for data analysis is an entirely different concept. Companies need qualified data analysts who can effectively analyze, manipulate, and interpret structured and unstructured data, identify patterns within the data, and provide timely and insightful insights.
To address this issue, organizations should invest in the recruitment, retention, and training of data analytics and business intelligence (BI) professionals. Priority should be given to the hiring of a professional and experienced individual who can independently implement and maintain a BI system.
Integration of multiple data sources for analysis is difficult
The complexity of effectively incorporating data sources is a further factor that hinders the successful implementation of BI. Frequently, companies capture data from multiple sources, such as the cloud, on-premise, ERP, CRM, social media, etc., and managing data integration between these sources can be a bottleneck. A well-designed ETL infrastructure capable of incorporating multiple data sources into the system is required for a BI integration process. Developing ETL pipelines typically requires a significant investment of time, money, and resources.
To overcome this challenge, organizations must analyze their operational and decision-making requirements and implement robust data governance and management strategies. To overcome this challenge, businesses can utilize ETL tools such as Apache Spark, Talend, or Amazon Web Services (AWS) Data Pipeline, which offer rapid data integration and processing capabilities.
Component Analysis
The Solutions Segment is presently dominating the business intelligence market, accounting for the largest revenue share. This segment includes a vast array of solutions and software applications designed to assist businesses with data analysis, reporting, and strategic decision-making. In recent years, the solutions segment has grown in popularity due to the need for businesses to obtain a deeper understanding of their operations and customers.
Emerging economies play a crucial role in propelling the adoption of the solutions segment of the business intelligence market. As businesses seek to acquire a competitive edge in their respective markets, the growth and development of these economies have generated an enormous demand for this technology.
The segment's contemporary success has also been significantly influenced by consumer trends and behavior. The proliferation of mobile devices and cloud computing has simplified consumer access to business intelligence solutions. These solutions have evolved into indispensable instruments for businesses seeking to optimize operations and enhance their decision-making abilities.
Deployment Analysis
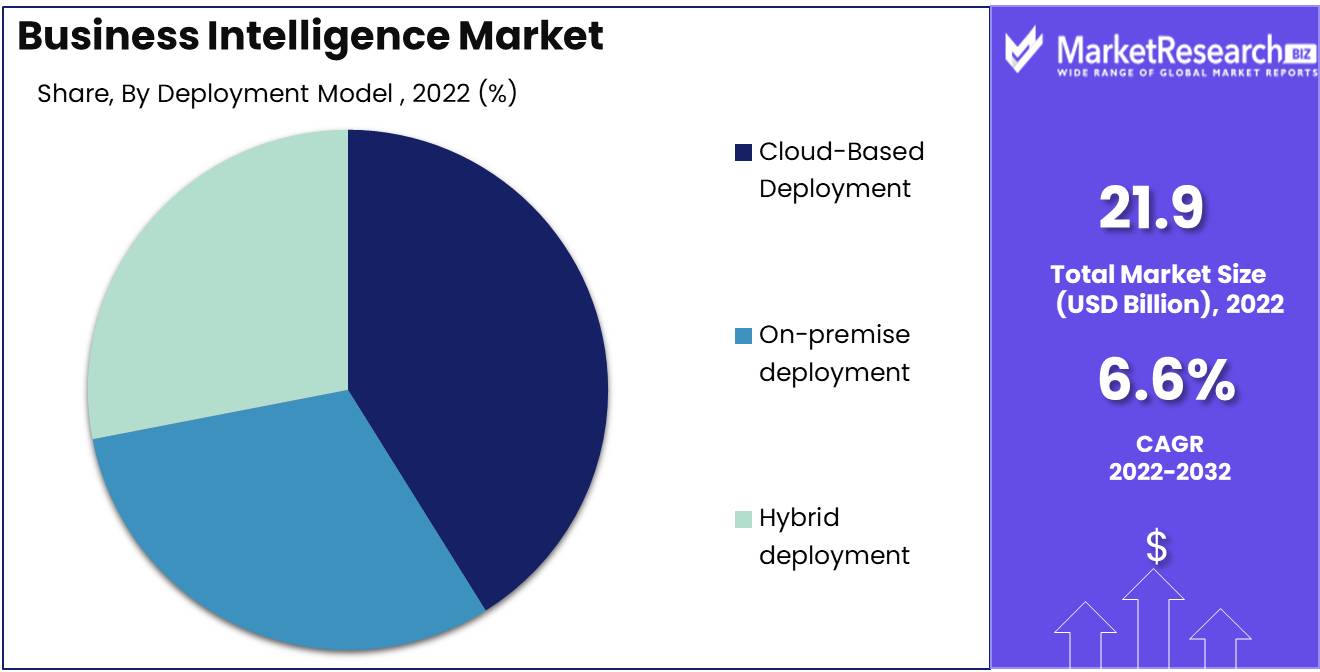
With the largest revenue share, Cloud-based deployment is currently dominating the business intelligence market. Cloud-based deployment is the delivery of a solution or application over the Internet, allowing enterprises to access it from any location or device.
Similar to the solutions segment, the adoption of cloud-based deployment in the business intelligence market is being driven by emerging economies. As businesses strive to reduce infrastructure costs and increase their agility, the need for flexible and scalable solutions has increased the demand for cloud-based deployment.
In addition to consumer trends and attitudes toward cloud-based deployment, its current success is also due to these factors. With the ability to access solutions from anywhere and on any device, cloud-based deployment has become an attractive option for enterprises. In addition, the increasing availability of high-speed internet has made cloud-based solutions more accessible to enterprises.
Application Analysis
The financial performance and strategy management segment is presently dominating the business intelligence market, accounting for the largest revenue share. This segment consists of solutions and applications designed to assist businesses in analyzing their financial performance and formulating effective strategies.
Emerging economies once again play a crucial role in promoting the adoption of this business intelligence market segment. As businesses seek to develop and compete in a market that is constantly evolving, the need for effective financial performance management and strategic decision-making has increased in significance.
In addition to consumer trends and behavior, the current success of the financial performance and strategy management market segment is also attributable to the segment's popularity. Businesses are becoming increasingly aware of the significance of effective financial management and strategy development, and this segment provides them with the resources they need to succeed.
Key Market Segments
By Component
- Solution
- Services
By Deployment Model
- Cloud-Based Deployment
- On-premise deployment
- Hybrid deployment
By Application
- Financial Performance and Strategy Management
- Supply Chain Analytic Applications
- CRM Analytic Operations
- Others
Growth Opportunity
Advanced Predictive Analytics
The rising demand for predictive analytics is a major factor driving the growth of the BI market. Predictive analytics enables organizations to obtain valuable insights into potential future events, thereby empowering them to take proactive measures. This ability to predict outcomes and trends enables businesses to make well-informed decisions that produce superior results. Finance, healthcare, and retail, among others, are utilizing predictive analytics to drive growth and optimize operations.
Evolving Data Visualization Tools
The rapid development of data visualization tools is paving the way for new opportunities in the BI market. These tools allow users to create visual representations of data, which makes it more comprehensible and facilitates in-depth analysis. By leveraging the power of data visualization, organizations are able to identify trends and patterns in their data, resulting in more informed decisions. Moreover, these tools are becoming more intuitive, thereby increasing their accessibility and democratizing data insights.
Cloud-Based Business Intelligence Solutions
Increasing adoption of cloud-based BI solutions generates an abundance of new market opportunities. The advantages of cloud-based solutions over traditional on-premises solutions include flexibility, scalability, and cost-efficiency. With cloud-based BI, businesses can access their insights from anywhere and at any time, enabling them to make data-driven decisions on the go. The adaptability and accessibility of cloud-based solutions are propelling their pervasive adoption, resulting in the expansion and innovation of the BI market.
Latest Trends
Improving Corporate Performance and Productivity
Organizations are always looking for methods to enhance their performance and productivity. This includes refining processes to reduce expenses, boosting productivity, and making more informed decisions. This is due to the fact that BI enables organizations to collect and analyze data more efficiently.
The BI tools enable managers to monitor business processes, identify trends, and take the necessary measures to enhance performance. Dashboards, for instance, provide real-time data updates, while reports can assist management in identifying potential opportunities or improvement areas.
Enhancing Knowledge of Customer Preferences and Behavior
Understanding customer preferences and behavior is essential for businesses to remain competitive. BI can assist organizations in analyzing data on customer behavior and preferences, thereby revealing their wants and requirements.
BI tools enable businesses to analyze customer data, such as purchasing history, demographics, and preferences, in order to identify trends and patterns that can be used to create more targeted marketing strategies. The company's website states that the company's goal is to provide its customers with the best possible service.
Competitive advantage derived from efficient data management
Gaining a competitive advantage in the marketplace requires efficient data management. It is essential for businesses to have effective data management strategies in place, as the quantity of data generated daily continues to grow.
BI tools provide businesses with the capacity to effectively store, manage, and analyze data. This allows businesses to make more informed decisions and respond faster to market changes. Effective data management ensures that all data is accurate, current, and readily accessible, providing businesses with a competitive advantage.
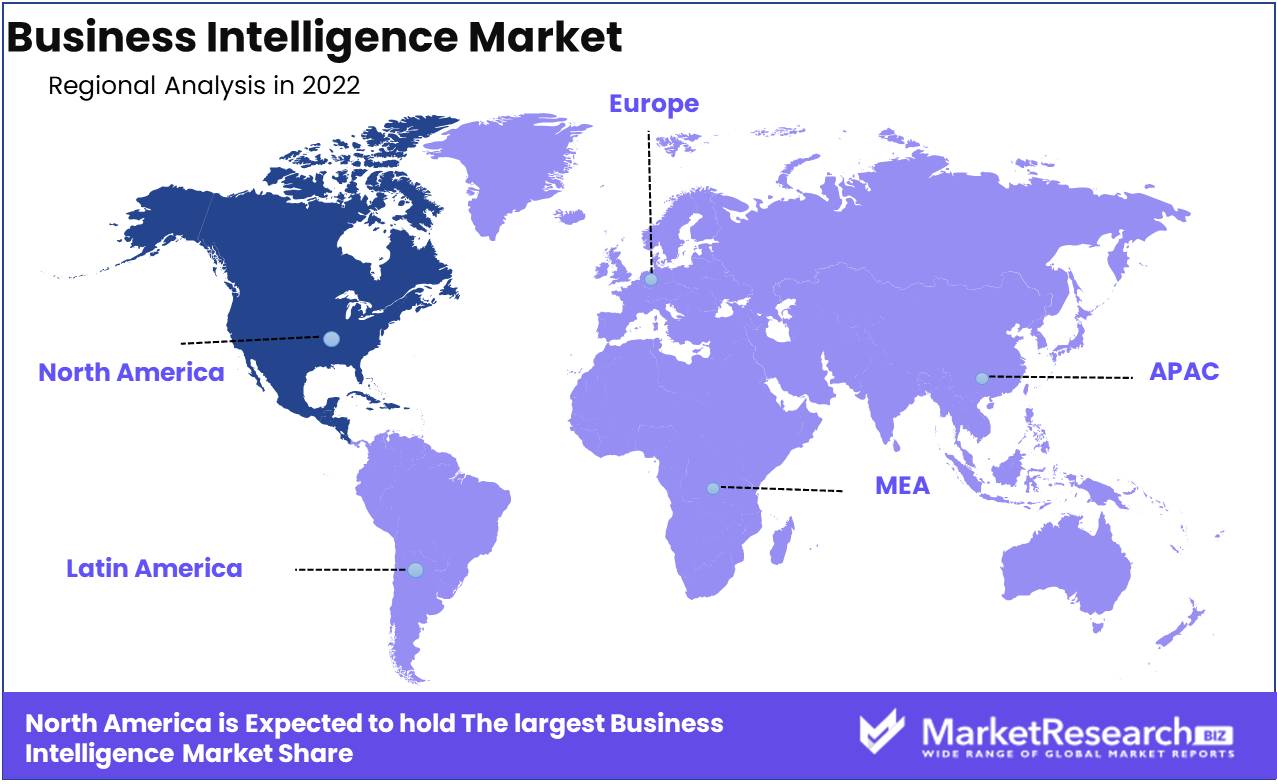
Regional Analysis
Several factors have contributed to the rise of North America as the dominant force in the business intelligence market. The dominance of the region can be attributed to technological advancements, robust infrastructure, and a strong emphasis on data-driven decision-making.
The presence of significant technology hubs like Silicon Valley in California and Seattle in Washington is one of the primary reasons for North America's dominance. These centers attract top talent and foster innovation, resulting in the creation of innovative business intelligence solutions. Numerous business intelligence market leaders, such as Microsoft, Tableau, and IBM, are headquartered in North America, further consolidating the region's dominance.
In addition, North America has a well-developed and mature IT infrastructure, including high-speed internet connectivity and cloud computing capabilities. This infrastructure enables organizations to efficiently collect, process, and analyze vast quantities of data. Additionally, the region's sophisticated infrastructure supports real-time analytics and enables businesses to make timely decisions based on data.
Key Regions and Countries
North America
- US
- Canada
- Mexico
Western Europe
- Germany
- France
- The UK
- Spain
- Italy
- Portugal
- Ireland
- Austria
- Switzerland
- Benelux
- Nordic
- Rest of Western Europe
Eastern Europe
- Russia
- Poland
- The Czech Republic
- Greece
- Rest of Eastern Europe
APAC
- China
- Japan
- South Korea
- India
- Australia & New Zealand
- Indonesia
- Malaysia
- Philippines
- Singapore
- Thailand
- Vietnam
- Rest of APAC
Latin America
- Brazil
- Colombia
- Chile
- Argentina
- Costa Rica
- Rest of Latin America
Middle East & Africa
- Algeria
- Egypt
- Israel
- Kuwait
- Nigeria
- Saudi Arabia
- South Africa
- Turkey
- United Arab Emirates
- Rest of MEA
Key Players Analysis
Power BI by Microsoft is one of the most popular business intelligence tools. It offers an intuitive interface, data visualization abilities, and seamless integration with other Microsoft products. Additionally, Microsoft offers Azure Analytics services for advanced analytics and data warehouses.
Tableau's intuitive data visualization and exploration capabilities are well-known. It enables users to create interactive dashboards and reports and offers an extensive selection of data connectors. Following its 2019 acquisition by Salesforce, Tableau has acquired further market momentum.
SAP offers an extensive suite of business intelligence solutions, which includes SAP BusinessObjects. It offers reporting, ad-hoc querying and analysis, data visualization, and data integration tools. Through its SAP Analytics Cloud platform, SAP also offers cutting-edge analytics capabilities.
IBM's business intelligence offerings include Cognos Analytics, which offers a comprehensive set of reporting, dashboarding, and data exploration features. IBM also offers Watson Analytics, an analytics platform powered by artificial intelligence that enables natural language querying and automated data insights.
Qlik offers the popular business intelligence and data visualization tools QlikView and Qlik Sense. The associative data engine of Qlik enables users to dynamically investigate data relationships, and its drag-and-drop interface simplifies data exploration and analysis.
Top Key Players in the Business Intelligence Market
- Microsoft
- IBM
- SAP
- Qlik
- Oracle
- Microstrategy
- GoodData
- Targit
- SAS
- Tableau Software
Recent Development
- In 2023, Tableau Software, a prominent provider of business intelligence and data visualization solutions, released Tableau. This new version introduces sophisticated AI-driven analytic capabilities, allowing users to discover more profound insights and make more efficient data-driven decisions.
- In 2022, Microsoft Corporation made substantial improvements to its business intelligence offerings. Power BI Premium Plus is an upgraded version of the company's popular Power BI platform. Power BI Premium Plus introduces sophisticated AI-driven data modeling capabilities, allowing users to detect relationships and patterns in their data automatically.
- In 2023, Salesforce, a prominent provider of customer relationship management (CRM) platforms, expanded its business intelligence capabilities by acquiring Tableau Software. This strategic acquisition enables Salesforce to provide its customers with a comprehensive suite of CRM and data visualization solutions, enabling businesses to gain a deeper understanding of consumer data and drive improved business outcomes.
- In 2023, Qlik Sense 2023 was introduced by Qlik Technologies, a prominent provider of business intelligence and data analytics platforms. This version introduces advanced capabilities for augmented analytics enabled by artificial intelligence and machine learning.
Report Scope
Report Features Description Market Value (2022) USD 21.9 Bn Forecast Revenue (2032) USD 40.7 Bn CAGR (2023-2032) 6.6% Base Year for Estimation 2022 Historic Period 2016-2022 Forecast Period 2023-2032 Report Coverage Revenue Forecast, Market Dynamics, COVID-19 Impact, Competitive Landscape, Recent Developments Segments Covered By Component(Solution, Services), By Deployment Model(Cloud-Based Deployment, On-premise deployment, Hybrid deployment), By Application(Financial Performance and Strategy Management, Supply Chain Analytic Applications, CRM Analytic Operations, Others) Regional Analysis North America – The US, Canada, & Mexico; Western Europe – Germany, France, The UK, Spain, Italy, Portugal, Ireland, Austria, Switzerland, Benelux, Nordic, & Rest of Western Europe; Eastern Europe – Russia, Poland, The Czech Republic, Greece, & Rest of Eastern Europe; APAC – China, Japan, South Korea, India, Australia & New Zealand, Indonesia, Malaysia, Philippines, Singapore, Thailand, Vietnam, & Rest of APAC; Latin America – Brazil, Colombia, Chile, Argentina, Costa Rica, & Rest of Latin America; Middle East & Africa – Algeria, Egypt, Israel, Kuwait, Nigeria, Saudi Arabia, South Africa, Turkey, United Arab Emirates, & Rest of MEA Competitive Landscape Microsoft, IBM, SAP, Qlik, Oracle, Microstrategy, GoodData, Targit, SAS, Tableau Software Customization Scope Customization for segments, region/country-level will be provided. Moreover, additional customization can be done based on the requirements. Purchase Options We have three licenses to opt for: Single User License, Multi-User License (Up to 5 Users), Corporate Use License (Unlimited User and Printable PDF) -
- 1. Executive Summary
- 1.1. Definition
- 1.2. Taxonomy
- 1.3. Research Scope
- 1.4. Key Analysis
- 1.5. Key Findings by Major Segments
- 1.6. Top strategies by Major Players
- 2. Global Business Intelligence Market Overview
- 2.1. Business Intelligence Market Dynamics
- 2.1.1. Drivers
- 2.1.2. Opportunities
- 2.1.3. Restraints
- 2.1.4. Challenges
- 2.2. Macro-economic Factors
- 2.3. Regulatory Framework
- 2.4. Market Investment Feasibility Index
- 2.5. PEST Analysis
- 2.6. PORTER’S Five Force Analysis
- 2.7. Drivers & Restraints Impact Analysis
- 2.8. Industry Chain Analysis
- 2.9. Cost Structure Analysis
- 2.10. Marketing Strategy
- 2.11. Russia-Ukraine War Impact Analysis
- 2.12. Opportunity Map Analysis
- 2.13. Market Competition Scenario Analysis
- 2.14. Product Life Cycle Analysis
- 2.15. Opportunity Orbits
- 2.16. Manufacturer Intensity Map
- 2.17. Major Companies sales by Value & Volume
- 2.1. Business Intelligence Market Dynamics
- 3. Global Business Intelligence Market Analysis, Opportunity and Forecast, 2016-2032
- 3.1. Global Business Intelligence Market Analysis, 2016-2021
- 3.2. Global Business Intelligence Market Opportunity and Forecast, 2023-2032
- 3.3. Global Business Intelligence Market Analysis, Opportunity and Forecast, By By Component, 2016-2032
- 3.3.1. Global Business Intelligence Market Analysis by By Component: Introduction
- 3.3.2. Market Size Absolute $ Opportunity Analysis and Forecast, By By Component, 2016-2032
- 3.3.3. Solution
- 3.3.4. Services
- 3.4. Global Business Intelligence Market Analysis, Opportunity and Forecast, By By Deployment Model, 2016-2032
- 3.4.1. Global Business Intelligence Market Analysis by By Deployment Model: Introduction
- 3.4.2. Market Size Absolute $ Opportunity Analysis and Forecast, By By Deployment Model, 2016-2032
- 3.4.3. Cloud-Based Deployment
- 3.4.4. On-premise deployment
- 3.4.5. Hybrid deployment
- 3.5. Global Business Intelligence Market Analysis, Opportunity and Forecast, By By Application, 2016-2032
- 3.5.1. Global Business Intelligence Market Analysis by By Application: Introduction
- 3.5.2. Market Size Absolute $ Opportunity Analysis and Forecast, By By Application, 2016-2032
- 3.5.3. Financial Performance and Strategy Management
- 3.5.4. Supply Chain Analytic Applications
- 3.5.5. CRM Analytic Operations
- 3.5.6. Others
- 4. North America Business Intelligence Market Analysis, Opportunity and Forecast, 2016-2032
- 4.1. North America Business Intelligence Market Analysis, 2016-2021
- 4.2. North America Business Intelligence Market Opportunity and Forecast, 2023-2032
- 4.3. North America Business Intelligence Market Analysis, Opportunity and Forecast, By By Component, 2016-2032
- 4.3.1. North America Business Intelligence Market Analysis by By Component: Introduction
- 4.3.2. Market Size Absolute $ Opportunity Analysis and Forecast, By By Component, 2016-2032
- 4.3.3. Solution
- 4.3.4. Services
- 4.4. North America Business Intelligence Market Analysis, Opportunity and Forecast, By By Deployment Model, 2016-2032
- 4.4.1. North America Business Intelligence Market Analysis by By Deployment Model: Introduction
- 4.4.2. Market Size Absolute $ Opportunity Analysis and Forecast, By By Deployment Model, 2016-2032
- 4.4.3. Cloud-Based Deployment
- 4.4.4. On-premise deployment
- 4.4.5. Hybrid deployment
- 4.5. North America Business Intelligence Market Analysis, Opportunity and Forecast, By By Application, 2016-2032
- 4.5.1. North America Business Intelligence Market Analysis by By Application: Introduction
- 4.5.2. Market Size Absolute $ Opportunity Analysis and Forecast, By By Application, 2016-2032
- 4.5.3. Financial Performance and Strategy Management
- 4.5.4. Supply Chain Analytic Applications
- 4.5.5. CRM Analytic Operations
- 4.5.6. Others
- 4.6. North America Business Intelligence Market Analysis, Opportunity and Forecast, By Country , 2016-2032
- 4.6.1. North America Business Intelligence Market Analysis by Country : Introduction
- 4.6.2. Market Size Absolute $ Opportunity Analysis and Forecast, Country , 2016-2032
- 4.6.2.1. The US
- 4.6.2.2. Canada
- 4.6.2.3. Mexico
- 5. Western Europe Business Intelligence Market Analysis, Opportunity and Forecast, 2016-2032
- 5.1. Western Europe Business Intelligence Market Analysis, 2016-2021
- 5.2. Western Europe Business Intelligence Market Opportunity and Forecast, 2023-2032
- 5.3. Western Europe Business Intelligence Market Analysis, Opportunity and Forecast, By By Component, 2016-2032
- 5.3.1. Western Europe Business Intelligence Market Analysis by By Component: Introduction
- 5.3.2. Market Size Absolute $ Opportunity Analysis and Forecast, By By Component, 2016-2032
- 5.3.3. Solution
- 5.3.4. Services
- 5.4. Western Europe Business Intelligence Market Analysis, Opportunity and Forecast, By By Deployment Model, 2016-2032
- 5.4.1. Western Europe Business Intelligence Market Analysis by By Deployment Model: Introduction
- 5.4.2. Market Size Absolute $ Opportunity Analysis and Forecast, By By Deployment Model, 2016-2032
- 5.4.3. Cloud-Based Deployment
- 5.4.4. On-premise deployment
- 5.4.5. Hybrid deployment
- 5.5. Western Europe Business Intelligence Market Analysis, Opportunity and Forecast, By By Application, 2016-2032
- 5.5.1. Western Europe Business Intelligence Market Analysis by By Application: Introduction
- 5.5.2. Market Size Absolute $ Opportunity Analysis and Forecast, By By Application, 2016-2032
- 5.5.3. Financial Performance and Strategy Management
- 5.5.4. Supply Chain Analytic Applications
- 5.5.5. CRM Analytic Operations
- 5.5.6. Others
- 5.6. Western Europe Business Intelligence Market Analysis, Opportunity and Forecast, By Country , 2016-2032
- 5.6.1. Western Europe Business Intelligence Market Analysis by Country : Introduction
- 5.6.2. Market Size Absolute $ Opportunity Analysis and Forecast, Country , 2016-2032
- 5.6.2.1. Germany
- 5.6.2.2. France
- 5.6.2.3. The UK
- 5.6.2.4. Spain
- 5.6.2.5. Italy
- 5.6.2.6. Portugal
- 5.6.2.7. Ireland
- 5.6.2.8. Austria
- 5.6.2.9. Switzerland
- 5.6.2.10. Benelux
- 5.6.2.11. Nordic
- 5.6.2.12. Rest of Western Europe
- 6. Eastern Europe Business Intelligence Market Analysis, Opportunity and Forecast, 2016-2032
- 6.1. Eastern Europe Business Intelligence Market Analysis, 2016-2021
- 6.2. Eastern Europe Business Intelligence Market Opportunity and Forecast, 2023-2032
- 6.3. Eastern Europe Business Intelligence Market Analysis, Opportunity and Forecast, By By Component, 2016-2032
- 6.3.1. Eastern Europe Business Intelligence Market Analysis by By Component: Introduction
- 6.3.2. Market Size Absolute $ Opportunity Analysis and Forecast, By By Component, 2016-2032
- 6.3.3. Solution
- 6.3.4. Services
- 6.4. Eastern Europe Business Intelligence Market Analysis, Opportunity and Forecast, By By Deployment Model, 2016-2032
- 6.4.1. Eastern Europe Business Intelligence Market Analysis by By Deployment Model: Introduction
- 6.4.2. Market Size Absolute $ Opportunity Analysis and Forecast, By By Deployment Model, 2016-2032
- 6.4.3. Cloud-Based Deployment
- 6.4.4. On-premise deployment
- 6.4.5. Hybrid deployment
- 6.5. Eastern Europe Business Intelligence Market Analysis, Opportunity and Forecast, By By Application, 2016-2032
- 6.5.1. Eastern Europe Business Intelligence Market Analysis by By Application: Introduction
- 6.5.2. Market Size Absolute $ Opportunity Analysis and Forecast, By By Application, 2016-2032
- 6.5.3. Financial Performance and Strategy Management
- 6.5.4. Supply Chain Analytic Applications
- 6.5.5. CRM Analytic Operations
- 6.5.6. Others
- 6.6. Eastern Europe Business Intelligence Market Analysis, Opportunity and Forecast, By Country , 2016-2032
- 6.6.1. Eastern Europe Business Intelligence Market Analysis by Country : Introduction
- 6.6.2. Market Size Absolute $ Opportunity Analysis and Forecast, Country , 2016-2032
- 6.6.2.1. Russia
- 6.6.2.2. Poland
- 6.6.2.3. The Czech Republic
- 6.6.2.4. Greece
- 6.6.2.5. Rest of Eastern Europe
- 7. APAC Business Intelligence Market Analysis, Opportunity and Forecast, 2016-2032
- 7.1. APAC Business Intelligence Market Analysis, 2016-2021
- 7.2. APAC Business Intelligence Market Opportunity and Forecast, 2023-2032
- 7.3. APAC Business Intelligence Market Analysis, Opportunity and Forecast, By By Component, 2016-2032
- 7.3.1. APAC Business Intelligence Market Analysis by By Component: Introduction
- 7.3.2. Market Size Absolute $ Opportunity Analysis and Forecast, By By Component, 2016-2032
- 7.3.3. Solution
- 7.3.4. Services
- 7.4. APAC Business Intelligence Market Analysis, Opportunity and Forecast, By By Deployment Model, 2016-2032
- 7.4.1. APAC Business Intelligence Market Analysis by By Deployment Model: Introduction
- 7.4.2. Market Size Absolute $ Opportunity Analysis and Forecast, By By Deployment Model, 2016-2032
- 7.4.3. Cloud-Based Deployment
- 7.4.4. On-premise deployment
- 7.4.5. Hybrid deployment
- 7.5. APAC Business Intelligence Market Analysis, Opportunity and Forecast, By By Application, 2016-2032
- 7.5.1. APAC Business Intelligence Market Analysis by By Application: Introduction
- 7.5.2. Market Size Absolute $ Opportunity Analysis and Forecast, By By Application, 2016-2032
- 7.5.3. Financial Performance and Strategy Management
- 7.5.4. Supply Chain Analytic Applications
- 7.5.5. CRM Analytic Operations
- 7.5.6. Others
- 7.6. APAC Business Intelligence Market Analysis, Opportunity and Forecast, By Country , 2016-2032
- 7.6.1. APAC Business Intelligence Market Analysis by Country : Introduction
- 7.6.2. Market Size Absolute $ Opportunity Analysis and Forecast, Country , 2016-2032
- 7.6.2.1. China
- 7.6.2.2. Japan
- 7.6.2.3. South Korea
- 7.6.2.4. India
- 7.6.2.5. Australia & New Zeland
- 7.6.2.6. Indonesia
- 7.6.2.7. Malaysia
- 7.6.2.8. Philippines
- 7.6.2.9. Singapore
- 7.6.2.10. Thailand
- 7.6.2.11. Vietnam
- 7.6.2.12. Rest of APAC
- 8. Latin America Business Intelligence Market Analysis, Opportunity and Forecast, 2016-2032
- 8.1. Latin America Business Intelligence Market Analysis, 2016-2021
- 8.2. Latin America Business Intelligence Market Opportunity and Forecast, 2023-2032
- 8.3. Latin America Business Intelligence Market Analysis, Opportunity and Forecast, By By Component, 2016-2032
- 8.3.1. Latin America Business Intelligence Market Analysis by By Component: Introduction
- 8.3.2. Market Size Absolute $ Opportunity Analysis and Forecast, By By Component, 2016-2032
- 8.3.3. Solution
- 8.3.4. Services
- 8.4. Latin America Business Intelligence Market Analysis, Opportunity and Forecast, By By Deployment Model, 2016-2032
- 8.4.1. Latin America Business Intelligence Market Analysis by By Deployment Model: Introduction
- 8.4.2. Market Size Absolute $ Opportunity Analysis and Forecast, By By Deployment Model, 2016-2032
- 8.4.3. Cloud-Based Deployment
- 8.4.4. On-premise deployment
- 8.4.5. Hybrid deployment
- 8.5. Latin America Business Intelligence Market Analysis, Opportunity and Forecast, By By Application, 2016-2032
- 8.5.1. Latin America Business Intelligence Market Analysis by By Application: Introduction
- 8.5.2. Market Size Absolute $ Opportunity Analysis and Forecast, By By Application, 2016-2032
- 8.5.3. Financial Performance and Strategy Management
- 8.5.4. Supply Chain Analytic Applications
- 8.5.5. CRM Analytic Operations
- 8.5.6. Others
- 8.6. Latin America Business Intelligence Market Analysis, Opportunity and Forecast, By Country , 2016-2032
- 8.6.1. Latin America Business Intelligence Market Analysis by Country : Introduction
- 8.6.2. Market Size Absolute $ Opportunity Analysis and Forecast, Country , 2016-2032
- 8.6.2.1. Brazil
- 8.6.2.2. Colombia
- 8.6.2.3. Chile
- 8.6.2.4. Argentina
- 8.6.2.5. Costa Rica
- 8.6.2.6. Rest of Latin America
- 9. Middle East & Africa Business Intelligence Market Analysis, Opportunity and Forecast, 2016-2032
- 9.1. Middle East & Africa Business Intelligence Market Analysis, 2016-2021
- 9.2. Middle East & Africa Business Intelligence Market Opportunity and Forecast, 2023-2032
- 9.3. Middle East & Africa Business Intelligence Market Analysis, Opportunity and Forecast, By By Component, 2016-2032
- 9.3.1. Middle East & Africa Business Intelligence Market Analysis by By Component: Introduction
- 9.3.2. Market Size Absolute $ Opportunity Analysis and Forecast, By By Component, 2016-2032
- 9.3.3. Solution
- 9.3.4. Services
- 9.4. Middle East & Africa Business Intelligence Market Analysis, Opportunity and Forecast, By By Deployment Model, 2016-2032
- 9.4.1. Middle East & Africa Business Intelligence Market Analysis by By Deployment Model: Introduction
- 9.4.2. Market Size Absolute $ Opportunity Analysis and Forecast, By By Deployment Model, 2016-2032
- 9.4.3. Cloud-Based Deployment
- 9.4.4. On-premise deployment
- 9.4.5. Hybrid deployment
- 9.5. Middle East & Africa Business Intelligence Market Analysis, Opportunity and Forecast, By By Application, 2016-2032
- 9.5.1. Middle East & Africa Business Intelligence Market Analysis by By Application: Introduction
- 9.5.2. Market Size Absolute $ Opportunity Analysis and Forecast, By By Application, 2016-2032
- 9.5.3. Financial Performance and Strategy Management
- 9.5.4. Supply Chain Analytic Applications
- 9.5.5. CRM Analytic Operations
- 9.5.6. Others
- 9.6. Middle East & Africa Business Intelligence Market Analysis, Opportunity and Forecast, By Country , 2016-2032
- 9.6.1. Middle East & Africa Business Intelligence Market Analysis by Country : Introduction
- 9.6.2. Market Size Absolute $ Opportunity Analysis and Forecast, Country , 2016-2032
- 9.6.2.1. Algeria
- 9.6.2.2. Egypt
- 9.6.2.3. Israel
- 9.6.2.4. Kuwait
- 9.6.2.5. Nigeria
- 9.6.2.6. Saudi Arabia
- 9.6.2.7. South Africa
- 9.6.2.8. Turkey
- 9.6.2.9. The UAE
- 9.6.2.10. Rest of MEA
- 10. Global Business Intelligence Market Analysis, Opportunity and Forecast, By Region , 2016-2032
- 10.1. Global Business Intelligence Market Analysis by Region : Introduction
- 10.2. Market Size Absolute $ Opportunity Analysis and Forecast, By Region , 2016-2032
- 10.2.1. North America
- 10.2.2. Western Europe
- 10.2.3. Eastern Europe
- 10.2.4. APAC
- 10.2.5. Latin America
- 10.2.6. Middle East & Africa
- 11. Global Business Intelligence Market Competitive Landscape, Market Share Analysis, and Company Profiles
- 11.1. Market Share Analysis
- 11.2. Company Profiles
- 11.3. Microsoft
- 11.3.1. Company Overview
- 11.3.2. Financial Highlights
- 11.3.3. Product Portfolio
- 11.3.4. SWOT Analysis
- 11.3.5. Key Strategies and Developments
- 11.4. IBM
- 11.4.1. Company Overview
- 11.4.2. Financial Highlights
- 11.4.3. Product Portfolio
- 11.4.4. SWOT Analysis
- 11.4.5. Key Strategies and Developments
- 11.5. SAP
- 11.5.1. Company Overview
- 11.5.2. Financial Highlights
- 11.5.3. Product Portfolio
- 11.5.4. SWOT Analysis
- 11.5.5. Key Strategies and Developments
- 11.6. Qlik
- 11.6.1. Company Overview
- 11.6.2. Financial Highlights
- 11.6.3. Product Portfolio
- 11.6.4. SWOT Analysis
- 11.6.5. Key Strategies and Developments
- 11.7. Oracle
- 11.7.1. Company Overview
- 11.7.2. Financial Highlights
- 11.7.3. Product Portfolio
- 11.7.4. SWOT Analysis
- 11.7.5. Key Strategies and Developments
- 11.8. Microstrategy
- 11.8.1. Company Overview
- 11.8.2. Financial Highlights
- 11.8.3. Product Portfolio
- 11.8.4. SWOT Analysis
- 11.8.5. Key Strategies and Developments
- 11.9. GoodData
- 11.9.1. Company Overview
- 11.9.2. Financial Highlights
- 11.9.3. Product Portfolio
- 11.9.4. SWOT Analysis
- 11.9.5. Key Strategies and Developments
- 11.10. Targit
- 11.10.1. Company Overview
- 11.10.2. Financial Highlights
- 11.10.3. Product Portfolio
- 11.10.4. SWOT Analysis
- 11.10.5. Key Strategies and Developments
- 11.11. SAS
- 11.11.1. Company Overview
- 11.11.2. Financial Highlights
- 11.11.3. Product Portfolio
- 11.11.4. SWOT Analysis
- 11.11.5. Key Strategies and Developments
- 11.12. Tableau Software
- 11.12.1. Company Overview
- 11.12.2. Financial Highlights
- 11.12.3. Product Portfolio
- 11.12.4. SWOT Analysis
- 11.12.5. Key Strategies and Developments
- 12. Assumptions and Acronyms
- 13. Research Methodology
- 14. Contact
- List of Figures
- Figure 1: Global Business Intelligence Market Revenue (US$ Mn) Market Share by Component in 2022
- Figure 2: Global Business Intelligence Market Attractiveness Analysis by Component, 2016-2032
- Figure 3: Global Business Intelligence Market Revenue (US$ Mn) Market Share by Deployment Modelin 2022
- Figure 4: Global Business Intelligence Market Attractiveness Analysis by Deployment Model, 2016-2032
- Figure 5: Global Business Intelligence Market Revenue (US$ Mn) Market Share by Applicationin 2022
- Figure 6: Global Business Intelligence Market Attractiveness Analysis by Application, 2016-2032
- Figure 7: Global Business Intelligence Market Revenue (US$ Mn) Market Share by Region in 2022
- Figure 8: Global Business Intelligence Market Attractiveness Analysis by Region, 2016-2032
- Figure 9: Global Business Intelligence Market Revenue (US$ Mn) (2016-2032)
- Figure 10: Global Business Intelligence Market Revenue (US$ Mn) Comparison by Region (2016-2032)
- Figure 11: Global Business Intelligence Market Revenue (US$ Mn) Comparison by Component (2016-2032)
- Figure 12: Global Business Intelligence Market Revenue (US$ Mn) Comparison by Deployment Model (2016-2032)
- Figure 13: Global Business Intelligence Market Revenue (US$ Mn) Comparison by Application (2016-2032)
- Figure 14: Global Business Intelligence Market Y-o-Y Growth Rate Comparison by Region (2016-2032)
- Figure 15: Global Business Intelligence Market Y-o-Y Growth Rate Comparison by Component (2016-2032)
- Figure 16: Global Business Intelligence Market Y-o-Y Growth Rate Comparison by Deployment Model (2016-2032)
- Figure 17: Global Business Intelligence Market Y-o-Y Growth Rate Comparison by Application (2016-2032)
- Figure 18: Global Business Intelligence Market Share Comparison by Region (2016-2032)
- Figure 19: Global Business Intelligence Market Share Comparison by Component (2016-2032)
- Figure 20: Global Business Intelligence Market Share Comparison by Deployment Model (2016-2032)
- Figure 21: Global Business Intelligence Market Share Comparison by Application (2016-2032)
- Figure 22: North America Business Intelligence Market Revenue (US$ Mn) Market Share by Componentin 2022
- Figure 23: North America Business Intelligence Market Attractiveness Analysis by Component, 2016-2032
- Figure 24: North America Business Intelligence Market Revenue (US$ Mn) Market Share by Deployment Modelin 2022
- Figure 25: North America Business Intelligence Market Attractiveness Analysis by Deployment Model, 2016-2032
- Figure 26: North America Business Intelligence Market Revenue (US$ Mn) Market Share by Applicationin 2022
- Figure 27: North America Business Intelligence Market Attractiveness Analysis by Application, 2016-2032
- Figure 28: North America Business Intelligence Market Revenue (US$ Mn) Market Share by Country in 2022
- Figure 29: North America Business Intelligence Market Attractiveness Analysis by Country, 2016-2032
- Figure 30: North America Business Intelligence Market Revenue (US$ Mn) (2016-2032)
- Figure 31: North America Business Intelligence Market Revenue (US$ Mn) Comparison by Country (2016-2032)
- Figure 32: North America Business Intelligence Market Revenue (US$ Mn) Comparison by Component (2016-2032)
- Figure 33: North America Business Intelligence Market Revenue (US$ Mn) Comparison by Deployment Model (2016-2032)
- Figure 34: North America Business Intelligence Market Revenue (US$ Mn) Comparison by Application (2016-2032)
- Figure 35: North America Business Intelligence Market Y-o-Y Growth Rate Comparison by Country (2016-2032)
- Figure 36: North America Business Intelligence Market Y-o-Y Growth Rate Comparison by Component (2016-2032)
- Figure 37: North America Business Intelligence Market Y-o-Y Growth Rate Comparison by Deployment Model (2016-2032)
- Figure 38: North America Business Intelligence Market Y-o-Y Growth Rate Comparison by Application (2016-2032)
- Figure 39: North America Business Intelligence Market Share Comparison by Country (2016-2032)
- Figure 40: North America Business Intelligence Market Share Comparison by Component (2016-2032)
- Figure 41: North America Business Intelligence Market Share Comparison by Deployment Model (2016-2032)
- Figure 42: North America Business Intelligence Market Share Comparison by Application (2016-2032)
- Figure 43: Western Europe Business Intelligence Market Revenue (US$ Mn) Market Share by Componentin 2022
- Figure 44: Western Europe Business Intelligence Market Attractiveness Analysis by Component, 2016-2032
- Figure 45: Western Europe Business Intelligence Market Revenue (US$ Mn) Market Share by Deployment Modelin 2022
- Figure 46: Western Europe Business Intelligence Market Attractiveness Analysis by Deployment Model, 2016-2032
- Figure 47: Western Europe Business Intelligence Market Revenue (US$ Mn) Market Share by Applicationin 2022
- Figure 48: Western Europe Business Intelligence Market Attractiveness Analysis by Application, 2016-2032
- Figure 49: Western Europe Business Intelligence Market Revenue (US$ Mn) Market Share by Country in 2022
- Figure 50: Western Europe Business Intelligence Market Attractiveness Analysis by Country, 2016-2032
- Figure 51: Western Europe Business Intelligence Market Revenue (US$ Mn) (2016-2032)
- Figure 52: Western Europe Business Intelligence Market Revenue (US$ Mn) Comparison by Country (2016-2032)
- Figure 53: Western Europe Business Intelligence Market Revenue (US$ Mn) Comparison by Component (2016-2032)
- Figure 54: Western Europe Business Intelligence Market Revenue (US$ Mn) Comparison by Deployment Model (2016-2032)
- Figure 55: Western Europe Business Intelligence Market Revenue (US$ Mn) Comparison by Application (2016-2032)
- Figure 56: Western Europe Business Intelligence Market Y-o-Y Growth Rate Comparison by Country (2016-2032)
- Figure 57: Western Europe Business Intelligence Market Y-o-Y Growth Rate Comparison by Component (2016-2032)
- Figure 58: Western Europe Business Intelligence Market Y-o-Y Growth Rate Comparison by Deployment Model (2016-2032)
- Figure 59: Western Europe Business Intelligence Market Y-o-Y Growth Rate Comparison by Application (2016-2032)
- Figure 60: Western Europe Business Intelligence Market Share Comparison by Country (2016-2032)
- Figure 61: Western Europe Business Intelligence Market Share Comparison by Component (2016-2032)
- Figure 62: Western Europe Business Intelligence Market Share Comparison by Deployment Model (2016-2032)
- Figure 63: Western Europe Business Intelligence Market Share Comparison by Application (2016-2032)
- Figure 64: Eastern Europe Business Intelligence Market Revenue (US$ Mn) Market Share by Componentin 2022
- Figure 65: Eastern Europe Business Intelligence Market Attractiveness Analysis by Component, 2016-2032
- Figure 66: Eastern Europe Business Intelligence Market Revenue (US$ Mn) Market Share by Deployment Modelin 2022
- Figure 67: Eastern Europe Business Intelligence Market Attractiveness Analysis by Deployment Model, 2016-2032
- Figure 68: Eastern Europe Business Intelligence Market Revenue (US$ Mn) Market Share by Applicationin 2022
- Figure 69: Eastern Europe Business Intelligence Market Attractiveness Analysis by Application, 2016-2032
- Figure 70: Eastern Europe Business Intelligence Market Revenue (US$ Mn) Market Share by Country in 2022
- Figure 71: Eastern Europe Business Intelligence Market Attractiveness Analysis by Country, 2016-2032
- Figure 72: Eastern Europe Business Intelligence Market Revenue (US$ Mn) (2016-2032)
- Figure 73: Eastern Europe Business Intelligence Market Revenue (US$ Mn) Comparison by Country (2016-2032)
- Figure 74: Eastern Europe Business Intelligence Market Revenue (US$ Mn) Comparison by Component (2016-2032)
- Figure 75: Eastern Europe Business Intelligence Market Revenue (US$ Mn) Comparison by Deployment Model (2016-2032)
- Figure 76: Eastern Europe Business Intelligence Market Revenue (US$ Mn) Comparison by Application (2016-2032)
- Figure 77: Eastern Europe Business Intelligence Market Y-o-Y Growth Rate Comparison by Country (2016-2032)
- Figure 78: Eastern Europe Business Intelligence Market Y-o-Y Growth Rate Comparison by Component (2016-2032)
- Figure 79: Eastern Europe Business Intelligence Market Y-o-Y Growth Rate Comparison by Deployment Model (2016-2032)
- Figure 80: Eastern Europe Business Intelligence Market Y-o-Y Growth Rate Comparison by Application (2016-2032)
- Figure 81: Eastern Europe Business Intelligence Market Share Comparison by Country (2016-2032)
- Figure 82: Eastern Europe Business Intelligence Market Share Comparison by Component (2016-2032)
- Figure 83: Eastern Europe Business Intelligence Market Share Comparison by Deployment Model (2016-2032)
- Figure 84: Eastern Europe Business Intelligence Market Share Comparison by Application (2016-2032)
- Figure 85: APAC Business Intelligence Market Revenue (US$ Mn) Market Share by Componentin 2022
- Figure 86: APAC Business Intelligence Market Attractiveness Analysis by Component, 2016-2032
- Figure 87: APAC Business Intelligence Market Revenue (US$ Mn) Market Share by Deployment Modelin 2022
- Figure 88: APAC Business Intelligence Market Attractiveness Analysis by Deployment Model, 2016-2032
- Figure 89: APAC Business Intelligence Market Revenue (US$ Mn) Market Share by Applicationin 2022
- Figure 90: APAC Business Intelligence Market Attractiveness Analysis by Application, 2016-2032
- Figure 91: APAC Business Intelligence Market Revenue (US$ Mn) Market Share by Country in 2022
- Figure 92: APAC Business Intelligence Market Attractiveness Analysis by Country, 2016-2032
- Figure 93: APAC Business Intelligence Market Revenue (US$ Mn) (2016-2032)
- Figure 94: APAC Business Intelligence Market Revenue (US$ Mn) Comparison by Country (2016-2032)
- Figure 95: APAC Business Intelligence Market Revenue (US$ Mn) Comparison by Component (2016-2032)
- Figure 96: APAC Business Intelligence Market Revenue (US$ Mn) Comparison by Deployment Model (2016-2032)
- Figure 97: APAC Business Intelligence Market Revenue (US$ Mn) Comparison by Application (2016-2032)
- Figure 98: APAC Business Intelligence Market Y-o-Y Growth Rate Comparison by Country (2016-2032)
- Figure 99: APAC Business Intelligence Market Y-o-Y Growth Rate Comparison by Component (2016-2032)
- Figure 100: APAC Business Intelligence Market Y-o-Y Growth Rate Comparison by Deployment Model (2016-2032)
- Figure 101: APAC Business Intelligence Market Y-o-Y Growth Rate Comparison by Application (2016-2032)
- Figure 102: APAC Business Intelligence Market Share Comparison by Country (2016-2032)
- Figure 103: APAC Business Intelligence Market Share Comparison by Component (2016-2032)
- Figure 104: APAC Business Intelligence Market Share Comparison by Deployment Model (2016-2032)
- Figure 105: APAC Business Intelligence Market Share Comparison by Application (2016-2032)
- Figure 106: Latin America Business Intelligence Market Revenue (US$ Mn) Market Share by Componentin 2022
- Figure 107: Latin America Business Intelligence Market Attractiveness Analysis by Component, 2016-2032
- Figure 108: Latin America Business Intelligence Market Revenue (US$ Mn) Market Share by Deployment Modelin 2022
- Figure 109: Latin America Business Intelligence Market Attractiveness Analysis by Deployment Model, 2016-2032
- Figure 110: Latin America Business Intelligence Market Revenue (US$ Mn) Market Share by Applicationin 2022
- Figure 111: Latin America Business Intelligence Market Attractiveness Analysis by Application, 2016-2032
- Figure 112: Latin America Business Intelligence Market Revenue (US$ Mn) Market Share by Country in 2022
- Figure 113: Latin America Business Intelligence Market Attractiveness Analysis by Country, 2016-2032
- Figure 114: Latin America Business Intelligence Market Revenue (US$ Mn) (2016-2032)
- Figure 115: Latin America Business Intelligence Market Revenue (US$ Mn) Comparison by Country (2016-2032)
- Figure 116: Latin America Business Intelligence Market Revenue (US$ Mn) Comparison by Component (2016-2032)
- Figure 117: Latin America Business Intelligence Market Revenue (US$ Mn) Comparison by Deployment Model (2016-2032)
- Figure 118: Latin America Business Intelligence Market Revenue (US$ Mn) Comparison by Application (2016-2032)
- Figure 119: Latin America Business Intelligence Market Y-o-Y Growth Rate Comparison by Country (2016-2032)
- Figure 120: Latin America Business Intelligence Market Y-o-Y Growth Rate Comparison by Component (2016-2032)
- Figure 121: Latin America Business Intelligence Market Y-o-Y Growth Rate Comparison by Deployment Model (2016-2032)
- Figure 122: Latin America Business Intelligence Market Y-o-Y Growth Rate Comparison by Application (2016-2032)
- Figure 123: Latin America Business Intelligence Market Share Comparison by Country (2016-2032)
- Figure 124: Latin America Business Intelligence Market Share Comparison by Component (2016-2032)
- Figure 125: Latin America Business Intelligence Market Share Comparison by Deployment Model (2016-2032)
- Figure 126: Latin America Business Intelligence Market Share Comparison by Application (2016-2032)
- Figure 127: Middle East & Africa Business Intelligence Market Revenue (US$ Mn) Market Share by Componentin 2022
- Figure 128: Middle East & Africa Business Intelligence Market Attractiveness Analysis by Component, 2016-2032
- Figure 129: Middle East & Africa Business Intelligence Market Revenue (US$ Mn) Market Share by Deployment Modelin 2022
- Figure 130: Middle East & Africa Business Intelligence Market Attractiveness Analysis by Deployment Model, 2016-2032
- Figure 131: Middle East & Africa Business Intelligence Market Revenue (US$ Mn) Market Share by Applicationin 2022
- Figure 132: Middle East & Africa Business Intelligence Market Attractiveness Analysis by Application, 2016-2032
- Figure 133: Middle East & Africa Business Intelligence Market Revenue (US$ Mn) Market Share by Country in 2022
- Figure 134: Middle East & Africa Business Intelligence Market Attractiveness Analysis by Country, 2016-2032
- Figure 135: Middle East & Africa Business Intelligence Market Revenue (US$ Mn) (2016-2032)
- Figure 136: Middle East & Africa Business Intelligence Market Revenue (US$ Mn) Comparison by Country (2016-2032)
- Figure 137: Middle East & Africa Business Intelligence Market Revenue (US$ Mn) Comparison by Component (2016-2032)
- Figure 138: Middle East & Africa Business Intelligence Market Revenue (US$ Mn) Comparison by Deployment Model (2016-2032)
- Figure 139: Middle East & Africa Business Intelligence Market Revenue (US$ Mn) Comparison by Application (2016-2032)
- Figure 140: Middle East & Africa Business Intelligence Market Y-o-Y Growth Rate Comparison by Country (2016-2032)
- Figure 141: Middle East & Africa Business Intelligence Market Y-o-Y Growth Rate Comparison by Component (2016-2032)
- Figure 142: Middle East & Africa Business Intelligence Market Y-o-Y Growth Rate Comparison by Deployment Model (2016-2032)
- Figure 143: Middle East & Africa Business Intelligence Market Y-o-Y Growth Rate Comparison by Application (2016-2032)
- Figure 144: Middle East & Africa Business Intelligence Market Share Comparison by Country (2016-2032)
- Figure 145: Middle East & Africa Business Intelligence Market Share Comparison by Component (2016-2032)
- Figure 146: Middle East & Africa Business Intelligence Market Share Comparison by Deployment Model (2016-2032)
- Figure 147: Middle East & Africa Business Intelligence Market Share Comparison by Application (2016-2032)
List of Tables
- Table 1: Global Business Intelligence Market Market Comparison by Component (2016-2032)
- Table 2: Global Business Intelligence Market Market Comparison by Deployment Model (2016-2032)
- Table 3: Global Business Intelligence Market Market Comparison by Application (2016-2032)
- Table 4: Global Business Intelligence Market Revenue (US$ Mn) Comparison by Region (2016-2032)
- Table 5: Global Business Intelligence Market Market Revenue (US$ Mn) (2016-2032)
- Table 6: Global Business Intelligence Market Market Revenue (US$ Mn) Comparison by Region (2016-2032)
- Table 7: Global Business Intelligence Market Market Revenue (US$ Mn) Comparison by Component (2016-2032)
- Table 8: Global Business Intelligence Market Market Revenue (US$ Mn) Comparison by Deployment Model (2016-2032)
- Table 9: Global Business Intelligence Market Market Revenue (US$ Mn) Comparison by Application (2016-2032)
- Table 10: Global Business Intelligence Market Market Y-o-Y Growth Rate Comparison by Region (2016-2032)
- Table 11: Global Business Intelligence Market Market Y-o-Y Growth Rate Comparison by Component (2016-2032)
- Table 12: Global Business Intelligence Market Market Y-o-Y Growth Rate Comparison by Deployment Model (2016-2032)
- Table 13: Global Business Intelligence Market Market Y-o-Y Growth Rate Comparison by Application (2016-2032)
- Table 14: Global Business Intelligence Market Market Share Comparison by Region (2016-2032)
- Table 15: Global Business Intelligence Market Market Share Comparison by Component (2016-2032)
- Table 16: Global Business Intelligence Market Market Share Comparison by Deployment Model (2016-2032)
- Table 17: Global Business Intelligence Market Market Share Comparison by Application (2016-2032)
- Table 18: North America Business Intelligence Market Market Comparison by Deployment Model (2016-2032)
- Table 19: North America Business Intelligence Market Market Comparison by Application (2016-2032)
- Table 20: North America Business Intelligence Market Revenue (US$ Mn) Comparison by Country (2016-2032)
- Table 21: North America Business Intelligence Market Market Revenue (US$ Mn) (2016-2032)
- Table 22: North America Business Intelligence Market Market Revenue (US$ Mn) Comparison by Country (2016-2032)
- Table 23: North America Business Intelligence Market Market Revenue (US$ Mn) Comparison by Component (2016-2032)
- Table 24: North America Business Intelligence Market Market Revenue (US$ Mn) Comparison by Deployment Model (2016-2032)
- Table 25: North America Business Intelligence Market Market Revenue (US$ Mn) Comparison by Application (2016-2032)
- Table 26: North America Business Intelligence Market Market Y-o-Y Growth Rate Comparison by Country (2016-2032)
- Table 27: North America Business Intelligence Market Market Y-o-Y Growth Rate Comparison by Component (2016-2032)
- Table 28: North America Business Intelligence Market Market Y-o-Y Growth Rate Comparison by Deployment Model (2016-2032)
- Table 29: North America Business Intelligence Market Market Y-o-Y Growth Rate Comparison by Application (2016-2032)
- Table 30: North America Business Intelligence Market Market Share Comparison by Country (2016-2032)
- Table 31: North America Business Intelligence Market Market Share Comparison by Component (2016-2032)
- Table 32: North America Business Intelligence Market Market Share Comparison by Deployment Model (2016-2032)
- Table 33: North America Business Intelligence Market Market Share Comparison by Application (2016-2032)
- Table 34: Western Europe Business Intelligence Market Market Comparison by Component (2016-2032)
- Table 35: Western Europe Business Intelligence Market Market Comparison by Deployment Model (2016-2032)
- Table 36: Western Europe Business Intelligence Market Market Comparison by Application (2016-2032)
- Table 37: Western Europe Business Intelligence Market Revenue (US$ Mn) Comparison by Country (2016-2032)
- Table 38: Western Europe Business Intelligence Market Market Revenue (US$ Mn) (2016-2032)
- Table 39: Western Europe Business Intelligence Market Market Revenue (US$ Mn) Comparison by Country (2016-2032)
- Table 40: Western Europe Business Intelligence Market Market Revenue (US$ Mn) Comparison by Component (2016-2032)
- Table 41: Western Europe Business Intelligence Market Market Revenue (US$ Mn) Comparison by Deployment Model (2016-2032)
- Table 42: Western Europe Business Intelligence Market Market Revenue (US$ Mn) Comparison by Application (2016-2032)
- Table 43: Western Europe Business Intelligence Market Market Y-o-Y Growth Rate Comparison by Country (2016-2032)
- Table 44: Western Europe Business Intelligence Market Market Y-o-Y Growth Rate Comparison by Component (2016-2032)
- Table 45: Western Europe Business Intelligence Market Market Y-o-Y Growth Rate Comparison by Deployment Model (2016-2032)
- Table 46: Western Europe Business Intelligence Market Market Y-o-Y Growth Rate Comparison by Application (2016-2032)
- Table 47: Western Europe Business Intelligence Market Market Share Comparison by Country (2016-2032)
- Table 48: Western Europe Business Intelligence Market Market Share Comparison by Component (2016-2032)
- Table 49: Western Europe Business Intelligence Market Market Share Comparison by Deployment Model (2016-2032)
- Table 50: Western Europe Business Intelligence Market Market Share Comparison by Application (2016-2032)
- Table 51: Eastern Europe Business Intelligence Market Market Comparison by Component (2016-2032)
- Table 52: Eastern Europe Business Intelligence Market Market Comparison by Deployment Model (2016-2032)
- Table 53: Eastern Europe Business Intelligence Market Market Comparison by Application (2016-2032)
- Table 54: Eastern Europe Business Intelligence Market Revenue (US$ Mn) Comparison by Country (2016-2032)
- Table 55: Eastern Europe Business Intelligence Market Market Revenue (US$ Mn) (2016-2032)
- Table 56: Eastern Europe Business Intelligence Market Market Revenue (US$ Mn) Comparison by Country (2016-2032)
- Table 57: Eastern Europe Business Intelligence Market Market Revenue (US$ Mn) Comparison by Component (2016-2032)
- Table 58: Eastern Europe Business Intelligence Market Market Revenue (US$ Mn) Comparison by Deployment Model (2016-2032)
- Table 59: Eastern Europe Business Intelligence Market Market Revenue (US$ Mn) Comparison by Application (2016-2032)
- Table 60: Eastern Europe Business Intelligence Market Market Y-o-Y Growth Rate Comparison by Country (2016-2032)
- Table 61: Eastern Europe Business Intelligence Market Market Y-o-Y Growth Rate Comparison by Component (2016-2032)
- Table 62: Eastern Europe Business Intelligence Market Market Y-o-Y Growth Rate Comparison by Deployment Model (2016-2032)
- Table 63: Eastern Europe Business Intelligence Market Market Y-o-Y Growth Rate Comparison by Application (2016-2032)
- Table 64: Eastern Europe Business Intelligence Market Market Share Comparison by Country (2016-2032)
- Table 65: Eastern Europe Business Intelligence Market Market Share Comparison by Component (2016-2032)
- Table 66: Eastern Europe Business Intelligence Market Market Share Comparison by Deployment Model (2016-2032)
- Table 67: Eastern Europe Business Intelligence Market Market Share Comparison by Application (2016-2032)
- Table 68: APAC Business Intelligence Market Market Comparison by Component (2016-2032)
- Table 69: APAC Business Intelligence Market Market Comparison by Deployment Model (2016-2032)
- Table 70: APAC Business Intelligence Market Market Comparison by Application (2016-2032)
- Table 71: APAC Business Intelligence Market Revenue (US$ Mn) Comparison by Country (2016-2032)
- Table 72: APAC Business Intelligence Market Market Revenue (US$ Mn) (2016-2032)
- Table 73: APAC Business Intelligence Market Market Revenue (US$ Mn) Comparison by Country (2016-2032)
- Table 74: APAC Business Intelligence Market Market Revenue (US$ Mn) Comparison by Component (2016-2032)
- Table 75: APAC Business Intelligence Market Market Revenue (US$ Mn) Comparison by Deployment Model (2016-2032)
- Table 76: APAC Business Intelligence Market Market Revenue (US$ Mn) Comparison by Application (2016-2032)
- Table 77: APAC Business Intelligence Market Market Y-o-Y Growth Rate Comparison by Country (2016-2032)
- Table 78: APAC Business Intelligence Market Market Y-o-Y Growth Rate Comparison by Component (2016-2032)
- Table 79: APAC Business Intelligence Market Market Y-o-Y Growth Rate Comparison by Deployment Model (2016-2032)
- Table 80: APAC Business Intelligence Market Market Y-o-Y Growth Rate Comparison by Application (2016-2032)
- Table 81: APAC Business Intelligence Market Market Share Comparison by Country (2016-2032)
- Table 82: APAC Business Intelligence Market Market Share Comparison by Component (2016-2032)
- Table 83: APAC Business Intelligence Market Market Share Comparison by Deployment Model (2016-2032)
- Table 84: APAC Business Intelligence Market Market Share Comparison by Application (2016-2032)
- Table 85: Latin America Business Intelligence Market Market Comparison by Component (2016-2032)
- Table 86: Latin America Business Intelligence Market Market Comparison by Deployment Model (2016-2032)
- Table 87: Latin America Business Intelligence Market Market Comparison by Application (2016-2032)
- Table 88: Latin America Business Intelligence Market Revenue (US$ Mn) Comparison by Country (2016-2032)
- Table 89: Latin America Business Intelligence Market Market Revenue (US$ Mn) (2016-2032)
- Table 90: Latin America Business Intelligence Market Market Revenue (US$ Mn) Comparison by Country (2016-2032)
- Table 91: Latin America Business Intelligence Market Market Revenue (US$ Mn) Comparison by Component (2016-2032)
- Table 92: Latin America Business Intelligence Market Market Revenue (US$ Mn) Comparison by Deployment Model (2016-2032)
- Table 93: Latin America Business Intelligence Market Market Revenue (US$ Mn) Comparison by Application (2016-2032)
- Table 94: Latin America Business Intelligence Market Market Y-o-Y Growth Rate Comparison by Country (2016-2032)
- Table 95: Latin America Business Intelligence Market Market Y-o-Y Growth Rate Comparison by Component (2016-2032)
- Table 96: Latin America Business Intelligence Market Market Y-o-Y Growth Rate Comparison by Deployment Model (2016-2032)
- Table 97: Latin America Business Intelligence Market Market Y-o-Y Growth Rate Comparison by Application (2016-2032)
- Table 98: Latin America Business Intelligence Market Market Share Comparison by Country (2016-2032)
- Table 99: Latin America Business Intelligence Market Market Share Comparison by Component (2016-2032)
- Table 100: Latin America Business Intelligence Market Market Share Comparison by Deployment Model (2016-2032)
- Table 101: Latin America Business Intelligence Market Market Share Comparison by Application (2016-2032)
- Table 102: Middle East & Africa Business Intelligence Market Market Comparison by Component (2016-2032)
- Table 103: Middle East & Africa Business Intelligence Market Market Comparison by Deployment Model (2016-2032)
- Table 104: Middle East & Africa Business Intelligence Market Market Comparison by Application (2016-2032)
- Table 105: Middle East & Africa Business Intelligence Market Revenue (US$ Mn) Comparison by Country (2016-2032)
- Table 106: Middle East & Africa Business Intelligence Market Market Revenue (US$ Mn) (2016-2032)
- Table 107: Middle East & Africa Business Intelligence Market Market Revenue (US$ Mn) Comparison by Country (2016-2032)
- Table 108: Middle East & Africa Business Intelligence Market Market Revenue (US$ Mn) Comparison by Component (2016-2032)
- Table 109: Middle East & Africa Business Intelligence Market Market Revenue (US$ Mn) Comparison by Deployment Model (2016-2032)
- Table 110: Middle East & Africa Business Intelligence Market Market Revenue (US$ Mn) Comparison by Application (2016-2032)
- Table 111: Middle East & Africa Business Intelligence Market Market Y-o-Y Growth Rate Comparison by Country (2016-2032)
- Table 112: Middle East & Africa Business Intelligence Market Market Y-o-Y Growth Rate Comparison by Component (2016-2032)
- Table 113: Middle East & Africa Business Intelligence Market Market Y-o-Y Growth Rate Comparison by Deployment Model (2016-2032)
- Table 114: Middle East & Africa Business Intelligence Market Market Y-o-Y Growth Rate Comparison by Application (2016-2032)
- Table 115: Middle East & Africa Business Intelligence Market Market Share Comparison by Country (2016-2032)
- Table 116: Middle East & Africa Business Intelligence Market Market Share Comparison by Component (2016-2032)
- Table 117: Middle East & Africa Business Intelligence Market Market Share Comparison by Deployment Model (2016-2032)
- Table 118: Middle East & Africa Business Intelligence Market Market Share Comparison by Application (2016-2032)
- 1. Executive Summary
-
- Microsoft
- IBM
- SAP
- Qlik
- Oracle
- Microstrategy
- GoodData
- Targit
- SAS
- Tableau Software
Our Clients


View Our Licence Options
