
Bot Services Market Report By Technology (Framework, Platform), By Application (Websites, Contact Center, Social Media, Mobile), By Mode (Text, Audio, Video), By Deployment (New Construction, Retrofit), By End User (Banking, Financial Services, and Insurance [BFSI], Retail and eCommerce, Healthcare, Media and Entertainment, Telecom, Government, Education, Travel and Hospitality, Real Estate, Others), By Region and Companies - Industry Segment Outlook, Market Assessment, Competition Scenario, Trends and Forecast 2024-2033
-
48717
-
July 2024
-
325
-


-
This report was compiled by Vishwa Gaul Vishwa is an experienced market research and consulting professional with over 8 years of expertise in the ICT industry, contributing to over 700 reports across telecommunications, software, hardware, and digital solutions. Correspondence Team Lead- ICT Linkedin | Detailed Market research Methodology Our methodology involves a mix of primary research, including interviews with leading mental health experts, and secondary research from reputable medical journals and databases. View Detailed Methodology Page
-
Quick Navigation
Report Overview
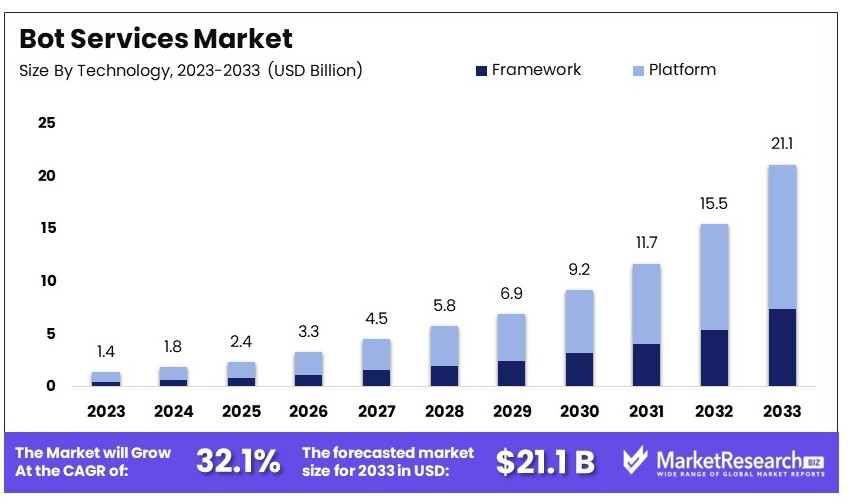
The Global Bot Services Market size is expected to be worth around USD 21.1 Billion by 2033, from USD 1.4 Billion in 2023, growing at a CAGR of 32.1% during the forecast period from 2024 to 2033.
The Bot Services Market focuses on the development and integration of automated software applications or "bots" that perform tasks over the internet. These services include chatbots for customer service, bots for social media management, and more.
The market is driven by the need for automation to enhance customer interaction, streamline business processes, and reduce costs. As businesses increasingly adopt digital channels, the demand for sophisticated bot services that can handle complex interactions and provide personalized customer experiences is growing rapidly.
The bot services market is rapidly expanding, driven by significant adoption of artificial intelligence (AI) across various industries. In 2023, approximately 42% of IT professionals in large organizations reported active AI deployments, with another 40% exploring its use. Key factors behind this surge include the need for automating IT processes, detecting security threats, and enhancing business analytics.
The financial services industry is at the forefront of this adoption, with about half of its IT professionals actively using AI. The telecommunications industry follows closely, with 37% reporting AI deployment. This trend highlights the increasing reliance on AI to streamline operations and improve efficiency across sectors.
AI chatbots, in particular, are transforming industry-specific applications. In the banking sector, AI assistants are projected to save around $7.3 billion globally by handling 75-90% of customer queries by 2023. Similarly, the healthcare industry is experiencing significant benefits from AI-driven chatbots, with the market expected to grow to approximately $340 million by 2027. These advancements underscore the critical role of AI in enhancing customer service and operational efficiency.
Innovation and strategic investments are further propelling the bot services market. According to IBM's AI adoption index, 59% of companies deploying or exploring AI have increased their investments over the past two years. This trend is supported by advancements in AI tools, making them more accessible and integrating them into off-the-shelf business applications.
Overall, the bot services market is poised for substantial growth. The combination of widespread AI adoption, industry-specific benefits, and strategic investments creates a strong foundation for continued expansion and innovation in this sector.
Key Takeaways
- Market Value: The Bot Services Market was valued at USD 1.4 billion in 2023 and is expected to reach USD 21.1 billion by 2033, with a CAGR of 32.1%.
- Technology Analysis: Platforms dominate with 65%, essential for building and deploying bots.
- Application Analysis: Websites lead with 55%, highlighting the importance of customer engagement.
- Mode Analysis: Text mode dominates with 70%, reflecting user preference for text-based interactions.
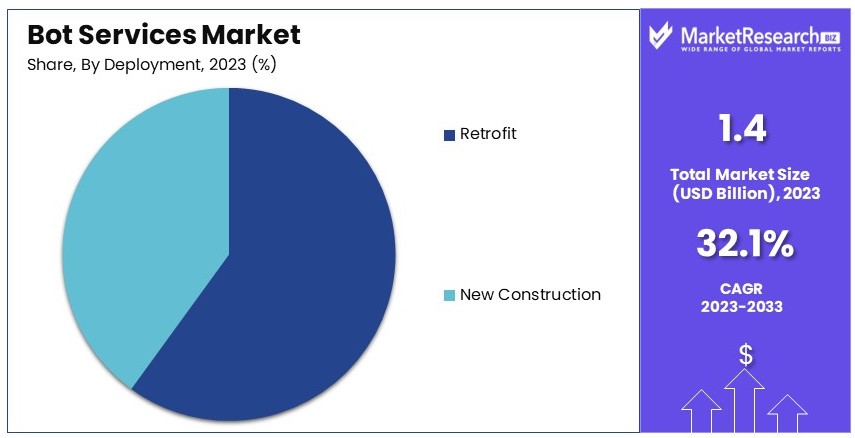
- Deployment Analysis: Retrofit deployments lead with 60%, driven by integration with existing systems.
- End User Analysis: BFSI sector leads with 40%, critical for enhancing customer service.
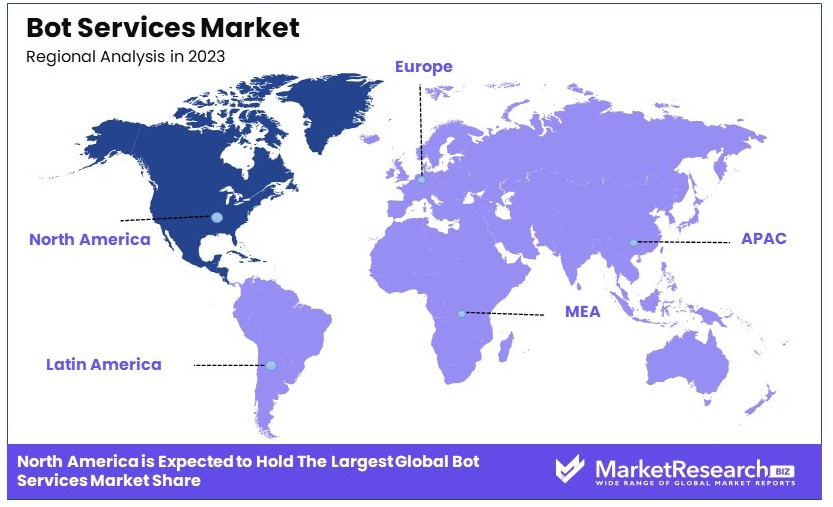
- Dominant Region: North America leads with 35%, driven by technological advancements.
- Analyst Viewpoint: The market is highly dynamic with significant growth potential, fueled by AI advancements and increasing demand for automated customer service.
- Growth Opportunities: Key players can leverage AI and machine learning to enhance bot functionalities and explore new applications across various industries.
Driving Factors
Increasing Demand for Automated Customer Service Drives Market Growth
Businesses are increasingly adopting automated solutions to enhance customer service efficiency and reduce operational costs. The implementation of chatbots and virtual digital assistants is a key trend, driven by the need to handle high volumes of customer queries effectively. These technologies enable 24/7 customer support, drastically cutting down wait times and significantly improving customer satisfaction.
For example, major companies like Domino's Pizza and Starbucks use chatbots to expedite order processes and enhance service quality. This shift not only meets customer expectations for instant and accessible service but also supports businesses in scaling their customer service operations without a proportional increase in overheads.
Advancements in Natural Language Processing (NLP) and Artificial Intelligence (AI) Enhance User Interactions
The bot services market is greatly benefiting from advancements in NLP and AI. These technologies have evolved to better understand and respond to user queries with high accuracy and context sensitivity. Modern bots can engage in fluid, natural conversations, providing responses that are more aligned with human interactions.
Platforms like Google's Dialogflow and Amazon's Lex have been pivotal, offering tools that empower developers to create sophisticated conversational agents. This enhancement in technology not only improves user satisfaction but also broadens the applications of bots across different industries, facilitating more complex and meaningful interactions.
Adoption of Omnichannel Strategies Accelerates Market Penetration
Omnichannel strategies have become crucial in modern business practices, aiming to provide a unified customer experience across various platforms such as social media, messaging apps, websites, and mobile applications. The integration of bots into these channels ensures that businesses can maintain a consistent and seamless customer interaction landscape.
Notably, banks like HDFC and ICICI are leveraging chatbots on their websites and apps to provide instant support for account inquiries and transactions. This approach not only enhances customer engagement but also streamlines the interaction process, making it more efficient and accessible. The adoption of such strategies significantly contributes to the growth and diversification of the bot services market, aligning with evolving consumer preferences and technological advancements.
Restraining Factors
Limited Natural Language Understanding and Contextual Awareness Restrain Bot Services Market Growth
Limited natural language understanding and contextual awareness hinder the growth of the bot services market. Despite advancements in natural language processing (NLP), bots struggle with complex queries and providing accurate responses. They often fail to understand the context, leading to user frustration.
For instance, a bot may misinterpret a user's intent or not recognize sarcasm or humor, resulting in unsatisfactory interactions. This limitation in communication abilities can reduce user trust and satisfaction, slowing the adoption and growth of bot services.
Security and Privacy Concerns Restrain Bot Services Market Growth
Security and privacy concerns significantly impact the bot services market. Bots often handle sensitive user data, raising issues about data privacy and potential security breaches. Users may be hesitant to share personal information with bots due to trust issues.
High-profile data breaches and privacy violations by tech companies have made users more cautious. This caution affects their willingness to engage with bot services. The fear of data misuse or exposure slows down the market growth, as security and privacy are paramount for user acceptance and trust.
Technology Analysis
Platform dominates with 65% due to its comprehensive service offerings and ease of integration.
In the bot services market, the Technology segment is crucial, divided into frameworks and platforms. Platforms take a leading role, primarily because they offer a more comprehensive, ready-to-use service that allows businesses to integrate and deploy bots quickly across various channels. This ease of integration, combined with robust support for scaling and security, makes platforms highly attractive for companies looking to implement bot solutions without extensive custom development.
Frameworks, while essential, often require more specialized development skills to build custom bots tailored to specific business needs. They are preferred in scenarios where companies require unique functionalities that are not readily available through platform solutions.
The dominance of platform services in the bot market is supported by their ongoing evolution to include more advanced AI capabilities, such as natural language processing and machine learning, making them even more versatile and effective in handling complex customer interactions.
Application Analysis
Websites dominate with 55% due to the critical role of providing 24/7 customer service and engagement.
The Application segment of the bot services market focuses on where bots are implemented: websites, contact centers, social media, and mobile platforms. Websites hold the largest market share because they are the primary point of interaction between companies and customers. Bots on websites can provide instant customer service, lead generation, and engagement tools around the clock, which enhances customer experience and supports business operations.
Contact centers also heavily utilize bots to manage large volumes of inquiries efficiently, reducing wait times and freeing human agents to handle more complex issues. This application is particularly significant in industries with high customer interaction levels, such as telecommunications and financial services.
Social media and mobile applications are growing segments where bots are used to engage with users in a more informal and accessible manner. These platforms are critical for tapping into younger demographics and capitalizing on the increasing use of mobile devices.
Mode Analysis
Text dominates with 70% due to its simplicity and widespread acceptance among users.
In the Mode segment, bots operate through text, audio, and video interactions. Text-based bots are the most prevalent, favored for their simplicity, ease of implementation, and widespread user acceptance. They are efficient for handling straightforward tasks like answering FAQs or booking appointments, making them a staple in customer service.
Audio bots, which include voice-activated assistants, are increasingly popular in environments where hands-free operation is beneficial, such as during driving or cooking. Video bots are less common but are emerging in customer service roles where face-to-face interaction can enhance the customer experience, such as in personal banking or healthcare advice.
The dominance of text-based bots is expected to continue, although audio and video bots are rapidly growing due to advancements in AI and the increasing sophistication of consumer expectations regarding interaction quality.
Deployment Analysis
Retrofit dominates with 60% due to the need to upgrade existing digital services with bot functionalities.
Deployment methods in the bot services market are categorized into new construction and retrofit. Retrofitting dominates as businesses seek to integrate bots into their existing digital infrastructures. This approach allows companies to enhance their current service offerings with automated functionalities without the need for extensive overhauls or new systems.
New construction deployments occur less frequently and typically involve newly established businesses or those undergoing significant digital transformations. These deployments are crucial for integrating bot services from the ground up, ensuring seamless functionality and integration.
The retrofit segment's dominance is likely to continue as more businesses look to capitalize on the benefits of bots to improve customer interaction without the high costs associated with new systems.
End User Analysis
Banking, Financial Services, and Insurance (BFSI) dominate with 40% due to the high demand for automated customer service and transactional support.
End users of bot services span multiple industries, but the BFSI sector holds the largest share due to its high demand for automation in customer service and transactional operations. Bots in BFSI help manage everything from simple inquiries to complex transactions, improving efficiency and customer satisfaction.
Retail and eCommerce also make extensive use of bots for customer service, particularly in guiding purchases and providing personalized shopping experiences. Healthcare uses bots for appointment scheduling and patient inquiries, enhancing accessibility and reducing administrative burdens.
Media and entertainment, telecom, government, education, travel and hospitality, real estate, and other sectors also deploy bots to various extents, focusing on improving customer interactions and operational efficiency.
Each of these industries contributes to the growth and diversification of the bot services market, pushing forward innovations that tailor bot functionalities to specific sector needs, thereby enhancing overall market growth and technological advancement.
Key Market Segments
Technology
- Framework
- Platform
Application
- Websites
- Contact Center
- Social Media
- Mobile
Mode
- Text
- Audio
- Video
Deployment
- New Construction
- Retrofit
End User
- Banking, Financial Services, and Insurance (BFSI)
- Retail and eCommerce
- Healthcare
- Media and Entertainment
- Telecom
- Government
- Education
- Travel and Hospitality
- Real Estate
- Others
Growth Opportunities
Integration with Emerging Technologies Offers Growth Opportunity
Integrating bots with emerging technologies like the Internet of Things (IoT), augmented reality (AR), and virtual reality (VR) can open new growth opportunities. Bots can help users control smart home devices, offer virtual product demos, or guide them through immersive experiences.
For example, bots integrated with AR can provide step-by-step instructions for complex tasks or product assembly. This integration enhances user experiences and creates new applications for bots, driving demand and expanding market potential.
Expansion into New Verticals Offers Growth Opportunity
There is significant potential for bots to expand into new verticals beyond customer service and e-commerce, such as healthcare, education, and finance. Bots can assist with appointment scheduling, tutoring, or financial advisory services.
For instance, healthcare chatbots can provide medical advice, answer health-related queries, and assist with medication reminders. By entering these new sectors, bot services can address diverse needs, increasing their market presence and driving growth.
Trending Factors
Conversational Commerce Are Trending Factors
The use of bots for conversational commerce is a growing trend in the market. Bots enable users to discover, purchase, and track products through natural language interactions. This trend is driven by the rise of messaging apps and the desire for convenient, seamless shopping experiences.
Bots on platforms like Facebook Messenger and WhatsApp can assist users in browsing catalogs, placing orders, and tracking shipments. As consumers seek easier shopping methods, the demand for conversational commerce bots will increase, fueling market expansion.
Voice-Enabled Bots Are Trending Factors
Voice-enabled bots are gaining traction due to the growing popularity of voice assistants like Amazon's Alexa and Google Assistant. Users can interact with bots using natural speech, making the experience more convenient and accessible.
Voice bots can assist with tasks like setting reminders, controlling smart home devices, or ordering food through voice commands. This trend reflects a shift towards more intuitive and hands-free interactions, driving the adoption of voice-enabled bots and expanding their market reach.
Regional Analysis
North America Dominates with 35% Market Share in the Bot Services Market
North America’s 35% market share in the bot services industry is largely driven by its advanced technological infrastructure and the high adoption of AI and machine learning technologies. The region's strong focus on innovation, particularly in the U.S., where many leading tech companies are based, contributes significantly to this dominance. Moreover, the widespread use of digital customer service solutions across businesses enhances the demand for bot services.
The bot services market in North America is characterized by rapid technological advancements and a competitive business environment that demands efficient customer interaction solutions. High internet penetration and a preference for automated services across sectors such as finance, healthcare, and e-commerce play pivotal roles in the market’s growth. The integration of bots with existing customer relationship management (CRM) systems is also a key trend boosting industry performance.
Looking forward, North America's presence in the bot services market is likely to continue growing. This growth will be supported by the ongoing trend of digital transformation in businesses and the increasing need for cost-effective, 24/7 customer service solutions. Further innovations in AI and an expansion in the application areas for bots are expected to enhance market dynamics and maintain North America's leading position.
Regional Market Shares and Dynamics:
Europe: Europe holds approximately 30% of the bot services market. The region's market is propelled by strong data protection regulations which drive the demand for secure and compliant bot services. Moreover, Europe's focus on customer service excellence and multilingual capabilities enhances the adoption of sophisticated bot technologies.
Asia Pacific: Accounting for about 25% of the market, Asia Pacific is witnessing rapid growth due to increasing digitalization and mobile usage, especially in countries like China and India. The region’s growing tech-savvy population and expanding e-commerce sector foster a conducive environment for the adoption of bot services.
Middle East & Africa: This region captures around 5% of the market. Growth is driven by the digital transformation initiatives in countries such as the UAE and Saudi Arabia, which are increasingly implementing AI and automation to enhance business processes and customer service.
Latin America: Latin America also holds about 5% of the global market. The region is gradually embracing digital technologies, with an increasing number of businesses integrating bot services to improve customer engagement and operational efficiency.
Key Regions and Countries
- North America
- The US
- Canada
- Mexico
- Western Europe
- Germany
- France
- The UK
- Spain
- Italy
- Portugal
- Ireland
- Austria
- Switzerland
- Benelux
- Nordic
- Rest of Western Europe
- Eastern Europe
- Russia
- Poland
- The Czech Republic
- Greece
- Rest of Eastern Europe
- APAC
- China
- Japan
- South Korea
- India
- Australia & New Zealand
- Indonesia
- Malaysia
- Philippines
- Singapore
- Thailand
- Vietnam
- Rest of APAC
- Latin America
- Brazil
- Colombia
- Chile
- Argentina
- Costa Rica
- Rest of Latin America
- Middle East & Africa
- Algeria
- Egypt
- Israel
- Kuwait
- Nigeria
- Saudi Arabia
- South Africa
- Turkey
- United Arab Emirates
- Rest of MEA
Key Players Analysis
The Bot Services Market includes several major companies. Microsoft Corporation and IBM Corporation are leaders with extensive AI and cloud-based solutions. Their strong R&D capabilities and global reach give them a competitive edge.
Google LLC and Amazon Web Services, Inc. are notable for their advanced machine learning technologies and large-scale operations. They focus on innovation and integrating AI into various applications.
Nuance Communications, Inc. and Facebook, Inc. excel in natural language processing and conversational AI. Their strategic focus on enhancing user interactions boosts their market positions.
Oracle Corporation and Artificial Solutions International AB are recognized for their enterprise-focused solutions and robust platforms. They prioritize security and scalability.
Inbenta Technologies Inc. and Next IT Corporation are influential due to their innovative AI solutions and emphasis on customer engagement. Their strategies include expanding their product portfolios and enhancing AI capabilities.
Rasa Technologies GmbH and Creative Virtual Ltd. stand out for their open-source platforms and customized bot solutions. Their strong community support and flexibility enhance their market influence.
SoundHound Inc. and Baidu, Inc. are significant players with their voice AI technologies and strong presence in Asian markets. They focus on improving speech recognition and AI applications.
Clinc, Inc. is known for its advanced conversational AI and focus on the financial sector. Its strategic positioning in niche markets enhances its influence.
Overall, the market is characterized by a mix of tech giants and innovative startups, each driving growth through AI advancements and strategic collaborations.
Market Key Players
- Microsoft Corporation
- IBM Corporation
- Google LLC
- Amazon Web Services, Inc.
- Nuance Communications, Inc.
- Facebook, Inc.
- Oracle Corporation
- Artificial Solutions International AB
- Inbenta Technologies Inc.
- Next IT Corporation
- Rasa Technologies GmbH
- Creative Virtual Ltd.
- SoundHound Inc.
- Baidu, Inc.
- Clinc, Inc.
Recent Developments
- July 2024 / Kasada: Kasada was recognized in the Q3 2024 Forrester Wave™ report for its bot management solutions. The report praised Kasada for its innovative approach to bot management, which avoids using CAPTCHAs and instead employs invisible challenge methods to maintain a seamless user experience while ensuring robust security against automated threats.
- February 2024 / Hanooman: Hanooman, developed by BharatGPT and backed by Reliance Industries, was showcased at a technology conference in Mumbai. This AI bot aims to revolutionize AI interaction in India by demonstrating its ability to interact in multiple languages, indicating its potential to bridge linguistic and functional barriers across various sectors.
Report Scope
Report Features Description Market Value (2023) USD 1.4 Billion Forecast Revenue (2033) USD 21.1 Billion CAGR (2024-2033) 32.1% Base Year for Estimation 2023 Historic Period 2018-2023 Forecast Period 2024-2033 Report Coverage Revenue Forecast, Market Dynamics, Competitive Landscape, Recent Developments Segments Covered By Technology (Framework, Platform), By Application (Websites, Contact Center, Social Media, Mobile), By Mode (Text, Audio, Video), By Deployment (New Construction, Retrofit), By End User (Banking, Financial Services, and Insurance [BFSI], Retail and eCommerce, Healthcare, Media and Entertainment, Telecom, Government, Education, Travel and Hospitality, Real Estate, Others) Regional Analysis North America - The US, Canada, & Mexico; Western Europe - Germany, France, The UK, Spain, Italy, Portugal, Ireland, Austria, Switzerland, Benelux, Nordic, & Rest of Western Europe; Eastern Europe - Russia, Poland, The Czech Republic, Greece, & Rest of Eastern Europe; APAC - China, Japan, South Korea, India, Australia & New Zealand, Indonesia, Malaysia, Philippines, Singapore, Thailand, Vietnam, & Rest of APAC; Latin America - Brazil, Colombia, Chile, Argentina, Costa Rica, & Rest of Latin America; Middle East & Africa - Algeria, Egypt, Israel, Kuwait, Nigeria, Saudi Arabia, South Africa, Turkey, United Arab Emirates, & Rest of MEA Competitive Landscape Microsoft Corporation, IBM Corporation, Google LLC, Amazon Web Services, Inc., Nuance Communications, Inc., Facebook, Inc., Oracle Corporation, Artificial Solutions International AB, Inbenta Technologies Inc., Next IT Corporation, Rasa Technologies GmbH, Creative Virtual Ltd., SoundHound Inc., Baidu, Inc., Clinc, Inc. Customization Scope Customization for segments, region/country-level will be provided. Moreover, additional customization can be done based on the requirements. Purchase Options We have three licenses to opt for: Single User License, Multi-User License (Up to 5 Users), Corporate Use License (Unlimited User and Printable PDF) -
- 1. Executive Summary
- 1.1. Definition
- 1.2. Taxonomy
- 1.3. Research Scope
- 1.4. Key Analysis
- 1.5. Key Findings by Major Segments
- 1.6. Top strategies by Major Players
- 2. Global Bot Services Market Overview
- 2.1. Bot Services Market Dynamics
- 2.1.1. Drivers
- 2.1.2. Opportunities
- 2.1.3. Restraints
- 2.1.4. Challenges
- 2.2. Macro-economic Factors
- 2.3. Regulatory Framework
- 2.4. Market Investment Feasibility Index
- 2.5. PEST Analysis
- 2.6. PORTER’S Five Force Analysis
- 2.7. Drivers & Restraints Impact Analysis
- 2.8. Industry Chain Analysis
- 2.9. Cost Structure Analysis
- 2.10. Marketing Strategy
- 2.11. Russia-Ukraine War Impact Analysis
- 2.12. Opportunity Map Analysis
- 2.13. Market Competition Scenario Analysis
- 2.14. Product Life Cycle Analysis
- 2.15. Opportunity Orbits
- 2.16. Manufacturer Intensity Map
- 2.17. Major Companies sales by Value & Volume
- 2.1. Bot Services Market Dynamics
- 3. Global Bot Services Market Analysis, Opportunity and Forecast, 2016-2032
- 3.1. Global Bot Services Market Analysis, 2016-2021
- 3.2. Global Bot Services Market Opportunity and Forecast, 2023-2032
- 3.3. Global Bot Services Market Analysis, Opportunity and Forecast, By Technology, 2016-2032
- 3.3.1. Global Bot Services Market Analysis by Technology: Introduction
- 3.3.2. Market Size Absolute $ Opportunity Analysis and Forecast, By Technology, 2016-2032
- 3.3.3. Framework
- 3.3.4. Platform
- 3.4. Global Bot Services Market Analysis, Opportunity and Forecast, By Application, 2016-2032
- 3.4.1. Global Bot Services Market Analysis by Application: Introduction
- 3.4.2. Market Size Absolute $ Opportunity Analysis and Forecast, By Application, 2016-2032
- 3.4.3. Websites
- 3.4.4. Contact Center
- 3.4.5. Social Media
- 3.4.6. Mobile
- 3.5. Global Bot Services Market Analysis, Opportunity and Forecast, By Mode, 2016-2032
- 3.5.1. Global Bot Services Market Analysis by Mode: Introduction
- 3.5.2. Market Size Absolute $ Opportunity Analysis and Forecast, By Mode, 2016-2032
- 3.5.3. Text
- 3.5.4. Audio
- 3.5.5. Video
- 3.6. Global Bot Services Market Analysis, Opportunity and Forecast, By Deployment, 2016-2032
- 3.6.1. Global Bot Services Market Analysis by Deployment: Introduction
- 3.6.2. Market Size Absolute $ Opportunity Analysis and Forecast, By Deployment, 2016-2032
- 3.6.3. New Construction
- 3.6.4. Retrofit
- 3.7. Global Bot Services Market Analysis, Opportunity and Forecast, By End User, 2016-2032
- 3.7.1. Global Bot Services Market Analysis by End User: Introduction
- 3.7.2. Market Size Absolute $ Opportunity Analysis and Forecast, By End User, 2016-2032
- 3.7.3. Banking, Financial Services, and Insurance (BFSI)
- 3.7.4. Retail and eCommerce
- 3.7.5. Healthcare
- 3.7.6. Media and Entertainment
- 3.7.7. Telecom
- 3.7.8. Government
- 3.7.9. Education
- 3.7.10. Travel and Hospitality
- 3.7.11. Real Estate
- 3.7.12. Others
- 4. North America Bot Services Market Analysis, Opportunity and Forecast, 2016-2032
- 4.1. North America Bot Services Market Analysis, 2016-2021
- 4.2. North America Bot Services Market Opportunity and Forecast, 2023-2032
- 4.3. North America Bot Services Market Analysis, Opportunity and Forecast, By Technology, 2016-2032
- 4.3.1. North America Bot Services Market Analysis by Technology: Introduction
- 4.3.2. Market Size Absolute $ Opportunity Analysis and Forecast, By Technology, 2016-2032
- 4.3.3. Framework
- 4.3.4. Platform
- 4.4. North America Bot Services Market Analysis, Opportunity and Forecast, By Application, 2016-2032
- 4.4.1. North America Bot Services Market Analysis by Application: Introduction
- 4.4.2. Market Size Absolute $ Opportunity Analysis and Forecast, By Application, 2016-2032
- 4.4.3. Websites
- 4.4.4. Contact Center
- 4.4.5. Social Media
- 4.4.6. Mobile
- 4.5. North America Bot Services Market Analysis, Opportunity and Forecast, By Mode, 2016-2032
- 4.5.1. North America Bot Services Market Analysis by Mode: Introduction
- 4.5.2. Market Size Absolute $ Opportunity Analysis and Forecast, By Mode, 2016-2032
- 4.5.3. Text
- 4.5.4. Audio
- 4.5.5. Video
- 4.6. North America Bot Services Market Analysis, Opportunity and Forecast, By Deployment, 2016-2032
- 4.6.1. North America Bot Services Market Analysis by Deployment: Introduction
- 4.6.2. Market Size Absolute $ Opportunity Analysis and Forecast, By Deployment, 2016-2032
- 4.6.3. New Construction
- 4.6.4. Retrofit
- 4.7. North America Bot Services Market Analysis, Opportunity and Forecast, By End User, 2016-2032
- 4.7.1. North America Bot Services Market Analysis by End User: Introduction
- 4.7.2. Market Size Absolute $ Opportunity Analysis and Forecast, By End User, 2016-2032
- 4.7.3. Banking, Financial Services, and Insurance (BFSI)
- 4.7.4. Retail and eCommerce
- 4.7.5. Healthcare
- 4.7.6. Media and Entertainment
- 4.7.7. Telecom
- 4.7.8. Government
- 4.7.9. Education
- 4.7.10. Travel and Hospitality
- 4.7.11. Real Estate
- 4.7.12. Others
- 4.8. North America Bot Services Market Analysis, Opportunity and Forecast, By Country , 2016-2032
- 4.8.1. North America Bot Services Market Analysis by Country : Introduction
- 4.8.2. Market Size Absolute $ Opportunity Analysis and Forecast, Country , 2016-2032
- 4.8.2.1. The US
- 4.8.2.2. Canada
- 4.8.2.3. Mexico
- 5. Western Europe Bot Services Market Analysis, Opportunity and Forecast, 2016-2032
- 5.1. Western Europe Bot Services Market Analysis, 2016-2021
- 5.2. Western Europe Bot Services Market Opportunity and Forecast, 2023-2032
- 5.3. Western Europe Bot Services Market Analysis, Opportunity and Forecast, By Technology, 2016-2032
- 5.3.1. Western Europe Bot Services Market Analysis by Technology: Introduction
- 5.3.2. Market Size Absolute $ Opportunity Analysis and Forecast, By Technology, 2016-2032
- 5.3.3. Framework
- 5.3.4. Platform
- 5.4. Western Europe Bot Services Market Analysis, Opportunity and Forecast, By Application, 2016-2032
- 5.4.1. Western Europe Bot Services Market Analysis by Application: Introduction
- 5.4.2. Market Size Absolute $ Opportunity Analysis and Forecast, By Application, 2016-2032
- 5.4.3. Websites
- 5.4.4. Contact Center
- 5.4.5. Social Media
- 5.4.6. Mobile
- 5.5. Western Europe Bot Services Market Analysis, Opportunity and Forecast, By Mode, 2016-2032
- 5.5.1. Western Europe Bot Services Market Analysis by Mode: Introduction
- 5.5.2. Market Size Absolute $ Opportunity Analysis and Forecast, By Mode, 2016-2032
- 5.5.3. Text
- 5.5.4. Audio
- 5.5.5. Video
- 5.6. Western Europe Bot Services Market Analysis, Opportunity and Forecast, By Deployment, 2016-2032
- 5.6.1. Western Europe Bot Services Market Analysis by Deployment: Introduction
- 5.6.2. Market Size Absolute $ Opportunity Analysis and Forecast, By Deployment, 2016-2032
- 5.6.3. New Construction
- 5.6.4. Retrofit
- 5.7. Western Europe Bot Services Market Analysis, Opportunity and Forecast, By End User, 2016-2032
- 5.7.1. Western Europe Bot Services Market Analysis by End User: Introduction
- 5.7.2. Market Size Absolute $ Opportunity Analysis and Forecast, By End User, 2016-2032
- 5.7.3. Banking, Financial Services, and Insurance (BFSI)
- 5.7.4. Retail and eCommerce
- 5.7.5. Healthcare
- 5.7.6. Media and Entertainment
- 5.7.7. Telecom
- 5.7.8. Government
- 5.7.9. Education
- 5.7.10. Travel and Hospitality
- 5.7.11. Real Estate
- 5.7.12. Others
- 5.8. Western Europe Bot Services Market Analysis, Opportunity and Forecast, By Country , 2016-2032
- 5.8.1. Western Europe Bot Services Market Analysis by Country : Introduction
- 5.8.2. Market Size Absolute $ Opportunity Analysis and Forecast, Country , 2016-2032
- 5.8.2.1. Germany
- 5.8.2.2. France
- 5.8.2.3. The UK
- 5.8.2.4. Spain
- 5.8.2.5. Italy
- 5.8.2.6. Portugal
- 5.8.2.7. Ireland
- 5.8.2.8. Austria
- 5.8.2.9. Switzerland
- 5.8.2.10. Benelux
- 5.8.2.11. Nordic
- 5.8.2.12. Rest of Western Europe
- 6. Eastern Europe Bot Services Market Analysis, Opportunity and Forecast, 2016-2032
- 6.1. Eastern Europe Bot Services Market Analysis, 2016-2021
- 6.2. Eastern Europe Bot Services Market Opportunity and Forecast, 2023-2032
- 6.3. Eastern Europe Bot Services Market Analysis, Opportunity and Forecast, By Technology, 2016-2032
- 6.3.1. Eastern Europe Bot Services Market Analysis by Technology: Introduction
- 6.3.2. Market Size Absolute $ Opportunity Analysis and Forecast, By Technology, 2016-2032
- 6.3.3. Framework
- 6.3.4. Platform
- 6.4. Eastern Europe Bot Services Market Analysis, Opportunity and Forecast, By Application, 2016-2032
- 6.4.1. Eastern Europe Bot Services Market Analysis by Application: Introduction
- 6.4.2. Market Size Absolute $ Opportunity Analysis and Forecast, By Application, 2016-2032
- 6.4.3. Websites
- 6.4.4. Contact Center
- 6.4.5. Social Media
- 6.4.6. Mobile
- 6.5. Eastern Europe Bot Services Market Analysis, Opportunity and Forecast, By Mode, 2016-2032
- 6.5.1. Eastern Europe Bot Services Market Analysis by Mode: Introduction
- 6.5.2. Market Size Absolute $ Opportunity Analysis and Forecast, By Mode, 2016-2032
- 6.5.3. Text
- 6.5.4. Audio
- 6.5.5. Video
- 6.6. Eastern Europe Bot Services Market Analysis, Opportunity and Forecast, By Deployment, 2016-2032
- 6.6.1. Eastern Europe Bot Services Market Analysis by Deployment: Introduction
- 6.6.2. Market Size Absolute $ Opportunity Analysis and Forecast, By Deployment, 2016-2032
- 6.6.3. New Construction
- 6.6.4. Retrofit
- 6.7. Eastern Europe Bot Services Market Analysis, Opportunity and Forecast, By End User, 2016-2032
- 6.7.1. Eastern Europe Bot Services Market Analysis by End User: Introduction
- 6.7.2. Market Size Absolute $ Opportunity Analysis and Forecast, By End User, 2016-2032
- 6.7.3. Banking, Financial Services, and Insurance (BFSI)
- 6.7.4. Retail and eCommerce
- 6.7.5. Healthcare
- 6.7.6. Media and Entertainment
- 6.7.7. Telecom
- 6.7.8. Government
- 6.7.9. Education
- 6.7.10. Travel and Hospitality
- 6.7.11. Real Estate
- 6.7.12. Others
- 6.8. Eastern Europe Bot Services Market Analysis, Opportunity and Forecast, By Country , 2016-2032
- 6.8.1. Eastern Europe Bot Services Market Analysis by Country : Introduction
- 6.8.2. Market Size Absolute $ Opportunity Analysis and Forecast, Country , 2016-2032
- 6.8.2.1. Russia
- 6.8.2.2. Poland
- 6.8.2.3. The Czech Republic
- 6.8.2.4. Greece
- 6.8.2.5. Rest of Eastern Europe
- 7. APAC Bot Services Market Analysis, Opportunity and Forecast, 2016-2032
- 7.1. APAC Bot Services Market Analysis, 2016-2021
- 7.2. APAC Bot Services Market Opportunity and Forecast, 2023-2032
- 7.3. APAC Bot Services Market Analysis, Opportunity and Forecast, By Technology, 2016-2032
- 7.3.1. APAC Bot Services Market Analysis by Technology: Introduction
- 7.3.2. Market Size Absolute $ Opportunity Analysis and Forecast, By Technology, 2016-2032
- 7.3.3. Framework
- 7.3.4. Platform
- 7.4. APAC Bot Services Market Analysis, Opportunity and Forecast, By Application, 2016-2032
- 7.4.1. APAC Bot Services Market Analysis by Application: Introduction
- 7.4.2. Market Size Absolute $ Opportunity Analysis and Forecast, By Application, 2016-2032
- 7.4.3. Websites
- 7.4.4. Contact Center
- 7.4.5. Social Media
- 7.4.6. Mobile
- 7.5. APAC Bot Services Market Analysis, Opportunity and Forecast, By Mode, 2016-2032
- 7.5.1. APAC Bot Services Market Analysis by Mode: Introduction
- 7.5.2. Market Size Absolute $ Opportunity Analysis and Forecast, By Mode, 2016-2032
- 7.5.3. Text
- 7.5.4. Audio
- 7.5.5. Video
- 7.6. APAC Bot Services Market Analysis, Opportunity and Forecast, By Deployment, 2016-2032
- 7.6.1. APAC Bot Services Market Analysis by Deployment: Introduction
- 7.6.2. Market Size Absolute $ Opportunity Analysis and Forecast, By Deployment, 2016-2032
- 7.6.3. New Construction
- 7.6.4. Retrofit
- 7.7. APAC Bot Services Market Analysis, Opportunity and Forecast, By End User, 2016-2032
- 7.7.1. APAC Bot Services Market Analysis by End User: Introduction
- 7.7.2. Market Size Absolute $ Opportunity Analysis and Forecast, By End User, 2016-2032
- 7.7.3. Banking, Financial Services, and Insurance (BFSI)
- 7.7.4. Retail and eCommerce
- 7.7.5. Healthcare
- 7.7.6. Media and Entertainment
- 7.7.7. Telecom
- 7.7.8. Government
- 7.7.9. Education
- 7.7.10. Travel and Hospitality
- 7.7.11. Real Estate
- 7.7.12. Others
- 7.8. APAC Bot Services Market Analysis, Opportunity and Forecast, By Country , 2016-2032
- 7.8.1. APAC Bot Services Market Analysis by Country : Introduction
- 7.8.2. Market Size Absolute $ Opportunity Analysis and Forecast, Country , 2016-2032
- 7.8.2.1. China
- 7.8.2.2. Japan
- 7.8.2.3. South Korea
- 7.8.2.4. India
- 7.8.2.5. Australia & New Zeland
- 7.8.2.6. Indonesia
- 7.8.2.7. Malaysia
- 7.8.2.8. Philippines
- 7.8.2.9. Singapore
- 7.8.2.10. Thailand
- 7.8.2.11. Vietnam
- 7.8.2.12. Rest of APAC
- 8. Latin America Bot Services Market Analysis, Opportunity and Forecast, 2016-2032
- 8.1. Latin America Bot Services Market Analysis, 2016-2021
- 8.2. Latin America Bot Services Market Opportunity and Forecast, 2023-2032
- 8.3. Latin America Bot Services Market Analysis, Opportunity and Forecast, By Technology, 2016-2032
- 8.3.1. Latin America Bot Services Market Analysis by Technology: Introduction
- 8.3.2. Market Size Absolute $ Opportunity Analysis and Forecast, By Technology, 2016-2032
- 8.3.3. Framework
- 8.3.4. Platform
- 8.4. Latin America Bot Services Market Analysis, Opportunity and Forecast, By Application, 2016-2032
- 8.4.1. Latin America Bot Services Market Analysis by Application: Introduction
- 8.4.2. Market Size Absolute $ Opportunity Analysis and Forecast, By Application, 2016-2032
- 8.4.3. Websites
- 8.4.4. Contact Center
- 8.4.5. Social Media
- 8.4.6. Mobile
- 8.5. Latin America Bot Services Market Analysis, Opportunity and Forecast, By Mode, 2016-2032
- 8.5.1. Latin America Bot Services Market Analysis by Mode: Introduction
- 8.5.2. Market Size Absolute $ Opportunity Analysis and Forecast, By Mode, 2016-2032
- 8.5.3. Text
- 8.5.4. Audio
- 8.5.5. Video
- 8.6. Latin America Bot Services Market Analysis, Opportunity and Forecast, By Deployment, 2016-2032
- 8.6.1. Latin America Bot Services Market Analysis by Deployment: Introduction
- 8.6.2. Market Size Absolute $ Opportunity Analysis and Forecast, By Deployment, 2016-2032
- 8.6.3. New Construction
- 8.6.4. Retrofit
- 8.7. Latin America Bot Services Market Analysis, Opportunity and Forecast, By End User, 2016-2032
- 8.7.1. Latin America Bot Services Market Analysis by End User: Introduction
- 8.7.2. Market Size Absolute $ Opportunity Analysis and Forecast, By End User, 2016-2032
- 8.7.3. Banking, Financial Services, and Insurance (BFSI)
- 8.7.4. Retail and eCommerce
- 8.7.5. Healthcare
- 8.7.6. Media and Entertainment
- 8.7.7. Telecom
- 8.7.8. Government
- 8.7.9. Education
- 8.7.10. Travel and Hospitality
- 8.7.11. Real Estate
- 8.7.12. Others
- 8.8. Latin America Bot Services Market Analysis, Opportunity and Forecast, By Country , 2016-2032
- 8.8.1. Latin America Bot Services Market Analysis by Country : Introduction
- 8.8.2. Market Size Absolute $ Opportunity Analysis and Forecast, Country , 2016-2032
- 8.8.2.1. Brazil
- 8.8.2.2. Colombia
- 8.8.2.3. Chile
- 8.8.2.4. Argentina
- 8.8.2.5. Costa Rica
- 8.8.2.6. Rest of Latin America
- 9. Middle East & Africa Bot Services Market Analysis, Opportunity and Forecast, 2016-2032
- 9.1. Middle East & Africa Bot Services Market Analysis, 2016-2021
- 9.2. Middle East & Africa Bot Services Market Opportunity and Forecast, 2023-2032
- 9.3. Middle East & Africa Bot Services Market Analysis, Opportunity and Forecast, By Technology, 2016-2032
- 9.3.1. Middle East & Africa Bot Services Market Analysis by Technology: Introduction
- 9.3.2. Market Size Absolute $ Opportunity Analysis and Forecast, By Technology, 2016-2032
- 9.3.3. Framework
- 9.3.4. Platform
- 9.4. Middle East & Africa Bot Services Market Analysis, Opportunity and Forecast, By Application, 2016-2032
- 9.4.1. Middle East & Africa Bot Services Market Analysis by Application: Introduction
- 9.4.2. Market Size Absolute $ Opportunity Analysis and Forecast, By Application, 2016-2032
- 9.4.3. Websites
- 9.4.4. Contact Center
- 9.4.5. Social Media
- 9.4.6. Mobile
- 9.5. Middle East & Africa Bot Services Market Analysis, Opportunity and Forecast, By Mode, 2016-2032
- 9.5.1. Middle East & Africa Bot Services Market Analysis by Mode: Introduction
- 9.5.2. Market Size Absolute $ Opportunity Analysis and Forecast, By Mode, 2016-2032
- 9.5.3. Text
- 9.5.4. Audio
- 9.5.5. Video
- 9.6. Middle East & Africa Bot Services Market Analysis, Opportunity and Forecast, By Deployment, 2016-2032
- 9.6.1. Middle East & Africa Bot Services Market Analysis by Deployment: Introduction
- 9.6.2. Market Size Absolute $ Opportunity Analysis and Forecast, By Deployment, 2016-2032
- 9.6.3. New Construction
- 9.6.4. Retrofit
- 9.7. Middle East & Africa Bot Services Market Analysis, Opportunity and Forecast, By End User, 2016-2032
- 9.7.1. Middle East & Africa Bot Services Market Analysis by End User: Introduction
- 9.7.2. Market Size Absolute $ Opportunity Analysis and Forecast, By End User, 2016-2032
- 9.7.3. Banking, Financial Services, and Insurance (BFSI)
- 9.7.4. Retail and eCommerce
- 9.7.5. Healthcare
- 9.7.6. Media and Entertainment
- 9.7.7. Telecom
- 9.7.8. Government
- 9.7.9. Education
- 9.7.10. Travel and Hospitality
- 9.7.11. Real Estate
- 9.7.12. Others
- 9.8. Middle East & Africa Bot Services Market Analysis, Opportunity and Forecast, By Country , 2016-2032
- 9.8.1. Middle East & Africa Bot Services Market Analysis by Country : Introduction
- 9.8.2. Market Size Absolute $ Opportunity Analysis and Forecast, Country , 2016-2032
- 9.8.2.1. Algeria
- 9.8.2.2. Egypt
- 9.8.2.3. Israel
- 9.8.2.4. Kuwait
- 9.8.2.5. Nigeria
- 9.8.2.6. Saudi Arabia
- 9.8.2.7. South Africa
- 9.8.2.8. Turkey
- 9.8.2.9. The UAE
- 9.8.2.10. Rest of MEA
- 10. Global Bot Services Market Analysis, Opportunity and Forecast, By Region , 2016-2032
- 10.1. Global Bot Services Market Analysis by Region : Introduction
- 10.2. Market Size Absolute $ Opportunity Analysis and Forecast, By Region , 2016-2032
- 10.2.1. North America
- 10.2.2. Western Europe
- 10.2.3. Eastern Europe
- 10.2.4. APAC
- 10.2.5. Latin America
- 10.2.6. Middle East & Africa
- 11. Global Bot Services Market Competitive Landscape, Market Share Analysis, and Company Profiles
- 11.1. Market Share Analysis
- 11.2. Company Profiles
- 11.3. Microsoft Corporation
- 11.3.1. Company Overview
- 11.3.2. Financial Highlights
- 11.3.3. Product Portfolio
- 11.3.4. SWOT Analysis
- 11.3.5. Key Strategies and Developments
- 11.4. IBM Corporation
- 11.4.1. Company Overview
- 11.4.2. Financial Highlights
- 11.4.3. Product Portfolio
- 11.4.4. SWOT Analysis
- 11.4.5. Key Strategies and Developments
- 11.5. Google LLC
- 11.5.1. Company Overview
- 11.5.2. Financial Highlights
- 11.5.3. Product Portfolio
- 11.5.4. SWOT Analysis
- 11.5.5. Key Strategies and Developments
- 11.6. Amazon Web Services, Inc.
- 11.6.1. Company Overview
- 11.6.2. Financial Highlights
- 11.6.3. Product Portfolio
- 11.6.4. SWOT Analysis
- 11.6.5. Key Strategies and Developments
- 11.7. Nuance Communications, Inc.
- 11.7.1. Company Overview
- 11.7.2. Financial Highlights
- 11.7.3. Product Portfolio
- 11.7.4. SWOT Analysis
- 11.7.5. Key Strategies and Developments
- 11.8. Facebook, Inc.
- 11.8.1. Company Overview
- 11.8.2. Financial Highlights
- 11.8.3. Product Portfolio
- 11.8.4. SWOT Analysis
- 11.8.5. Key Strategies and Developments
- 11.9. Oracle Corporation
- 11.9.1. Company Overview
- 11.9.2. Financial Highlights
- 11.9.3. Product Portfolio
- 11.9.4. SWOT Analysis
- 11.9.5. Key Strategies and Developments
- 11.10. Artificial Solutions International AB
- 11.10.1. Company Overview
- 11.10.2. Financial Highlights
- 11.10.3. Product Portfolio
- 11.10.4. SWOT Analysis
- 11.10.5. Key Strategies and Developments
- 11.11. Inbenta Technologies Inc.
- 11.11.1. Company Overview
- 11.11.2. Financial Highlights
- 11.11.3. Product Portfolio
- 11.11.4. SWOT Analysis
- 11.11.5. Key Strategies and Developments
- 11.12. Next IT Corporation
- 11.12.1. Company Overview
- 11.12.2. Financial Highlights
- 11.12.3. Product Portfolio
- 11.12.4. SWOT Analysis
- 11.12.5. Key Strategies and Developments
- 11.13.1. Company Overview
- 11.13.2. Financial Highlights
- 11.13.3. Product Portfolio
- 11.13.4. SWOT Analysis
- 11.13.5. Key Strategies and Developments
- 11.14. Rasa Technologies GmbH
- 11.14.1. Company Overview
- 11.14.2. Financial Highlights
- 11.14.3. Product Portfolio
- 11.14.4. SWOT Analysis
- 11.14.5. Key Strategies and Developments
- 11.15. SoundHound Inc.
- 11.15.1. Company Overview
- 11.15.2. Financial Highlights
- 11.15.3. Product Portfolio
- 11.15.4. SWOT Analysis
- 11.15.5. Key Strategies and Developments
- 11.16. Baidu, Inc.
- 11.16.1. Company Overview
- 11.16.2. Financial Highlights
- 11.16.3. Product Portfolio
- 11.16.4. SWOT Analysis
- 11.16.5. Key Strategies and Developments
- 11.17. Clinc, Inc.
- 11.17.1. Company Overview
- 11.17.2. Financial Highlights
- 11.17.3. Product Portfolio
- 11.17.4. SWOT Analysis
- 11.17.5. Key Strategies and Developments
- 12. Assumptions and Acronyms
- 13. Research Methodology
- 14. Contact
"
- List of Figures
- "
- Figure 1: Global Bot Services Market Revenue (US$ Mn) Market Share by Technology in 2022
- Figure 2: Global Bot Services Market Attractiveness Analysis by Technology, 2016-2032
- Figure 3: Global Bot Services Market Revenue (US$ Mn) Market Share by Applicationin 2022
- Figure 4: Global Bot Services Market Attractiveness Analysis by Application, 2016-2032
- Figure 5: Global Bot Services Market Revenue (US$ Mn) Market Share by Modein 2022
- Figure 6: Global Bot Services Market Attractiveness Analysis by Mode, 2016-2032
- Figure 7: Global Bot Services Market Revenue (US$ Mn) Market Share by Deploymentin 2022
- Figure 8: Global Bot Services Market Attractiveness Analysis by Deployment, 2016-2032
- Figure 9: Global Bot Services Market Revenue (US$ Mn) Market Share by End Userin 2022
- Figure 10: Global Bot Services Market Attractiveness Analysis by End User, 2016-2032
- Figure 11: Global Bot Services Market Revenue (US$ Mn) Market Share by Region in 2022
- Figure 12: Global Bot Services Market Attractiveness Analysis by Region, 2016-2032
- Figure 13: Global Bot Services Market Revenue (US$ Mn) (2016-2032)
- Figure 14: Global Bot Services Market Revenue (US$ Mn) Comparison by Region (2016-2032)
- Figure 15: Global Bot Services Market Revenue (US$ Mn) Comparison by Technology (2016-2032)
- Figure 16: Global Bot Services Market Revenue (US$ Mn) Comparison by Application (2016-2032)
- Figure 17: Global Bot Services Market Revenue (US$ Mn) Comparison by Mode (2016-2032)
- Figure 18: Global Bot Services Market Revenue (US$ Mn) Comparison by Deployment (2016-2032)
- Figure 19: Global Bot Services Market Revenue (US$ Mn) Comparison by End User (2016-2032)
- Figure 20: Global Bot Services Market Y-o-Y Growth Rate Comparison by Region (2016-2032)
- Figure 21: Global Bot Services Market Y-o-Y Growth Rate Comparison by Technology (2016-2032)
- Figure 22: Global Bot Services Market Y-o-Y Growth Rate Comparison by Application (2016-2032)
- Figure 23: Global Bot Services Market Y-o-Y Growth Rate Comparison by Mode (2016-2032)
- Figure 24: Global Bot Services Market Y-o-Y Growth Rate Comparison by Deployment (2016-2032)
- Figure 25: Global Bot Services Market Y-o-Y Growth Rate Comparison by End User (2016-2032)
- Figure 26: Global Bot Services Market Share Comparison by Region (2016-2032)
- Figure 27: Global Bot Services Market Share Comparison by Technology (2016-2032)
- Figure 28: Global Bot Services Market Share Comparison by Application (2016-2032)
- Figure 29: Global Bot Services Market Share Comparison by Mode (2016-2032)
- Figure 30: Global Bot Services Market Share Comparison by Deployment (2016-2032)
- Figure 31: Global Bot Services Market Share Comparison by End User (2016-2032)
- Figure 32: North America Bot Services Market Revenue (US$ Mn) Market Share by Technologyin 2022
- Figure 33: North America Bot Services Market Attractiveness Analysis by Technology, 2016-2032
- Figure 34: North America Bot Services Market Revenue (US$ Mn) Market Share by Applicationin 2022
- Figure 35: North America Bot Services Market Attractiveness Analysis by Application, 2016-2032
- Figure 36: North America Bot Services Market Revenue (US$ Mn) Market Share by Modein 2022
- Figure 37: North America Bot Services Market Attractiveness Analysis by Mode, 2016-2032
- Figure 38: North America Bot Services Market Revenue (US$ Mn) Market Share by Deploymentin 2022
- Figure 39: North America Bot Services Market Attractiveness Analysis by Deployment, 2016-2032
- Figure 40: North America Bot Services Market Revenue (US$ Mn) Market Share by End Userin 2022
- Figure 41: North America Bot Services Market Attractiveness Analysis by End User, 2016-2032
- Figure 42: North America Bot Services Market Revenue (US$ Mn) Market Share by Country in 2022
- Figure 43: North America Bot Services Market Attractiveness Analysis by Country, 2016-2032
- Figure 44: North America Bot Services Market Revenue (US$ Mn) (2016-2032)
- Figure 45: North America Bot Services Market Revenue (US$ Mn) Comparison by Country (2016-2032)
- Figure 46: North America Bot Services Market Revenue (US$ Mn) Comparison by Technology (2016-2032)
- Figure 47: North America Bot Services Market Revenue (US$ Mn) Comparison by Application (2016-2032)
- Figure 48: North America Bot Services Market Revenue (US$ Mn) Comparison by Mode (2016-2032)
- Figure 49: North America Bot Services Market Revenue (US$ Mn) Comparison by Deployment (2016-2032)
- Figure 50: North America Bot Services Market Revenue (US$ Mn) Comparison by End User (2016-2032)
- Figure 51: North America Bot Services Market Y-o-Y Growth Rate Comparison by Country (2016-2032)
- Figure 52: North America Bot Services Market Y-o-Y Growth Rate Comparison by Technology (2016-2032)
- Figure 53: North America Bot Services Market Y-o-Y Growth Rate Comparison by Application (2016-2032)
- Figure 54: North America Bot Services Market Y-o-Y Growth Rate Comparison by Mode (2016-2032)
- Figure 55: North America Bot Services Market Y-o-Y Growth Rate Comparison by Deployment (2016-2032)
- Figure 56: North America Bot Services Market Y-o-Y Growth Rate Comparison by End User (2016-2032)
- Figure 57: North America Bot Services Market Share Comparison by Country (2016-2032)
- Figure 58: North America Bot Services Market Share Comparison by Technology (2016-2032)
- Figure 59: North America Bot Services Market Share Comparison by Application (2016-2032)
- Figure 60: North America Bot Services Market Share Comparison by Mode (2016-2032)
- Figure 61: North America Bot Services Market Share Comparison by Deployment (2016-2032)
- Figure 62: North America Bot Services Market Share Comparison by End User (2016-2032)
- Figure 63: Western Europe Bot Services Market Revenue (US$ Mn) Market Share by Technologyin 2022
- Figure 64: Western Europe Bot Services Market Attractiveness Analysis by Technology, 2016-2032
- Figure 65: Western Europe Bot Services Market Revenue (US$ Mn) Market Share by Applicationin 2022
- Figure 66: Western Europe Bot Services Market Attractiveness Analysis by Application, 2016-2032
- Figure 67: Western Europe Bot Services Market Revenue (US$ Mn) Market Share by Modein 2022
- Figure 68: Western Europe Bot Services Market Attractiveness Analysis by Mode, 2016-2032
- Figure 69: Western Europe Bot Services Market Revenue (US$ Mn) Market Share by Deploymentin 2022
- Figure 70: Western Europe Bot Services Market Attractiveness Analysis by Deployment, 2016-2032
- Figure 71: Western Europe Bot Services Market Revenue (US$ Mn) Market Share by End Userin 2022
- Figure 72: Western Europe Bot Services Market Attractiveness Analysis by End User, 2016-2032
- Figure 73: Western Europe Bot Services Market Revenue (US$ Mn) Market Share by Country in 2022
- Figure 74: Western Europe Bot Services Market Attractiveness Analysis by Country, 2016-2032
- Figure 75: Western Europe Bot Services Market Revenue (US$ Mn) (2016-2032)
- Figure 76: Western Europe Bot Services Market Revenue (US$ Mn) Comparison by Country (2016-2032)
- Figure 77: Western Europe Bot Services Market Revenue (US$ Mn) Comparison by Technology (2016-2032)
- Figure 78: Western Europe Bot Services Market Revenue (US$ Mn) Comparison by Application (2016-2032)
- Figure 79: Western Europe Bot Services Market Revenue (US$ Mn) Comparison by Mode (2016-2032)
- Figure 80: Western Europe Bot Services Market Revenue (US$ Mn) Comparison by Deployment (2016-2032)
- Figure 81: Western Europe Bot Services Market Revenue (US$ Mn) Comparison by End User (2016-2032)
- Figure 82: Western Europe Bot Services Market Y-o-Y Growth Rate Comparison by Country (2016-2032)
- Figure 83: Western Europe Bot Services Market Y-o-Y Growth Rate Comparison by Technology (2016-2032)
- Figure 84: Western Europe Bot Services Market Y-o-Y Growth Rate Comparison by Application (2016-2032)
- Figure 85: Western Europe Bot Services Market Y-o-Y Growth Rate Comparison by Mode (2016-2032)
- Figure 86: Western Europe Bot Services Market Y-o-Y Growth Rate Comparison by Deployment (2016-2032)
- Figure 87: Western Europe Bot Services Market Y-o-Y Growth Rate Comparison by End User (2016-2032)
- Figure 88: Western Europe Bot Services Market Share Comparison by Country (2016-2032)
- Figure 89: Western Europe Bot Services Market Share Comparison by Technology (2016-2032)
- Figure 90: Western Europe Bot Services Market Share Comparison by Application (2016-2032)
- Figure 91: Western Europe Bot Services Market Share Comparison by Mode (2016-2032)
- Figure 92: Western Europe Bot Services Market Share Comparison by Deployment (2016-2032)
- Figure 93: Western Europe Bot Services Market Share Comparison by End User (2016-2032)
- Figure 94: Eastern Europe Bot Services Market Revenue (US$ Mn) Market Share by Technologyin 2022
- Figure 95: Eastern Europe Bot Services Market Attractiveness Analysis by Technology, 2016-2032
- Figure 96: Eastern Europe Bot Services Market Revenue (US$ Mn) Market Share by Applicationin 2022
- Figure 97: Eastern Europe Bot Services Market Attractiveness Analysis by Application, 2016-2032
- Figure 98: Eastern Europe Bot Services Market Revenue (US$ Mn) Market Share by Modein 2022
- Figure 99: Eastern Europe Bot Services Market Attractiveness Analysis by Mode, 2016-2032
- Figure 100: Eastern Europe Bot Services Market Revenue (US$ Mn) Market Share by Deploymentin 2022
- Figure 101: Eastern Europe Bot Services Market Attractiveness Analysis by Deployment, 2016-2032
- Figure 102: Eastern Europe Bot Services Market Revenue (US$ Mn) Market Share by End Userin 2022
- Figure 103: Eastern Europe Bot Services Market Attractiveness Analysis by End User, 2016-2032
- Figure 104: Eastern Europe Bot Services Market Revenue (US$ Mn) Market Share by Country in 2022
- Figure 105: Eastern Europe Bot Services Market Attractiveness Analysis by Country, 2016-2032
- Figure 106: Eastern Europe Bot Services Market Revenue (US$ Mn) (2016-2032)
- Figure 107: Eastern Europe Bot Services Market Revenue (US$ Mn) Comparison by Country (2016-2032)
- Figure 108: Eastern Europe Bot Services Market Revenue (US$ Mn) Comparison by Technology (2016-2032)
- Figure 109: Eastern Europe Bot Services Market Revenue (US$ Mn) Comparison by Application (2016-2032)
- Figure 110: Eastern Europe Bot Services Market Revenue (US$ Mn) Comparison by Mode (2016-2032)
- Figure 111: Eastern Europe Bot Services Market Revenue (US$ Mn) Comparison by Deployment (2016-2032)
- Figure 112: Eastern Europe Bot Services Market Revenue (US$ Mn) Comparison by End User (2016-2032)
- Figure 113: Eastern Europe Bot Services Market Y-o-Y Growth Rate Comparison by Country (2016-2032)
- Figure 114: Eastern Europe Bot Services Market Y-o-Y Growth Rate Comparison by Technology (2016-2032)
- Figure 115: Eastern Europe Bot Services Market Y-o-Y Growth Rate Comparison by Application (2016-2032)
- Figure 116: Eastern Europe Bot Services Market Y-o-Y Growth Rate Comparison by Mode (2016-2032)
- Figure 117: Eastern Europe Bot Services Market Y-o-Y Growth Rate Comparison by Deployment (2016-2032)
- Figure 118: Eastern Europe Bot Services Market Y-o-Y Growth Rate Comparison by End User (2016-2032)
- Figure 119: Eastern Europe Bot Services Market Share Comparison by Country (2016-2032)
- Figure 120: Eastern Europe Bot Services Market Share Comparison by Technology (2016-2032)
- Figure 121: Eastern Europe Bot Services Market Share Comparison by Application (2016-2032)
- Figure 122: Eastern Europe Bot Services Market Share Comparison by Mode (2016-2032)
- Figure 123: Eastern Europe Bot Services Market Share Comparison by Deployment (2016-2032)
- Figure 124: Eastern Europe Bot Services Market Share Comparison by End User (2016-2032)
- Figure 125: APAC Bot Services Market Revenue (US$ Mn) Market Share by Technologyin 2022
- Figure 126: APAC Bot Services Market Attractiveness Analysis by Technology, 2016-2032
- Figure 127: APAC Bot Services Market Revenue (US$ Mn) Market Share by Applicationin 2022
- Figure 128: APAC Bot Services Market Attractiveness Analysis by Application, 2016-2032
- Figure 129: APAC Bot Services Market Revenue (US$ Mn) Market Share by Modein 2022
- Figure 130: APAC Bot Services Market Attractiveness Analysis by Mode, 2016-2032
- Figure 131: APAC Bot Services Market Revenue (US$ Mn) Market Share by Deploymentin 2022
- Figure 132: APAC Bot Services Market Attractiveness Analysis by Deployment, 2016-2032
- Figure 133: APAC Bot Services Market Revenue (US$ Mn) Market Share by End Userin 2022
- Figure 134: APAC Bot Services Market Attractiveness Analysis by End User, 2016-2032
- Figure 135: APAC Bot Services Market Revenue (US$ Mn) Market Share by Country in 2022
- Figure 136: APAC Bot Services Market Attractiveness Analysis by Country, 2016-2032
- Figure 137: APAC Bot Services Market Revenue (US$ Mn) (2016-2032)
- Figure 138: APAC Bot Services Market Revenue (US$ Mn) Comparison by Country (2016-2032)
- Figure 139: APAC Bot Services Market Revenue (US$ Mn) Comparison by Technology (2016-2032)
- Figure 140: APAC Bot Services Market Revenue (US$ Mn) Comparison by Application (2016-2032)
- Figure 141: APAC Bot Services Market Revenue (US$ Mn) Comparison by Mode (2016-2032)
- Figure 142: APAC Bot Services Market Revenue (US$ Mn) Comparison by Deployment (2016-2032)
- Figure 143: APAC Bot Services Market Revenue (US$ Mn) Comparison by End User (2016-2032)
- Figure 144: APAC Bot Services Market Y-o-Y Growth Rate Comparison by Country (2016-2032)
- Figure 145: APAC Bot Services Market Y-o-Y Growth Rate Comparison by Technology (2016-2032)
- Figure 146: APAC Bot Services Market Y-o-Y Growth Rate Comparison by Application (2016-2032)
- Figure 147: APAC Bot Services Market Y-o-Y Growth Rate Comparison by Mode (2016-2032)
- Figure 148: APAC Bot Services Market Y-o-Y Growth Rate Comparison by Deployment (2016-2032)
- Figure 149: APAC Bot Services Market Y-o-Y Growth Rate Comparison by End User (2016-2032)
- Figure 150: APAC Bot Services Market Share Comparison by Country (2016-2032)
- Figure 151: APAC Bot Services Market Share Comparison by Technology (2016-2032)
- Figure 152: APAC Bot Services Market Share Comparison by Application (2016-2032)
- Figure 153: APAC Bot Services Market Share Comparison by Mode (2016-2032)
- Figure 154: APAC Bot Services Market Share Comparison by Deployment (2016-2032)
- Figure 155: APAC Bot Services Market Share Comparison by End User (2016-2032)
- Figure 156: Latin America Bot Services Market Revenue (US$ Mn) Market Share by Technologyin 2022
- Figure 157: Latin America Bot Services Market Attractiveness Analysis by Technology, 2016-2032
- Figure 158: Latin America Bot Services Market Revenue (US$ Mn) Market Share by Applicationin 2022
- Figure 159: Latin America Bot Services Market Attractiveness Analysis by Application, 2016-2032
- Figure 160: Latin America Bot Services Market Revenue (US$ Mn) Market Share by Modein 2022
- Figure 161: Latin America Bot Services Market Attractiveness Analysis by Mode, 2016-2032
- Figure 162: Latin America Bot Services Market Revenue (US$ Mn) Market Share by Deploymentin 2022
- Figure 163: Latin America Bot Services Market Attractiveness Analysis by Deployment, 2016-2032
- Figure 164: Latin America Bot Services Market Revenue (US$ Mn) Market Share by End Userin 2022
- Figure 165: Latin America Bot Services Market Attractiveness Analysis by End User, 2016-2032
- Figure 166: Latin America Bot Services Market Revenue (US$ Mn) Market Share by Country in 2022
- Figure 167: Latin America Bot Services Market Attractiveness Analysis by Country, 2016-2032
- Figure 168: Latin America Bot Services Market Revenue (US$ Mn) (2016-2032)
- Figure 169: Latin America Bot Services Market Revenue (US$ Mn) Comparison by Country (2016-2032)
- Figure 170: Latin America Bot Services Market Revenue (US$ Mn) Comparison by Technology (2016-2032)
- Figure 171: Latin America Bot Services Market Revenue (US$ Mn) Comparison by Application (2016-2032)
- Figure 172: Latin America Bot Services Market Revenue (US$ Mn) Comparison by Mode (2016-2032)
- Figure 173: Latin America Bot Services Market Revenue (US$ Mn) Comparison by Deployment (2016-2032)
- Figure 174: Latin America Bot Services Market Revenue (US$ Mn) Comparison by End User (2016-2032)
- Figure 175: Latin America Bot Services Market Y-o-Y Growth Rate Comparison by Country (2016-2032)
- Figure 176: Latin America Bot Services Market Y-o-Y Growth Rate Comparison by Technology (2016-2032)
- Figure 177: Latin America Bot Services Market Y-o-Y Growth Rate Comparison by Application (2016-2032)
- Figure 178: Latin America Bot Services Market Y-o-Y Growth Rate Comparison by Mode (2016-2032)
- Figure 179: Latin America Bot Services Market Y-o-Y Growth Rate Comparison by Deployment (2016-2032)
- Figure 180: Latin America Bot Services Market Y-o-Y Growth Rate Comparison by End User (2016-2032)
- Figure 181: Latin America Bot Services Market Share Comparison by Country (2016-2032)
- Figure 182: Latin America Bot Services Market Share Comparison by Technology (2016-2032)
- Figure 183: Latin America Bot Services Market Share Comparison by Application (2016-2032)
- Figure 184: Latin America Bot Services Market Share Comparison by Mode (2016-2032)
- Figure 185: Latin America Bot Services Market Share Comparison by Deployment (2016-2032)
- Figure 186: Latin America Bot Services Market Share Comparison by End User (2016-2032)
- Figure 187: Middle East & Africa Bot Services Market Revenue (US$ Mn) Market Share by Technologyin 2022
- Figure 188: Middle East & Africa Bot Services Market Attractiveness Analysis by Technology, 2016-2032
- Figure 189: Middle East & Africa Bot Services Market Revenue (US$ Mn) Market Share by Applicationin 2022
- Figure 190: Middle East & Africa Bot Services Market Attractiveness Analysis by Application, 2016-2032
- Figure 191: Middle East & Africa Bot Services Market Revenue (US$ Mn) Market Share by Modein 2022
- Figure 192: Middle East & Africa Bot Services Market Attractiveness Analysis by Mode, 2016-2032
- Figure 193: Middle East & Africa Bot Services Market Revenue (US$ Mn) Market Share by Deploymentin 2022
- Figure 194: Middle East & Africa Bot Services Market Attractiveness Analysis by Deployment, 2016-2032
- Figure 195: Middle East & Africa Bot Services Market Revenue (US$ Mn) Market Share by End Userin 2022
- Figure 196: Middle East & Africa Bot Services Market Attractiveness Analysis by End User, 2016-2032
- Figure 197: Middle East & Africa Bot Services Market Revenue (US$ Mn) Market Share by Country in 2022
- Figure 198: Middle East & Africa Bot Services Market Attractiveness Analysis by Country, 2016-2032
- Figure 199: Middle East & Africa Bot Services Market Revenue (US$ Mn) (2016-2032)
- Figure 200: Middle East & Africa Bot Services Market Revenue (US$ Mn) Comparison by Country (2016-2032)
- Figure 201: Middle East & Africa Bot Services Market Revenue (US$ Mn) Comparison by Technology (2016-2032)
- Figure 202: Middle East & Africa Bot Services Market Revenue (US$ Mn) Comparison by Application (2016-2032)
- Figure 203: Middle East & Africa Bot Services Market Revenue (US$ Mn) Comparison by Mode (2016-2032)
- Figure 204: Middle East & Africa Bot Services Market Revenue (US$ Mn) Comparison by Deployment (2016-2032)
- Figure 205: Middle East & Africa Bot Services Market Revenue (US$ Mn) Comparison by End User (2016-2032)
- Figure 206: Middle East & Africa Bot Services Market Y-o-Y Growth Rate Comparison by Country (2016-2032)
- Figure 207: Middle East & Africa Bot Services Market Y-o-Y Growth Rate Comparison by Technology (2016-2032)
- Figure 208: Middle East & Africa Bot Services Market Y-o-Y Growth Rate Comparison by Application (2016-2032)
- Figure 209: Middle East & Africa Bot Services Market Y-o-Y Growth Rate Comparison by Mode (2016-2032)
- Figure 210: Middle East & Africa Bot Services Market Y-o-Y Growth Rate Comparison by Deployment (2016-2032)
- Figure 211: Middle East & Africa Bot Services Market Y-o-Y Growth Rate Comparison by End User (2016-2032)
- Figure 212: Middle East & Africa Bot Services Market Share Comparison by Country (2016-2032)
- Figure 213: Middle East & Africa Bot Services Market Share Comparison by Technology (2016-2032)
- Figure 214: Middle East & Africa Bot Services Market Share Comparison by Application (2016-2032)
- Figure 215: Middle East & Africa Bot Services Market Share Comparison by Mode (2016-2032)
- Figure 216: Middle East & Africa Bot Services Market Share Comparison by Deployment (2016-2032)
- Figure 217: Middle East & Africa Bot Services Market Share Comparison by End User (2016-2032)
"
- List of Tables
- "
- Table 1: Global Bot Services Market Comparison by Technology (2016-2032)
- Table 2: Global Bot Services Market Comparison by Application (2016-2032)
- Table 3: Global Bot Services Market Comparison by Mode (2016-2032)
- Table 4: Global Bot Services Market Comparison by Deployment (2016-2032)
- Table 5: Global Bot Services Market Comparison by End User (2016-2032)
- Table 6: Global Bot Services Market Revenue (US$ Mn) Comparison by Region (2016-2032)
- Table 7: Global Bot Services Market Revenue (US$ Mn) (2016-2032)
- Table 8: Global Bot Services Market Revenue (US$ Mn) Comparison by Region (2016-2032)
- Table 9: Global Bot Services Market Revenue (US$ Mn) Comparison by Technology (2016-2032)
- Table 10: Global Bot Services Market Revenue (US$ Mn) Comparison by Application (2016-2032)
- Table 11: Global Bot Services Market Revenue (US$ Mn) Comparison by Mode (2016-2032)
- Table 12: Global Bot Services Market Revenue (US$ Mn) Comparison by Deployment (2016-2032)
- Table 13: Global Bot Services Market Revenue (US$ Mn) Comparison by End User (2016-2032)
- Table 14: Global Bot Services Market Y-o-Y Growth Rate Comparison by Region (2016-2032)
- Table 15: Global Bot Services Market Y-o-Y Growth Rate Comparison by Technology (2016-2032)
- Table 16: Global Bot Services Market Y-o-Y Growth Rate Comparison by Application (2016-2032)
- Table 17: Global Bot Services Market Y-o-Y Growth Rate Comparison by Mode (2016-2032)
- Table 18: Global Bot Services Market Y-o-Y Growth Rate Comparison by Deployment (2016-2032)
- Table 19: Global Bot Services Market Y-o-Y Growth Rate Comparison by End User (2016-2032)
- Table 20: Global Bot Services Market Share Comparison by Region (2016-2032)
- Table 21: Global Bot Services Market Share Comparison by Technology (2016-2032)
- Table 22: Global Bot Services Market Share Comparison by Application (2016-2032)
- Table 23: Global Bot Services Market Share Comparison by Mode (2016-2032)
- Table 24: Global Bot Services Market Share Comparison by Deployment (2016-2032)
- Table 25: Global Bot Services Market Share Comparison by End User (2016-2032)
- Table 26: North America Bot Services Market Comparison by Application (2016-2032)
- Table 27: North America Bot Services Market Comparison by Mode (2016-2032)
- Table 28: North America Bot Services Market Comparison by Deployment (2016-2032)
- Table 29: North America Bot Services Market Comparison by End User (2016-2032)
- Table 30: North America Bot Services Market Revenue (US$ Mn) Comparison by Country (2016-2032)
- Table 31: North America Bot Services Market Revenue (US$ Mn) (2016-2032)
- Table 32: North America Bot Services Market Revenue (US$ Mn) Comparison by Country (2016-2032)
- Table 33: North America Bot Services Market Revenue (US$ Mn) Comparison by Technology (2016-2032)
- Table 34: North America Bot Services Market Revenue (US$ Mn) Comparison by Application (2016-2032)
- Table 35: North America Bot Services Market Revenue (US$ Mn) Comparison by Mode (2016-2032)
- Table 36: North America Bot Services Market Revenue (US$ Mn) Comparison by Deployment (2016-2032)
- Table 37: North America Bot Services Market Revenue (US$ Mn) Comparison by End User (2016-2032)
- Table 38: North America Bot Services Market Y-o-Y Growth Rate Comparison by Country (2016-2032)
- Table 39: North America Bot Services Market Y-o-Y Growth Rate Comparison by Technology (2016-2032)
- Table 40: North America Bot Services Market Y-o-Y Growth Rate Comparison by Application (2016-2032)
- Table 41: North America Bot Services Market Y-o-Y Growth Rate Comparison by Mode (2016-2032)
- Table 42: North America Bot Services Market Y-o-Y Growth Rate Comparison by Deployment (2016-2032)
- Table 43: North America Bot Services Market Y-o-Y Growth Rate Comparison by End User (2016-2032)
- Table 44: North America Bot Services Market Share Comparison by Country (2016-2032)
- Table 45: North America Bot Services Market Share Comparison by Technology (2016-2032)
- Table 46: North America Bot Services Market Share Comparison by Application (2016-2032)
- Table 47: North America Bot Services Market Share Comparison by Mode (2016-2032)
- Table 48: North America Bot Services Market Share Comparison by Deployment (2016-2032)
- Table 49: North America Bot Services Market Share Comparison by End User (2016-2032)
- Table 50: Western Europe Bot Services Market Comparison by Technology (2016-2032)
- Table 51: Western Europe Bot Services Market Comparison by Application (2016-2032)
- Table 52: Western Europe Bot Services Market Comparison by Mode (2016-2032)
- Table 53: Western Europe Bot Services Market Comparison by Deployment (2016-2032)
- Table 54: Western Europe Bot Services Market Comparison by End User (2016-2032)
- Table 55: Western Europe Bot Services Market Revenue (US$ Mn) Comparison by Country (2016-2032)
- Table 56: Western Europe Bot Services Market Revenue (US$ Mn) (2016-2032)
- Table 57: Western Europe Bot Services Market Revenue (US$ Mn) Comparison by Country (2016-2032)
- Table 58: Western Europe Bot Services Market Revenue (US$ Mn) Comparison by Technology (2016-2032)
- Table 59: Western Europe Bot Services Market Revenue (US$ Mn) Comparison by Application (2016-2032)
- Table 60: Western Europe Bot Services Market Revenue (US$ Mn) Comparison by Mode (2016-2032)
- Table 61: Western Europe Bot Services Market Revenue (US$ Mn) Comparison by Deployment (2016-2032)
- Table 62: Western Europe Bot Services Market Revenue (US$ Mn) Comparison by End User (2016-2032)
- Table 63: Western Europe Bot Services Market Y-o-Y Growth Rate Comparison by Country (2016-2032)
- Table 64: Western Europe Bot Services Market Y-o-Y Growth Rate Comparison by Technology (2016-2032)
- Table 65: Western Europe Bot Services Market Y-o-Y Growth Rate Comparison by Application (2016-2032)
- Table 66: Western Europe Bot Services Market Y-o-Y Growth Rate Comparison by Mode (2016-2032)
- Table 67: Western Europe Bot Services Market Y-o-Y Growth Rate Comparison by Deployment (2016-2032)
- Table 68: Western Europe Bot Services Market Y-o-Y Growth Rate Comparison by End User (2016-2032)
- Table 69: Western Europe Bot Services Market Share Comparison by Country (2016-2032)
- Table 70: Western Europe Bot Services Market Share Comparison by Technology (2016-2032)
- Table 71: Western Europe Bot Services Market Share Comparison by Application (2016-2032)
- Table 72: Western Europe Bot Services Market Share Comparison by Mode (2016-2032)
- Table 73: Western Europe Bot Services Market Share Comparison by Deployment (2016-2032)
- Table 74: Western Europe Bot Services Market Share Comparison by End User (2016-2032)
- Table 75: Eastern Europe Bot Services Market Comparison by Technology (2016-2032)
- Table 76: Eastern Europe Bot Services Market Comparison by Application (2016-2032)
- Table 77: Eastern Europe Bot Services Market Comparison by Mode (2016-2032)
- Table 78: Eastern Europe Bot Services Market Comparison by Deployment (2016-2032)
- Table 79: Eastern Europe Bot Services Market Comparison by End User (2016-2032)
- Table 80: Eastern Europe Bot Services Market Revenue (US$ Mn) Comparison by Country (2016-2032)
- Table 81: Eastern Europe Bot Services Market Revenue (US$ Mn) (2016-2032)
- Table 82: Eastern Europe Bot Services Market Revenue (US$ Mn) Comparison by Country (2016-2032)
- Table 83: Eastern Europe Bot Services Market Revenue (US$ Mn) Comparison by Technology (2016-2032)
- Table 84: Eastern Europe Bot Services Market Revenue (US$ Mn) Comparison by Application (2016-2032)
- Table 85: Eastern Europe Bot Services Market Revenue (US$ Mn) Comparison by Mode (2016-2032)
- Table 86: Eastern Europe Bot Services Market Revenue (US$ Mn) Comparison by Deployment (2016-2032)
- Table 87: Eastern Europe Bot Services Market Revenue (US$ Mn) Comparison by End User (2016-2032)
- Table 88: Eastern Europe Bot Services Market Y-o-Y Growth Rate Comparison by Country (2016-2032)
- Table 89: Eastern Europe Bot Services Market Y-o-Y Growth Rate Comparison by Technology (2016-2032)
- Table 90: Eastern Europe Bot Services Market Y-o-Y Growth Rate Comparison by Application (2016-2032)
- Table 91: Eastern Europe Bot Services Market Y-o-Y Growth Rate Comparison by Mode (2016-2032)
- Table 92: Eastern Europe Bot Services Market Y-o-Y Growth Rate Comparison by Deployment (2016-2032)
- Table 93: Eastern Europe Bot Services Market Y-o-Y Growth Rate Comparison by End User (2016-2032)
- Table 94: Eastern Europe Bot Services Market Share Comparison by Country (2016-2032)
- Table 95: Eastern Europe Bot Services Market Share Comparison by Technology (2016-2032)
- Table 96: Eastern Europe Bot Services Market Share Comparison by Application (2016-2032)
- Table 97: Eastern Europe Bot Services Market Share Comparison by Mode (2016-2032)
- Table 98: Eastern Europe Bot Services Market Share Comparison by Deployment (2016-2032)
- Table 99: Eastern Europe Bot Services Market Share Comparison by End User (2016-2032)
- Table 100: APAC Bot Services Market Comparison by Technology (2016-2032)
- Table 101: APAC Bot Services Market Comparison by Application (2016-2032)
- Table 102: APAC Bot Services Market Comparison by Mode (2016-2032)
- Table 103: APAC Bot Services Market Comparison by Deployment (2016-2032)
- Table 104: APAC Bot Services Market Comparison by End User (2016-2032)
- Table 105: APAC Bot Services Market Revenue (US$ Mn) Comparison by Country (2016-2032)
- Table 106: APAC Bot Services Market Revenue (US$ Mn) (2016-2032)
- Table 107: APAC Bot Services Market Revenue (US$ Mn) Comparison by Country (2016-2032)
- Table 108: APAC Bot Services Market Revenue (US$ Mn) Comparison by Technology (2016-2032)
- Table 109: APAC Bot Services Market Revenue (US$ Mn) Comparison by Application (2016-2032)
- Table 110: APAC Bot Services Market Revenue (US$ Mn) Comparison by Mode (2016-2032)
- Table 111: APAC Bot Services Market Revenue (US$ Mn) Comparison by Deployment (2016-2032)
- Table 112: APAC Bot Services Market Revenue (US$ Mn) Comparison by End User (2016-2032)
- Table 113: APAC Bot Services Market Y-o-Y Growth Rate Comparison by Country (2016-2032)
- Table 114: APAC Bot Services Market Y-o-Y Growth Rate Comparison by Technology (2016-2032)
- Table 115: APAC Bot Services Market Y-o-Y Growth Rate Comparison by Application (2016-2032)
- Table 116: APAC Bot Services Market Y-o-Y Growth Rate Comparison by Mode (2016-2032)
- Table 117: APAC Bot Services Market Y-o-Y Growth Rate Comparison by Deployment (2016-2032)
- Table 118: APAC Bot Services Market Y-o-Y Growth Rate Comparison by End User (2016-2032)
- Table 119: APAC Bot Services Market Share Comparison by Country (2016-2032)
- Table 120: APAC Bot Services Market Share Comparison by Technology (2016-2032)
- Table 121: APAC Bot Services Market Share Comparison by Application (2016-2032)
- Table 122: APAC Bot Services Market Share Comparison by Mode (2016-2032)
- Table 123: APAC Bot Services Market Share Comparison by Deployment (2016-2032)
- Table 124: APAC Bot Services Market Share Comparison by End User (2016-2032)
- Table 125: Latin America Bot Services Market Comparison by Technology (2016-2032)
- Table 126: Latin America Bot Services Market Comparison by Application (2016-2032)
- Table 127: Latin America Bot Services Market Comparison by Mode (2016-2032)
- Table 128: Latin America Bot Services Market Comparison by Deployment (2016-2032)
- Table 129: Latin America Bot Services Market Comparison by End User (2016-2032)
- Table 130: Latin America Bot Services Market Revenue (US$ Mn) Comparison by Country (2016-2032)
- Table 131: Latin America Bot Services Market Revenue (US$ Mn) (2016-2032)
- Table 132: Latin America Bot Services Market Revenue (US$ Mn) Comparison by Country (2016-2032)
- Table 133: Latin America Bot Services Market Revenue (US$ Mn) Comparison by Technology (2016-2032)
- Table 134: Latin America Bot Services Market Revenue (US$ Mn) Comparison by Application (2016-2032)
- Table 135: Latin America Bot Services Market Revenue (US$ Mn) Comparison by Mode (2016-2032)
- Table 136: Latin America Bot Services Market Revenue (US$ Mn) Comparison by Deployment (2016-2032)
- Table 137: Latin America Bot Services Market Revenue (US$ Mn) Comparison by End User (2016-2032)
- Table 138: Latin America Bot Services Market Y-o-Y Growth Rate Comparison by Country (2016-2032)
- Table 139: Latin America Bot Services Market Y-o-Y Growth Rate Comparison by Technology (2016-2032)
- Table 140: Latin America Bot Services Market Y-o-Y Growth Rate Comparison by Application (2016-2032)
- Table 141: Latin America Bot Services Market Y-o-Y Growth Rate Comparison by Mode (2016-2032)
- Table 142: Latin America Bot Services Market Y-o-Y Growth Rate Comparison by Deployment (2016-2032)
- Table 143: Latin America Bot Services Market Y-o-Y Growth Rate Comparison by End User (2016-2032)
- Table 144: Latin America Bot Services Market Share Comparison by Country (2016-2032)
- Table 145: Latin America Bot Services Market Share Comparison by Technology (2016-2032)
- Table 146: Latin America Bot Services Market Share Comparison by Application (2016-2032)
- Table 147: Latin America Bot Services Market Share Comparison by Mode (2016-2032)
- Table 148: Latin America Bot Services Market Share Comparison by Deployment (2016-2032)
- Table 149: Latin America Bot Services Market Share Comparison by End User (2016-2032)
- Table 150: Middle East & Africa Bot Services Market Comparison by Technology (2016-2032)
- Table 151: Middle East & Africa Bot Services Market Comparison by Application (2016-2032)
- Table 152: Middle East & Africa Bot Services Market Comparison by Mode (2016-2032)
- Table 153: Middle East & Africa Bot Services Market Comparison by Deployment (2016-2032)
- Table 154: Middle East & Africa Bot Services Market Comparison by End User (2016-2032)
- Table 155: Middle East & Africa Bot Services Market Revenue (US$ Mn) Comparison by Country (2016-2032)
- Table 156: Middle East & Africa Bot Services Market Revenue (US$ Mn) (2016-2032)
- Table 157: Middle East & Africa Bot Services Market Revenue (US$ Mn) Comparison by Country (2016-2032)
- Table 158: Middle East & Africa Bot Services Market Revenue (US$ Mn) Comparison by Technology (2016-2032)
- Table 159: Middle East & Africa Bot Services Market Revenue (US$ Mn) Comparison by Application (2016-2032)
- Table 160: Middle East & Africa Bot Services Market Revenue (US$ Mn) Comparison by Mode (2016-2032)
- Table 161: Middle East & Africa Bot Services Market Revenue (US$ Mn) Comparison by Deployment (2016-2032)
- Table 162: Middle East & Africa Bot Services Market Revenue (US$ Mn) Comparison by End User (2016-2032)
- Table 163: Middle East & Africa Bot Services Market Y-o-Y Growth Rate Comparison by Country (2016-2032)
- Table 164: Middle East & Africa Bot Services Market Y-o-Y Growth Rate Comparison by Technology (2016-2032)
- Table 165: Middle East & Africa Bot Services Market Y-o-Y Growth Rate Comparison by Application (2016-2032)
- Table 166: Middle East & Africa Bot Services Market Y-o-Y Growth Rate Comparison by Mode (2016-2032)
- Table 167: Middle East & Africa Bot Services Market Y-o-Y Growth Rate Comparison by Deployment (2016-2032)
- Table 168: Middle East & Africa Bot Services Market Y-o-Y Growth Rate Comparison by End User (2016-2032)
- Table 169: Middle East & Africa Bot Services Market Share Comparison by Country (2016-2032)
- Table 170: Middle East & Africa Bot Services Market Share Comparison by Technology (2016-2032)
- Table 171: Middle East & Africa Bot Services Market Share Comparison by Application (2016-2032)
- Table 172: Middle East & Africa Bot Services Market Share Comparison by Mode (2016-2032)
- Table 173: Middle East & Africa Bot Services Market Share Comparison by Deployment (2016-2032)
- Table 174: Middle East & Africa Bot Services Market Share Comparison by End User (2016-2032)
- 1. Executive Summary
-
- Microsoft Corporation
- IBM Corporation
- Google LLC
- Amazon Web Services, Inc.
- Nuance Communications, Inc.
- Facebook, Inc.
- Oracle Corporation
- Artificial Solutions International AB
- Inbenta Technologies Inc.
- Next IT Corporation
- Rasa Technologies GmbH
- Creative Virtual Ltd.
- SoundHound Inc.
- Baidu, Inc.
- Clinc, Inc.
Our Clients


View Our Licence Options
