
Boric Acid Market By Purity Grade, By Application(Glass and Fiberglass , Medical, Flame Retardants, Pest Control, Nutritional Supplements, Others), By End-User(Fiberglass Industry, Ceramics, Others),By Distribution Channel(Wholesale and Retail, E-commerce), By Region And Companies - Industry Segment Outlook, Market Assessment, Competition Scenario, Trends, And Forecast 2023-2032
-
17549
-
Nov 2023
-
239
-


-
This report was compiled by Shreyas Rokade Shreyas Rokade is a seasoned Research Analyst with CMFE, bringing extensive expertise in market research and consulting, with a strong background in Chemical Engineering. Correspondence Team Lead-CMFE Linkedin | Detailed Market research Methodology Our methodology involves a mix of primary research, including interviews with leading mental health experts, and secondary research from reputable medical journals and databases. View Detailed Methodology Page
-
Quick Navigation
Report Overview
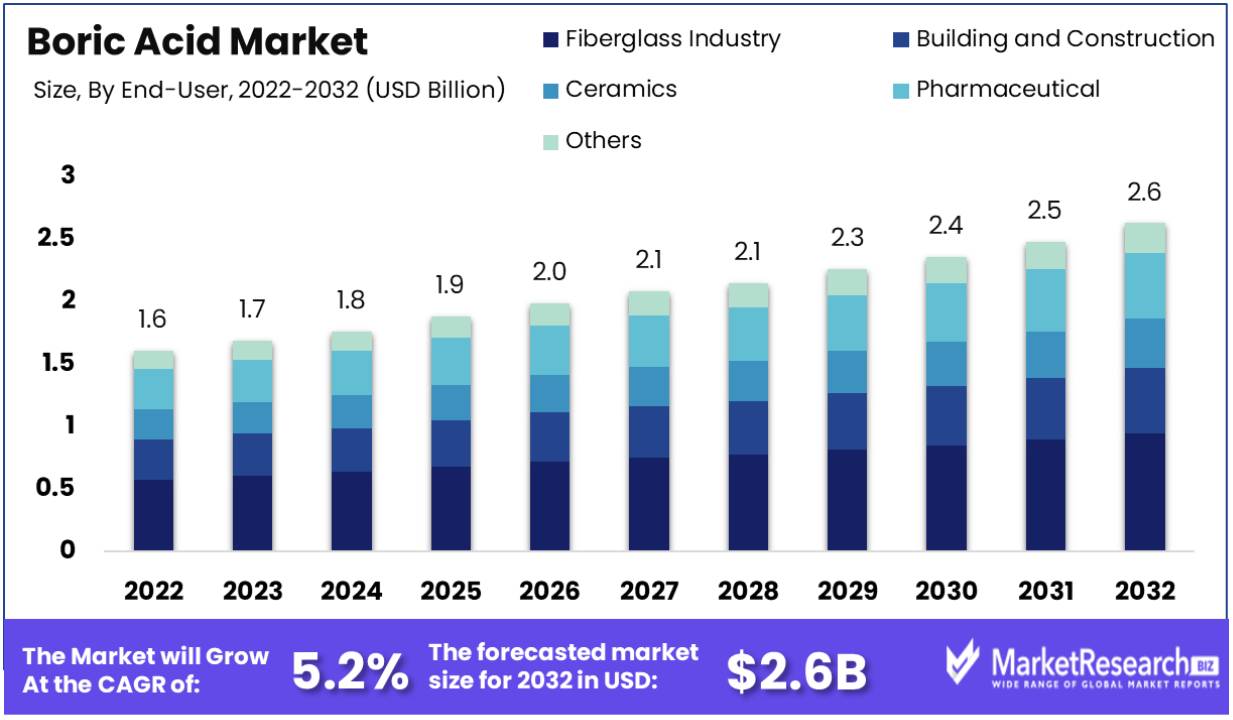
Boric Acid Market size is expected to be worth around USD 2.6 Bn by 2032 from USD 1.6 Bn in 2022, growing at a CAGR of 5.2% during the forecast period from 2023 to 2032.
The huge demand for boric acid in the industrial sector is one of the major driving factors in the boric acid market. Boric acid is mainly used for commercial and residential purposes. It generates oils, lubricants, textile fiber glasses, and welding procedures. It is also being used as a pesticide, antibacterial substance, antimicrobial, and flame retardant in plants.
For example, the Royal Society of Chemistry conducted a study on boric acid-modified walnut shell biochar (WAB4) to remove common pesticides from rice field water. WAB4 exhibited a high absorption capacity (>70%) for tricyclazole, propiconazole, imidacloprid, and thiamethoxam, across pH levels of 3-9, with specific capacities between 112.27 to 171.67 mg g−1.
The absorption process was then followed by pseudo-second-order kinetics and conformed to the Freundlich model. Mechanisms included H2O bonding, pore filling, hydrophobic effects, and π–π connections. WAB4 outcasted other adsorbents in real water samples and displayed no substantial harmfulness to Daphnia magna. This environmentally friendly tactic holds promise for efficient pesticide elimination, particularly in agricultural water management and environmental preservation.
The rise in demand for the renewable energy industry is a substantial element in the global boric acid market. Though the prices have dropped and more carbon restrained in the future for solar technology has been guaranteed, the need for renewable energy resources like solar energy has increased rapidly. The market is divided which gives advantages to the service provider who manufactures the glasses and makes it conceivable to use both inorganic and organic business growth procedures to get a benefit over the competitors.
The usage of boric acid in personal care items is constrained under European regulations, which have been categorized under the group of a carcinogenic compound and this is likely to delay the market growth. However, the upsurge in demand as an energy-efficient compound combined with the requirement for borosilicate glass in cookware and laboratory applications are likely to generate a potential market avenue. Thus helping in the expansion of market growth for boric acid.
Driving factors
Cross-Sectoral Applications Broaden Boric Acid's Market Scope
The demand for boric acid across various industries is a significant factor contributing to the expansion of its market. As a versatile chemical with antiseptic, antifungal agents, and insecticidal properties, boric acid finds applications in a multitude of sectors, ranging from glass and ceramics manufacturing to the production of pharmaceuticals and personal care products. Its role in the agricultural sector as a micronutrient and pest control agent further cements its importance across diverse industries.
The market is seeing an uptick in demand for boric acid, especially in industries focused on sustainable practices, as it is perceived as a safer alternative to more toxic chemicals. Additionally, the electronics industry fuels demand due to boric acid's use in the production of LCD displays. The ongoing trend indicates that as industries continue to innovate and seek out environmentally friendly inputs, boric acid will play an increasingly critical role, likely leading to market growth and expansion of production capacities to meet global demand.
Global Need for Insulating Materials Drives Boric Acid Market Growth
The global need for insulating materials, particularly in the construction and housing sectors, is driving the growth of the boric acid market. Boric acid is a key component in the production of fiberglass insulation, which is essential for energy-efficient buildings. As the world increasingly focuses on energy conservation, the demand for high-performance insulation materials is rising.
This trend is bolstered by stringent building regulations and the growing popularity of green buildings that prioritize thermal efficiency. As predictive analytics point to a continued emphasis on energy savings and carbon footprint reduction, boric acid is likely to maintain its importance in manufacturing insulating materials.
This sustained demand from the construction industry is expected to have long-term positive effects on the boric acid market, with potential increases in innovation within insulation products and expanded production of boric acid to meet global construction needs.
Relocation of Industrial Capacity Boosts Boric Acid Production
The shift in manufacturing units to different geographic regions is influencing the boric acid market. This shift, often towards countries with lower production costs, is creating new epicenters of manufacturing activity. As industries relocate, there is a corresponding demand for boric acid in these emerging industrial regions, driven by its use in various industrial processes.
The shift often aligns with the proximity to raw materials and targeted markets, reducing logistics costs and streamlining the supply chain for manufacturers. This relocation is anticipated to continue as companies seek to optimize production and capitalize on favorable trade agreements or tax incentives. The long-term implications for the boric acid market include the potential for a more decentralized and globally distributed network of production facilities, which could stabilize supply chains and price volatility.
Restraining Factors
Stringent Regulations and Restrictions Restrain Boric Acid Market Growth
The boric acid market is notably restrained by stringent regulations and restrictions related to its production and application. Boric acid, due to its classification as a hazardous substance, is subject to tight control by various international and regional regulatory bodies.
These regulations influence the handling, transportation, and usage of boric acid in industrial applications, leading to increased compliance costs for manufacturers and users. The rigorous safety protocols needed to manage the boric acid industry can also limit its use in consumer products, thus hindering market expansion as companies seek less regulated alternatives.
Fluctuating Prices of Boron Minerals Restrain Boric Acid Market Growth
Volatility in the prices of boron minerals, the raw materials for boric acid production, imposes a significant restraint on the industry. Fluctuations in the cost of these minerals, often driven by changes in international trade policies, availability, and mining costs, directly affect the stability of boric acid pricing.
Such unpredictability can challenge budgeting and financial planning for producers and downstream users, making it difficult to maintain consistent profit margins. Additionally, when the prices of boron minerals rise, the cost of producing boric acid increases, potentially decreasing its competitiveness compared to alternative products and limiting market growth.
Segmentation Analysis of Boric Acid Market
By Purity Grade Analysis
The ≥99% purity grade segment leads the boric acid market, due to its extensive application in industries that require high purity for product efficacy, particularly in glass and fiberglass production. The superior quality of this purity grade ensures optimal performance in end-products, which is crucial in applications with stringent quality requirements. The growth of this segment is driven by technological advancements in manufacturing processes that demand high-purity chemicals.
The <99% Purity grade segment finds utility in applications where the highest purity is not essential, such as in some forms of pest control and wood preservatives. Its role in market growth is tied to cost-sensitive applications where the benefits of lower purity material balance the performance requirements.
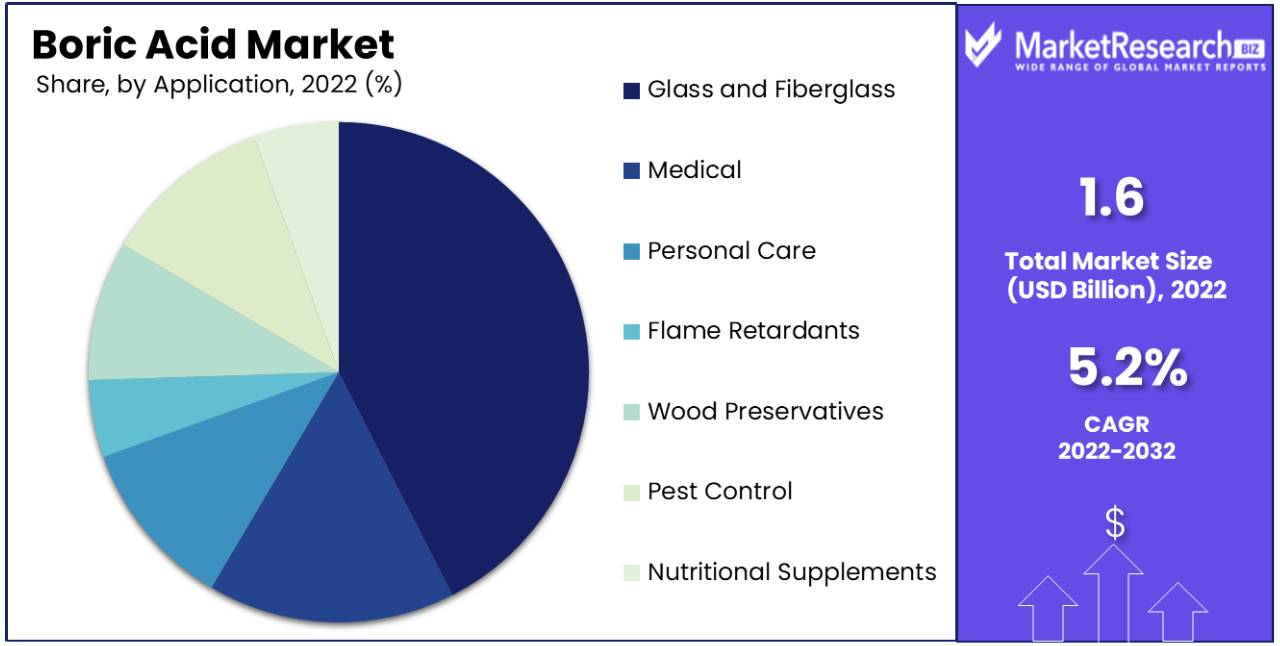
By Application Analysis
Glass and fiberglass production is the most significant application for boric acid, leveraging its properties to enhance heat resistance and strength. As the fiberglass industry expands, driven by demand in the construction and automotive sectors, the need for boric acid intensifies. Its role in producing insulation materials also aligns with the global push for energy efficiency.
While medical and personal care applications represent a smaller share, they are growing due to boric acid's antiseptic and buffering properties. Flame retardants and wood preservatives are vital for safety and durability in construction materials, and pest control applications are driven by the need for effective insecticidal solutions. Nutritional supplements are a niche but growing segment due to boric acid's role in plant nutrition.
By End-User Analysis
The fiberglass industry dominates the end-user market segmentation of the boric acid market, as boric acid is a critical component in fiberglass production, which is integral to a multitude of industries, including automotive and construction. This sector's growth is underpinned by the increasing demand for lightweight and durable composite materials.
Ceramics utilize boric acid for its fluxing properties, improving the quality and durability of ceramic products. In pharmaceuticals, boric acid's antiseptic properties are valued for medical preparations. The 'others' category captures diverse industrial applications that bolster the overall demand.
By Distribution Channel Analysis
Wholesale and retail channels remain the primary means of distribution for boric acid, with large volumes being sold to industrial users and smaller quantities to consumers for various applications. The convenience of bulk purchasing and established supply chains supports the dominance of this channel.
The e-commerce segment, though not dominant, is gaining momentum as businesses and consumers seek the convenience of online ordering and direct-to-door delivery, especially for smaller quantity purchases.
The boric acid market is robust, with high-purity grade boric acid leading due to its critical role in glass and fiberglass applications. The fiberglass industry emerges as the primary end-user, indicative of its integral use in the construction and manufacturing sectors. Traditional wholesale and retail distribution channels continue to facilitate the majority of the market's supply chain, while e-commerce is poised for growth as purchasing patterns shift online.
Key Market Segments
By Purity Grade
- ≥99%
- <99%
By Application
- Glass and Fiberglass
- Medical
- Personal Care
- Flame Retardants
- Wood Preservatives
- Pest Control
- Nutritional Supplements
- Others
By End-User
- Fiberglass Industry
- Building and Construction
- Ceramics
- Pharmaceutical
- Others
By Distribution Channel
- Wholesale and Retail
- E-commerce
Growth Opportunity
Diverse Industrial Demand Offers Growth Opportunity for Boric Acid Market
The growing demand for boric acid across various industries, including glass and fiberglass, the agriculture sector, ceramics, and pharmaceuticals, suggests a broadened scope for market expansion. Boric acid's versatile properties, such as antiseptic and flame-retardant capabilities, make it a valuable commodity. Its use in LCD manufacturing is particularly notable, with the display market expected to grow in the coming years. The diversity of applications promises steady demand, fostering a robust growth environment for the boric acid market.
R&D Investment Offers Progressive Outlook for Boric Acid Market
Increasing research and development spending is a harbinger of growth for the boric acid market. Enhanced R&D investment leads to innovations in product application and efficiency, such as the development of new boric acid-based products for medical or agricultural use. This can result in the expansion of the market into new segments and increase the overall demand. Companies at the forefront of R&D are likely to pioneer these new applications, positioning them advantageously in the industry.
New Product and Acquisition Strategies Offer Expansion Opportunities in Boric Acid Market
The introduction of new products and strategic acquisitions are potent growth catalysts within the boric acid market. By expanding product lines and assimilating new technologies and resources, companies can enhance their market share and penetrate new segments. Acquisitions, particularly, can allow for rapid expansion and access to established customer bases. These strategies reflect an aggressive approach to capturing market opportunities and fostering organic growth through diversification and consolidation.
Regional Analysis
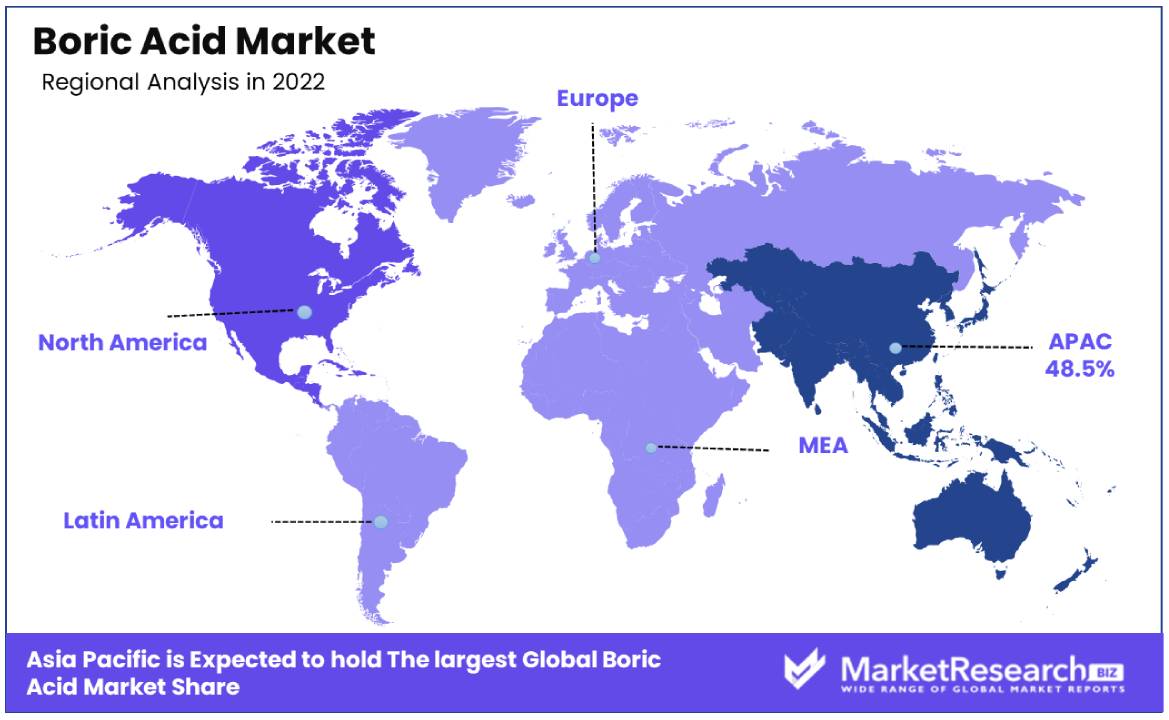
Asia-Pacific Dominates with 45.80% Market Share in the Boric Acid Market
Asia-Pacific leads the boric acid market with a significant 45.80% share, primarily due to the region's expansive industrial base and the pivotal role of agriculture. The high market share is driven by vast production and consumption rates in countries like China, which is not only the world's largest producer of boric acid but also the largest consumer, owing to its substantial industrial activities.
The region's market dynamics are bolstered by its extensive use of boric acid in a multitude of applications such as glass and fiberglass production, flame retardants, and agriculture, particularly as a fertilizer and pest control agent. Additionally, the expanding electronics industry in the region contributes to the demand for boric acid, used in the production of LCD screens.
Forecast implications suggest that Asia-Pacific's dominance is likely to continue, propelled by ongoing industrialization and the expansion of agricultural sectors. The industry could see further expansion with the growing demand for energy-saving appliances and electronics, which use boric acid-based materials.
North America: A Strong Player in the Boric Acid Market
In North America, the boric acid market is characterized by its use in key trends such as glass and fiberglass, wood preservation, and pharmaceuticals. The region's stringent regulations regarding pest control and flame retardants also contribute to the steady demand for boric acid.
The industry is driven by technological advancements in production and recycling processes, as well as a steady demand from the construction industry, where boric acid-based products are used for insulation and other applications. The presence of major boric acid producers in the region supports a resilient industry structure.
Europe: A Mature Market for Boric Acid
Europe's boric acid market benefits from its advanced industrial and agricultural sectors, with a well-established presence in glass manufacturing, ceramics, and as a micronutrient in agriculture. Environmental and health regulations in the region influence the use of boric acid, with an emphasis on sustainable and safe practices.
The European market is also marked by high environmental consciousness, which has led to the development of eco-friendly boric acid products. Furthermore, the pharmaceutical sector contributes to the demand, given boric acid's antiseptic and antifungal properties.
Key Regions and Countries
North America
- The US
- Canada
- Rest of North America
Europe
- Germany
- France
- The UK
- Spain
- Italy
- Russia
- Netherlands
- Rest of Europe
Asia-Pacific
- China
- Japan
- South Korea
- India
- New Zealand
- Singapore
- Thailand
- Vietnam
- Rest of Asia Pacific
Latin America
- Brazil
- Mexico
- Rest of Latin America
Middle East & Africa
- South Africa
- Saudi Arabia
- UAE
- Rest of Middle East & Africa
Key Players Analysis
The boric acid market is marked by the strategic presence of global and specialized companies, each contributing to the sector's composition and direction. Rio Tinto Group and EtiMaden stand out as industry behemoths with substantial mining operations, positioning themselves as cornerstone suppliers with considerable influence over global pricing and supply dynamics. 3M Company's diverse industrial applications of boric acid extend its market reach, fortifying its role in influencing product innovation and end-use sectors.
Borax Inc. and American Borate Company leverage their focused product lines and regional strengths to cater to specific market demands, enhancing their strategic positioning in niche applications. Nirma Limited and NIPPON DENKO CO., LTD. have a strong presence in the Asia-Pacific region, pivotal for market penetration and regional market dynamics.
Promega Corporation and Southern Agricultural Insecticides Inc. illustrate the depth of the market's application range, from biochemical research to agrochemicals, demonstrating the versatility of boric acid. Quiborax S.A. and Minera Santa Rita S.R.L. (MSR) are key in the South American market, contributing to the market's geographic diversity.
Overall, these major players underscore the boric acid market's complexity, with their strategic roles ranging from raw material supply to specialized applications, each influencing the market's evolution in terms of supply security, application development, and regional market dynamics.
Top Key Players in Boric Acid Market
- Rio Tinto Group
- 3M Company
- Borax Inc.
- EtiMaden
- Nirma Limited
- NIPPON DENKO CO. LTD.
- Promega Corporation
- Southern Agricultural Insecticides Inc.
- Quiborax S.A.
- American Borate Company
- Minera Santa Rita S.R.L. (MSR)
- BASF SE
- Gujarat Boron Derivatives Pvt. Ltd.
- Russian Bor
- Searles Valley Minerals
Recent Developments
- In 2023, pH-D Feminine Health introduced the Boric Acid Vaginal Moisturizing Gel to address the discomfort experienced by women during various stages of their feminine health journeys.
- In 2023,Resolution and previous trade agreements between the US and India, India agreed to reduce tariffs on specific US products, including Boric Acid. This reduction in tariffs is expected to enhance economic opportunities for US agricultural producers and promote the export of US products to the Indian market.
- In January 2023, The use of acidic treatments, specifically a weak acid, boric acid (H3BO3), to eliminate surface impurity phases in layered nickel-rich materials. The treatment involves etching layered nickel-rich materials with a trace amount of boric acid.
Report Scope
Report Features Description Market Value (2022) USD 1.6 Bn Forecast Revenue (2032) USD 2.6 Bn CAGR (2023-2032) 5.2% Base Year for Estimation 2022 Historic Period 2016-2022 Forecast Period 2023-2032 Report Coverage Revenue Forecast, Market Dynamics, COVID-19 Impact, Competitive Landscape, Recent Developments Segments Covered By Purity Grade(≥99%, <99%), By Application(Glass and Fiberglass , Medical, Personal Care, Flame Retardants, Wood Preservatives, Pest Control, Nutritional Supplements, Others), By End-User(Fiberglass Industry, Building and Construction, Ceramics, Pharmaceutical, Others),By Distribution Channel(Wholesale and Retail, E-commerce) Regional Analysis North America - The US, Canada, Rest of North America, Europe - Germany, France, The UK, Spain, Italy, Russia, Netherlands, Rest of Europe, Asia-Pacific - China, Japan, South Korea, India, New Zealand, Singapore, Thailand, Vietnam, Rest of Asia Pacific, Latin America - Brazil, Mexico, Rest of Latin America, Middle East & Africa - South Africa, Saudi Arabia, UAE, Rest of Middle East & Africa Competitive Landscape Rio Tinto Group, 3M Company, Borax Inc., EtiMaden, Nirma Limited, NIPPON DENKO CO. LTD., Promega Corporation, Southern Agricultural Insecticides Inc., Quiborax S.A., American Borate Company, Minera Santa Rita S.R.L. (MSR), BASF SE, Gujarat Boron Derivatives Pvt. Ltd., Russian Bor, Searles Valley Minerals Customization Scope Customization for segments, region/country-level will be provided. Moreover, additional customization can be done based on the requirements. Purchase Options We have three licenses to opt for: Single User License, Multi-User License (Up to 5 Users), Corporate Use License (Unlimited User and Printable PDF) -
- 1. Executive Summary
- 1.1. Definition
- 1.2. Taxonomy
- 1.3. Research Scope
- 1.4. Key Analysis
- 1.5. Key Findings by Major Segments
- 1.6. Top strategies by Major Players
- 2. Global Boric Acid Market Overview
- 2.1. Boric Acid Market Dynamics
- 2.1.1. Drivers
- 2.1.2. Opportunities
- 2.1.3. Restraints
- 2.1.4. Challenges
- 2.2. Macro-economic Factors
- 2.3. Regulatory Framework
- 2.4. Market Investment Feasibility Index
- 2.5. PEST Analysis
- 2.6. PORTER’S Five Force Analysis
- 2.7. Drivers & Restraints Impact Analysis
- 2.8. Industry Chain Analysis
- 2.9. Cost Structure Analysis
- 2.10. Marketing Strategy
- 2.11. Russia-Ukraine War Impact Analysis
- 2.12. Opportunity Map Analysis
- 2.13. Market Competition Scenario Analysis
- 2.14. Product Life Cycle Analysis
- 2.15. Opportunity Orbits
- 2.16. Manufacturer Intensity Map
- 2.17. Major Companies sales by Value & Volume
- 2.1. Boric Acid Market Dynamics
- 3. Global Boric Acid Market Analysis, Opportunity and Forecast, 2016-2032
- 3.1. Global Boric Acid Market Analysis, 2016-2021
- 3.2. Global Boric Acid Market Opportunity and Forecast, 2023-2032
- 3.3. Global Boric Acid Market Analysis, Opportunity and Forecast, By Purity Grade, 2016-2032
- 3.3.1. Global Boric Acid Market Analysis by Purity Grade: Introduction
- 3.3.2. Market Size Absolute $ Opportunity Analysis and Forecast, By Purity Grade, 2016-2032
- 3.3.3. ≥99%
- 3.3.4. <99%
- 3.4. Global Boric Acid Market Analysis, Opportunity and Forecast, By Application, 2016-2032
- 3.4.1. Global Boric Acid Market Analysis by Application: Introduction
- 3.4.2. Market Size Absolute $ Opportunity Analysis and Forecast, By Application, 2016-2032
- 3.4.3. Glass and Fiberglass
- 3.4.4. Medical
- 3.4.5. Personal Care
- 3.4.6. Flame Retardants
- 3.4.7. Wood Preservatives
- 3.4.8. Pest Control
- 3.4.9. Nutritional Supplements
- 3.5. Global Boric Acid Market Analysis, Opportunity and Forecast, By End-User, 2016-2032
- 3.5.1. Global Boric Acid Market Analysis by End-User: Introduction
- 3.5.2. Market Size Absolute $ Opportunity Analysis and Forecast, By End-User, 2016-2032
- 3.5.3. Fiberglass Industry
- 3.5.4. Building and Construction
- 3.5.5. Ceramics
- 3.5.6. Pharmaceutical
- 3.5.7. Others
- 3.6. Global Boric Acid Market Analysis, Opportunity and Forecast, By Distribution Channel, 2016-2032
- 3.6.1. Global Boric Acid Market Analysis by Distribution Channel: Introduction
- 3.6.2. Market Size Absolute $ Opportunity Analysis and Forecast, By Distribution Channel, 2016-2032
- 3.6.3. Wholesale and Retail
- 3.6.4. E-commerce
- 4. North America Boric Acid Market Analysis, Opportunity and Forecast, 2016-2032
- 4.1. North America Boric Acid Market Analysis, 2016-2021
- 4.2. North America Boric Acid Market Opportunity and Forecast, 2023-2032
- 4.3. North America Boric Acid Market Analysis, Opportunity and Forecast, By Purity Grade, 2016-2032
- 4.3.1. North America Boric Acid Market Analysis by Purity Grade: Introduction
- 4.3.2. Market Size Absolute $ Opportunity Analysis and Forecast, By Purity Grade, 2016-2032
- 4.3.3. ≥99%
- 4.3.4. <99%
- 4.4. North America Boric Acid Market Analysis, Opportunity and Forecast, By Application, 2016-2032
- 4.4.1. North America Boric Acid Market Analysis by Application: Introduction
- 4.4.2. Market Size Absolute $ Opportunity Analysis and Forecast, By Application, 2016-2032
- 4.4.3. Glass and Fiberglass
- 4.4.4. Medical
- 4.4.5. Personal Care
- 4.4.6. Flame Retardants
- 4.4.7. Wood Preservatives
- 4.4.8. Pest Control
- 4.4.9. Nutritional Supplements
- 4.5. North America Boric Acid Market Analysis, Opportunity and Forecast, By End-User, 2016-2032
- 4.5.1. North America Boric Acid Market Analysis by End-User: Introduction
- 4.5.2. Market Size Absolute $ Opportunity Analysis and Forecast, By End-User, 2016-2032
- 4.5.3. Fiberglass Industry
- 4.5.4. Building and Construction
- 4.5.5. Ceramics
- 4.5.6. Pharmaceutical
- 4.5.7. Others
- 4.6. North America Boric Acid Market Analysis, Opportunity and Forecast, By Distribution Channel, 2016-2032
- 4.6.1. North America Boric Acid Market Analysis by Distribution Channel: Introduction
- 4.6.2. Market Size Absolute $ Opportunity Analysis and Forecast, By Distribution Channel, 2016-2032
- 4.6.3. Wholesale and Retail
- 4.6.4. E-commerce
- 4.7. North America Boric Acid Market Analysis, Opportunity and Forecast, By Country , 2016-2032
- 4.7.1. North America Boric Acid Market Analysis by Country : Introduction
- 4.7.2. Market Size Absolute $ Opportunity Analysis and Forecast, Country , 2016-2032
- 4.7.2.1. The US
- 4.7.2.2. Canada
- 4.7.2.3. Mexico
- 5. Western Europe Boric Acid Market Analysis, Opportunity and Forecast, 2016-2032
- 5.1. Western Europe Boric Acid Market Analysis, 2016-2021
- 5.2. Western Europe Boric Acid Market Opportunity and Forecast, 2023-2032
- 5.3. Western Europe Boric Acid Market Analysis, Opportunity and Forecast, By Purity Grade, 2016-2032
- 5.3.1. Western Europe Boric Acid Market Analysis by Purity Grade: Introduction
- 5.3.2. Market Size Absolute $ Opportunity Analysis and Forecast, By Purity Grade, 2016-2032
- 5.3.3. ≥99%
- 5.3.4. <99%
- 5.4. Western Europe Boric Acid Market Analysis, Opportunity and Forecast, By Application, 2016-2032
- 5.4.1. Western Europe Boric Acid Market Analysis by Application: Introduction
- 5.4.2. Market Size Absolute $ Opportunity Analysis and Forecast, By Application, 2016-2032
- 5.4.3. Glass and Fiberglass
- 5.4.4. Medical
- 5.4.5. Personal Care
- 5.4.6. Flame Retardants
- 5.4.7. Wood Preservatives
- 5.4.8. Pest Control
- 5.4.9. Nutritional Supplements
- 5.5. Western Europe Boric Acid Market Analysis, Opportunity and Forecast, By End-User, 2016-2032
- 5.5.1. Western Europe Boric Acid Market Analysis by End-User: Introduction
- 5.5.2. Market Size Absolute $ Opportunity Analysis and Forecast, By End-User, 2016-2032
- 5.5.3. Fiberglass Industry
- 5.5.4. Building and Construction
- 5.5.5. Ceramics
- 5.5.6. Pharmaceutical
- 5.5.7. Others
- 5.6. Western Europe Boric Acid Market Analysis, Opportunity and Forecast, By Distribution Channel, 2016-2032
- 5.6.1. Western Europe Boric Acid Market Analysis by Distribution Channel: Introduction
- 5.6.2. Market Size Absolute $ Opportunity Analysis and Forecast, By Distribution Channel, 2016-2032
- 5.6.3. Wholesale and Retail
- 5.6.4. E-commerce
- 5.7. Western Europe Boric Acid Market Analysis, Opportunity and Forecast, By Country , 2016-2032
- 5.7.1. Western Europe Boric Acid Market Analysis by Country : Introduction
- 5.7.2. Market Size Absolute $ Opportunity Analysis and Forecast, Country , 2016-2032
- 5.7.2.1. Germany
- 5.7.2.2. France
- 5.7.2.3. The UK
- 5.7.2.4. Spain
- 5.7.2.5. Italy
- 5.7.2.6. Portugal
- 5.7.2.7. Ireland
- 5.7.2.8. Austria
- 5.7.2.9. Switzerland
- 5.7.2.10. Benelux
- 5.7.2.11. Nordic
- 5.7.2.12. Rest of Western Europe
- 6. Eastern Europe Boric Acid Market Analysis, Opportunity and Forecast, 2016-2032
- 6.1. Eastern Europe Boric Acid Market Analysis, 2016-2021
- 6.2. Eastern Europe Boric Acid Market Opportunity and Forecast, 2023-2032
- 6.3. Eastern Europe Boric Acid Market Analysis, Opportunity and Forecast, By Purity Grade, 2016-2032
- 6.3.1. Eastern Europe Boric Acid Market Analysis by Purity Grade: Introduction
- 6.3.2. Market Size Absolute $ Opportunity Analysis and Forecast, By Purity Grade, 2016-2032
- 6.3.3. ≥99%
- 6.3.4. <99%
- 6.4. Eastern Europe Boric Acid Market Analysis, Opportunity and Forecast, By Application, 2016-2032
- 6.4.1. Eastern Europe Boric Acid Market Analysis by Application: Introduction
- 6.4.2. Market Size Absolute $ Opportunity Analysis and Forecast, By Application, 2016-2032
- 6.4.3. Glass and Fiberglass
- 6.4.4. Medical
- 6.4.5. Personal Care
- 6.4.6. Flame Retardants
- 6.4.7. Wood Preservatives
- 6.4.8. Pest Control
- 6.4.9. Nutritional Supplements
- 6.5. Eastern Europe Boric Acid Market Analysis, Opportunity and Forecast, By End-User, 2016-2032
- 6.5.1. Eastern Europe Boric Acid Market Analysis by End-User: Introduction
- 6.5.2. Market Size Absolute $ Opportunity Analysis and Forecast, By End-User, 2016-2032
- 6.5.3. Fiberglass Industry
- 6.5.4. Building and Construction
- 6.5.5. Ceramics
- 6.5.6. Pharmaceutical
- 6.5.7. Others
- 6.6. Eastern Europe Boric Acid Market Analysis, Opportunity and Forecast, By Distribution Channel, 2016-2032
- 6.6.1. Eastern Europe Boric Acid Market Analysis by Distribution Channel: Introduction
- 6.6.2. Market Size Absolute $ Opportunity Analysis and Forecast, By Distribution Channel, 2016-2032
- 6.6.3. Wholesale and Retail
- 6.6.4. E-commerce
- 6.7. Eastern Europe Boric Acid Market Analysis, Opportunity and Forecast, By Country , 2016-2032
- 6.7.1. Eastern Europe Boric Acid Market Analysis by Country : Introduction
- 6.7.2. Market Size Absolute $ Opportunity Analysis and Forecast, Country , 2016-2032
- 6.7.2.1. Russia
- 6.7.2.2. Poland
- 6.7.2.3. The Czech Republic
- 6.7.2.4. Greece
- 6.7.2.5. Rest of Eastern Europe
- 7. APAC Boric Acid Market Analysis, Opportunity and Forecast, 2016-2032
- 7.1. APAC Boric Acid Market Analysis, 2016-2021
- 7.2. APAC Boric Acid Market Opportunity and Forecast, 2023-2032
- 7.3. APAC Boric Acid Market Analysis, Opportunity and Forecast, By Purity Grade, 2016-2032
- 7.3.1. APAC Boric Acid Market Analysis by Purity Grade: Introduction
- 7.3.2. Market Size Absolute $ Opportunity Analysis and Forecast, By Purity Grade, 2016-2032
- 7.3.3. ≥99%
- 7.3.4. <99%
- 7.4. APAC Boric Acid Market Analysis, Opportunity and Forecast, By Application, 2016-2032
- 7.4.1. APAC Boric Acid Market Analysis by Application: Introduction
- 7.4.2. Market Size Absolute $ Opportunity Analysis and Forecast, By Application, 2016-2032
- 7.4.3. Glass and Fiberglass
- 7.4.4. Medical
- 7.4.5. Personal Care
- 7.4.6. Flame Retardants
- 7.4.7. Wood Preservatives
- 7.4.8. Pest Control
- 7.4.9. Nutritional Supplements
- 7.5. APAC Boric Acid Market Analysis, Opportunity and Forecast, By End-User, 2016-2032
- 7.5.1. APAC Boric Acid Market Analysis by End-User: Introduction
- 7.5.2. Market Size Absolute $ Opportunity Analysis and Forecast, By End-User, 2016-2032
- 7.5.3. Fiberglass Industry
- 7.5.4. Building and Construction
- 7.5.5. Ceramics
- 7.5.6. Pharmaceutical
- 7.5.7. Others
- 7.6. APAC Boric Acid Market Analysis, Opportunity and Forecast, By Distribution Channel, 2016-2032
- 7.6.1. APAC Boric Acid Market Analysis by Distribution Channel: Introduction
- 7.6.2. Market Size Absolute $ Opportunity Analysis and Forecast, By Distribution Channel, 2016-2032
- 7.6.3. Wholesale and Retail
- 7.6.4. E-commerce
- 7.7. APAC Boric Acid Market Analysis, Opportunity and Forecast, By Country , 2016-2032
- 7.7.1. APAC Boric Acid Market Analysis by Country : Introduction
- 7.7.2. Market Size Absolute $ Opportunity Analysis and Forecast, Country , 2016-2032
- 7.7.2.1. China
- 7.7.2.2. Japan
- 7.7.2.3. South Korea
- 7.7.2.4. India
- 7.7.2.5. Australia & New Zeland
- 7.7.2.6. Indonesia
- 7.7.2.7. Malaysia
- 7.7.2.8. Philippines
- 7.7.2.9. Singapore
- 7.7.2.10. Thailand
- 7.7.2.11. Vietnam
- 7.7.2.12. Rest of APAC
- 8. Latin America Boric Acid Market Analysis, Opportunity and Forecast, 2016-2032
- 8.1. Latin America Boric Acid Market Analysis, 2016-2021
- 8.2. Latin America Boric Acid Market Opportunity and Forecast, 2023-2032
- 8.3. Latin America Boric Acid Market Analysis, Opportunity and Forecast, By Purity Grade, 2016-2032
- 8.3.1. Latin America Boric Acid Market Analysis by Purity Grade: Introduction
- 8.3.2. Market Size Absolute $ Opportunity Analysis and Forecast, By Purity Grade, 2016-2032
- 8.3.3. ≥99%
- 8.3.4. <99%
- 8.4. Latin America Boric Acid Market Analysis, Opportunity and Forecast, By Application, 2016-2032
- 8.4.1. Latin America Boric Acid Market Analysis by Application: Introduction
- 8.4.2. Market Size Absolute $ Opportunity Analysis and Forecast, By Application, 2016-2032
- 8.4.3. Glass and Fiberglass
- 8.4.4. Medical
- 8.4.5. Personal Care
- 8.4.6. Flame Retardants
- 8.4.7. Wood Preservatives
- 8.4.8. Pest Control
- 8.4.9. Nutritional Supplements
- 8.5. Latin America Boric Acid Market Analysis, Opportunity and Forecast, By End-User, 2016-2032
- 8.5.1. Latin America Boric Acid Market Analysis by End-User: Introduction
- 8.5.2. Market Size Absolute $ Opportunity Analysis and Forecast, By End-User, 2016-2032
- 8.5.3. Fiberglass Industry
- 8.5.4. Building and Construction
- 8.5.5. Ceramics
- 8.5.6. Pharmaceutical
- 8.5.7. Others
- 8.6. Latin America Boric Acid Market Analysis, Opportunity and Forecast, By Distribution Channel, 2016-2032
- 8.6.1. Latin America Boric Acid Market Analysis by Distribution Channel: Introduction
- 8.6.2. Market Size Absolute $ Opportunity Analysis and Forecast, By Distribution Channel, 2016-2032
- 8.6.3. Wholesale and Retail
- 8.6.4. E-commerce
- 8.7. Latin America Boric Acid Market Analysis, Opportunity and Forecast, By Country , 2016-2032
- 8.7.1. Latin America Boric Acid Market Analysis by Country : Introduction
- 8.7.2. Market Size Absolute $ Opportunity Analysis and Forecast, Country , 2016-2032
- 8.7.2.1. Brazil
- 8.7.2.2. Colombia
- 8.7.2.3. Chile
- 8.7.2.4. Argentina
- 8.7.2.5. Costa Rica
- 8.7.2.6. Rest of Latin America
- 9. Middle East & Africa Boric Acid Market Analysis, Opportunity and Forecast, 2016-2032
- 9.1. Middle East & Africa Boric Acid Market Analysis, 2016-2021
- 9.2. Middle East & Africa Boric Acid Market Opportunity and Forecast, 2023-2032
- 9.3. Middle East & Africa Boric Acid Market Analysis, Opportunity and Forecast, By Purity Grade, 2016-2032
- 9.3.1. Middle East & Africa Boric Acid Market Analysis by Purity Grade: Introduction
- 9.3.2. Market Size Absolute $ Opportunity Analysis and Forecast, By Purity Grade, 2016-2032
- 9.3.3. ≥99%
- 9.3.4. <99%
- 9.4. Middle East & Africa Boric Acid Market Analysis, Opportunity and Forecast, By Application, 2016-2032
- 9.4.1. Middle East & Africa Boric Acid Market Analysis by Application: Introduction
- 9.4.2. Market Size Absolute $ Opportunity Analysis and Forecast, By Application, 2016-2032
- 9.4.3. Glass and Fiberglass
- 9.4.4. Medical
- 9.4.5. Personal Care
- 9.4.6. Flame Retardants
- 9.4.7. Wood Preservatives
- 9.4.8. Pest Control
- 9.4.9. Nutritional Supplements
- 9.5. Middle East & Africa Boric Acid Market Analysis, Opportunity and Forecast, By End-User, 2016-2032
- 9.5.1. Middle East & Africa Boric Acid Market Analysis by End-User: Introduction
- 9.5.2. Market Size Absolute $ Opportunity Analysis and Forecast, By End-User, 2016-2032
- 9.5.3. Fiberglass Industry
- 9.5.4. Building and Construction
- 9.5.5. Ceramics
- 9.5.6. Pharmaceutical
- 9.5.7. Others
- 9.6. Middle East & Africa Boric Acid Market Analysis, Opportunity and Forecast, By Distribution Channel, 2016-2032
- 9.6.1. Middle East & Africa Boric Acid Market Analysis by Distribution Channel: Introduction
- 9.6.2. Market Size Absolute $ Opportunity Analysis and Forecast, By Distribution Channel, 2016-2032
- 9.6.3. Wholesale and Retail
- 9.6.4. E-commerce
- 9.7. Middle East & Africa Boric Acid Market Analysis, Opportunity and Forecast, By Country , 2016-2032
- 9.7.1. Middle East & Africa Boric Acid Market Analysis by Country : Introduction
- 9.7.2. Market Size Absolute $ Opportunity Analysis and Forecast, Country , 2016-2032
- 9.7.2.1. Algeria
- 9.7.2.2. Egypt
- 9.7.2.3. Israel
- 9.7.2.4. Kuwait
- 9.7.2.5. Nigeria
- 9.7.2.6. Saudi Arabia
- 9.7.2.7. South Africa
- 9.7.2.8. Turkey
- 9.7.2.9. The UAE
- 9.7.2.10. Rest of MEA
- 10. Global Boric Acid Market Analysis, Opportunity and Forecast, By Region , 2016-2032
- 10.1. Global Boric Acid Market Analysis by Region : Introduction
- 10.2. Market Size Absolute $ Opportunity Analysis and Forecast, By Region , 2016-2032
- 10.2.1. North America
- 10.2.2. Western Europe
- 10.2.3. Eastern Europe
- 10.2.4. APAC
- 10.2.5. Latin America
- 10.2.6. Middle East & Africa
- 11. Global Boric Acid Market Competitive Landscape, Market Share Analysis, and Company Profiles
- 11.1. Market Share Analysis
- 11.2. Company Profiles
- 11.3. Rio Tinto Group
- 11.3.1. Company Overview
- 11.3.2. Financial Highlights
- 11.3.3. Product Portfolio
- 11.3.4. SWOT Analysis
- 11.3.5. Key Strategies and Developments
- 11.4. 3M Company
- 11.4.1. Company Overview
- 11.4.2. Financial Highlights
- 11.4.3. Product Portfolio
- 11.4.4. SWOT Analysis
- 11.4.5. Key Strategies and Developments
- 11.5. Borax Inc.
- 11.5.1. Company Overview
- 11.5.2. Financial Highlights
- 11.5.3. Product Portfolio
- 11.5.4. SWOT Analysis
- 11.5.5. Key Strategies and Developments
- 11.6. EtiMaden
- 11.6.1. Company Overview
- 11.6.2. Financial Highlights
- 11.6.3. Product Portfolio
- 11.6.4. SWOT Analysis
- 11.6.5. Key Strategies and Developments
- 11.7. Nirma Limited
- 11.7.1. Company Overview
- 11.7.2. Financial Highlights
- 11.7.3. Product Portfolio
- 11.7.4. SWOT Analysis
- 11.7.5. Key Strategies and Developments
- 11.8. NIPPON DENKO CO. LTD.
- 11.8.1. Company Overview
- 11.8.2. Financial Highlights
- 11.8.3. Product Portfolio
- 11.8.4. SWOT Analysis
- 11.8.5. Key Strategies and Developments
- 11.9. Promega Corporation
- 11.9.1. Company Overview
- 11.9.2. Financial Highlights
- 11.9.3. Product Portfolio
- 11.9.4. SWOT Analysis
- 11.9.5. Key Strategies and Developments
- 11.10. Southern Agricultural Insecticides Inc.
- 11.10.1. Company Overview
- 11.10.2. Financial Highlights
- 11.10.3. Product Portfolio
- 11.10.4. SWOT Analysis
- 11.10.5. Key Strategies and Developments
- 11.11. Quiborax S.A.
- 11.11.1. Company Overview
- 11.11.2. Financial Highlights
- 11.11.3. Product Portfolio
- 11.11.4. SWOT Analysis
- 11.11.5. Key Strategies and Developments
- 11.12. American Borate Company
- 11.12.1. Company Overview
- 11.12.2. Financial Highlights
- 11.12.3. Product Portfolio
- 11.12.4. SWOT Analysis
- 11.12.5. Key Strategies and Developments
- 11.13.1. Company Overview
- 11.13.2. Financial Highlights
- 11.13.3. Product Portfolio
- 11.13.4. SWOT Analysis
- 11.13.5. Key Strategies and Developments
- 11.14. Minera Santa Rita S.R.L. (MSR)
- 11.14.1. Company Overview
- 11.14.2. Financial Highlights
- 11.14.3. Product Portfolio
- 11.14.4. SWOT Analysis
- 11.14.5. Key Strategies and Developments
- 11.15. Gujarat Boron Derivatives Pvt. Ltd.
- 11.15.1. Company Overview
- 11.15.2. Financial Highlights
- 11.15.3. Product Portfolio
- 11.15.4. SWOT Analysis
- 11.15.5. Key Strategies and Developments
- 11.16. Russian Bor
- 11.16.1. Company Overview
- 11.16.2. Financial Highlights
- 11.16.3. Product Portfolio
- 11.16.4. SWOT Analysis
- 11.16.5. Key Strategies and Developments
- 11.17. Searles Valley Minerals
- 11.17.1. Company Overview
- 11.17.2. Financial Highlights
- 11.17.3. Product Portfolio
- 11.17.4. SWOT Analysis
- 11.17.5. Key Strategies and Developments
- 11.18. Other Key Players
- 11.18.1. Company Overview
- 11.18.2. Financial Highlights
- 11.18.3. Product Portfolio
- 11.18.4. SWOT Analysis
- 11.18.5. Key Strategies and Developments
- 12. Assumptions and Acronyms
- 13. Research Methodology
- 14. Contact
- List of Figures
- Figure 1: Global Boric Acid Market Revenue (US$ Mn) Market Share by Purity Grade in 2022
- Figure 2: Global Boric Acid Market Attractiveness Analysis by Purity Grade, 2016-2032
- Figure 3: Global Boric Acid Market Revenue (US$ Mn) Market Share by Applicationin 2022
- Figure 4: Global Boric Acid Market Attractiveness Analysis by Application, 2016-2032
- Figure 5: Global Boric Acid Market Revenue (US$ Mn) Market Share by End-Userin 2022
- Figure 6: Global Boric Acid Market Attractiveness Analysis by End-User, 2016-2032
- Figure 7: Global Boric Acid Market Revenue (US$ Mn) Market Share by Distribution Channelin 2022
- Figure 8: Global Boric Acid Market Attractiveness Analysis by Distribution Channel, 2016-2032
- Figure 9: Global Boric Acid Market Revenue (US$ Mn) Market Share by Region in 2022
- Figure 10: Global Boric Acid Market Attractiveness Analysis by Region, 2016-2032
- Figure 11: Global Boric Acid Market Revenue (US$ Mn) (2016-2032)
- Figure 12: Global Boric Acid Market Revenue (US$ Mn) Comparison by Region (2016-2032)
- Figure 13: Global Boric Acid Market Revenue (US$ Mn) Comparison by Purity Grade (2016-2032)
- Figure 14: Global Boric Acid Market Revenue (US$ Mn) Comparison by Application (2016-2032)
- Figure 15: Global Boric Acid Market Revenue (US$ Mn) Comparison by End-User (2016-2032)
- Figure 16: Global Boric Acid Market Revenue (US$ Mn) Comparison by Distribution Channel (2016-2032)
- Figure 17: Global Boric Acid Market Y-o-Y Growth Rate Comparison by Region (2016-2032)
- Figure 18: Global Boric Acid Market Y-o-Y Growth Rate Comparison by Purity Grade (2016-2032)
- Figure 19: Global Boric Acid Market Y-o-Y Growth Rate Comparison by Application (2016-2032)
- Figure 20: Global Boric Acid Market Y-o-Y Growth Rate Comparison by End-User (2016-2032)
- Figure 21: Global Boric Acid Market Y-o-Y Growth Rate Comparison by Distribution Channel (2016-2032)
- Figure 22: Global Boric Acid Market Share Comparison by Region (2016-2032)
- Figure 23: Global Boric Acid Market Share Comparison by Purity Grade (2016-2032)
- Figure 24: Global Boric Acid Market Share Comparison by Application (2016-2032)
- Figure 25: Global Boric Acid Market Share Comparison by End-User (2016-2032)
- Figure 26: Global Boric Acid Market Share Comparison by Distribution Channel (2016-2032)
- Figure 27: North America Boric Acid Market Revenue (US$ Mn) Market Share by Purity Gradein 2022
- Figure 28: North America Boric Acid Market Attractiveness Analysis by Purity Grade, 2016-2032
- Figure 29: North America Boric Acid Market Revenue (US$ Mn) Market Share by Applicationin 2022
- Figure 30: North America Boric Acid Market Attractiveness Analysis by Application, 2016-2032
- Figure 31: North America Boric Acid Market Revenue (US$ Mn) Market Share by End-Userin 2022
- Figure 32: North America Boric Acid Market Attractiveness Analysis by End-User, 2016-2032
- Figure 33: North America Boric Acid Market Revenue (US$ Mn) Market Share by Distribution Channelin 2022
- Figure 34: North America Boric Acid Market Attractiveness Analysis by Distribution Channel, 2016-2032
- Figure 35: North America Boric Acid Market Revenue (US$ Mn) Market Share by Country in 2022
- Figure 36: North America Boric Acid Market Attractiveness Analysis by Country, 2016-2032
- Figure 37: North America Boric Acid Market Revenue (US$ Mn) (2016-2032)
- Figure 38: North America Boric Acid Market Revenue (US$ Mn) Comparison by Country (2016-2032)
- Figure 39: North America Boric Acid Market Revenue (US$ Mn) Comparison by Purity Grade (2016-2032)
- Figure 40: North America Boric Acid Market Revenue (US$ Mn) Comparison by Application (2016-2032)
- Figure 41: North America Boric Acid Market Revenue (US$ Mn) Comparison by End-User (2016-2032)
- Figure 42: North America Boric Acid Market Revenue (US$ Mn) Comparison by Distribution Channel (2016-2032)
- Figure 43: North America Boric Acid Market Y-o-Y Growth Rate Comparison by Country (2016-2032)
- Figure 44: North America Boric Acid Market Y-o-Y Growth Rate Comparison by Purity Grade (2016-2032)
- Figure 45: North America Boric Acid Market Y-o-Y Growth Rate Comparison by Application (2016-2032)
- Figure 46: North America Boric Acid Market Y-o-Y Growth Rate Comparison by End-User (2016-2032)
- Figure 47: North America Boric Acid Market Y-o-Y Growth Rate Comparison by Distribution Channel (2016-2032)
- Figure 48: North America Boric Acid Market Share Comparison by Country (2016-2032)
- Figure 49: North America Boric Acid Market Share Comparison by Purity Grade (2016-2032)
- Figure 50: North America Boric Acid Market Share Comparison by Application (2016-2032)
- Figure 51: North America Boric Acid Market Share Comparison by End-User (2016-2032)
- Figure 52: North America Boric Acid Market Share Comparison by Distribution Channel (2016-2032)
- Figure 53: Western Europe Boric Acid Market Revenue (US$ Mn) Market Share by Purity Gradein 2022
- Figure 54: Western Europe Boric Acid Market Attractiveness Analysis by Purity Grade, 2016-2032
- Figure 55: Western Europe Boric Acid Market Revenue (US$ Mn) Market Share by Applicationin 2022
- Figure 56: Western Europe Boric Acid Market Attractiveness Analysis by Application, 2016-2032
- Figure 57: Western Europe Boric Acid Market Revenue (US$ Mn) Market Share by End-Userin 2022
- Figure 58: Western Europe Boric Acid Market Attractiveness Analysis by End-User, 2016-2032
- Figure 59: Western Europe Boric Acid Market Revenue (US$ Mn) Market Share by Distribution Channelin 2022
- Figure 60: Western Europe Boric Acid Market Attractiveness Analysis by Distribution Channel, 2016-2032
- Figure 61: Western Europe Boric Acid Market Revenue (US$ Mn) Market Share by Country in 2022
- Figure 62: Western Europe Boric Acid Market Attractiveness Analysis by Country, 2016-2032
- Figure 63: Western Europe Boric Acid Market Revenue (US$ Mn) (2016-2032)
- Figure 64: Western Europe Boric Acid Market Revenue (US$ Mn) Comparison by Country (2016-2032)
- Figure 65: Western Europe Boric Acid Market Revenue (US$ Mn) Comparison by Purity Grade (2016-2032)
- Figure 66: Western Europe Boric Acid Market Revenue (US$ Mn) Comparison by Application (2016-2032)
- Figure 67: Western Europe Boric Acid Market Revenue (US$ Mn) Comparison by End-User (2016-2032)
- Figure 68: Western Europe Boric Acid Market Revenue (US$ Mn) Comparison by Distribution Channel (2016-2032)
- Figure 69: Western Europe Boric Acid Market Y-o-Y Growth Rate Comparison by Country (2016-2032)
- Figure 70: Western Europe Boric Acid Market Y-o-Y Growth Rate Comparison by Purity Grade (2016-2032)
- Figure 71: Western Europe Boric Acid Market Y-o-Y Growth Rate Comparison by Application (2016-2032)
- Figure 72: Western Europe Boric Acid Market Y-o-Y Growth Rate Comparison by End-User (2016-2032)
- Figure 73: Western Europe Boric Acid Market Y-o-Y Growth Rate Comparison by Distribution Channel (2016-2032)
- Figure 74: Western Europe Boric Acid Market Share Comparison by Country (2016-2032)
- Figure 75: Western Europe Boric Acid Market Share Comparison by Purity Grade (2016-2032)
- Figure 76: Western Europe Boric Acid Market Share Comparison by Application (2016-2032)
- Figure 77: Western Europe Boric Acid Market Share Comparison by End-User (2016-2032)
- Figure 78: Western Europe Boric Acid Market Share Comparison by Distribution Channel (2016-2032)
- Figure 79: Eastern Europe Boric Acid Market Revenue (US$ Mn) Market Share by Purity Gradein 2022
- Figure 80: Eastern Europe Boric Acid Market Attractiveness Analysis by Purity Grade, 2016-2032
- Figure 81: Eastern Europe Boric Acid Market Revenue (US$ Mn) Market Share by Applicationin 2022
- Figure 82: Eastern Europe Boric Acid Market Attractiveness Analysis by Application, 2016-2032
- Figure 83: Eastern Europe Boric Acid Market Revenue (US$ Mn) Market Share by End-Userin 2022
- Figure 84: Eastern Europe Boric Acid Market Attractiveness Analysis by End-User, 2016-2032
- Figure 85: Eastern Europe Boric Acid Market Revenue (US$ Mn) Market Share by Distribution Channelin 2022
- Figure 86: Eastern Europe Boric Acid Market Attractiveness Analysis by Distribution Channel, 2016-2032
- Figure 87: Eastern Europe Boric Acid Market Revenue (US$ Mn) Market Share by Country in 2022
- Figure 88: Eastern Europe Boric Acid Market Attractiveness Analysis by Country, 2016-2032
- Figure 89: Eastern Europe Boric Acid Market Revenue (US$ Mn) (2016-2032)
- Figure 90: Eastern Europe Boric Acid Market Revenue (US$ Mn) Comparison by Country (2016-2032)
- Figure 91: Eastern Europe Boric Acid Market Revenue (US$ Mn) Comparison by Purity Grade (2016-2032)
- Figure 92: Eastern Europe Boric Acid Market Revenue (US$ Mn) Comparison by Application (2016-2032)
- Figure 93: Eastern Europe Boric Acid Market Revenue (US$ Mn) Comparison by End-User (2016-2032)
- Figure 94: Eastern Europe Boric Acid Market Revenue (US$ Mn) Comparison by Distribution Channel (2016-2032)
- Figure 95: Eastern Europe Boric Acid Market Y-o-Y Growth Rate Comparison by Country (2016-2032)
- Figure 96: Eastern Europe Boric Acid Market Y-o-Y Growth Rate Comparison by Purity Grade (2016-2032)
- Figure 97: Eastern Europe Boric Acid Market Y-o-Y Growth Rate Comparison by Application (2016-2032)
- Figure 98: Eastern Europe Boric Acid Market Y-o-Y Growth Rate Comparison by End-User (2016-2032)
- Figure 99: Eastern Europe Boric Acid Market Y-o-Y Growth Rate Comparison by Distribution Channel (2016-2032)
- Figure 100: Eastern Europe Boric Acid Market Share Comparison by Country (2016-2032)
- Figure 101: Eastern Europe Boric Acid Market Share Comparison by Purity Grade (2016-2032)
- Figure 102: Eastern Europe Boric Acid Market Share Comparison by Application (2016-2032)
- Figure 103: Eastern Europe Boric Acid Market Share Comparison by End-User (2016-2032)
- Figure 104: Eastern Europe Boric Acid Market Share Comparison by Distribution Channel (2016-2032)
- Figure 105: APAC Boric Acid Market Revenue (US$ Mn) Market Share by Purity Gradein 2022
- Figure 106: APAC Boric Acid Market Attractiveness Analysis by Purity Grade, 2016-2032
- Figure 107: APAC Boric Acid Market Revenue (US$ Mn) Market Share by Applicationin 2022
- Figure 108: APAC Boric Acid Market Attractiveness Analysis by Application, 2016-2032
- Figure 109: APAC Boric Acid Market Revenue (US$ Mn) Market Share by End-Userin 2022
- Figure 110: APAC Boric Acid Market Attractiveness Analysis by End-User, 2016-2032
- Figure 111: APAC Boric Acid Market Revenue (US$ Mn) Market Share by Distribution Channelin 2022
- Figure 112: APAC Boric Acid Market Attractiveness Analysis by Distribution Channel, 2016-2032
- Figure 113: APAC Boric Acid Market Revenue (US$ Mn) Market Share by Country in 2022
- Figure 114: APAC Boric Acid Market Attractiveness Analysis by Country, 2016-2032
- Figure 115: APAC Boric Acid Market Revenue (US$ Mn) (2016-2032)
- Figure 116: APAC Boric Acid Market Revenue (US$ Mn) Comparison by Country (2016-2032)
- Figure 117: APAC Boric Acid Market Revenue (US$ Mn) Comparison by Purity Grade (2016-2032)
- Figure 118: APAC Boric Acid Market Revenue (US$ Mn) Comparison by Application (2016-2032)
- Figure 119: APAC Boric Acid Market Revenue (US$ Mn) Comparison by End-User (2016-2032)
- Figure 120: APAC Boric Acid Market Revenue (US$ Mn) Comparison by Distribution Channel (2016-2032)
- Figure 121: APAC Boric Acid Market Y-o-Y Growth Rate Comparison by Country (2016-2032)
- Figure 122: APAC Boric Acid Market Y-o-Y Growth Rate Comparison by Purity Grade (2016-2032)
- Figure 123: APAC Boric Acid Market Y-o-Y Growth Rate Comparison by Application (2016-2032)
- Figure 124: APAC Boric Acid Market Y-o-Y Growth Rate Comparison by End-User (2016-2032)
- Figure 125: APAC Boric Acid Market Y-o-Y Growth Rate Comparison by Distribution Channel (2016-2032)
- Figure 126: APAC Boric Acid Market Share Comparison by Country (2016-2032)
- Figure 127: APAC Boric Acid Market Share Comparison by Purity Grade (2016-2032)
- Figure 128: APAC Boric Acid Market Share Comparison by Application (2016-2032)
- Figure 129: APAC Boric Acid Market Share Comparison by End-User (2016-2032)
- Figure 130: APAC Boric Acid Market Share Comparison by Distribution Channel (2016-2032)
- Figure 131: Latin America Boric Acid Market Revenue (US$ Mn) Market Share by Purity Gradein 2022
- Figure 132: Latin America Boric Acid Market Attractiveness Analysis by Purity Grade, 2016-2032
- Figure 133: Latin America Boric Acid Market Revenue (US$ Mn) Market Share by Applicationin 2022
- Figure 134: Latin America Boric Acid Market Attractiveness Analysis by Application, 2016-2032
- Figure 135: Latin America Boric Acid Market Revenue (US$ Mn) Market Share by End-Userin 2022
- Figure 136: Latin America Boric Acid Market Attractiveness Analysis by End-User, 2016-2032
- Figure 137: Latin America Boric Acid Market Revenue (US$ Mn) Market Share by Distribution Channelin 2022
- Figure 138: Latin America Boric Acid Market Attractiveness Analysis by Distribution Channel, 2016-2032
- Figure 139: Latin America Boric Acid Market Revenue (US$ Mn) Market Share by Country in 2022
- Figure 140: Latin America Boric Acid Market Attractiveness Analysis by Country, 2016-2032
- Figure 141: Latin America Boric Acid Market Revenue (US$ Mn) (2016-2032)
- Figure 142: Latin America Boric Acid Market Revenue (US$ Mn) Comparison by Country (2016-2032)
- Figure 143: Latin America Boric Acid Market Revenue (US$ Mn) Comparison by Purity Grade (2016-2032)
- Figure 144: Latin America Boric Acid Market Revenue (US$ Mn) Comparison by Application (2016-2032)
- Figure 145: Latin America Boric Acid Market Revenue (US$ Mn) Comparison by End-User (2016-2032)
- Figure 146: Latin America Boric Acid Market Revenue (US$ Mn) Comparison by Distribution Channel (2016-2032)
- Figure 147: Latin America Boric Acid Market Y-o-Y Growth Rate Comparison by Country (2016-2032)
- Figure 148: Latin America Boric Acid Market Y-o-Y Growth Rate Comparison by Purity Grade (2016-2032)
- Figure 149: Latin America Boric Acid Market Y-o-Y Growth Rate Comparison by Application (2016-2032)
- Figure 150: Latin America Boric Acid Market Y-o-Y Growth Rate Comparison by End-User (2016-2032)
- Figure 151: Latin America Boric Acid Market Y-o-Y Growth Rate Comparison by Distribution Channel (2016-2032)
- Figure 152: Latin America Boric Acid Market Share Comparison by Country (2016-2032)
- Figure 153: Latin America Boric Acid Market Share Comparison by Purity Grade (2016-2032)
- Figure 154: Latin America Boric Acid Market Share Comparison by Application (2016-2032)
- Figure 155: Latin America Boric Acid Market Share Comparison by End-User (2016-2032)
- Figure 156: Latin America Boric Acid Market Share Comparison by Distribution Channel (2016-2032)
- Figure 157: Middle East & Africa Boric Acid Market Revenue (US$ Mn) Market Share by Purity Gradein 2022
- Figure 158: Middle East & Africa Boric Acid Market Attractiveness Analysis by Purity Grade, 2016-2032
- Figure 159: Middle East & Africa Boric Acid Market Revenue (US$ Mn) Market Share by Applicationin 2022
- Figure 160: Middle East & Africa Boric Acid Market Attractiveness Analysis by Application, 2016-2032
- Figure 161: Middle East & Africa Boric Acid Market Revenue (US$ Mn) Market Share by End-Userin 2022
- Figure 162: Middle East & Africa Boric Acid Market Attractiveness Analysis by End-User, 2016-2032
- Figure 163: Middle East & Africa Boric Acid Market Revenue (US$ Mn) Market Share by Distribution Channelin 2022
- Figure 164: Middle East & Africa Boric Acid Market Attractiveness Analysis by Distribution Channel, 2016-2032
- Figure 165: Middle East & Africa Boric Acid Market Revenue (US$ Mn) Market Share by Country in 2022
- Figure 166: Middle East & Africa Boric Acid Market Attractiveness Analysis by Country, 2016-2032
- Figure 167: Middle East & Africa Boric Acid Market Revenue (US$ Mn) (2016-2032)
- Figure 168: Middle East & Africa Boric Acid Market Revenue (US$ Mn) Comparison by Country (2016-2032)
- Figure 169: Middle East & Africa Boric Acid Market Revenue (US$ Mn) Comparison by Purity Grade (2016-2032)
- Figure 170: Middle East & Africa Boric Acid Market Revenue (US$ Mn) Comparison by Application (2016-2032)
- Figure 171: Middle East & Africa Boric Acid Market Revenue (US$ Mn) Comparison by End-User (2016-2032)
- Figure 172: Middle East & Africa Boric Acid Market Revenue (US$ Mn) Comparison by Distribution Channel (2016-2032)
- Figure 173: Middle East & Africa Boric Acid Market Y-o-Y Growth Rate Comparison by Country (2016-2032)
- Figure 174: Middle East & Africa Boric Acid Market Y-o-Y Growth Rate Comparison by Purity Grade (2016-2032)
- Figure 175: Middle East & Africa Boric Acid Market Y-o-Y Growth Rate Comparison by Application (2016-2032)
- Figure 176: Middle East & Africa Boric Acid Market Y-o-Y Growth Rate Comparison by End-User (2016-2032)
- Figure 177: Middle East & Africa Boric Acid Market Y-o-Y Growth Rate Comparison by Distribution Channel (2016-2032)
- Figure 178: Middle East & Africa Boric Acid Market Share Comparison by Country (2016-2032)
- Figure 179: Middle East & Africa Boric Acid Market Share Comparison by Purity Grade (2016-2032)
- Figure 180: Middle East & Africa Boric Acid Market Share Comparison by Application (2016-2032)
- Figure 181: Middle East & Africa Boric Acid Market Share Comparison by End-User (2016-2032)
- Figure 182: Middle East & Africa Boric Acid Market Share Comparison by Distribution Channel (2016-2032)
- List of Tables
- Table 1: Global Boric Acid Market Comparison by Purity Grade (2016-2032)
- Table 2: Global Boric Acid Market Comparison by Application (2016-2032)
- Table 3: Global Boric Acid Market Comparison by End-User (2016-2032)
- Table 4: Global Boric Acid Market Comparison by Distribution Channel (2016-2032)
- Table 5: Global Boric Acid Market Revenue (US$ Mn) Comparison by Region (2016-2032)
- Table 6: Global Boric Acid Market Revenue (US$ Mn) (2016-2032)
- Table 7: Global Boric Acid Market Revenue (US$ Mn) Comparison by Region (2016-2032)
- Table 8: Global Boric Acid Market Revenue (US$ Mn) Comparison by Purity Grade (2016-2032)
- Table 9: Global Boric Acid Market Revenue (US$ Mn) Comparison by Application (2016-2032)
- Table 10: Global Boric Acid Market Revenue (US$ Mn) Comparison by End-User (2016-2032)
- Table 11: Global Boric Acid Market Revenue (US$ Mn) Comparison by Distribution Channel (2016-2032)
- Table 12: Global Boric Acid Market Y-o-Y Growth Rate Comparison by Region (2016-2032)
- Table 13: Global Boric Acid Market Y-o-Y Growth Rate Comparison by Purity Grade (2016-2032)
- Table 14: Global Boric Acid Market Y-o-Y Growth Rate Comparison by Application (2016-2032)
- Table 15: Global Boric Acid Market Y-o-Y Growth Rate Comparison by End-User (2016-2032)
- Table 16: Global Boric Acid Market Y-o-Y Growth Rate Comparison by Distribution Channel (2016-2032)
- Table 17: Global Boric Acid Market Share Comparison by Region (2016-2032)
- Table 18: Global Boric Acid Market Share Comparison by Purity Grade (2016-2032)
- Table 19: Global Boric Acid Market Share Comparison by Application (2016-2032)
- Table 20: Global Boric Acid Market Share Comparison by End-User (2016-2032)
- Table 21: Global Boric Acid Market Share Comparison by Distribution Channel (2016-2032)
- Table 22: North America Boric Acid Market Comparison by Application (2016-2032)
- Table 23: North America Boric Acid Market Comparison by End-User (2016-2032)
- Table 24: North America Boric Acid Market Comparison by Distribution Channel (2016-2032)
- Table 25: North America Boric Acid Market Revenue (US$ Mn) Comparison by Country (2016-2032)
- Table 26: North America Boric Acid Market Revenue (US$ Mn) (2016-2032)
- Table 27: North America Boric Acid Market Revenue (US$ Mn) Comparison by Country (2016-2032)
- Table 28: North America Boric Acid Market Revenue (US$ Mn) Comparison by Purity Grade (2016-2032)
- Table 29: North America Boric Acid Market Revenue (US$ Mn) Comparison by Application (2016-2032)
- Table 30: North America Boric Acid Market Revenue (US$ Mn) Comparison by End-User (2016-2032)
- Table 31: North America Boric Acid Market Revenue (US$ Mn) Comparison by Distribution Channel (2016-2032)
- Table 32: North America Boric Acid Market Y-o-Y Growth Rate Comparison by Country (2016-2032)
- Table 33: North America Boric Acid Market Y-o-Y Growth Rate Comparison by Purity Grade (2016-2032)
- Table 34: North America Boric Acid Market Y-o-Y Growth Rate Comparison by Application (2016-2032)
- Table 35: North America Boric Acid Market Y-o-Y Growth Rate Comparison by End-User (2016-2032)
- Table 36: North America Boric Acid Market Y-o-Y Growth Rate Comparison by Distribution Channel (2016-2032)
- Table 37: North America Boric Acid Market Share Comparison by Country (2016-2032)
- Table 38: North America Boric Acid Market Share Comparison by Purity Grade (2016-2032)
- Table 39: North America Boric Acid Market Share Comparison by Application (2016-2032)
- Table 40: North America Boric Acid Market Share Comparison by End-User (2016-2032)
- Table 41: North America Boric Acid Market Share Comparison by Distribution Channel (2016-2032)
- Table 42: Western Europe Boric Acid Market Comparison by Purity Grade (2016-2032)
- Table 43: Western Europe Boric Acid Market Comparison by Application (2016-2032)
- Table 44: Western Europe Boric Acid Market Comparison by End-User (2016-2032)
- Table 45: Western Europe Boric Acid Market Comparison by Distribution Channel (2016-2032)
- Table 46: Western Europe Boric Acid Market Revenue (US$ Mn) Comparison by Country (2016-2032)
- Table 47: Western Europe Boric Acid Market Revenue (US$ Mn) (2016-2032)
- Table 48: Western Europe Boric Acid Market Revenue (US$ Mn) Comparison by Country (2016-2032)
- Table 49: Western Europe Boric Acid Market Revenue (US$ Mn) Comparison by Purity Grade (2016-2032)
- Table 50: Western Europe Boric Acid Market Revenue (US$ Mn) Comparison by Application (2016-2032)
- Table 51: Western Europe Boric Acid Market Revenue (US$ Mn) Comparison by End-User (2016-2032)
- Table 52: Western Europe Boric Acid Market Revenue (US$ Mn) Comparison by Distribution Channel (2016-2032)
- Table 53: Western Europe Boric Acid Market Y-o-Y Growth Rate Comparison by Country (2016-2032)
- Table 54: Western Europe Boric Acid Market Y-o-Y Growth Rate Comparison by Purity Grade (2016-2032)
- Table 55: Western Europe Boric Acid Market Y-o-Y Growth Rate Comparison by Application (2016-2032)
- Table 56: Western Europe Boric Acid Market Y-o-Y Growth Rate Comparison by End-User (2016-2032)
- Table 57: Western Europe Boric Acid Market Y-o-Y Growth Rate Comparison by Distribution Channel (2016-2032)
- Table 58: Western Europe Boric Acid Market Share Comparison by Country (2016-2032)
- Table 59: Western Europe Boric Acid Market Share Comparison by Purity Grade (2016-2032)
- Table 60: Western Europe Boric Acid Market Share Comparison by Application (2016-2032)
- Table 61: Western Europe Boric Acid Market Share Comparison by End-User (2016-2032)
- Table 62: Western Europe Boric Acid Market Share Comparison by Distribution Channel (2016-2032)
- Table 63: Eastern Europe Boric Acid Market Comparison by Purity Grade (2016-2032)
- Table 64: Eastern Europe Boric Acid Market Comparison by Application (2016-2032)
- Table 65: Eastern Europe Boric Acid Market Comparison by End-User (2016-2032)
- Table 66: Eastern Europe Boric Acid Market Comparison by Distribution Channel (2016-2032)
- Table 67: Eastern Europe Boric Acid Market Revenue (US$ Mn) Comparison by Country (2016-2032)
- Table 68: Eastern Europe Boric Acid Market Revenue (US$ Mn) (2016-2032)
- Table 69: Eastern Europe Boric Acid Market Revenue (US$ Mn) Comparison by Country (2016-2032)
- Table 70: Eastern Europe Boric Acid Market Revenue (US$ Mn) Comparison by Purity Grade (2016-2032)
- Table 71: Eastern Europe Boric Acid Market Revenue (US$ Mn) Comparison by Application (2016-2032)
- Table 72: Eastern Europe Boric Acid Market Revenue (US$ Mn) Comparison by End-User (2016-2032)
- Table 73: Eastern Europe Boric Acid Market Revenue (US$ Mn) Comparison by Distribution Channel (2016-2032)
- Table 74: Eastern Europe Boric Acid Market Y-o-Y Growth Rate Comparison by Country (2016-2032)
- Table 75: Eastern Europe Boric Acid Market Y-o-Y Growth Rate Comparison by Purity Grade (2016-2032)
- Table 76: Eastern Europe Boric Acid Market Y-o-Y Growth Rate Comparison by Application (2016-2032)
- Table 77: Eastern Europe Boric Acid Market Y-o-Y Growth Rate Comparison by End-User (2016-2032)
- Table 78: Eastern Europe Boric Acid Market Y-o-Y Growth Rate Comparison by Distribution Channel (2016-2032)
- Table 79: Eastern Europe Boric Acid Market Share Comparison by Country (2016-2032)
- Table 80: Eastern Europe Boric Acid Market Share Comparison by Purity Grade (2016-2032)
- Table 81: Eastern Europe Boric Acid Market Share Comparison by Application (2016-2032)
- Table 82: Eastern Europe Boric Acid Market Share Comparison by End-User (2016-2032)
- Table 83: Eastern Europe Boric Acid Market Share Comparison by Distribution Channel (2016-2032)
- Table 84: APAC Boric Acid Market Comparison by Purity Grade (2016-2032)
- Table 85: APAC Boric Acid Market Comparison by Application (2016-2032)
- Table 86: APAC Boric Acid Market Comparison by End-User (2016-2032)
- Table 87: APAC Boric Acid Market Comparison by Distribution Channel (2016-2032)
- Table 88: APAC Boric Acid Market Revenue (US$ Mn) Comparison by Country (2016-2032)
- Table 89: APAC Boric Acid Market Revenue (US$ Mn) (2016-2032)
- Table 90: APAC Boric Acid Market Revenue (US$ Mn) Comparison by Country (2016-2032)
- Table 91: APAC Boric Acid Market Revenue (US$ Mn) Comparison by Purity Grade (2016-2032)
- Table 92: APAC Boric Acid Market Revenue (US$ Mn) Comparison by Application (2016-2032)
- Table 93: APAC Boric Acid Market Revenue (US$ Mn) Comparison by End-User (2016-2032)
- Table 94: APAC Boric Acid Market Revenue (US$ Mn) Comparison by Distribution Channel (2016-2032)
- Table 95: APAC Boric Acid Market Y-o-Y Growth Rate Comparison by Country (2016-2032)
- Table 96: APAC Boric Acid Market Y-o-Y Growth Rate Comparison by Purity Grade (2016-2032)
- Table 97: APAC Boric Acid Market Y-o-Y Growth Rate Comparison by Application (2016-2032)
- Table 98: APAC Boric Acid Market Y-o-Y Growth Rate Comparison by End-User (2016-2032)
- Table 99: APAC Boric Acid Market Y-o-Y Growth Rate Comparison by Distribution Channel (2016-2032)
- Table 100: APAC Boric Acid Market Share Comparison by Country (2016-2032)
- Table 101: APAC Boric Acid Market Share Comparison by Purity Grade (2016-2032)
- Table 102: APAC Boric Acid Market Share Comparison by Application (2016-2032)
- Table 103: APAC Boric Acid Market Share Comparison by End-User (2016-2032)
- Table 104: APAC Boric Acid Market Share Comparison by Distribution Channel (2016-2032)
- Table 105: Latin America Boric Acid Market Comparison by Purity Grade (2016-2032)
- Table 106: Latin America Boric Acid Market Comparison by Application (2016-2032)
- Table 107: Latin America Boric Acid Market Comparison by End-User (2016-2032)
- Table 108: Latin America Boric Acid Market Comparison by Distribution Channel (2016-2032)
- Table 109: Latin America Boric Acid Market Revenue (US$ Mn) Comparison by Country (2016-2032)
- Table 110: Latin America Boric Acid Market Revenue (US$ Mn) (2016-2032)
- Table 111: Latin America Boric Acid Market Revenue (US$ Mn) Comparison by Country (2016-2032)
- Table 112: Latin America Boric Acid Market Revenue (US$ Mn) Comparison by Purity Grade (2016-2032)
- Table 113: Latin America Boric Acid Market Revenue (US$ Mn) Comparison by Application (2016-2032)
- Table 114: Latin America Boric Acid Market Revenue (US$ Mn) Comparison by End-User (2016-2032)
- Table 115: Latin America Boric Acid Market Revenue (US$ Mn) Comparison by Distribution Channel (2016-2032)
- Table 116: Latin America Boric Acid Market Y-o-Y Growth Rate Comparison by Country (2016-2032)
- Table 117: Latin America Boric Acid Market Y-o-Y Growth Rate Comparison by Purity Grade (2016-2032)
- Table 118: Latin America Boric Acid Market Y-o-Y Growth Rate Comparison by Application (2016-2032)
- Table 119: Latin America Boric Acid Market Y-o-Y Growth Rate Comparison by End-User (2016-2032)
- Table 120: Latin America Boric Acid Market Y-o-Y Growth Rate Comparison by Distribution Channel (2016-2032)
- Table 121: Latin America Boric Acid Market Share Comparison by Country (2016-2032)
- Table 122: Latin America Boric Acid Market Share Comparison by Purity Grade (2016-2032)
- Table 123: Latin America Boric Acid Market Share Comparison by Application (2016-2032)
- Table 124: Latin America Boric Acid Market Share Comparison by End-User (2016-2032)
- Table 125: Latin America Boric Acid Market Share Comparison by Distribution Channel (2016-2032)
- Table 126: Middle East & Africa Boric Acid Market Comparison by Purity Grade (2016-2032)
- Table 127: Middle East & Africa Boric Acid Market Comparison by Application (2016-2032)
- Table 128: Middle East & Africa Boric Acid Market Comparison by End-User (2016-2032)
- Table 129: Middle East & Africa Boric Acid Market Comparison by Distribution Channel (2016-2032)
- Table 130: Middle East & Africa Boric Acid Market Revenue (US$ Mn) Comparison by Country (2016-2032)
- Table 131: Middle East & Africa Boric Acid Market Revenue (US$ Mn) (2016-2032)
- Table 132: Middle East & Africa Boric Acid Market Revenue (US$ Mn) Comparison by Country (2016-2032)
- Table 133: Middle East & Africa Boric Acid Market Revenue (US$ Mn) Comparison by Purity Grade (2016-2032)
- Table 134: Middle East & Africa Boric Acid Market Revenue (US$ Mn) Comparison by Application (2016-2032)
- Table 135: Middle East & Africa Boric Acid Market Revenue (US$ Mn) Comparison by End-User (2016-2032)
- Table 136: Middle East & Africa Boric Acid Market Revenue (US$ Mn) Comparison by Distribution Channel (2016-2032)
- Table 137: Middle East & Africa Boric Acid Market Y-o-Y Growth Rate Comparison by Country (2016-2032)
- Table 138: Middle East & Africa Boric Acid Market Y-o-Y Growth Rate Comparison by Purity Grade (2016-2032)
- Table 139: Middle East & Africa Boric Acid Market Y-o-Y Growth Rate Comparison by Application (2016-2032)
- Table 140: Middle East & Africa Boric Acid Market Y-o-Y Growth Rate Comparison by End-User (2016-2032)
- Table 141: Middle East & Africa Boric Acid Market Y-o-Y Growth Rate Comparison by Distribution Channel (2016-2032)
- Table 142: Middle East & Africa Boric Acid Market Share Comparison by Country (2016-2032)
- Table 143: Middle East & Africa Boric Acid Market Share Comparison by Purity Grade (2016-2032)
- Table 144: Middle East & Africa Boric Acid Market Share Comparison by Application (2016-2032)
- Table 145: Middle East & Africa Boric Acid Market Share Comparison by End-User (2016-2032)
- Table 146: Middle East & Africa Boric Acid Market Share Comparison by Distribution Channel (2016-2032)
- 1. Executive Summary
-
- Rio Tinto Group
- 3M Company
- Borax Inc.
- EtiMaden
- Nirma Limited
- NIPPON DENKO CO. LTD.
- Promega Corporation
- Southern Agricultural Insecticides Inc.
- Quiborax S.A.
- American Borate Company
- Minera Santa Rita S.R.L. (MSR)
- BASF SE
- Gujarat Boron Derivatives Pvt. Ltd.
- Russian Bor
- Searles Valley Minerals
Our Clients


View Our Licence Options
