Biliary Tumor Market By Treatment (Chemotherapy, Immunotherapy, Targeted Therapy, Other), By Route of Administration (Oral, Parenteral, Other), By Distribution (Channel, Online Channel, Offline Channel), By End-User (Hospital Pharmacy, Retail Pharmacy, Online Pharmacy), By Region And Companies - Industry Segment Outlook, Market Assessment, Competition Scenario, Trends, And Forecast 2024-2033
-
47172
-
June 2024
-
300
-


-
This report was compiled by Trishita Deb Trishita Deb is an experienced market research and consulting professional with over 7 years of expertise across healthcare, consumer goods, and materials, contributing to over 400 healthcare-related reports. Correspondence Team Lead- Healthcare Linkedin | Detailed Market research Methodology Our methodology involves a mix of primary research, including interviews with leading mental health experts, and secondary research from reputable medical journals and databases. View Detailed Methodology Page
-
Quick Navigation
Report Overview
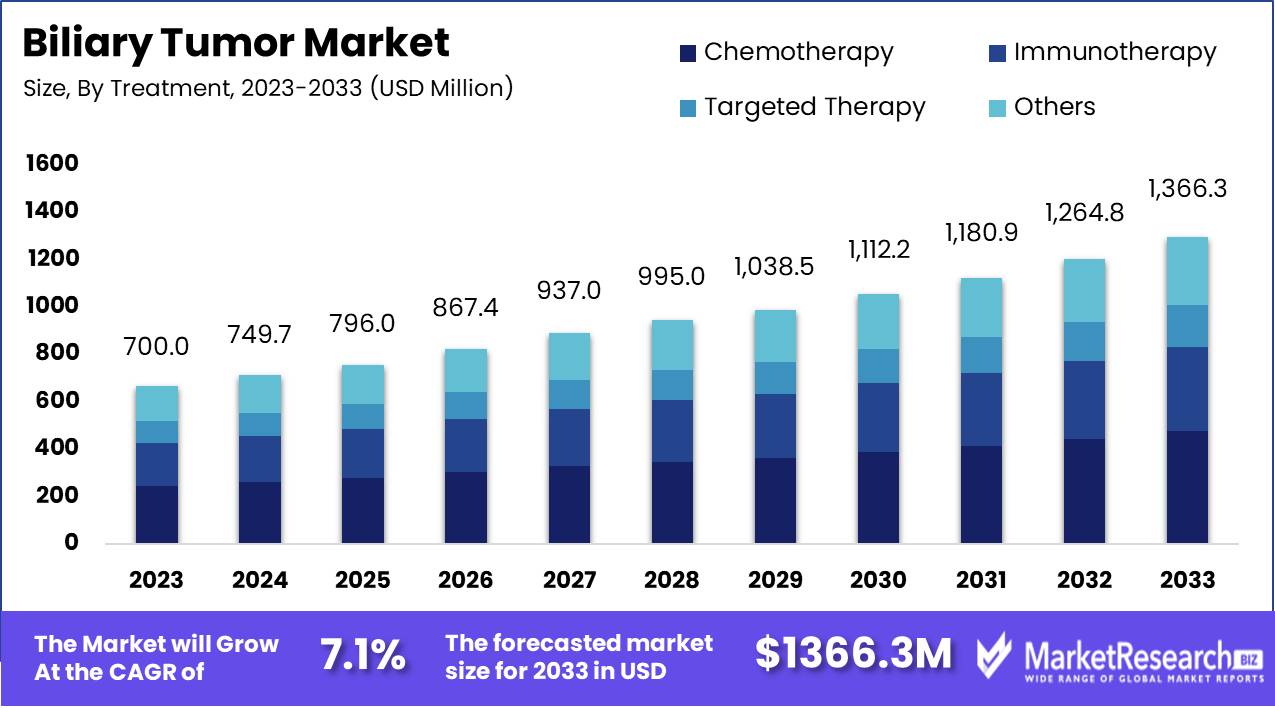
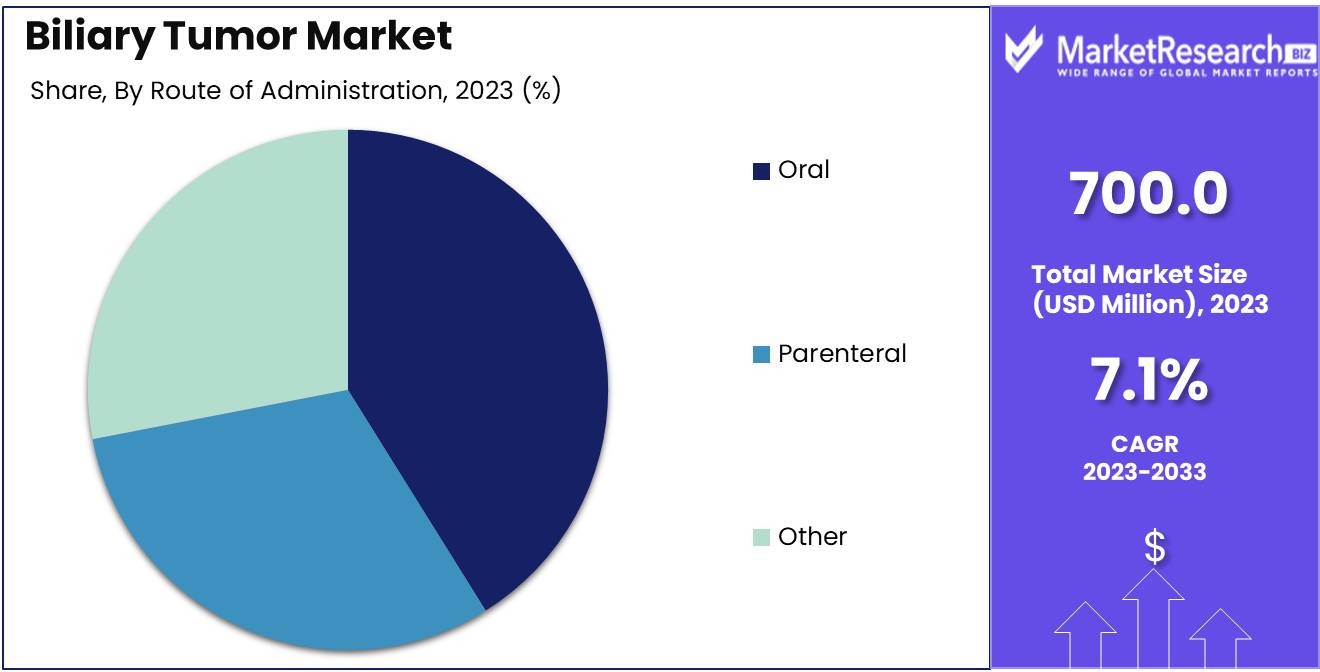
The Biliary Tumor Market was valued at USD 700.0 Million in 2023. It is expected to reach USD 1366.3 Million by 2033, with a CAGR of 7.1% during the forecast period from 2024 to 2033.
The Biliary Tumor Market encompasses the diagnosis, treatment, and management of tumors within the bile ducts and gallbladder, which are critical components of the digestive system. This market includes a wide range of medical services and products, such as diagnostic imaging technologies, surgical interventions, targeted therapies, and pharmaceuticals aimed at improving patient outcomes.
The biliary tumor market is poised for significant growth driven by several pivotal factors. Rising incidence rates of biliary cancers, coupled with advancements in diagnostic technologies, are key market drivers. These advancements have enhanced the ability to detect biliary tumors at earlier stages, thereby improving treatment outcomes. Additionally, increasing healthcare expenditure globally underscores the commitment to advancing cancer treatment protocols, which is particularly crucial given the aging population. The geriatric demographic is especially susceptible to biliary cancers, and as this population expands, the demand for effective treatment options is expected to surge. This landscape is further enriched by the expanding focus on targeted therapies, which aim to address specific genetic mutations associated with biliary tumors. These therapies not only promise higher efficacy but also mark a significant shift toward personalized medicine in oncology.
However, the market faces considerable challenges that could impede its growth trajectory. The high cost of treatment remains a significant barrier, limiting access for a broader patient population. Moreover, the limited availability of effective therapies necessitates ongoing research and development to fill this gap. The complex nature of biliary tumors further complicates early diagnosis and treatment, highlighting the need for continuous innovation in diagnostic and therapeutic approaches.
Despite these challenges, the market's focus on targeted therapies represents a promising avenue, potentially revolutionizing treatment paradigms and offering hope for improved patient outcomes. As stakeholders navigate these dynamics, strategic investments in R&D and healthcare infrastructure will be critical in overcoming these hurdles and harnessing the full potential of emerging therapeutic modalities.
Key Takeaways
- Market Growth: The Biliary Tumor Market was valued at USD 700.0 Million in 2023. It is expected to reach USD 1366.3 Million by 2033, with a CAGR of 7.1% during the forecast period from 2024 to 2033.
- By Treatment: Chemotherapy dominated biliary tumor treatment, boosting patient outcomes.
- By Route of Administration: The Oral segment dominated biliary tumor treatment distribution channels.
- By Distribution Channel: The Online Channel dominated biliary tumor treatment distribution.
- By End-User: Hospital Pharmacy leads in Biliary Tumor Market by End-User segment.
- Regional Dominance: North America dominates the biliary tumor market with a 35% share.
- Growth Opportunity: The global biliary tumor market will grow through enhanced awareness, early diagnosis, and advanced treatments.
Driving factors
Surge in Bile Duct Cancer Incidence Drives Market Demand
The rising incidence of bile duct cancer, including cholangiocarcinoma, significantly propels the biliary tumor market. As of recent statistics, bile duct cancer remains a relatively rare but highly aggressive malignancy, often diagnosed in late stages, thus necessitating advanced therapeutic interventions. For instance, the American Cancer Society estimates that approximately 8,000 new cases of cholangiocarcinoma are diagnosed annually in the United States alone. This increase highlights a growing patient pool requiring medical attention, from diagnostic imaging to surgical procedures and postoperative care.
Technological Advancements in Healthcare Catalyze Market Expansion
Rapid technological advancements in healthcare have been pivotal in enhancing the diagnosis, treatment, and management of biliary tumors. Innovations in imaging technologies such as high-resolution MRI and CT scans have improved early detection rates, crucial for effective treatment outcomes. Additionally, the integration of artificial intelligence in radiology has enabled more precise tumor mapping and personalized treatment plans, which are critical in managing complex biliary cancers. The development of targeted therapies and immunotherapies, driven by advanced research and biotechnology, offers new hope for patients, further boosting the market.
Advances in Surgical Techniques Enhance Treatment Efficacy
The evolution of surgical techniques significantly contributes to the growth of the biliary tumor market. Minimally invasive procedures, such as laparoscopic and robotic-assisted surgeries, have revolutionized the treatment landscape. These advanced surgical methods reduce patient recovery times, minimize complications, and improve overall survival rates. For example, robotic-assisted surgeries offer greater precision and control, enabling surgeons to perform complex resections with higher success rates. Such improvements in surgical outcomes enhance patient confidence and increase the uptake of surgical interventions, thus expanding the market.
Restraining Factors
Inadequate Public Awareness: A Critical Barrier to Market Expansion
Inadequate public awareness significantly hampers the growth of the biliary tumor market. The lack of widespread knowledge about biliary tumors, their symptoms, and available treatment options leads to delayed diagnoses and a lower rate of early detection. According to recent studies, early-stage detection significantly improves treatment outcomes and survival rates for patients with biliary tumors. However, insufficient awareness often results in patients presenting with advanced stages of the disease, where treatment options are more limited and less effective.
This awareness gap extends beyond the general public to healthcare providers, particularly in regions with limited access to specialized medical training and resources. Without proper education and awareness campaigns, many patients remain undiagnosed or misdiagnosed, leading to a smaller market for diagnostic tools and treatment options.
Infectious and Non-Infectious Risk Factors: Complex Challenges Limiting Market Growth
The presence of infectious and non-infectious risk factors complicates the landscape for the biliary tumor market, presenting multiple challenges that impede growth. Infectious agents such as hepatitis B and C viruses are well-known risk factors for the development of biliary tumors. Despite the availability of vaccines and antiviral treatments, the prevalence of these infections remains high in many parts of the world, particularly in developing regions. For instance, the World Health Organization (WHO) reports that approximately 257 million people were living with hepatitis B infection in 2019, and the global burden of hepatitis C remains substantial.
Non-infectious risk factors, including primary sclerosing cholangitis (PSC), liver cirrhosis, and certain genetic conditions, also contribute to the incidence of biliary tumors. These conditions often require complex and long-term management, straining healthcare systems and resources. The interplay between infectious and non-infectious factors exacerbates the difficulty in creating effective screening and prevention strategies, further inhibiting market growth.
By Treatment Analysis
In 2023, Chemotherapy dominated biliary tumor treatment, boosting patient outcomes.
In 2023, Chemotherapy held a dominant market position in the by-treatment segment of the biliary tumor market. Chemotherapy's efficacy in shrinking tumors and improving survival rates has established it as the standard of care. This treatment's widespread adoption is driven by its proven track record, availability, and relatively lower cost compared to emerging therapies.
Immunotherapy is gaining traction, leveraging the body's immune system to target cancer cells, showing promising results in clinical trials. Although still in nascent stages for biliary tumors, its potential for fewer side effects and long-term remission is attracting significant investment and research.
Targeted therapy, focusing on specific genetic mutations within cancer cells, offers a personalized approach, enhancing treatment precision and efficacy. Its adoption is rising due to advancements in genetic profiling, though high costs and accessibility issues remain challenges.
Other treatments, including radiation therapy and palliative care, continue to support comprehensive cancer care, addressing symptoms and improving quality of life. As the biliary tumor market evolves, the integration of these diverse treatment modalities is anticipated to enhance patient outcomes and drive market growth.
By Route of Administration Analysis
In 2023, The Oral segment dominated biliary tumor treatment distribution channels.
In 2023, The Oral Segment held a dominant market position in the By Distribution Channel segment of the Biliary Tumor Market. This prevalence is primarily attributed to the convenience and non-invasive nature of oral treatments, which significantly enhance patient compliance and accessibility. The segment's dominance is further bolstered by ongoing advancements in oral drug formulations that improve bioavailability and therapeutic efficacy.
Parenteral, while crucial for acute and severe cases, occupies a secondary position due to its invasive nature and the need for healthcare professional administration. Despite its essential role in delivering rapid therapeutic effects, its adoption is somewhat limited by higher costs and the requirement for specialized storage and handling. The Other segment, encompassing transdermal, rectal, and inhalation routes, represents a niche yet growing area, driven by patients with specific needs or contraindications for oral or parenteral routes. Innovation in drug delivery systems within this segment is expected to contribute to its gradual market penetration.
By Distribution Channel Analysis
In 2023, The Online Channel dominated biliary tumor treatment distribution.
In 2023, The Online Channel held a dominant market position in the Distribution Channel segment of the Biliary Tumor Market. This trend was driven by the increasing adoption of digital healthcare solutions and the growing preference for online consultations and prescription services. The convenience of accessing medical information and purchasing medications online has significantly boosted patient engagement and adherence to treatment protocols. Additionally, the rise of telemedicine platforms and e-pharmacies has facilitated timely diagnosis and treatment, further cementing the online channel's prominence.
Conversely, the Offline Channel, comprising traditional brick-and-mortar pharmacies and hospital-based pharmacies, continues to play a crucial role, particularly for patients who require immediate access to medications and face-to-face consultations with healthcare professionals. Despite the digital shift, the offline channel remains vital for handling complex cases and providing personalized care, especially in regions with limited internet access. The continued trust in physical consultations and the assurance of in-person medical guidance ensure that the offline channel maintains a significant presence in the biliary tumor treatment landscape.
By End-User Analysis
Hospital Pharmacy leads in Biliary Tumor Market by End-User segment.
In 2023, Hospital Pharmacies held a dominant market position in the By End-User segment of the Biliary Tumor Market. This leadership can be attributed to the comprehensive capabilities of hospital pharmacies in managing complex cancer treatments. Hospital pharmacies offer specialized medications and tailored treatment regimens, ensuring high compliance and efficacy in patient care. They are integral in the administration of advanced therapeutic options, including chemotherapy and targeted therapies, which require meticulous handling and monitoring available in a hospital setting.
Retail Pharmacies, while providing broader accessibility to medications, tend to focus on less specialized services. However, they play a crucial role in maintaining continuity of care by dispensing supportive drugs and managing side effects post-hospitalization.
Online Pharmacies are progressively carving out their niche by offering convenience and cost-effectiveness, especially appealing to patients in remote areas or those seeking competitive pricing. Their adoption is growing, driven by advancements in telemedicine and digital health platforms, though they still face regulatory and logistical challenges compared to hospital settings.
Key Market Segments
By Treatment
- Chemotherapy
- Immunotherapy
- Targeted Therapy
- Other
By Route of Administration
- Oral
- Parenteral
- Other
By Distribution Channel
- Online Channel
- Offline Channel
By End-User
- Hospital Pharmacy
- Retail Pharmacy
- Online Pharmacy
Growth Opportunity
Increased Awareness and Diagnosis
The rising global awareness of biliary tumors is creating substantial growth opportunities for the market in 2024. Over the past decade, concerted efforts by healthcare organizations, advocacy groups, and governments have significantly enhanced public knowledge regarding the symptoms and risks associated with biliary tumors. This increased awareness is driving higher rates of early diagnosis, which is crucial for improving patient outcomes. Early detection not only improves survival rates but also expands the pool of patients eligible for various treatments, thereby boosting market demand.
Growing Demand for Effective Treatment Options
The growing incidence of biliary tumors, coupled with advances in medical technology, is spurring a heightened demand for effective treatment options. Innovations in precision medicine and targeted therapies are at the forefront of this growth. Pharmaceutical companies are increasingly investing in the development of novel drugs and minimally invasive surgical techniques. This trend is supported by substantial research and development funding, highlighting a robust pipeline of potential new treatments.
Latest Trends
Increased Focus on Personalized Medicine
In 2024, the biliary tumor market is witnessing a significant shift towards personalized medicine. This trend is driven by advancements in genomic profiling and molecular diagnostics, which enable more precise identification of tumor characteristics and patient-specific treatment pathways. Personalized medicine tailors therapeutic approaches to the genetic makeup of individual patients, improving treatment efficacy and minimizing adverse effects. This paradigm shift is particularly crucial for biliary tumors, which are often diagnosed at advanced stages and exhibit considerable heterogeneity.
Pharmaceutical companies and healthcare providers are investing heavily in personalized treatment protocols, aiming to enhance patient outcomes and streamline clinical workflows. The integration of next-generation sequencing (NGS) and biomarker-driven therapies underscores the growing emphasis on individualized care, marking a pivotal transformation in the biliary tumor therapeutic landscape.
Development of Targeted Therapies
Another prominent trend in the biliary tumor market for 2024 is the accelerated development of targeted therapies. These therapies focus on specific molecular targets associated with biliary tumors, offering a more precise mechanism of action compared to traditional chemotherapy. Advances in understanding the molecular biology of biliary tumors have led to the identification of actionable genetic mutations and aberrant signaling pathways.
Targeted therapies, such as tyrosine kinase inhibitors and monoclonal antibodies, are designed to interfere with these specific molecular alterations, thereby inhibiting tumor growth and progression. The market is experiencing robust pipeline activity, with numerous targeted agents undergoing clinical trials. The success of these therapies promises to revolutionize the standard of care for biliary tumors, providing patients with more effective and less toxic treatment options.
Regional Analysis
North America dominates the biliary tumor market with a 35% share.
The biliary tumor market exhibits significant regional variations, driven by diverse healthcare infrastructures, economic conditions, and demographic factors. In North America, which dominates the market with approximately 35% share, the prevalence of biliary tumors is relatively high, supported by advanced diagnostic technologies and robust healthcare expenditure. The United States, a key contributor, benefits from extensive R&D activities and high patient awareness, fostering substantial market growth.
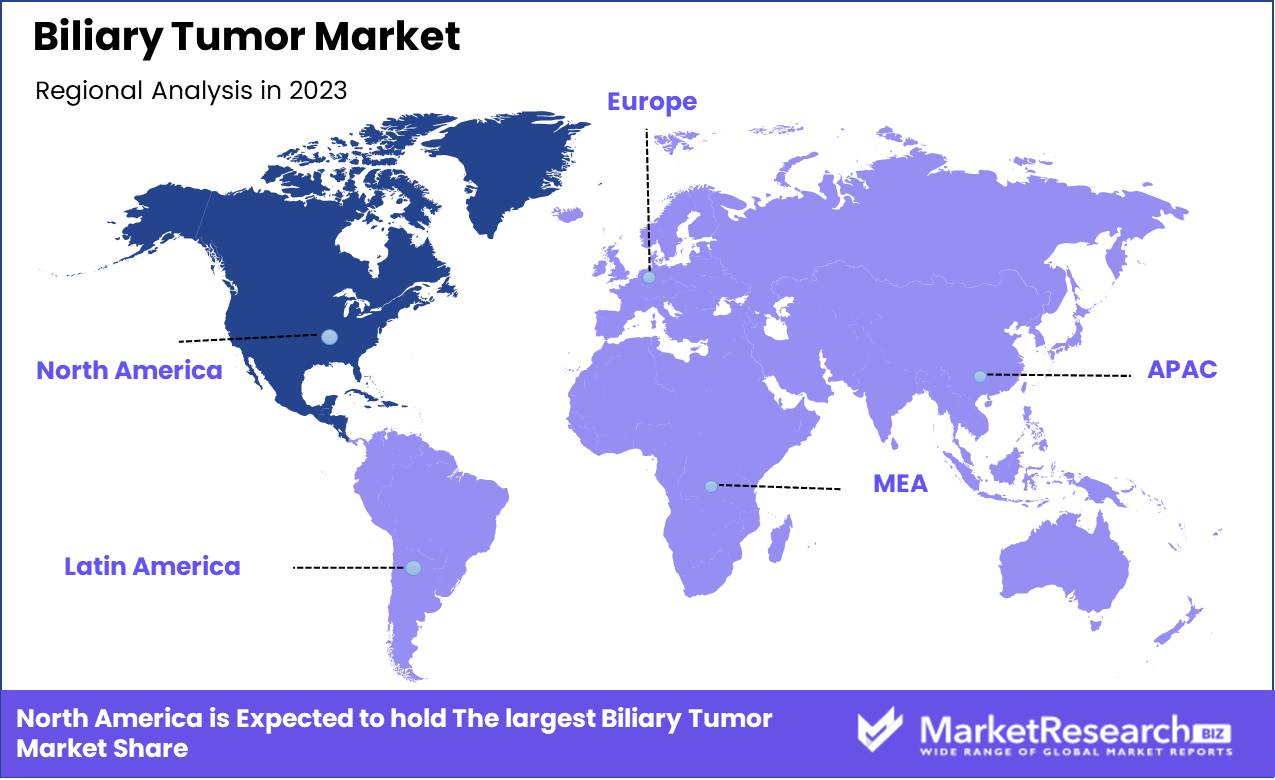
Europe follows, holding around 30% of the market, propelled by increasing incidence rates and strong governmental support for cancer research. Countries such as Germany, the UK, and France lead the regional market, attributed to their well-established healthcare systems and growing adoption of innovative therapeutic approaches.
The Asia Pacific region, capturing approximately 20% of the market, is experiencing rapid growth due to rising healthcare investments, improving diagnostic capabilities, and a growing aging population. Key markets include China, Japan, and India, where increasing cancer prevalence and expanding medical infrastructure are pivotal.
In the Middle East & Africa, the market is gradually emerging, supported by improving healthcare facilities and rising awareness of biliary diseases. However, limited access to advanced treatments poses a challenge. Latin America, with around 10% market share, is driven by countries like Brazil and Mexico, where enhancements in healthcare services and rising cancer detection rates are key growth drivers.
Key Regions and Countries
North America
- The US
- Canada
- Rest of North America
Europe
- Germany
- France
- The UK
- Spain
- Netherlands
- Russia
- Italy
- Rest of Europe
Asia-Pacific
- China
- Japan
- Singapore
- Thailand
- South Korea
- Vietnam
- India
- New Zealand
- Rest of Asia Pacific
Latin America
- Mexico
- Brazil
- Rest of Latin America
Middle East & Africa
- Saudi Arabia
- South Africa
- UAE
- Rest of the Middle East & Africa
Key Players Analysis
The global biliary tumor market in 2024 is poised for significant advancements, driven by a diverse array of key players that are shaping the landscape through innovation, strategic collaborations, and robust research and development efforts.
Sanofi (France) and GlaxoSmithKline plc (UK) are actively engaged in cutting-edge research, with a focus on targeted therapies and immuno-oncology, aiming to improve patient outcomes and survival rates. AbbVie Inc. (US) and Novartis AG (Switzerland) are investing heavily in biopharmaceutical innovations, emphasizing personalized medicine and combination therapies to address the complex nature of biliary tumors.
Fresenius Kabi AG (Germany) and Eli Lilly and Company (US) are enhancing their product pipelines through strategic acquisitions and partnerships, aiming to broaden their oncology offerings. F. Hoffmann-La Roche Ltd. (Switzerland) maintains a strong position with its robust clinical trial pipeline, focusing on both early and late-stage biliary tumor treatments.
Specialized companies like Intercept Pharmaceuticals (US) and Delcath Systems, Inc. (US) are making strides in niche areas of liver and biliary cancer therapeutics, providing unique and targeted treatment options. Kyowa Kirin Co., Ltd. (Japan) and Accord Healthcare (US) are enhancing their presence through innovative drug formulations and delivery systems.
Medical device companies such as CONMED Corporation (US), Boston Scientific Corporation (US), and Bayer AG (Germany) are contributing significantly with advanced diagnostic and interventional technologies, improving early detection and treatment efficacy. Bristol-Myers Squibb Company (US) and Merck & Co., Inc. (US) continue to lead in immunotherapy research, offering promising new avenues for biliary tumor treatment.
Market Key Players
- Johnson & Johnson Private Limited (US)
- Mylan N.V. (US)
- Teva Pharmaceutical Industries Ltd.(Jerusalem)
- Sanofi (France)
- Pfizer Inc. (US)
- GlaxoSmithKline plc (UK)
- AbbVie Inc. (US)
- Novartis AG (Switzerland)
- Fresenius Kabi AG (Germany)
- Eli Lilly and Company (US)
- F. Hoffmann-La Roche Ltd. (Switzerland)
- Intercept Pharmaceuticals (US)
- Kyowa Kirin Co., Ltd. (Japan)
- Delcath Systems, Inc. (US)
- Accord Healthcare (US)
- CONMED Corporation (US)
- Boston Scientific Corporation (US)
- Bayer AG (Germany)
- Bristol-Myers Squibb Company (US)
- Merck & Co., Inc. (US)
Recent Development
- In April 2024, NuCana, a prominent player in the oncology field, made significant strides by expanding its pipeline with new therapeutic candidates for biliary tumors. The company's focus on innovative chemotherapy agents is expected to improve treatment outcomes for patients suffering from these malignancies.
- In March 2024, Launch of Clinical Trials by Mirati Therapeutics: Mirati Therapeutics has initiated new clinical trials for their investigational drug targeting biliary tumors. These trials aim to assess the efficacy of their novel molecularly targeted therapy, which holds promise for improving patient survival rates and quality of life.
- In February 2024, Enhanced Imaging Techniques for Early Detection: Researchers have made substantial progress in imaging techniques, which are crucial for the early detection of biliary tumors. Enhanced MRI and PET-CT scans are now being utilized to provide more detailed visualizations of tumor growth and spread, allowing for more effective early-stage intervention.
Report Scope
Report Features Description Market Value (2023) USD 700.0 Million Forecast Revenue (2033) USD 1366.3 Million CAGR (2024-2032) 7.1% Base Year for Estimation 2023 Historic Period 2016-2023 Forecast Period 2024-2033 Report Coverage Revenue Forecast, Market Dynamics, COVID-19 Impact, Competitive Landscape, Recent Developments Segments Covered By Treatment (Chemotherapy, Immunotherapy, Targeted Therapy, Other), By Route of Administration (Oral, Parenteral, Other), By Distribution (Channel, Online Channel, Offline Channel), By End-User (Hospital Pharmacy, Retail Pharmacy, Online Pharmacy) Regional Analysis North America - The US, Canada, Rest of North America, Europe - Germany, France, The UK, Spain, Italy, Russia, Netherlands, Rest of Europe, Asia-Pacific - China, Japan, South Korea, India, New Zealand, Singapore, Thailand, Vietnam, Rest of Asia Pacific, Latin America - Brazil, Mexico, Rest of Latin America, Middle East & Africa - South Africa, Saudi Arabia, UAE, Rest of Middle East & Africa Competitive Landscape Johnson & Johnson Private Limited (US), Mylan N.V. (US), Teva Pharmaceutical Industries Ltd.(Jerusalem), Sanofi (France), Pfizer Inc. (US), GlaxoSmithKline plc (UK), AbbVie Inc. (US), Novartis AG (Switzerland), Fresenius Kabi AG (Germany), Eli Lilly and Company (US), F. Hoffmann-La Roche Ltd. (Switzerland), Intercept Pharmaceuticals (US), Kyowa Kirin Co., Ltd. (Japan), Delcath Systems, Inc. (US), Accord Healthcare (US), CONMED Corporation (US), Boston Scientific Corporation (US), Bayer AG (Germany), Bristol-Myers Squibb Company (US), Merck & Co., Inc. (US) Customization Scope Customization for segments, region/country-level will be provided. Moreover, additional customization can be done based on the requirements. Purchase Options We have three licenses to opt for Single User License, Multi-User License (Up to 5 Users), Corporate Use License (Unlimited User and Printable PDF) -
- 1. Executive Summary
- 1.1. Definition
- 1.2. Taxonomy
- 1.3. Research Scope
- 1.4. Key Analysis
- 1.5. Key Findings by Major Segments
- 1.6. Top strategies by Major Players
- 2. Global Biliary Tumor Market Overview
- 2.1. Biliary Tumor Market Dynamics
- 2.1.1. Drivers
- 2.1.2. Opportunities
- 2.1.3. Restraints
- 2.1.4. Challenges
- 2.2. Macro-economic Factors
- 2.3. Regulatory Framework
- 2.4. Market Investment Feasibility Index
- 2.5. PEST Analysis
- 2.6. PORTER’S Five Force Analysis
- 2.7. Drivers & Restraints Impact Analysis
- 2.8. Industry Chain Analysis
- 2.9. Cost Structure Analysis
- 2.10. Marketing Strategy
- 2.11. Russia-Ukraine War Impact Analysis
- 2.12. Opportunity Map Analysis
- 2.13. Market Competition Scenario Analysis
- 2.14. Product Life Cycle Analysis
- 2.15. Opportunity Orbits
- 2.16. Manufacturer Intensity Map
- 2.17. Major Companies sales by Value & Volume
- 2.1. Biliary Tumor Market Dynamics
- 3. Global Biliary Tumor Market Analysis, Opportunity and Forecast, 2016-2032
- 3.1. Global Biliary Tumor Market Analysis, 2016-2021
- 3.2. Global Biliary Tumor Market Opportunity and Forecast, 2023-2032
- 3.3. Global Biliary Tumor Market Analysis, Opportunity and Forecast, By Treatment, 2016-2032
- 3.3.1. Global Biliary Tumor Market Analysis by Treatment: Introduction
- 3.3.2. Market Size Absolute $ Opportunity Analysis and Forecast, By Treatment, 2016-2032
- 3.3.3. Chemotherapy
- 3.3.4. Immunotherapy
- 3.3.5. Targeted Therapy
- 3.3.6. Other
- 3.4. Global Biliary Tumor Market Analysis, Opportunity and Forecast, By Route of Administration, 2016-2032
- 3.4.1. Global Biliary Tumor Market Analysis by Route of Administration: Introduction
- 3.4.2. Market Size Absolute $ Opportunity Analysis and Forecast, By Route of Administration, 2016-2032
- 3.4.3. Oral
- 3.4.4. Parenteral
- 3.4.5. Other
- 3.5. Global Biliary Tumor Market Analysis, Opportunity and Forecast, By Distribution Channel, 2016-2032
- 3.5.1. Global Biliary Tumor Market Analysis by Distribution Channel: Introduction
- 3.5.2. Market Size Absolute $ Opportunity Analysis and Forecast, By Distribution Channel, 2016-2032
- 3.5.3. Online Channel
- 3.5.4. Offline Channel
- 3.6. Global Biliary Tumor Market Analysis, Opportunity and Forecast, By End-User, 2016-2032
- 3.6.1. Global Biliary Tumor Market Analysis by End-User: Introduction
- 3.6.2. Market Size Absolute $ Opportunity Analysis and Forecast, By End-User, 2016-2032
- 3.6.3. Hospital Pharmacy
- 3.6.4. Retail Pharmacy
- 3.6.5. Online Pharmacy
- 4. North America Biliary Tumor Market Analysis, Opportunity and Forecast, 2016-2032
- 4.1. North America Biliary Tumor Market Analysis, 2016-2021
- 4.2. North America Biliary Tumor Market Opportunity and Forecast, 2023-2032
- 4.3. North America Biliary Tumor Market Analysis, Opportunity and Forecast, By Treatment, 2016-2032
- 4.3.1. North America Biliary Tumor Market Analysis by Treatment: Introduction
- 4.3.2. Market Size Absolute $ Opportunity Analysis and Forecast, By Treatment, 2016-2032
- 4.3.3. Chemotherapy
- 4.3.4. Immunotherapy
- 4.3.5. Targeted Therapy
- 4.3.6. Other
- 4.4. North America Biliary Tumor Market Analysis, Opportunity and Forecast, By Route of Administration, 2016-2032
- 4.4.1. North America Biliary Tumor Market Analysis by Route of Administration: Introduction
- 4.4.2. Market Size Absolute $ Opportunity Analysis and Forecast, By Route of Administration, 2016-2032
- 4.4.3. Oral
- 4.4.4. Parenteral
- 4.4.5. Other
- 4.5. North America Biliary Tumor Market Analysis, Opportunity and Forecast, By Distribution Channel, 2016-2032
- 4.5.1. North America Biliary Tumor Market Analysis by Distribution Channel: Introduction
- 4.5.2. Market Size Absolute $ Opportunity Analysis and Forecast, By Distribution Channel, 2016-2032
- 4.5.3. Online Channel
- 4.5.4. Offline Channel
- 4.6. North America Biliary Tumor Market Analysis, Opportunity and Forecast, By End-User, 2016-2032
- 4.6.1. North America Biliary Tumor Market Analysis by End-User: Introduction
- 4.6.2. Market Size Absolute $ Opportunity Analysis and Forecast, By End-User, 2016-2032
- 4.6.3. Hospital Pharmacy
- 4.6.4. Retail Pharmacy
- 4.6.5. Online Pharmacy
- 4.7. North America Biliary Tumor Market Analysis, Opportunity and Forecast, By Country , 2016-2032
- 4.7.1. North America Biliary Tumor Market Analysis by Country : Introduction
- 4.7.2. Market Size Absolute $ Opportunity Analysis and Forecast, Country , 2016-2032
- 4.7.2.1. The US
- 4.7.2.2. Canada
- 4.7.2.3. Mexico
- 5. Western Europe Biliary Tumor Market Analysis, Opportunity and Forecast, 2016-2032
- 5.1. Western Europe Biliary Tumor Market Analysis, 2016-2021
- 5.2. Western Europe Biliary Tumor Market Opportunity and Forecast, 2023-2032
- 5.3. Western Europe Biliary Tumor Market Analysis, Opportunity and Forecast, By Treatment, 2016-2032
- 5.3.1. Western Europe Biliary Tumor Market Analysis by Treatment: Introduction
- 5.3.2. Market Size Absolute $ Opportunity Analysis and Forecast, By Treatment, 2016-2032
- 5.3.3. Chemotherapy
- 5.3.4. Immunotherapy
- 5.3.5. Targeted Therapy
- 5.3.6. Other
- 5.4. Western Europe Biliary Tumor Market Analysis, Opportunity and Forecast, By Route of Administration, 2016-2032
- 5.4.1. Western Europe Biliary Tumor Market Analysis by Route of Administration: Introduction
- 5.4.2. Market Size Absolute $ Opportunity Analysis and Forecast, By Route of Administration, 2016-2032
- 5.4.3. Oral
- 5.4.4. Parenteral
- 5.4.5. Other
- 5.5. Western Europe Biliary Tumor Market Analysis, Opportunity and Forecast, By Distribution Channel, 2016-2032
- 5.5.1. Western Europe Biliary Tumor Market Analysis by Distribution Channel: Introduction
- 5.5.2. Market Size Absolute $ Opportunity Analysis and Forecast, By Distribution Channel, 2016-2032
- 5.5.3. Online Channel
- 5.5.4. Offline Channel
- 5.6. Western Europe Biliary Tumor Market Analysis, Opportunity and Forecast, By End-User, 2016-2032
- 5.6.1. Western Europe Biliary Tumor Market Analysis by End-User: Introduction
- 5.6.2. Market Size Absolute $ Opportunity Analysis and Forecast, By End-User, 2016-2032
- 5.6.3. Hospital Pharmacy
- 5.6.4. Retail Pharmacy
- 5.6.5. Online Pharmacy
- 5.7. Western Europe Biliary Tumor Market Analysis, Opportunity and Forecast, By Country , 2016-2032
- 5.7.1. Western Europe Biliary Tumor Market Analysis by Country : Introduction
- 5.7.2. Market Size Absolute $ Opportunity Analysis and Forecast, Country , 2016-2032
- 5.7.2.1. Germany
- 5.7.2.2. France
- 5.7.2.3. The UK
- 5.7.2.4. Spain
- 5.7.2.5. Italy
- 5.7.2.6. Portugal
- 5.7.2.7. Ireland
- 5.7.2.8. Austria
- 5.7.2.9. Switzerland
- 5.7.2.10. Benelux
- 5.7.2.11. Nordic
- 5.7.2.12. Rest of Western Europe
- 6. Eastern Europe Biliary Tumor Market Analysis, Opportunity and Forecast, 2016-2032
- 6.1. Eastern Europe Biliary Tumor Market Analysis, 2016-2021
- 6.2. Eastern Europe Biliary Tumor Market Opportunity and Forecast, 2023-2032
- 6.3. Eastern Europe Biliary Tumor Market Analysis, Opportunity and Forecast, By Treatment, 2016-2032
- 6.3.1. Eastern Europe Biliary Tumor Market Analysis by Treatment: Introduction
- 6.3.2. Market Size Absolute $ Opportunity Analysis and Forecast, By Treatment, 2016-2032
- 6.3.3. Chemotherapy
- 6.3.4. Immunotherapy
- 6.3.5. Targeted Therapy
- 6.3.6. Other
- 6.4. Eastern Europe Biliary Tumor Market Analysis, Opportunity and Forecast, By Route of Administration, 2016-2032
- 6.4.1. Eastern Europe Biliary Tumor Market Analysis by Route of Administration: Introduction
- 6.4.2. Market Size Absolute $ Opportunity Analysis and Forecast, By Route of Administration, 2016-2032
- 6.4.3. Oral
- 6.4.4. Parenteral
- 6.4.5. Other
- 6.5. Eastern Europe Biliary Tumor Market Analysis, Opportunity and Forecast, By Distribution Channel, 2016-2032
- 6.5.1. Eastern Europe Biliary Tumor Market Analysis by Distribution Channel: Introduction
- 6.5.2. Market Size Absolute $ Opportunity Analysis and Forecast, By Distribution Channel, 2016-2032
- 6.5.3. Online Channel
- 6.5.4. Offline Channel
- 6.6. Eastern Europe Biliary Tumor Market Analysis, Opportunity and Forecast, By End-User, 2016-2032
- 6.6.1. Eastern Europe Biliary Tumor Market Analysis by End-User: Introduction
- 6.6.2. Market Size Absolute $ Opportunity Analysis and Forecast, By End-User, 2016-2032
- 6.6.3. Hospital Pharmacy
- 6.6.4. Retail Pharmacy
- 6.6.5. Online Pharmacy
- 6.7. Eastern Europe Biliary Tumor Market Analysis, Opportunity and Forecast, By Country , 2016-2032
- 6.7.1. Eastern Europe Biliary Tumor Market Analysis by Country : Introduction
- 6.7.2. Market Size Absolute $ Opportunity Analysis and Forecast, Country , 2016-2032
- 6.7.2.1. Russia
- 6.7.2.2. Poland
- 6.7.2.3. The Czech Republic
- 6.7.2.4. Greece
- 6.7.2.5. Rest of Eastern Europe
- 7. APAC Biliary Tumor Market Analysis, Opportunity and Forecast, 2016-2032
- 7.1. APAC Biliary Tumor Market Analysis, 2016-2021
- 7.2. APAC Biliary Tumor Market Opportunity and Forecast, 2023-2032
- 7.3. APAC Biliary Tumor Market Analysis, Opportunity and Forecast, By Treatment, 2016-2032
- 7.3.1. APAC Biliary Tumor Market Analysis by Treatment: Introduction
- 7.3.2. Market Size Absolute $ Opportunity Analysis and Forecast, By Treatment, 2016-2032
- 7.3.3. Chemotherapy
- 7.3.4. Immunotherapy
- 7.3.5. Targeted Therapy
- 7.3.6. Other
- 7.4. APAC Biliary Tumor Market Analysis, Opportunity and Forecast, By Route of Administration, 2016-2032
- 7.4.1. APAC Biliary Tumor Market Analysis by Route of Administration: Introduction
- 7.4.2. Market Size Absolute $ Opportunity Analysis and Forecast, By Route of Administration, 2016-2032
- 7.4.3. Oral
- 7.4.4. Parenteral
- 7.4.5. Other
- 7.5. APAC Biliary Tumor Market Analysis, Opportunity and Forecast, By Distribution Channel, 2016-2032
- 7.5.1. APAC Biliary Tumor Market Analysis by Distribution Channel: Introduction
- 7.5.2. Market Size Absolute $ Opportunity Analysis and Forecast, By Distribution Channel, 2016-2032
- 7.5.3. Online Channel
- 7.5.4. Offline Channel
- 7.6. APAC Biliary Tumor Market Analysis, Opportunity and Forecast, By End-User, 2016-2032
- 7.6.1. APAC Biliary Tumor Market Analysis by End-User: Introduction
- 7.6.2. Market Size Absolute $ Opportunity Analysis and Forecast, By End-User, 2016-2032
- 7.6.3. Hospital Pharmacy
- 7.6.4. Retail Pharmacy
- 7.6.5. Online Pharmacy
- 7.7. APAC Biliary Tumor Market Analysis, Opportunity and Forecast, By Country , 2016-2032
- 7.7.1. APAC Biliary Tumor Market Analysis by Country : Introduction
- 7.7.2. Market Size Absolute $ Opportunity Analysis and Forecast, Country , 2016-2032
- 7.7.2.1. China
- 7.7.2.2. Japan
- 7.7.2.3. South Korea
- 7.7.2.4. India
- 7.7.2.5. Australia & New Zeland
- 7.7.2.6. Indonesia
- 7.7.2.7. Malaysia
- 7.7.2.8. Philippines
- 7.7.2.9. Singapore
- 7.7.2.10. Thailand
- 7.7.2.11. Vietnam
- 7.7.2.12. Rest of APAC
- 8. Latin America Biliary Tumor Market Analysis, Opportunity and Forecast, 2016-2032
- 8.1. Latin America Biliary Tumor Market Analysis, 2016-2021
- 8.2. Latin America Biliary Tumor Market Opportunity and Forecast, 2023-2032
- 8.3. Latin America Biliary Tumor Market Analysis, Opportunity and Forecast, By Treatment, 2016-2032
- 8.3.1. Latin America Biliary Tumor Market Analysis by Treatment: Introduction
- 8.3.2. Market Size Absolute $ Opportunity Analysis and Forecast, By Treatment, 2016-2032
- 8.3.3. Chemotherapy
- 8.3.4. Immunotherapy
- 8.3.5. Targeted Therapy
- 8.3.6. Other
- 8.4. Latin America Biliary Tumor Market Analysis, Opportunity and Forecast, By Route of Administration, 2016-2032
- 8.4.1. Latin America Biliary Tumor Market Analysis by Route of Administration: Introduction
- 8.4.2. Market Size Absolute $ Opportunity Analysis and Forecast, By Route of Administration, 2016-2032
- 8.4.3. Oral
- 8.4.4. Parenteral
- 8.4.5. Other
- 8.5. Latin America Biliary Tumor Market Analysis, Opportunity and Forecast, By Distribution Channel, 2016-2032
- 8.5.1. Latin America Biliary Tumor Market Analysis by Distribution Channel: Introduction
- 8.5.2. Market Size Absolute $ Opportunity Analysis and Forecast, By Distribution Channel, 2016-2032
- 8.5.3. Online Channel
- 8.5.4. Offline Channel
- 8.6. Latin America Biliary Tumor Market Analysis, Opportunity and Forecast, By End-User, 2016-2032
- 8.6.1. Latin America Biliary Tumor Market Analysis by End-User: Introduction
- 8.6.2. Market Size Absolute $ Opportunity Analysis and Forecast, By End-User, 2016-2032
- 8.6.3. Hospital Pharmacy
- 8.6.4. Retail Pharmacy
- 8.6.5. Online Pharmacy
- 8.7. Latin America Biliary Tumor Market Analysis, Opportunity and Forecast, By Country , 2016-2032
- 8.7.1. Latin America Biliary Tumor Market Analysis by Country : Introduction
- 8.7.2. Market Size Absolute $ Opportunity Analysis and Forecast, Country , 2016-2032
- 8.7.2.1. Brazil
- 8.7.2.2. Colombia
- 8.7.2.3. Chile
- 8.7.2.4. Argentina
- 8.7.2.5. Costa Rica
- 8.7.2.6. Rest of Latin America
- 9. Middle East & Africa Biliary Tumor Market Analysis, Opportunity and Forecast, 2016-2032
- 9.1. Middle East & Africa Biliary Tumor Market Analysis, 2016-2021
- 9.2. Middle East & Africa Biliary Tumor Market Opportunity and Forecast, 2023-2032
- 9.3. Middle East & Africa Biliary Tumor Market Analysis, Opportunity and Forecast, By Treatment, 2016-2032
- 9.3.1. Middle East & Africa Biliary Tumor Market Analysis by Treatment: Introduction
- 9.3.2. Market Size Absolute $ Opportunity Analysis and Forecast, By Treatment, 2016-2032
- 9.3.3. Chemotherapy
- 9.3.4. Immunotherapy
- 9.3.5. Targeted Therapy
- 9.3.6. Other
- 9.4. Middle East & Africa Biliary Tumor Market Analysis, Opportunity and Forecast, By Route of Administration, 2016-2032
- 9.4.1. Middle East & Africa Biliary Tumor Market Analysis by Route of Administration: Introduction
- 9.4.2. Market Size Absolute $ Opportunity Analysis and Forecast, By Route of Administration, 2016-2032
- 9.4.3. Oral
- 9.4.4. Parenteral
- 9.4.5. Other
- 9.5. Middle East & Africa Biliary Tumor Market Analysis, Opportunity and Forecast, By Distribution Channel, 2016-2032
- 9.5.1. Middle East & Africa Biliary Tumor Market Analysis by Distribution Channel: Introduction
- 9.5.2. Market Size Absolute $ Opportunity Analysis and Forecast, By Distribution Channel, 2016-2032
- 9.5.3. Online Channel
- 9.5.4. Offline Channel
- 9.6. Middle East & Africa Biliary Tumor Market Analysis, Opportunity and Forecast, By End-User, 2016-2032
- 9.6.1. Middle East & Africa Biliary Tumor Market Analysis by End-User: Introduction
- 9.6.2. Market Size Absolute $ Opportunity Analysis and Forecast, By End-User, 2016-2032
- 9.6.3. Hospital Pharmacy
- 9.6.4. Retail Pharmacy
- 9.6.5. Online Pharmacy
- 9.7. Middle East & Africa Biliary Tumor Market Analysis, Opportunity and Forecast, By Country , 2016-2032
- 9.7.1. Middle East & Africa Biliary Tumor Market Analysis by Country : Introduction
- 9.7.2. Market Size Absolute $ Opportunity Analysis and Forecast, Country , 2016-2032
- 9.7.2.1. Algeria
- 9.7.2.2. Egypt
- 9.7.2.3. Israel
- 9.7.2.4. Kuwait
- 9.7.2.5. Nigeria
- 9.7.2.6. Saudi Arabia
- 9.7.2.7. South Africa
- 9.7.2.8. Turkey
- 9.7.2.9. The UAE
- 9.7.2.10. Rest of MEA
- 10. Global Biliary Tumor Market Analysis, Opportunity and Forecast, By Region , 2016-2032
- 10.1. Global Biliary Tumor Market Analysis by Region : Introduction
- 10.2. Market Size Absolute $ Opportunity Analysis and Forecast, By Region , 2016-2032
- 10.2.1. North America
- 10.2.2. Western Europe
- 10.2.3. Eastern Europe
- 10.2.4. APAC
- 10.2.5. Latin America
- 10.2.6. Middle East & Africa
- 11. Global Biliary Tumor Market Competitive Landscape, Market Share Analysis, and Company Profiles
- 11.1. Market Share Analysis
- 11.2. Company Profiles
- 11.3. Johnson & Johnson Private Limited (US)
- 11.3.1. Company Overview
- 11.3.2. Financial Highlights
- 11.3.3. Product Portfolio
- 11.3.4. SWOT Analysis
- 11.3.5. Key Strategies and Developments
- 11.4. Mylan N.V. (US)
- 11.4.1. Company Overview
- 11.4.2. Financial Highlights
- 11.4.3. Product Portfolio
- 11.4.4. SWOT Analysis
- 11.4.5. Key Strategies and Developments
- 11.5. Teva Pharmaceutical Industries Ltd.(Jerusalem)
- 11.5.1. Company Overview
- 11.5.2. Financial Highlights
- 11.5.3. Product Portfolio
- 11.5.4. SWOT Analysis
- 11.5.5. Key Strategies and Developments
- 11.6. Sanofi (France)
- 11.6.1. Company Overview
- 11.6.2. Financial Highlights
- 11.6.3. Product Portfolio
- 11.6.4. SWOT Analysis
- 11.6.5. Key Strategies and Developments
- 11.7. Pfizer Inc. (US)
- 11.7.1. Company Overview
- 11.7.2. Financial Highlights
- 11.7.3. Product Portfolio
- 11.7.4. SWOT Analysis
- 11.7.5. Key Strategies and Developments
- 11.8. GlaxoSmithKline plc (UK)
- 11.8.1. Company Overview
- 11.8.2. Financial Highlights
- 11.8.3. Product Portfolio
- 11.8.4. SWOT Analysis
- 11.8.5. Key Strategies and Developments
- 11.9. AbbVie Inc. (US)
- 11.9.1. Company Overview
- 11.9.2. Financial Highlights
- 11.9.3. Product Portfolio
- 11.9.4. SWOT Analysis
- 11.9.5. Key Strategies and Developments
- 11.10. Novartis AG (Switzerland)
- 11.10.1. Company Overview
- 11.10.2. Financial Highlights
- 11.10.3. Product Portfolio
- 11.10.4. SWOT Analysis
- 11.10.5. Key Strategies and Developments
- 11.11. Fresenius Kabi AG (Germany)
- 11.11.1. Company Overview
- 11.11.2. Financial Highlights
- 11.11.3. Product Portfolio
- 11.11.4. SWOT Analysis
- 11.11.5. Key Strategies and Developments
- 11.12. Eli Lilly and Company (US)
- 11.12.1. Company Overview
- 11.12.2. Financial Highlights
- 11.12.3. Product Portfolio
- 11.12.4. SWOT Analysis
- 11.12.5. Key Strategies and Developments
- 11.13.1. Company Overview
- 11.13.2. Financial Highlights
- 11.13.3. Product Portfolio
- 11.13.4. SWOT Analysis
- 11.13.5. Key Strategies and Developments
- 11.14. F. Hoffmann-La Roche Ltd. (Switzerland)
- 11.14.1. Company Overview
- 11.14.2. Financial Highlights
- 11.14.3. Product Portfolio
- 11.14.4. SWOT Analysis
- 11.14.5. Key Strategies and Developments
- 11.15. Kyowa Kirin Co., Ltd. (Japan)
- 11.15.1. Company Overview
- 11.15.2. Financial Highlights
- 11.15.3. Product Portfolio
- 11.15.4. SWOT Analysis
- 11.15.5. Key Strategies and Developments
- 11.16. Delcath Systems, Inc. (US)
- 11.16.1. Company Overview
- 11.16.2. Financial Highlights
- 11.16.3. Product Portfolio
- 11.16.4. SWOT Analysis
- 11.16.5. Key Strategies and Developments
- 11.17. Accord Healthcare (US)
- 11.17.1. Company Overview
- 11.17.2. Financial Highlights
- 11.17.3. Product Portfolio
- 11.17.4. SWOT Analysis
- 11.17.5. Key Strategies and Developments
- 11.18. CONMED Corporation (US)
- 11.18.1. Company Overview
- 11.18.2. Financial Highlights
- 11.18.3. Product Portfolio
- 11.18.4. SWOT Analysis
- 11.18.5. Key Strategies and Developments
- 11.19. Boston Scientific Corporation (US)
- 11.19.1. Company Overview
- 11.19.2. Financial Highlights
- 11.19.3. Product Portfolio
- 11.19.4. SWOT Analysis
- 11.19.5. Key Strategies and Developments
- 11.20. Bayer AG (Germany)
- 11.20.1. Company Overview
- 11.20.2. Financial Highlights
- 11.20.3. Product Portfolio
- 11.20.4. SWOT Analysis
- 11.20.5. Key Strategies and Developments
- 11.21. Bristol-Myers Squibb Company (US)
- 11.21.1. Company Overview
- 11.21.2. Financial Highlights
- 11.21.3. Product Portfolio
- 11.21.4. SWOT Analysis
- 11.21.5. Key Strategies and Developments
- 11.22. Merck & Co., Inc. (US)
- 11.22.1. Company Overview
- 11.22.2. Financial Highlights
- 11.22.3. Product Portfolio
- 11.22.4. SWOT Analysis
- 11.22.5. Key Strategies and Developments
- 12. Assumptions and Acronyms
- 13. Research Methodology
- 14. Contact
"
- List of Figures
- "
- Figure 1: Global Biliary Tumor Market Revenue (US$ Mn) Market Share by Treatment in 2022
- Figure 2: Global Biliary Tumor Market Market Attractiveness Analysis by Treatment, 2016-2032
- Figure 3: Global Biliary Tumor Market Revenue (US$ Mn) Market Share by Route of Administrationin 2022
- Figure 4: Global Biliary Tumor Market Market Attractiveness Analysis by Route of Administration, 2016-2032
- Figure 5: Global Biliary Tumor Market Revenue (US$ Mn) Market Share by Distribution Channelin 2022
- Figure 6: Global Biliary Tumor Market Market Attractiveness Analysis by Distribution Channel, 2016-2032
- Figure 7: Global Biliary Tumor Market Revenue (US$ Mn) Market Share by End-Userin 2022
- Figure 8: Global Biliary Tumor Market Market Attractiveness Analysis by End-User, 2016-2032
- Figure 9: Global Biliary Tumor Market Revenue (US$ Mn) Market Share by Region in 2022
- Figure 10: Global Biliary Tumor Market Market Attractiveness Analysis by Region, 2016-2032
- Figure 11: Global Biliary Tumor Market Market Revenue (US$ Mn) (2016-2032)
- Figure 12: Global Biliary Tumor Market Market Revenue (US$ Mn) Comparison by Region (2016-2032)
- Figure 13: Global Biliary Tumor Market Market Revenue (US$ Mn) Comparison by Treatment (2016-2032)
- Figure 14: Global Biliary Tumor Market Market Revenue (US$ Mn) Comparison by Route of Administration (2016-2032)
- Figure 15: Global Biliary Tumor Market Market Revenue (US$ Mn) Comparison by Distribution Channel (2016-2032)
- Figure 16: Global Biliary Tumor Market Market Revenue (US$ Mn) Comparison by End-User (2016-2032)
- Figure 17: Global Biliary Tumor Market Market Y-o-Y Growth Rate Comparison by Region (2016-2032)
- Figure 18: Global Biliary Tumor Market Market Y-o-Y Growth Rate Comparison by Treatment (2016-2032)
- Figure 19: Global Biliary Tumor Market Market Y-o-Y Growth Rate Comparison by Route of Administration (2016-2032)
- Figure 20: Global Biliary Tumor Market Market Y-o-Y Growth Rate Comparison by Distribution Channel (2016-2032)
- Figure 21: Global Biliary Tumor Market Market Y-o-Y Growth Rate Comparison by End-User (2016-2032)
- Figure 22: Global Biliary Tumor Market Market Share Comparison by Region (2016-2032)
- Figure 23: Global Biliary Tumor Market Market Share Comparison by Treatment (2016-2032)
- Figure 24: Global Biliary Tumor Market Market Share Comparison by Route of Administration (2016-2032)
- Figure 25: Global Biliary Tumor Market Market Share Comparison by Distribution Channel (2016-2032)
- Figure 26: Global Biliary Tumor Market Market Share Comparison by End-User (2016-2032)
- Figure 27: North America Biliary Tumor Market Revenue (US$ Mn) Market Share by Treatmentin 2022
- Figure 28: North America Biliary Tumor Market Market Attractiveness Analysis by Treatment, 2016-2032
- Figure 29: North America Biliary Tumor Market Revenue (US$ Mn) Market Share by Route of Administrationin 2022
- Figure 30: North America Biliary Tumor Market Market Attractiveness Analysis by Route of Administration, 2016-2032
- Figure 31: North America Biliary Tumor Market Revenue (US$ Mn) Market Share by Distribution Channelin 2022
- Figure 32: North America Biliary Tumor Market Market Attractiveness Analysis by Distribution Channel, 2016-2032
- Figure 33: North America Biliary Tumor Market Revenue (US$ Mn) Market Share by End-Userin 2022
- Figure 34: North America Biliary Tumor Market Market Attractiveness Analysis by End-User, 2016-2032
- Figure 35: North America Biliary Tumor Market Revenue (US$ Mn) Market Share by Country in 2022
- Figure 36: North America Biliary Tumor Market Market Attractiveness Analysis by Country, 2016-2032
- Figure 37: North America Biliary Tumor Market Market Revenue (US$ Mn) (2016-2032)
- Figure 38: North America Biliary Tumor Market Market Revenue (US$ Mn) Comparison by Country (2016-2032)
- Figure 39: North America Biliary Tumor Market Market Revenue (US$ Mn) Comparison by Treatment (2016-2032)
- Figure 40: North America Biliary Tumor Market Market Revenue (US$ Mn) Comparison by Route of Administration (2016-2032)
- Figure 41: North America Biliary Tumor Market Market Revenue (US$ Mn) Comparison by Distribution Channel (2016-2032)
- Figure 42: North America Biliary Tumor Market Market Revenue (US$ Mn) Comparison by End-User (2016-2032)
- Figure 43: North America Biliary Tumor Market Market Y-o-Y Growth Rate Comparison by Country (2016-2032)
- Figure 44: North America Biliary Tumor Market Market Y-o-Y Growth Rate Comparison by Treatment (2016-2032)
- Figure 45: North America Biliary Tumor Market Market Y-o-Y Growth Rate Comparison by Route of Administration (2016-2032)
- Figure 46: North America Biliary Tumor Market Market Y-o-Y Growth Rate Comparison by Distribution Channel (2016-2032)
- Figure 47: North America Biliary Tumor Market Market Y-o-Y Growth Rate Comparison by End-User (2016-2032)
- Figure 48: North America Biliary Tumor Market Market Share Comparison by Country (2016-2032)
- Figure 49: North America Biliary Tumor Market Market Share Comparison by Treatment (2016-2032)
- Figure 50: North America Biliary Tumor Market Market Share Comparison by Route of Administration (2016-2032)
- Figure 51: North America Biliary Tumor Market Market Share Comparison by Distribution Channel (2016-2032)
- Figure 52: North America Biliary Tumor Market Market Share Comparison by End-User (2016-2032)
- Figure 53: Western Europe Biliary Tumor Market Revenue (US$ Mn) Market Share by Treatmentin 2022
- Figure 54: Western Europe Biliary Tumor Market Market Attractiveness Analysis by Treatment, 2016-2032
- Figure 55: Western Europe Biliary Tumor Market Revenue (US$ Mn) Market Share by Route of Administrationin 2022
- Figure 56: Western Europe Biliary Tumor Market Market Attractiveness Analysis by Route of Administration, 2016-2032
- Figure 57: Western Europe Biliary Tumor Market Revenue (US$ Mn) Market Share by Distribution Channelin 2022
- Figure 58: Western Europe Biliary Tumor Market Market Attractiveness Analysis by Distribution Channel, 2016-2032
- Figure 59: Western Europe Biliary Tumor Market Revenue (US$ Mn) Market Share by End-Userin 2022
- Figure 60: Western Europe Biliary Tumor Market Market Attractiveness Analysis by End-User, 2016-2032
- Figure 61: Western Europe Biliary Tumor Market Revenue (US$ Mn) Market Share by Country in 2022
- Figure 62: Western Europe Biliary Tumor Market Market Attractiveness Analysis by Country, 2016-2032
- Figure 63: Western Europe Biliary Tumor Market Market Revenue (US$ Mn) (2016-2032)
- Figure 64: Western Europe Biliary Tumor Market Market Revenue (US$ Mn) Comparison by Country (2016-2032)
- Figure 65: Western Europe Biliary Tumor Market Market Revenue (US$ Mn) Comparison by Treatment (2016-2032)
- Figure 66: Western Europe Biliary Tumor Market Market Revenue (US$ Mn) Comparison by Route of Administration (2016-2032)
- Figure 67: Western Europe Biliary Tumor Market Market Revenue (US$ Mn) Comparison by Distribution Channel (2016-2032)
- Figure 68: Western Europe Biliary Tumor Market Market Revenue (US$ Mn) Comparison by End-User (2016-2032)
- Figure 69: Western Europe Biliary Tumor Market Market Y-o-Y Growth Rate Comparison by Country (2016-2032)
- Figure 70: Western Europe Biliary Tumor Market Market Y-o-Y Growth Rate Comparison by Treatment (2016-2032)
- Figure 71: Western Europe Biliary Tumor Market Market Y-o-Y Growth Rate Comparison by Route of Administration (2016-2032)
- Figure 72: Western Europe Biliary Tumor Market Market Y-o-Y Growth Rate Comparison by Distribution Channel (2016-2032)
- Figure 73: Western Europe Biliary Tumor Market Market Y-o-Y Growth Rate Comparison by End-User (2016-2032)
- Figure 74: Western Europe Biliary Tumor Market Market Share Comparison by Country (2016-2032)
- Figure 75: Western Europe Biliary Tumor Market Market Share Comparison by Treatment (2016-2032)
- Figure 76: Western Europe Biliary Tumor Market Market Share Comparison by Route of Administration (2016-2032)
- Figure 77: Western Europe Biliary Tumor Market Market Share Comparison by Distribution Channel (2016-2032)
- Figure 78: Western Europe Biliary Tumor Market Market Share Comparison by End-User (2016-2032)
- Figure 79: Eastern Europe Biliary Tumor Market Revenue (US$ Mn) Market Share by Treatmentin 2022
- Figure 80: Eastern Europe Biliary Tumor Market Market Attractiveness Analysis by Treatment, 2016-2032
- Figure 81: Eastern Europe Biliary Tumor Market Revenue (US$ Mn) Market Share by Route of Administrationin 2022
- Figure 82: Eastern Europe Biliary Tumor Market Market Attractiveness Analysis by Route of Administration, 2016-2032
- Figure 83: Eastern Europe Biliary Tumor Market Revenue (US$ Mn) Market Share by Distribution Channelin 2022
- Figure 84: Eastern Europe Biliary Tumor Market Market Attractiveness Analysis by Distribution Channel, 2016-2032
- Figure 85: Eastern Europe Biliary Tumor Market Revenue (US$ Mn) Market Share by End-Userin 2022
- Figure 86: Eastern Europe Biliary Tumor Market Market Attractiveness Analysis by End-User, 2016-2032
- Figure 87: Eastern Europe Biliary Tumor Market Revenue (US$ Mn) Market Share by Country in 2022
- Figure 88: Eastern Europe Biliary Tumor Market Market Attractiveness Analysis by Country, 2016-2032
- Figure 89: Eastern Europe Biliary Tumor Market Market Revenue (US$ Mn) (2016-2032)
- Figure 90: Eastern Europe Biliary Tumor Market Market Revenue (US$ Mn) Comparison by Country (2016-2032)
- Figure 91: Eastern Europe Biliary Tumor Market Market Revenue (US$ Mn) Comparison by Treatment (2016-2032)
- Figure 92: Eastern Europe Biliary Tumor Market Market Revenue (US$ Mn) Comparison by Route of Administration (2016-2032)
- Figure 93: Eastern Europe Biliary Tumor Market Market Revenue (US$ Mn) Comparison by Distribution Channel (2016-2032)
- Figure 94: Eastern Europe Biliary Tumor Market Market Revenue (US$ Mn) Comparison by End-User (2016-2032)
- Figure 95: Eastern Europe Biliary Tumor Market Market Y-o-Y Growth Rate Comparison by Country (2016-2032)
- Figure 96: Eastern Europe Biliary Tumor Market Market Y-o-Y Growth Rate Comparison by Treatment (2016-2032)
- Figure 97: Eastern Europe Biliary Tumor Market Market Y-o-Y Growth Rate Comparison by Route of Administration (2016-2032)
- Figure 98: Eastern Europe Biliary Tumor Market Market Y-o-Y Growth Rate Comparison by Distribution Channel (2016-2032)
- Figure 99: Eastern Europe Biliary Tumor Market Market Y-o-Y Growth Rate Comparison by End-User (2016-2032)
- Figure 100: Eastern Europe Biliary Tumor Market Market Share Comparison by Country (2016-2032)
- Figure 101: Eastern Europe Biliary Tumor Market Market Share Comparison by Treatment (2016-2032)
- Figure 102: Eastern Europe Biliary Tumor Market Market Share Comparison by Route of Administration (2016-2032)
- Figure 103: Eastern Europe Biliary Tumor Market Market Share Comparison by Distribution Channel (2016-2032)
- Figure 104: Eastern Europe Biliary Tumor Market Market Share Comparison by End-User (2016-2032)
- Figure 105: APAC Biliary Tumor Market Revenue (US$ Mn) Market Share by Treatmentin 2022
- Figure 106: APAC Biliary Tumor Market Market Attractiveness Analysis by Treatment, 2016-2032
- Figure 107: APAC Biliary Tumor Market Revenue (US$ Mn) Market Share by Route of Administrationin 2022
- Figure 108: APAC Biliary Tumor Market Market Attractiveness Analysis by Route of Administration, 2016-2032
- Figure 109: APAC Biliary Tumor Market Revenue (US$ Mn) Market Share by Distribution Channelin 2022
- Figure 110: APAC Biliary Tumor Market Market Attractiveness Analysis by Distribution Channel, 2016-2032
- Figure 111: APAC Biliary Tumor Market Revenue (US$ Mn) Market Share by End-Userin 2022
- Figure 112: APAC Biliary Tumor Market Market Attractiveness Analysis by End-User, 2016-2032
- Figure 113: APAC Biliary Tumor Market Revenue (US$ Mn) Market Share by Country in 2022
- Figure 114: APAC Biliary Tumor Market Market Attractiveness Analysis by Country, 2016-2032
- Figure 115: APAC Biliary Tumor Market Market Revenue (US$ Mn) (2016-2032)
- Figure 116: APAC Biliary Tumor Market Market Revenue (US$ Mn) Comparison by Country (2016-2032)
- Figure 117: APAC Biliary Tumor Market Market Revenue (US$ Mn) Comparison by Treatment (2016-2032)
- Figure 118: APAC Biliary Tumor Market Market Revenue (US$ Mn) Comparison by Route of Administration (2016-2032)
- Figure 119: APAC Biliary Tumor Market Market Revenue (US$ Mn) Comparison by Distribution Channel (2016-2032)
- Figure 120: APAC Biliary Tumor Market Market Revenue (US$ Mn) Comparison by End-User (2016-2032)
- Figure 121: APAC Biliary Tumor Market Market Y-o-Y Growth Rate Comparison by Country (2016-2032)
- Figure 122: APAC Biliary Tumor Market Market Y-o-Y Growth Rate Comparison by Treatment (2016-2032)
- Figure 123: APAC Biliary Tumor Market Market Y-o-Y Growth Rate Comparison by Route of Administration (2016-2032)
- Figure 124: APAC Biliary Tumor Market Market Y-o-Y Growth Rate Comparison by Distribution Channel (2016-2032)
- Figure 125: APAC Biliary Tumor Market Market Y-o-Y Growth Rate Comparison by End-User (2016-2032)
- Figure 126: APAC Biliary Tumor Market Market Share Comparison by Country (2016-2032)
- Figure 127: APAC Biliary Tumor Market Market Share Comparison by Treatment (2016-2032)
- Figure 128: APAC Biliary Tumor Market Market Share Comparison by Route of Administration (2016-2032)
- Figure 129: APAC Biliary Tumor Market Market Share Comparison by Distribution Channel (2016-2032)
- Figure 130: APAC Biliary Tumor Market Market Share Comparison by End-User (2016-2032)
- Figure 131: Latin America Biliary Tumor Market Revenue (US$ Mn) Market Share by Treatmentin 2022
- Figure 132: Latin America Biliary Tumor Market Market Attractiveness Analysis by Treatment, 2016-2032
- Figure 133: Latin America Biliary Tumor Market Revenue (US$ Mn) Market Share by Route of Administrationin 2022
- Figure 134: Latin America Biliary Tumor Market Market Attractiveness Analysis by Route of Administration, 2016-2032
- Figure 135: Latin America Biliary Tumor Market Revenue (US$ Mn) Market Share by Distribution Channelin 2022
- Figure 136: Latin America Biliary Tumor Market Market Attractiveness Analysis by Distribution Channel, 2016-2032
- Figure 137: Latin America Biliary Tumor Market Revenue (US$ Mn) Market Share by End-Userin 2022
- Figure 138: Latin America Biliary Tumor Market Market Attractiveness Analysis by End-User, 2016-2032
- Figure 139: Latin America Biliary Tumor Market Revenue (US$ Mn) Market Share by Country in 2022
- Figure 140: Latin America Biliary Tumor Market Market Attractiveness Analysis by Country, 2016-2032
- Figure 141: Latin America Biliary Tumor Market Market Revenue (US$ Mn) (2016-2032)
- Figure 142: Latin America Biliary Tumor Market Market Revenue (US$ Mn) Comparison by Country (2016-2032)
- Figure 143: Latin America Biliary Tumor Market Market Revenue (US$ Mn) Comparison by Treatment (2016-2032)
- Figure 144: Latin America Biliary Tumor Market Market Revenue (US$ Mn) Comparison by Route of Administration (2016-2032)
- Figure 145: Latin America Biliary Tumor Market Market Revenue (US$ Mn) Comparison by Distribution Channel (2016-2032)
- Figure 146: Latin America Biliary Tumor Market Market Revenue (US$ Mn) Comparison by End-User (2016-2032)
- Figure 147: Latin America Biliary Tumor Market Market Y-o-Y Growth Rate Comparison by Country (2016-2032)
- Figure 148: Latin America Biliary Tumor Market Market Y-o-Y Growth Rate Comparison by Treatment (2016-2032)
- Figure 149: Latin America Biliary Tumor Market Market Y-o-Y Growth Rate Comparison by Route of Administration (2016-2032)
- Figure 150: Latin America Biliary Tumor Market Market Y-o-Y Growth Rate Comparison by Distribution Channel (2016-2032)
- Figure 151: Latin America Biliary Tumor Market Market Y-o-Y Growth Rate Comparison by End-User (2016-2032)
- Figure 152: Latin America Biliary Tumor Market Market Share Comparison by Country (2016-2032)
- Figure 153: Latin America Biliary Tumor Market Market Share Comparison by Treatment (2016-2032)
- Figure 154: Latin America Biliary Tumor Market Market Share Comparison by Route of Administration (2016-2032)
- Figure 155: Latin America Biliary Tumor Market Market Share Comparison by Distribution Channel (2016-2032)
- Figure 156: Latin America Biliary Tumor Market Market Share Comparison by End-User (2016-2032)
- Figure 157: Middle East & Africa Biliary Tumor Market Revenue (US$ Mn) Market Share by Treatmentin 2022
- Figure 158: Middle East & Africa Biliary Tumor Market Market Attractiveness Analysis by Treatment, 2016-2032
- Figure 159: Middle East & Africa Biliary Tumor Market Revenue (US$ Mn) Market Share by Route of Administrationin 2022
- Figure 160: Middle East & Africa Biliary Tumor Market Market Attractiveness Analysis by Route of Administration, 2016-2032
- Figure 161: Middle East & Africa Biliary Tumor Market Revenue (US$ Mn) Market Share by Distribution Channelin 2022
- Figure 162: Middle East & Africa Biliary Tumor Market Market Attractiveness Analysis by Distribution Channel, 2016-2032
- Figure 163: Middle East & Africa Biliary Tumor Market Revenue (US$ Mn) Market Share by End-Userin 2022
- Figure 164: Middle East & Africa Biliary Tumor Market Market Attractiveness Analysis by End-User, 2016-2032
- Figure 165: Middle East & Africa Biliary Tumor Market Revenue (US$ Mn) Market Share by Country in 2022
- Figure 166: Middle East & Africa Biliary Tumor Market Market Attractiveness Analysis by Country, 2016-2032
- Figure 167: Middle East & Africa Biliary Tumor Market Market Revenue (US$ Mn) (2016-2032)
- Figure 168: Middle East & Africa Biliary Tumor Market Market Revenue (US$ Mn) Comparison by Country (2016-2032)
- Figure 169: Middle East & Africa Biliary Tumor Market Market Revenue (US$ Mn) Comparison by Treatment (2016-2032)
- Figure 170: Middle East & Africa Biliary Tumor Market Market Revenue (US$ Mn) Comparison by Route of Administration (2016-2032)
- Figure 171: Middle East & Africa Biliary Tumor Market Market Revenue (US$ Mn) Comparison by Distribution Channel (2016-2032)
- Figure 172: Middle East & Africa Biliary Tumor Market Market Revenue (US$ Mn) Comparison by End-User (2016-2032)
- Figure 173: Middle East & Africa Biliary Tumor Market Market Y-o-Y Growth Rate Comparison by Country (2016-2032)
- Figure 174: Middle East & Africa Biliary Tumor Market Market Y-o-Y Growth Rate Comparison by Treatment (2016-2032)
- Figure 175: Middle East & Africa Biliary Tumor Market Market Y-o-Y Growth Rate Comparison by Route of Administration (2016-2032)
- Figure 176: Middle East & Africa Biliary Tumor Market Market Y-o-Y Growth Rate Comparison by Distribution Channel (2016-2032)
- Figure 177: Middle East & Africa Biliary Tumor Market Market Y-o-Y Growth Rate Comparison by End-User (2016-2032)
- Figure 178: Middle East & Africa Biliary Tumor Market Market Share Comparison by Country (2016-2032)
- Figure 179: Middle East & Africa Biliary Tumor Market Market Share Comparison by Treatment (2016-2032)
- Figure 180: Middle East & Africa Biliary Tumor Market Market Share Comparison by Route of Administration (2016-2032)
- Figure 181: Middle East & Africa Biliary Tumor Market Market Share Comparison by Distribution Channel (2016-2032)
- Figure 182: Middle East & Africa Biliary Tumor Market Market Share Comparison by End-User (2016-2032)
"
- List of Tables
- "
- Table 1: Global Biliary Tumor Market Market Comparison by Treatment (2016-2032)
- Table 2: Global Biliary Tumor Market Market Comparison by Route of Administration (2016-2032)
- Table 3: Global Biliary Tumor Market Market Comparison by Distribution Channel (2016-2032)
- Table 4: Global Biliary Tumor Market Market Comparison by End-User (2016-2032)
- Table 5: Global Biliary Tumor Market Revenue (US$ Mn) Comparison by Region (2016-2032)
- Table 6: Global Biliary Tumor Market Market Revenue (US$ Mn) (2016-2032)
- Table 7: Global Biliary Tumor Market Market Revenue (US$ Mn) Comparison by Region (2016-2032)
- Table 8: Global Biliary Tumor Market Market Revenue (US$ Mn) Comparison by Treatment (2016-2032)
- Table 9: Global Biliary Tumor Market Market Revenue (US$ Mn) Comparison by Route of Administration (2016-2032)
- Table 10: Global Biliary Tumor Market Market Revenue (US$ Mn) Comparison by Distribution Channel (2016-2032)
- Table 11: Global Biliary Tumor Market Market Revenue (US$ Mn) Comparison by End-User (2016-2032)
- Table 12: Global Biliary Tumor Market Market Y-o-Y Growth Rate Comparison by Region (2016-2032)
- Table 13: Global Biliary Tumor Market Market Y-o-Y Growth Rate Comparison by Treatment (2016-2032)
- Table 14: Global Biliary Tumor Market Market Y-o-Y Growth Rate Comparison by Route of Administration (2016-2032)
- Table 15: Global Biliary Tumor Market Market Y-o-Y Growth Rate Comparison by Distribution Channel (2016-2032)
- Table 16: Global Biliary Tumor Market Market Y-o-Y Growth Rate Comparison by End-User (2016-2032)
- Table 17: Global Biliary Tumor Market Market Share Comparison by Region (2016-2032)
- Table 18: Global Biliary Tumor Market Market Share Comparison by Treatment (2016-2032)
- Table 19: Global Biliary Tumor Market Market Share Comparison by Route of Administration (2016-2032)
- Table 20: Global Biliary Tumor Market Market Share Comparison by Distribution Channel (2016-2032)
- Table 21: Global Biliary Tumor Market Market Share Comparison by End-User (2016-2032)
- Table 22: North America Biliary Tumor Market Market Comparison by Route of Administration (2016-2032)
- Table 23: North America Biliary Tumor Market Market Comparison by Distribution Channel (2016-2032)
- Table 24: North America Biliary Tumor Market Market Comparison by End-User (2016-2032)
- Table 25: North America Biliary Tumor Market Revenue (US$ Mn) Comparison by Country (2016-2032)
- Table 26: North America Biliary Tumor Market Market Revenue (US$ Mn) (2016-2032)
- Table 27: North America Biliary Tumor Market Market Revenue (US$ Mn) Comparison by Country (2016-2032)
- Table 28: North America Biliary Tumor Market Market Revenue (US$ Mn) Comparison by Treatment (2016-2032)
- Table 29: North America Biliary Tumor Market Market Revenue (US$ Mn) Comparison by Route of Administration (2016-2032)
- Table 30: North America Biliary Tumor Market Market Revenue (US$ Mn) Comparison by Distribution Channel (2016-2032)
- Table 31: North America Biliary Tumor Market Market Revenue (US$ Mn) Comparison by End-User (2016-2032)
- Table 32: North America Biliary Tumor Market Market Y-o-Y Growth Rate Comparison by Country (2016-2032)
- Table 33: North America Biliary Tumor Market Market Y-o-Y Growth Rate Comparison by Treatment (2016-2032)
- Table 34: North America Biliary Tumor Market Market Y-o-Y Growth Rate Comparison by Route of Administration (2016-2032)
- Table 35: North America Biliary Tumor Market Market Y-o-Y Growth Rate Comparison by Distribution Channel (2016-2032)
- Table 36: North America Biliary Tumor Market Market Y-o-Y Growth Rate Comparison by End-User (2016-2032)
- Table 37: North America Biliary Tumor Market Market Share Comparison by Country (2016-2032)
- Table 38: North America Biliary Tumor Market Market Share Comparison by Treatment (2016-2032)
- Table 39: North America Biliary Tumor Market Market Share Comparison by Route of Administration (2016-2032)
- Table 40: North America Biliary Tumor Market Market Share Comparison by Distribution Channel (2016-2032)
- Table 41: North America Biliary Tumor Market Market Share Comparison by End-User (2016-2032)
- Table 42: Western Europe Biliary Tumor Market Market Comparison by Treatment (2016-2032)
- Table 43: Western Europe Biliary Tumor Market Market Comparison by Route of Administration (2016-2032)
- Table 44: Western Europe Biliary Tumor Market Market Comparison by Distribution Channel (2016-2032)
- Table 45: Western Europe Biliary Tumor Market Market Comparison by End-User (2016-2032)
- Table 46: Western Europe Biliary Tumor Market Revenue (US$ Mn) Comparison by Country (2016-2032)
- Table 47: Western Europe Biliary Tumor Market Market Revenue (US$ Mn) (2016-2032)
- Table 48: Western Europe Biliary Tumor Market Market Revenue (US$ Mn) Comparison by Country (2016-2032)
- Table 49: Western Europe Biliary Tumor Market Market Revenue (US$ Mn) Comparison by Treatment (2016-2032)
- Table 50: Western Europe Biliary Tumor Market Market Revenue (US$ Mn) Comparison by Route of Administration (2016-2032)
- Table 51: Western Europe Biliary Tumor Market Market Revenue (US$ Mn) Comparison by Distribution Channel (2016-2032)
- Table 52: Western Europe Biliary Tumor Market Market Revenue (US$ Mn) Comparison by End-User (2016-2032)
- Table 53: Western Europe Biliary Tumor Market Market Y-o-Y Growth Rate Comparison by Country (2016-2032)
- Table 54: Western Europe Biliary Tumor Market Market Y-o-Y Growth Rate Comparison by Treatment (2016-2032)
- Table 55: Western Europe Biliary Tumor Market Market Y-o-Y Growth Rate Comparison by Route of Administration (2016-2032)
- Table 56: Western Europe Biliary Tumor Market Market Y-o-Y Growth Rate Comparison by Distribution Channel (2016-2032)
- Table 57: Western Europe Biliary Tumor Market Market Y-o-Y Growth Rate Comparison by End-User (2016-2032)
- Table 58: Western Europe Biliary Tumor Market Market Share Comparison by Country (2016-2032)
- Table 59: Western Europe Biliary Tumor Market Market Share Comparison by Treatment (2016-2032)
- Table 60: Western Europe Biliary Tumor Market Market Share Comparison by Route of Administration (2016-2032)
- Table 61: Western Europe Biliary Tumor Market Market Share Comparison by Distribution Channel (2016-2032)
- Table 62: Western Europe Biliary Tumor Market Market Share Comparison by End-User (2016-2032)
- Table 63: Eastern Europe Biliary Tumor Market Market Comparison by Treatment (2016-2032)
- Table 64: Eastern Europe Biliary Tumor Market Market Comparison by Route of Administration (2016-2032)
- Table 65: Eastern Europe Biliary Tumor Market Market Comparison by Distribution Channel (2016-2032)
- Table 66: Eastern Europe Biliary Tumor Market Market Comparison by End-User (2016-2032)
- Table 67: Eastern Europe Biliary Tumor Market Revenue (US$ Mn) Comparison by Country (2016-2032)
- Table 68: Eastern Europe Biliary Tumor Market Market Revenue (US$ Mn) (2016-2032)
- Table 69: Eastern Europe Biliary Tumor Market Market Revenue (US$ Mn) Comparison by Country (2016-2032)
- Table 70: Eastern Europe Biliary Tumor Market Market Revenue (US$ Mn) Comparison by Treatment (2016-2032)
- Table 71: Eastern Europe Biliary Tumor Market Market Revenue (US$ Mn) Comparison by Route of Administration (2016-2032)
- Table 72: Eastern Europe Biliary Tumor Market Market Revenue (US$ Mn) Comparison by Distribution Channel (2016-2032)
- Table 73: Eastern Europe Biliary Tumor Market Market Revenue (US$ Mn) Comparison by End-User (2016-2032)
- Table 74: Eastern Europe Biliary Tumor Market Market Y-o-Y Growth Rate Comparison by Country (2016-2032)
- Table 75: Eastern Europe Biliary Tumor Market Market Y-o-Y Growth Rate Comparison by Treatment (2016-2032)
- Table 76: Eastern Europe Biliary Tumor Market Market Y-o-Y Growth Rate Comparison by Route of Administration (2016-2032)
- Table 77: Eastern Europe Biliary Tumor Market Market Y-o-Y Growth Rate Comparison by Distribution Channel (2016-2032)
- Table 78: Eastern Europe Biliary Tumor Market Market Y-o-Y Growth Rate Comparison by End-User (2016-2032)
- Table 79: Eastern Europe Biliary Tumor Market Market Share Comparison by Country (2016-2032)
- Table 80: Eastern Europe Biliary Tumor Market Market Share Comparison by Treatment (2016-2032)
- Table 81: Eastern Europe Biliary Tumor Market Market Share Comparison by Route of Administration (2016-2032)
- Table 82: Eastern Europe Biliary Tumor Market Market Share Comparison by Distribution Channel (2016-2032)
- Table 83: Eastern Europe Biliary Tumor Market Market Share Comparison by End-User (2016-2032)
- Table 84: APAC Biliary Tumor Market Market Comparison by Treatment (2016-2032)
- Table 85: APAC Biliary Tumor Market Market Comparison by Route of Administration (2016-2032)
- Table 86: APAC Biliary Tumor Market Market Comparison by Distribution Channel (2016-2032)
- Table 87: APAC Biliary Tumor Market Market Comparison by End-User (2016-2032)
- Table 88: APAC Biliary Tumor Market Revenue (US$ Mn) Comparison by Country (2016-2032)
- Table 89: APAC Biliary Tumor Market Market Revenue (US$ Mn) (2016-2032)
- Table 90: APAC Biliary Tumor Market Market Revenue (US$ Mn) Comparison by Country (2016-2032)
- Table 91: APAC Biliary Tumor Market Market Revenue (US$ Mn) Comparison by Treatment (2016-2032)
- Table 92: APAC Biliary Tumor Market Market Revenue (US$ Mn) Comparison by Route of Administration (2016-2032)
- Table 93: APAC Biliary Tumor Market Market Revenue (US$ Mn) Comparison by Distribution Channel (2016-2032)
- Table 94: APAC Biliary Tumor Market Market Revenue (US$ Mn) Comparison by End-User (2016-2032)
- Table 95: APAC Biliary Tumor Market Market Y-o-Y Growth Rate Comparison by Country (2016-2032)
- Table 96: APAC Biliary Tumor Market Market Y-o-Y Growth Rate Comparison by Treatment (2016-2032)
- Table 97: APAC Biliary Tumor Market Market Y-o-Y Growth Rate Comparison by Route of Administration (2016-2032)
- Table 98: APAC Biliary Tumor Market Market Y-o-Y Growth Rate Comparison by Distribution Channel (2016-2032)
- Table 99: APAC Biliary Tumor Market Market Y-o-Y Growth Rate Comparison by End-User (2016-2032)
- Table 100: APAC Biliary Tumor Market Market Share Comparison by Country (2016-2032)
- Table 101: APAC Biliary Tumor Market Market Share Comparison by Treatment (2016-2032)
- Table 102: APAC Biliary Tumor Market Market Share Comparison by Route of Administration (2016-2032)
- Table 103: APAC Biliary Tumor Market Market Share Comparison by Distribution Channel (2016-2032)
- Table 104: APAC Biliary Tumor Market Market Share Comparison by End-User (2016-2032)
- Table 105: Latin America Biliary Tumor Market Market Comparison by Treatment (2016-2032)
- Table 106: Latin America Biliary Tumor Market Market Comparison by Route of Administration (2016-2032)
- Table 107: Latin America Biliary Tumor Market Market Comparison by Distribution Channel (2016-2032)
- Table 108: Latin America Biliary Tumor Market Market Comparison by End-User (2016-2032)
- Table 109: Latin America Biliary Tumor Market Revenue (US$ Mn) Comparison by Country (2016-2032)
- Table 110: Latin America Biliary Tumor Market Market Revenue (US$ Mn) (2016-2032)
- Table 111: Latin America Biliary Tumor Market Market Revenue (US$ Mn) Comparison by Country (2016-2032)
- Table 112: Latin America Biliary Tumor Market Market Revenue (US$ Mn) Comparison by Treatment (2016-2032)
- Table 113: Latin America Biliary Tumor Market Market Revenue (US$ Mn) Comparison by Route of Administration (2016-2032)
- Table 114: Latin America Biliary Tumor Market Market Revenue (US$ Mn) Comparison by Distribution Channel (2016-2032)
- Table 115: Latin America Biliary Tumor Market Market Revenue (US$ Mn) Comparison by End-User (2016-2032)
- Table 116: Latin America Biliary Tumor Market Market Y-o-Y Growth Rate Comparison by Country (2016-2032)
- Table 117: Latin America Biliary Tumor Market Market Y-o-Y Growth Rate Comparison by Treatment (2016-2032)
- Table 118: Latin America Biliary Tumor Market Market Y-o-Y Growth Rate Comparison by Route of Administration (2016-2032)
- Table 119: Latin America Biliary Tumor Market Market Y-o-Y Growth Rate Comparison by Distribution Channel (2016-2032)
- Table 120: Latin America Biliary Tumor Market Market Y-o-Y Growth Rate Comparison by End-User (2016-2032)
- Table 121: Latin America Biliary Tumor Market Market Share Comparison by Country (2016-2032)
- Table 122: Latin America Biliary Tumor Market Market Share Comparison by Treatment (2016-2032)
- Table 123: Latin America Biliary Tumor Market Market Share Comparison by Route of Administration (2016-2032)
- Table 124: Latin America Biliary Tumor Market Market Share Comparison by Distribution Channel (2016-2032)
- Table 125: Latin America Biliary Tumor Market Market Share Comparison by End-User (2016-2032)
- Table 126: Middle East & Africa Biliary Tumor Market Market Comparison by Treatment (2016-2032)
- Table 127: Middle East & Africa Biliary Tumor Market Market Comparison by Route of Administration (2016-2032)
- Table 128: Middle East & Africa Biliary Tumor Market Market Comparison by Distribution Channel (2016-2032)
- Table 129: Middle East & Africa Biliary Tumor Market Market Comparison by End-User (2016-2032)
- Table 130: Middle East & Africa Biliary Tumor Market Revenue (US$ Mn) Comparison by Country (2016-2032)
- Table 131: Middle East & Africa Biliary Tumor Market Market Revenue (US$ Mn) (2016-2032)
- Table 132: Middle East & Africa Biliary Tumor Market Market Revenue (US$ Mn) Comparison by Country (2016-2032)
- Table 133: Middle East & Africa Biliary Tumor Market Market Revenue (US$ Mn) Comparison by Treatment (2016-2032)
- Table 134: Middle East & Africa Biliary Tumor Market Market Revenue (US$ Mn) Comparison by Route of Administration (2016-2032)
- Table 135: Middle East & Africa Biliary Tumor Market Market Revenue (US$ Mn) Comparison by Distribution Channel (2016-2032)
- Table 136: Middle East & Africa Biliary Tumor Market Market Revenue (US$ Mn) Comparison by End-User (2016-2032)
- Table 137: Middle East & Africa Biliary Tumor Market Market Y-o-Y Growth Rate Comparison by Country (2016-2032)
- Table 138: Middle East & Africa Biliary Tumor Market Market Y-o-Y Growth Rate Comparison by Treatment (2016-2032)
- Table 139: Middle East & Africa Biliary Tumor Market Market Y-o-Y Growth Rate Comparison by Route of Administration (2016-2032)
- Table 140: Middle East & Africa Biliary Tumor Market Market Y-o-Y Growth Rate Comparison by Distribution Channel (2016-2032)
- Table 141: Middle East & Africa Biliary Tumor Market Market Y-o-Y Growth Rate Comparison by End-User (2016-2032)
- Table 142: Middle East & Africa Biliary Tumor Market Market Share Comparison by Country (2016-2032)
- Table 143: Middle East & Africa Biliary Tumor Market Market Share Comparison by Treatment (2016-2032)
- Table 144: Middle East & Africa Biliary Tumor Market Market Share Comparison by Route of Administration (2016-2032)
- Table 145: Middle East & Africa Biliary Tumor Market Market Share Comparison by Distribution Channel (2016-2032)
- Table 146: Middle East & Africa Biliary Tumor Market Market Share Comparison by End-User (2016-2032)
- 1. Executive Summary
-
- Johnson & Johnson Private Limited (US)
- Mylan N.V. (US)
- Teva Pharmaceutical Industries Ltd.(Jerusalem)
- Sanofi (France)
- Pfizer Inc. (US)
- GlaxoSmithKline plc (UK)
- AbbVie Inc. (US)
- Novartis AG (Switzerland)
- Fresenius Kabi AG (Germany)
- Eli Lilly and Company (US)
- F. Hoffmann-La Roche Ltd. (Switzerland)
- Intercept Pharmaceuticals (US)
- Kyowa Kirin Co., Ltd. (Japan)
- Delcath Systems, Inc. (US)
- Accord Healthcare (US)
- CONMED Corporation (US)
- Boston Scientific Corporation (US)
- Bayer AG (Germany)
- Bristol-Myers Squibb Company (US)
- Merck & Co., Inc. (US)
Our Clients


View Our Licence Options
